texas quarterly commercial report - texas a&m …...(saar) during the third quarter, resulting...
TRANSCRIPT
Dr. Luis B. TorresResearch Economist
Dr. Harold D. HuntResearch Economist
Dr. James P. GainesChief Economist
Clare LoseyResearch Intern
Texas QuarterlyCommercial Report
Texas QuarterlyCommercial Report
Trenton ForbesResearch Intern
Technical Report2211
FOURTH QUARTER 2018
Technical Report2211
THIRD QUARTER 2018
Technical Report2211
THIRD QUARTER 2019
2
About this Report ........................................................................................................................... 3
Overview of the Texas Economy ................................................................................................... 4
Austin ...............................................................................................................................................6 Forecasting Results Office Overall Class A Office Retail Warehouse
Dallas-Fort Worth ............................................................................................................................9 Forecasting Results Office Overall Class A Office Retail Warehouse
Houston ........................................................................................................................................ 12 Forecasting Results Office Overall Class A Office Retail Warehouse
San Antonio .................................................................................................................................. 16 Forecasting Results
Office Overall Class A Office
Retail Warehouse
Figures ........................................................................................................................................... 19
Definitions .................................................................................................................................... 62

3
Real Estate Center economists continuously monitor multiple facets of the global, national, and
Texas economies. The Texas Quarterly Commercial Report is a summary of important economic
indicators that help discern commercial real estate (CRE) trends in four major Texas
Metropolitan Statistical Areas (MSAs)—Austin, Dallas-Fort Worth, Houston, and San Antonio.
All quarterly measurements are calculated using seasonally adjusted and trend-cycled data.
Seasonal adjustment smooths the quarterly fluctuations in the data, while trend-cycle
adjustment provides a clearer, less volatile view of upward and downward movements. Both
enrich our analysis by producing a more accurate depiction of long-term movements and trends
in the data.
This report analyzes asking rents, which exclude tenant improvements and concessions, as
opposed to effective rents. Rents reflect nominal year-over-year estimates, unless stated
otherwise. The analysis uses industry-specific employment growth to reflect the employment
most relevant to each industry. For example, the employment data for the office sector
includes finance, insurance, and real estate as well as professional and business services (FIRE &
PBS) employment to measure the bulk of employees working in the office sector.
This analysis uses CoStar and Dodge Analytics data. The time series varies by sector and
geography, depending on the data available. Sectors with shorter time series limit the
interpretation of the data. The data reflect nonowner-occupied space. No raw data are
published in this report.
This quarterly publication provides data and insights on the Texas commercial real estate
markets. We hope you find them useful. Your feedback is always appreciated. Send comments
and suggestions to [email protected].
Dr. James Gaines, Dr. Luis Torres, Dr. Harold Hunt, Clare Losey, and Trenton Forbes
4
Texas’ economy remained healthy in the longest U.S. economic expansion on record. Payroll
growth slowed, but unemployment rates hovered at historical lows. Average hourly earnings
failed to make positive headway after adjusting for inflation; second-quarter real income per
capita, however, increased. Retail sales improved, but overall perceptions were tainted by
political and trade-related concerns. Energy prices remained low amid record-breaking
production and lowered expectations of global demand in 2020. Escalating trade tensions,
political uncertainty, and the slowing world economy continue to be the largest headwinds to
the current business-cycle expansion. For additional commentary and statistics, see Outlook for
the Texas Economy at recenter.tamu.edu.
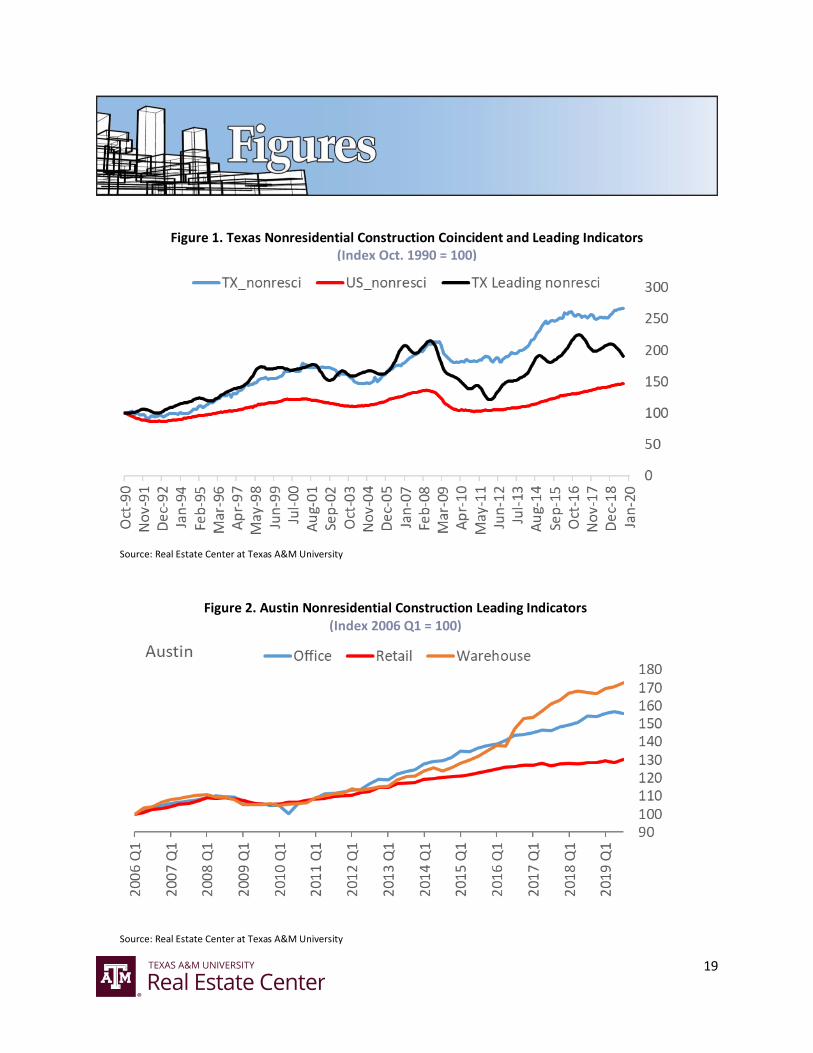
The Texas Nonresidential Construction Coincident Index, which measures current construction
activity, indicates further expansion. However, the Texas Nonresidential Construction Leading
Indicator, which measures potential future construction activity, suggests activity may slow
going forward due to a decline in construction values even though commercial loans registered
growth as interest rates have fallen. See Figures 1-5 for the Nonresidential Coincident Index and
Leading Indicator for Texas and the four major metros.
Texas’ nonfarm employment growth slowed to 2.6 percent seasonally adjusted annual rate
(SAAR) during the third quarter, resulting in only 49,300 jobs added. The deceleration is
unsurprising given the 112,000-job gain last quarter (almost double the post-recession
average). Nonetheless, the Dallas Fed’s annual employment growth projection slowed from 2.3
to 2.1 percent. Overall labor market conditions, however, remained strong. The unemployment
rate posted 3.4 percent for the fourth consecutive month. The U.S. economy slowed in 2019,
and growth is expected to be around 2.4 percent, back to its expected growth potential of
around 2 percent. The U.S. economy is expected to slow in 2020 but still register positive
growth, achieving a growth rate of around 2.1 percent.
Houston and Austin employment growth decelerated in the third quarter, resulting in a net
5,400 and 200 jobs, respectively. Houston’s education/health and leisure/hospitality sectors
dragged the three months ending in September, contributing to the third-quarter slowdown in
overall employment growth compared with double-digit average monthly additions in the
second quarter. Austin’s primary detractors were education/health services and mining/
logging/construction. Dallas contributed to over half of Texas’ payroll expansion, adding 24,900
new jobs in the third quarter. Much of the growth occurred in the mining/logging/construction
5
and financial activities sectors. The GM strike started after the September employment survey
and thus did not affect 3Q2019 numbers. San Antonio was the runner-up in terms of number of
jobs created, expanding employment by 10,500. Hiring in education/health services
accelerated, while leisure/hospitality recovered second-quarter losses. The same industries
contributed to a gain of 3,700 positions in Fort Worth, offsetting contractions in retail trade and
transportation/utilities. For additional commentary and statistics, see Outlook for the Texas
Economy at recenter.tamu.edu.

6
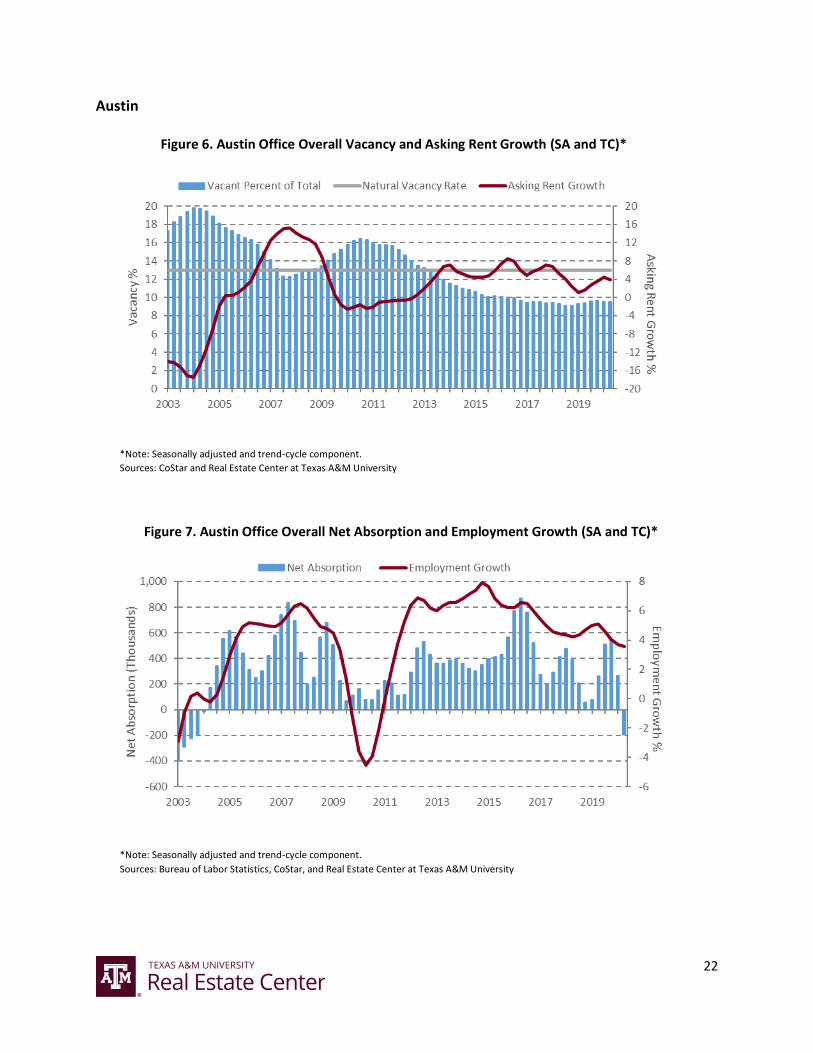
Overall Office (Figures 6 - 10)
After falling below 9 percent in 2Q2019, actual vacancy rose to slightly above 10 percent in
3Q2019. Demand for office space continues to remain strong, as actual vacancy has not risen
above the natural vacancy rate of 13 percent since 3Q2012. FIRE & PBS employment growth
has slowed since 2014. Despite the downward trend, employment growth remains strong and
positive, just shy of 3 percent in 3Q2019. Net absorption has declined since the beginning of
2019. While demand indicators are slowing, they remain modestly optimistic. Vacancy is
forecasted to average 9.8 percent through 2019 and 10.5 percent in 2020. Asking rent growth
slowed in response to moderating demand. Despite the recent drop in rent growth, it remains
positive and is projected to register 3.2 percent in 2019, slowing to 2.6 percent in 2020.
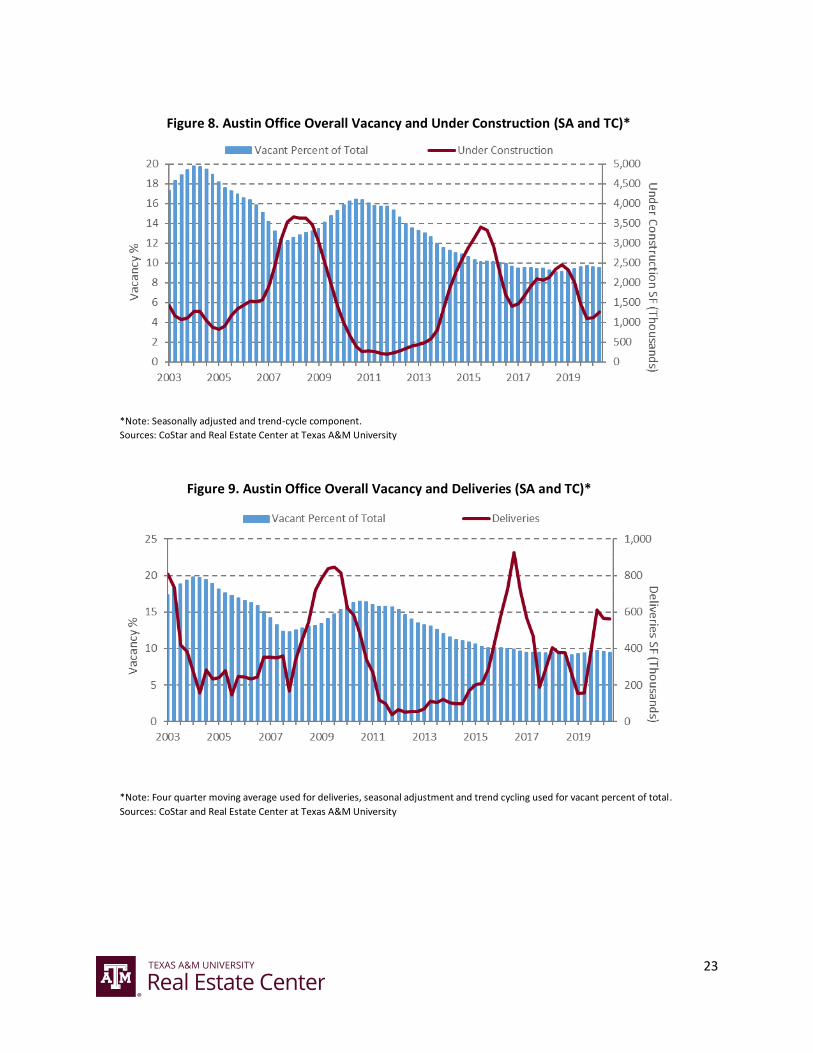
After peaking in 2018, construction starts declined sharply through 2019. Square footage under
construction has begun to slow, and deliveries have followed suit. The decrease in the supply of
office space coming to market is likely developers’ response to the weakening demand and
concerns of the timing in the current economic cycle.
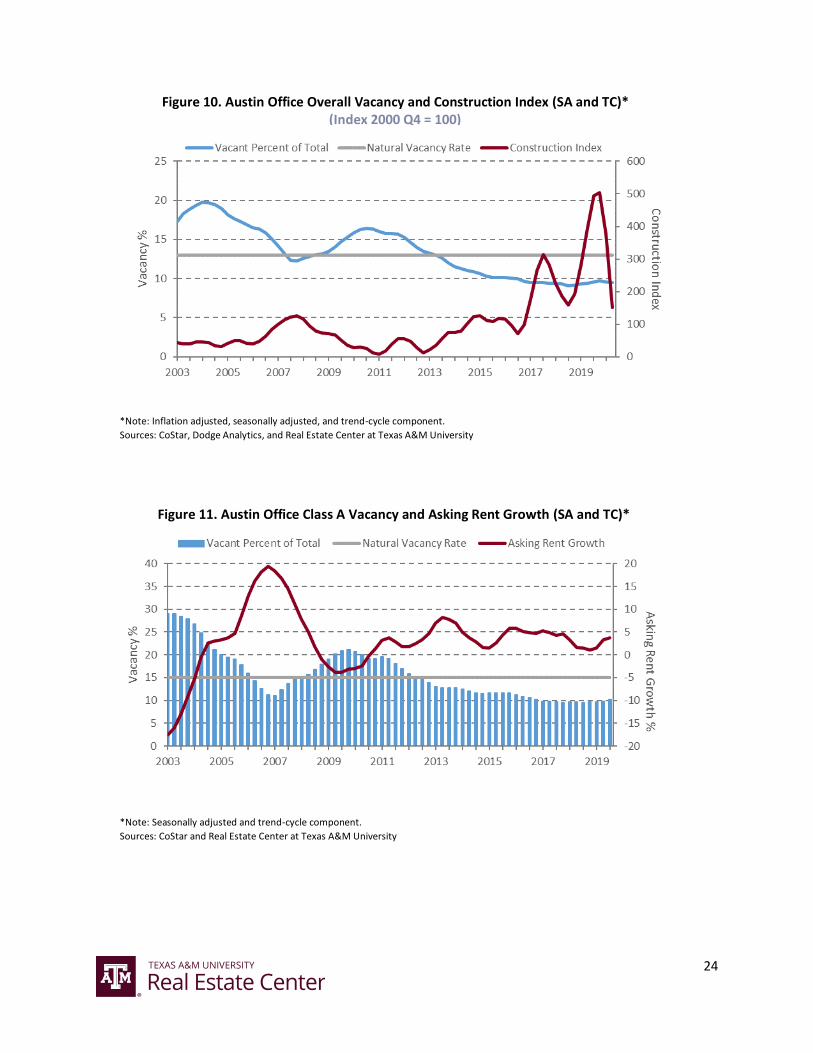
Class A Office (Figures 11 - 15)
Actual vacancy trended slightly upward during the previous five quarters. The demand for
Austin’s class A office space was consistently strong over the years as actual vacancy has
remained comfortably below the natural vacancy of 15 percent since mid-2012. Despite the
slowing of FIRE and PBS employment growth, they have remained positive. Following five
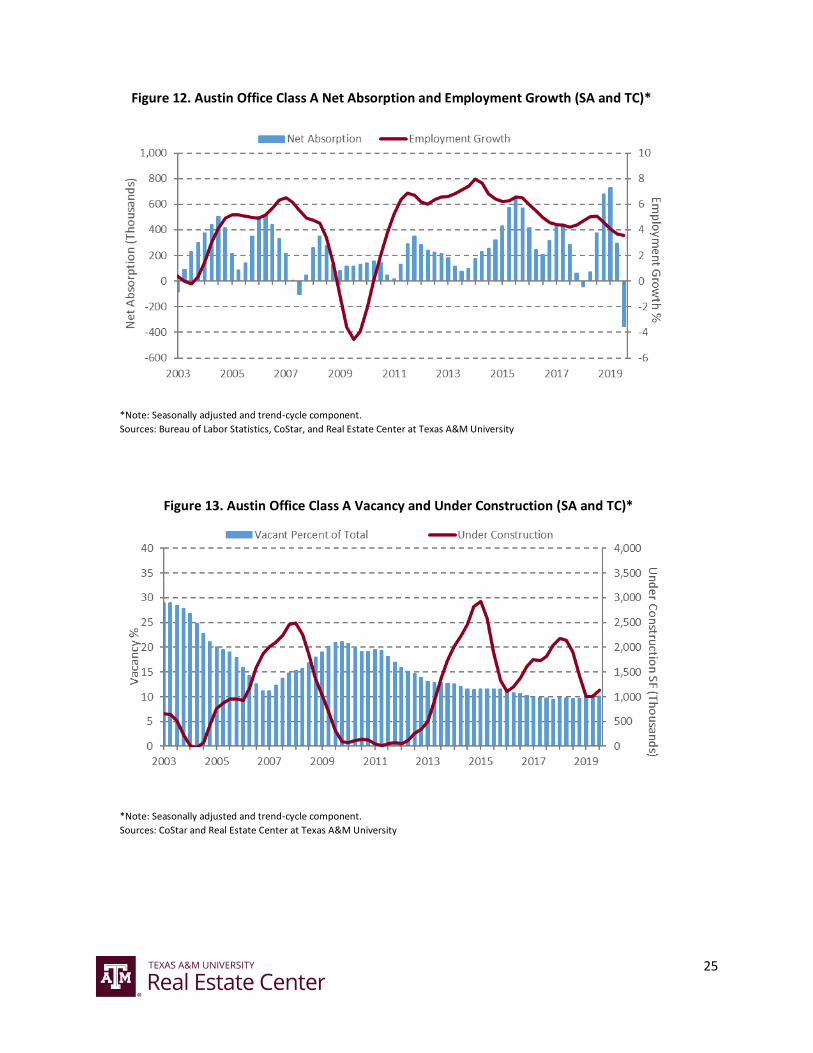
robust quarters of positive net absorption, 3Q2019 had a significant loss in space absorbed.
With low actual vacancies and positive employment growth, the outlook for the demand of
class A office space in Austin remains positive. Vacancy rates are forecasted to average 10.2 and
7
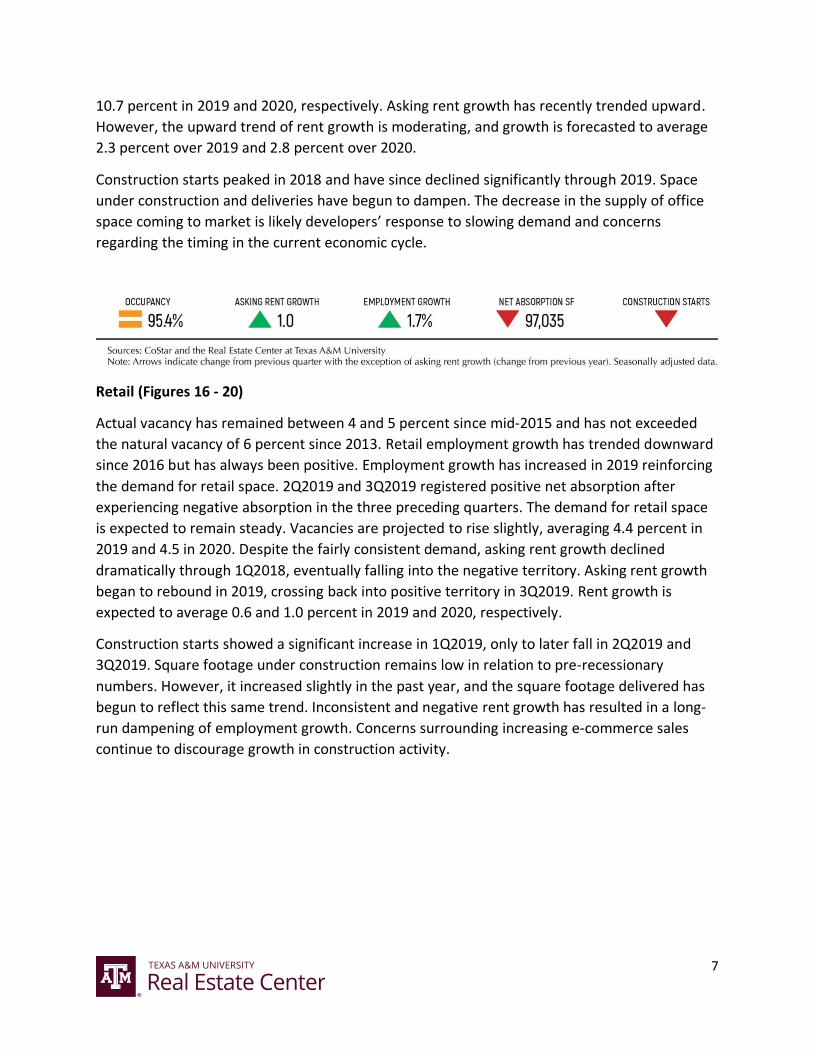
10.7 percent in 2019 and 2020, respectively. Asking rent growth has recently trended upward.
However, the upward trend of rent growth is moderating, and growth is forecasted to average
2.3 percent over 2019 and 2.8 percent over 2020.
Construction starts peaked in 2018 and have since declined significantly through 2019. Space
under construction and deliveries have begun to dampen. The decrease in the supply of office
space coming to market is likely developers’ response to slowing demand and concerns
regarding the timing in the current economic cycle.
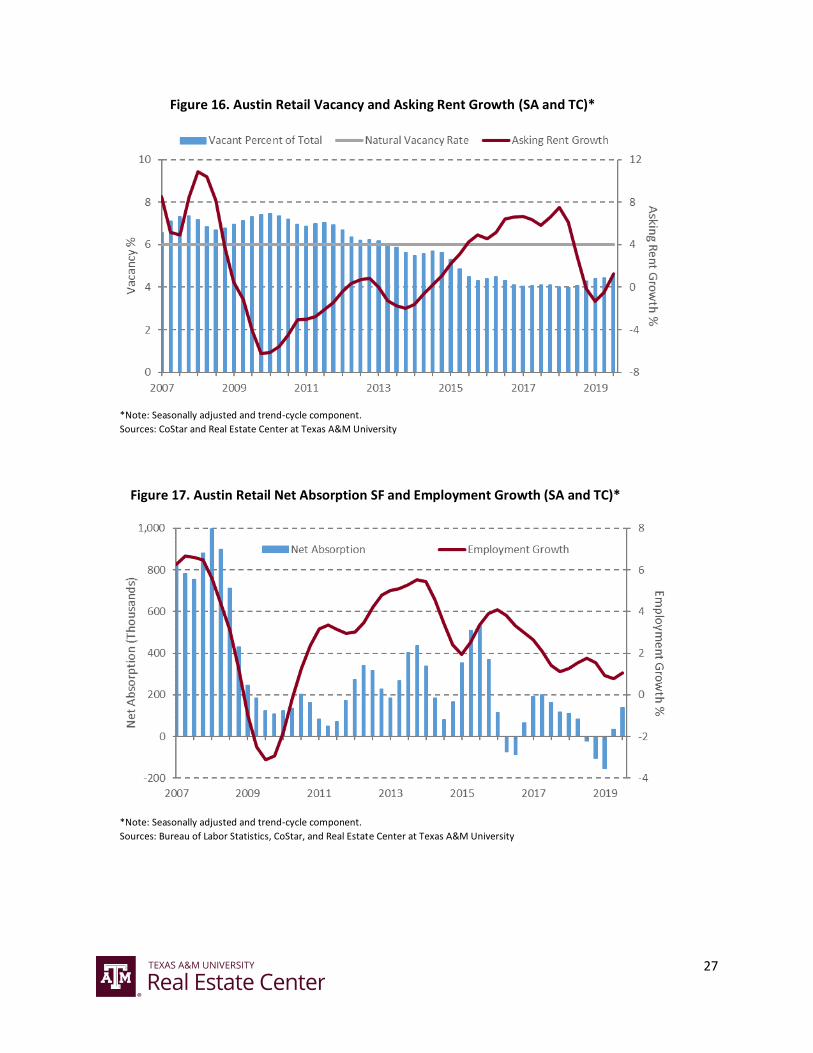
Retail (Figures 16 - 20)
Actual vacancy has remained between 4 and 5 percent since mid-2015 and has not exceeded
the natural vacancy of 6 percent since 2013. Retail employment growth has trended downward
since 2016 but has always been positive. Employment growth has increased in 2019 reinforcing
the demand for retail space. 2Q2019 and 3Q2019 registered positive net absorption after
experiencing negative absorption in the three preceding quarters. The demand for retail space
is expected to remain steady. Vacancies are projected to rise slightly, averaging 4.4 percent in
2019 and 4.5 in 2020. Despite the fairly consistent demand, asking rent growth declined
dramatically through 1Q2018, eventually falling into the negative territory. Asking rent growth
began to rebound in 2019, crossing back into positive territory in 3Q2019. Rent growth is
expected to average 0.6 and 1.0 percent in 2019 and 2020, respectively.
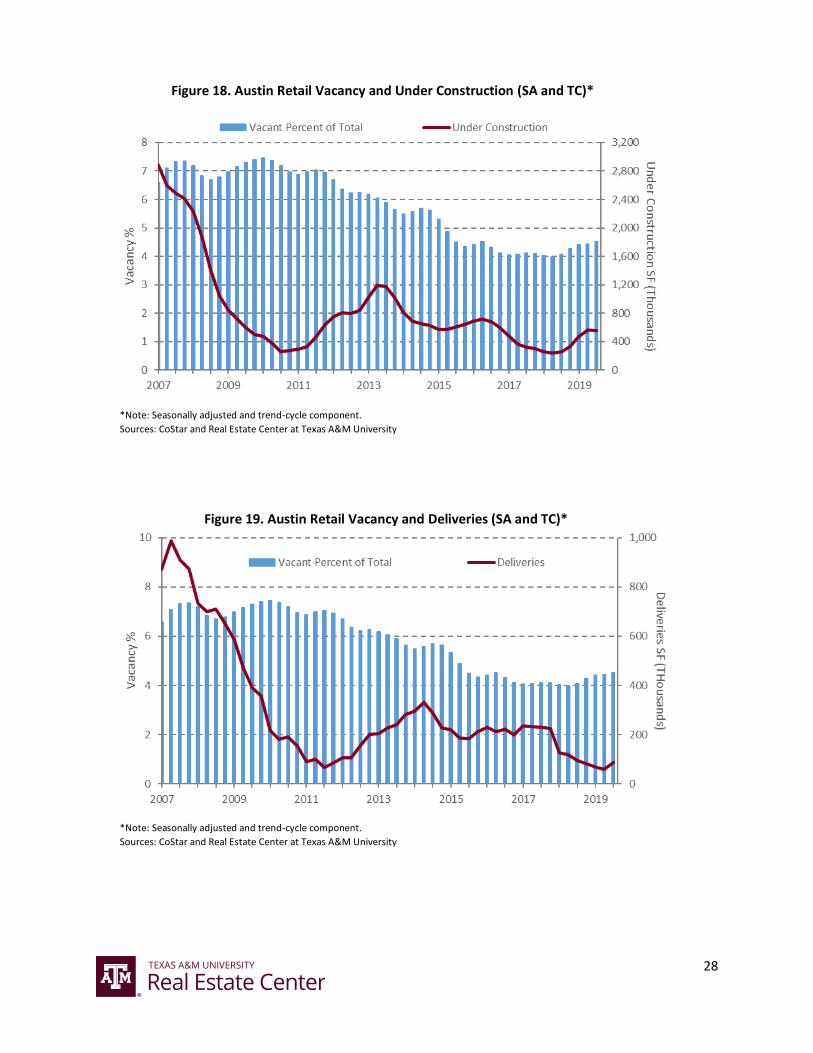
Construction starts showed a significant increase in 1Q2019, only to later fall in 2Q2019 and
3Q2019. Square footage under construction remains low in relation to pre-recessionary
numbers. However, it increased slightly in the past year, and the square footage delivered has
begun to reflect this same trend. Inconsistent and negative rent growth has resulted in a long-
run dampening of employment growth. Concerns surrounding increasing e-commerce sales
continue to discourage growth in construction activity.

8
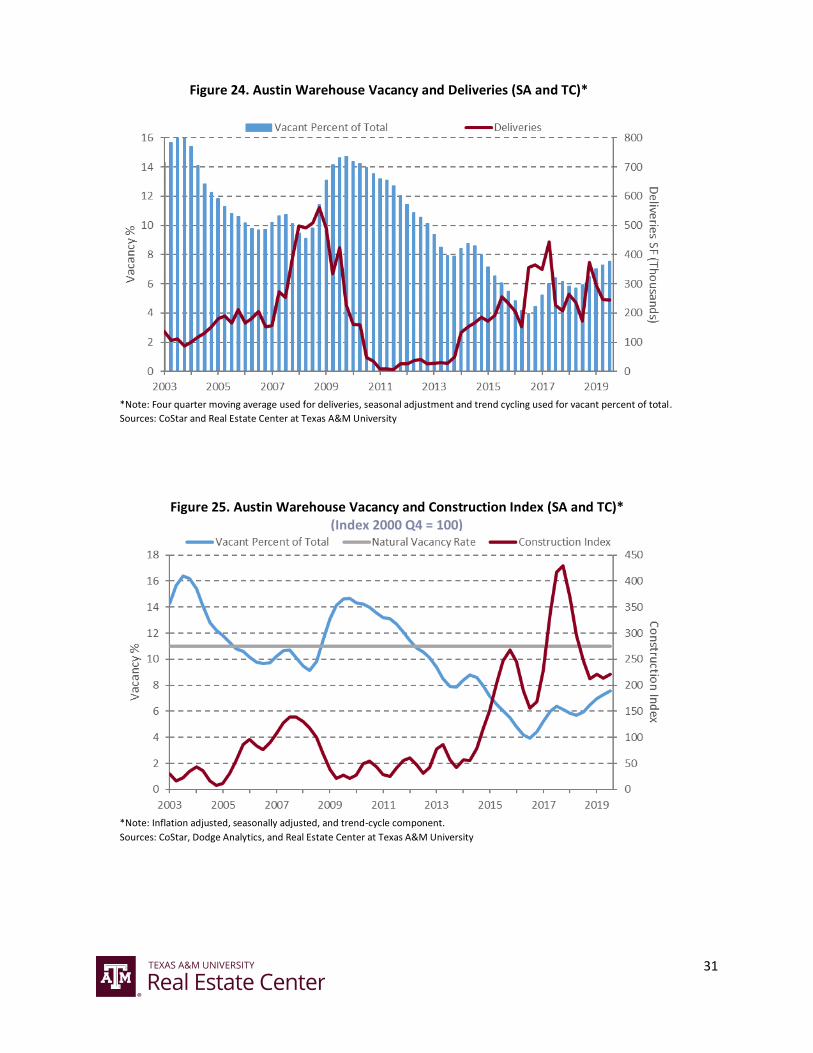
Warehouse (Figures 21 - 25)
While actual vacancy rose since mid-2016, registering just above 7.0 percent in the previous
two quarters, it remains comfortably below the natural vacancy of 11.0 percent. Warehouse
employment growth fell from an all-time high of more than 16.0 percent in 2017. However,
employment growth bottomed out at 2.0 percent, increasing in 3Q2019 to above 3.0 percent.
Net absorption was slightly negative in the previous three quarters. Despite slight increases in
vacancies and slowing warehouse employment growth and space absorption, the low vacancy
rates suggest demand for warehouse space remains strong in the MSA. Vacancies are
forecasted to average 7.2 percent in both 2019 and 2020. Despite recent increases in vacancies,
asking rent growth has been on the rise since dipping into negative territory in late 2018. Rent
growth is forecasted to remain positive in 2019 and 2020, averaging 2.5 and 1.5 percent,
respectively.
Construction starts decreased sharply after reaching an all-time high in late 2017, stabilizing in
the last four quarters. Square footage under construction has slightly increased, and deliveries
have stabilized following the recent stabilization of construction starts.
Table 1. Projected Overall Vacancy Rates and Asking Rent Growth
Vacancy Rates (%) Asking Rents (y-o-y %)
Property Type
Natural Vacancy
Rate 2018 2019 2020 2018 2019 2020
Office Overall 13.0 9.4 9.8 10.5 2.0 3.2 2.6
Office Class A 15.0 9.7 10.2 10.7 1.9 2.3 2.8
Retail 6.0 4.1 4.4 4.5 3.7 0.6 1.0
Warehouse 11.0 6.0 7.2 7.2 2.1 2.5 1.5 Note: Annual numbers represent the four-quarter average of the seasonally adjusted data. Rent growth is nominally estimated from the previous year’s average. Sources: CoStar and the Real Estate Center at Texas A&M University
9
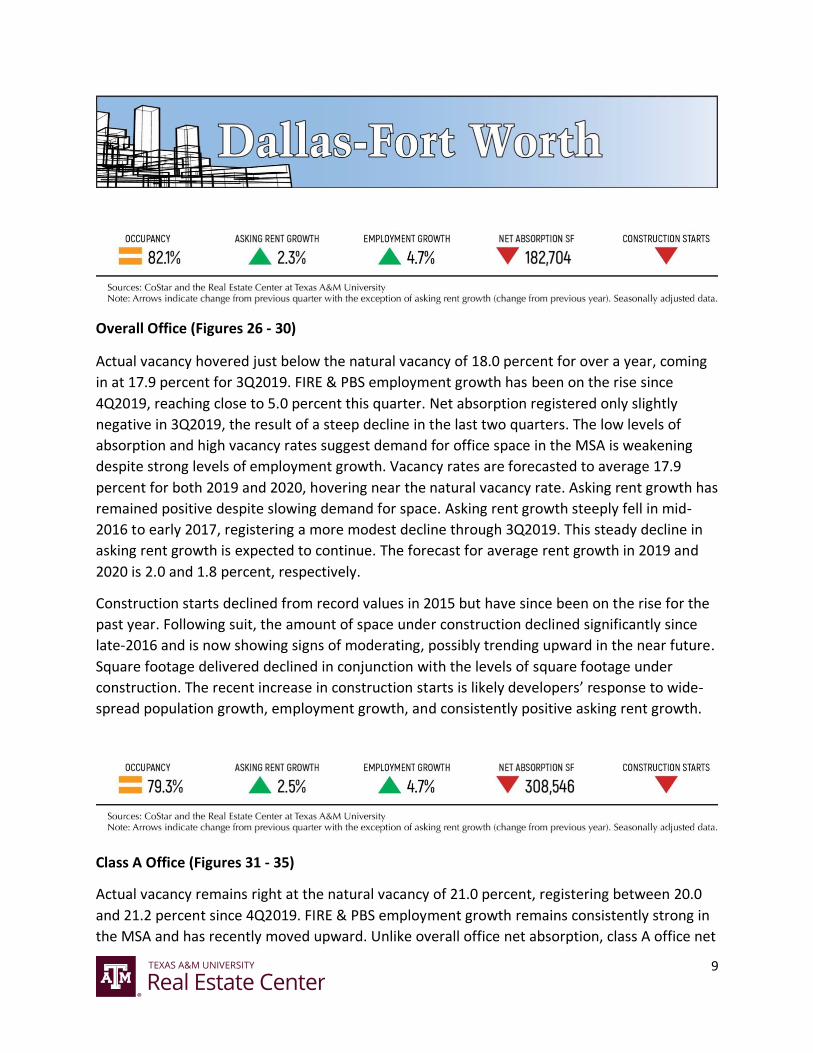
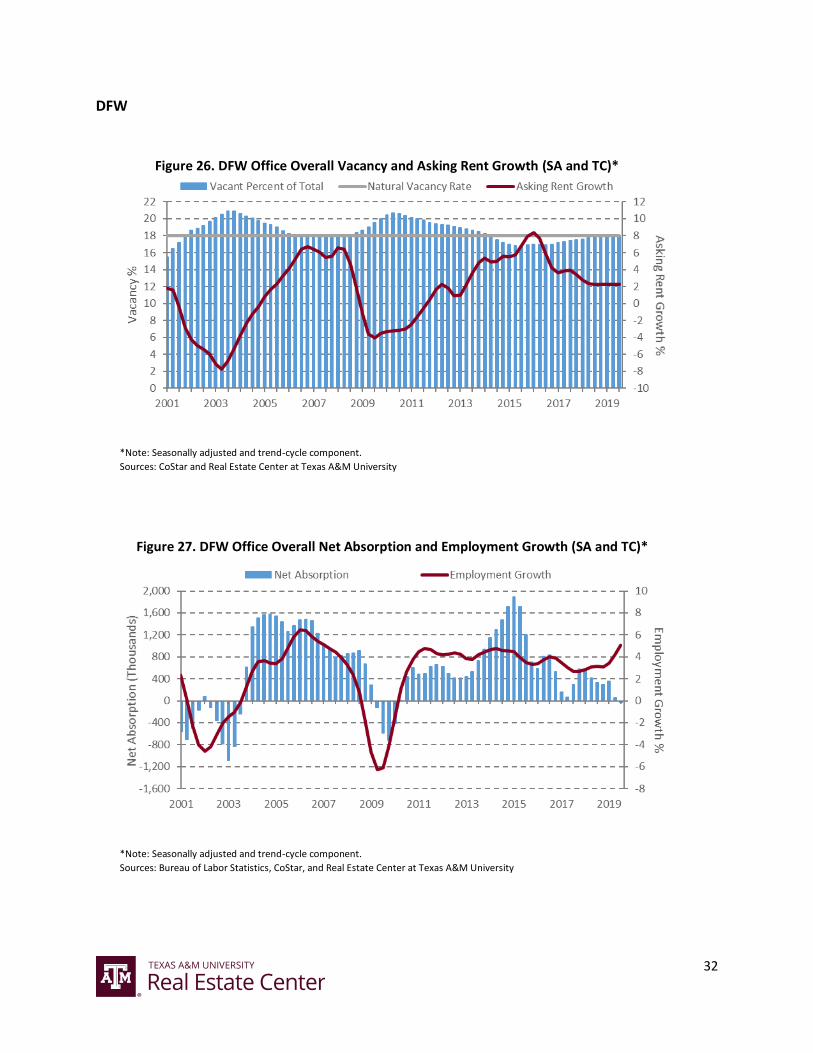
Overall Office (Figures 26 - 30)
Actual vacancy hovered just below the natural vacancy of 18.0 percent for over a year, coming
in at 17.9 percent for 3Q2019. FIRE & PBS employment growth has been on the rise since
4Q2019, reaching close to 5.0 percent this quarter. Net absorption registered only slightly
negative in 3Q2019, the result of a steep decline in the last two quarters. The low levels of
absorption and high vacancy rates suggest demand for office space in the MSA is weakening
despite strong levels of employment growth. Vacancy rates are forecasted to average 17.9
percent for both 2019 and 2020, hovering near the natural vacancy rate. Asking rent growth has
remained positive despite slowing demand for space. Asking rent growth steeply fell in mid-
2016 to early 2017, registering a more modest decline through 3Q2019. This steady decline in
asking rent growth is expected to continue. The forecast for average rent growth in 2019 and
2020 is 2.0 and 1.8 percent, respectively.
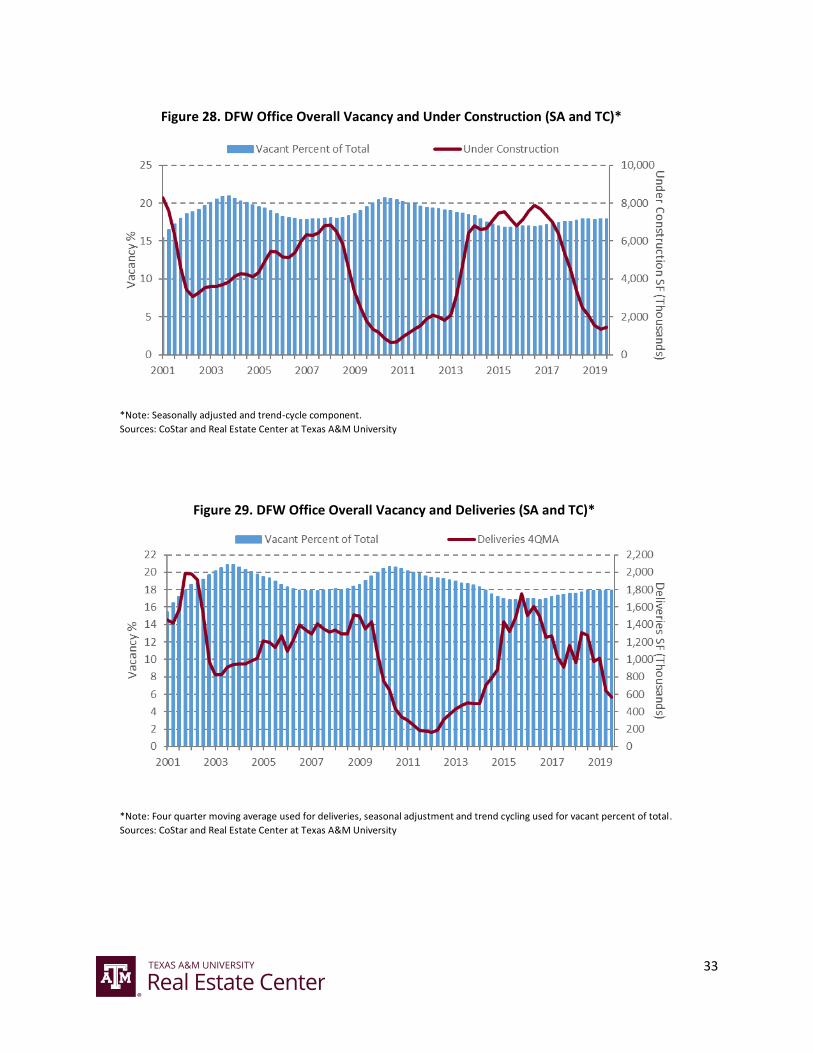
Construction starts declined from record values in 2015 but have since been on the rise for the
past year. Following suit, the amount of space under construction declined significantly since
late-2016 and is now showing signs of moderating, possibly trending upward in the near future.
Square footage delivered declined in conjunction with the levels of square footage under
construction. The recent increase in construction starts is likely developers’ response to wide-
spread population growth, employment growth, and consistently positive asking rent growth.
Class A Office (Figures 31 - 35)
Actual vacancy remains right at the natural vacancy of 21.0 percent, registering between 20.0
and 21.2 percent since 4Q2019. FIRE & PBS employment growth remains consistently strong in
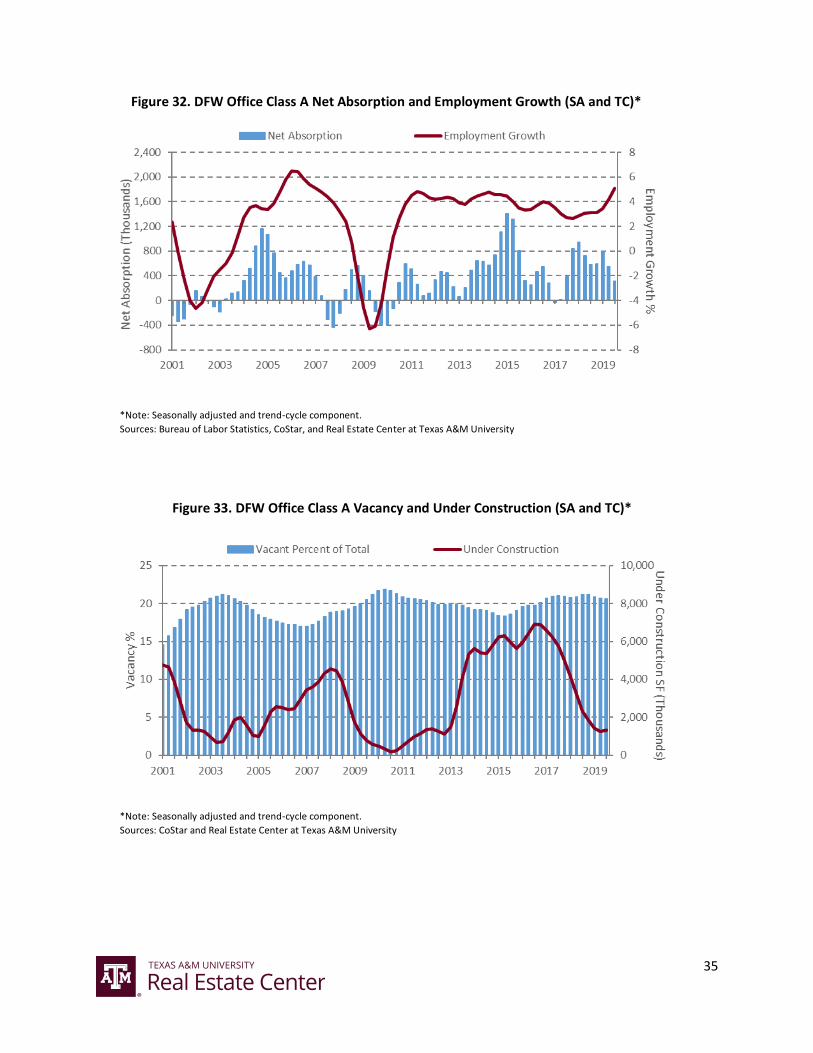
the MSA and has recently moved upward. Unlike overall office net absorption, class A office net
10
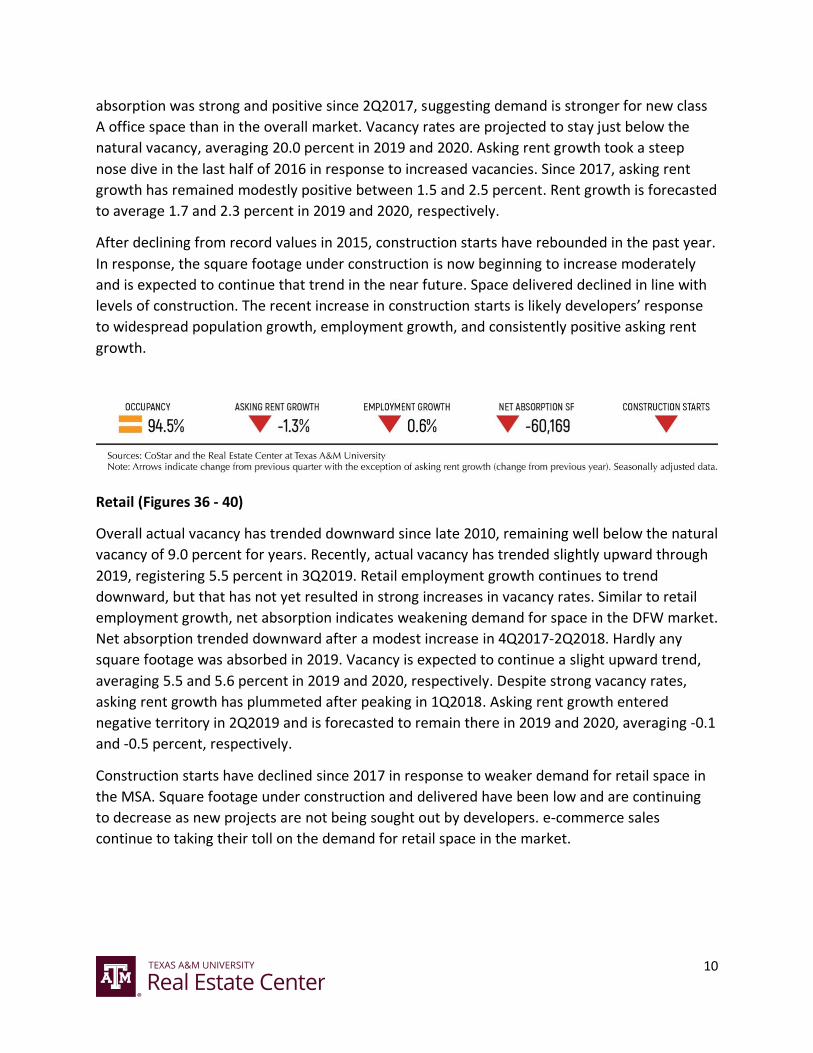
absorption was strong and positive since 2Q2017, suggesting demand is stronger for new class
A office space than in the overall market. Vacancy rates are projected to stay just below the
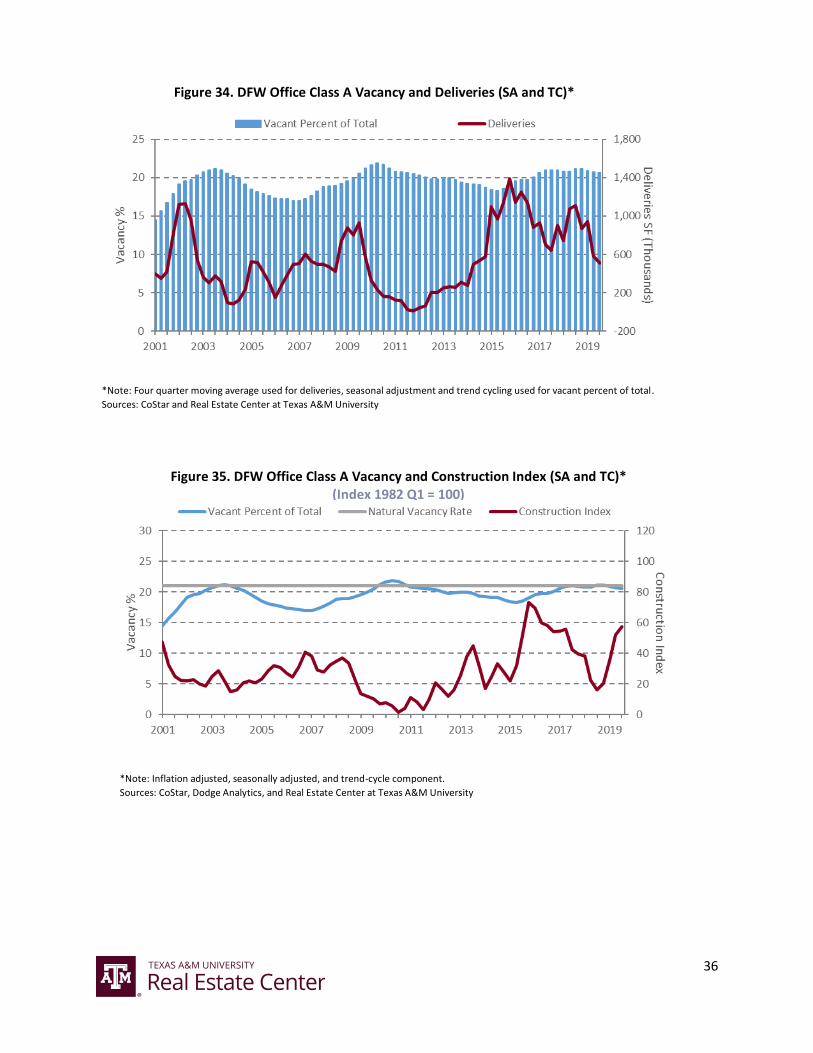
natural vacancy, averaging 20.0 percent in 2019 and 2020. Asking rent growth took a steep
nose dive in the last half of 2016 in response to increased vacancies. Since 2017, asking rent
growth has remained modestly positive between 1.5 and 2.5 percent. Rent growth is forecasted
to average 1.7 and 2.3 percent in 2019 and 2020, respectively.
After declining from record values in 2015, construction starts have rebounded in the past year.
In response, the square footage under construction is now beginning to increase moderately
and is expected to continue that trend in the near future. Space delivered declined in line with
levels of construction. The recent increase in construction starts is likely developers’ response
to widespread population growth, employment growth, and consistently positive asking rent
growth.
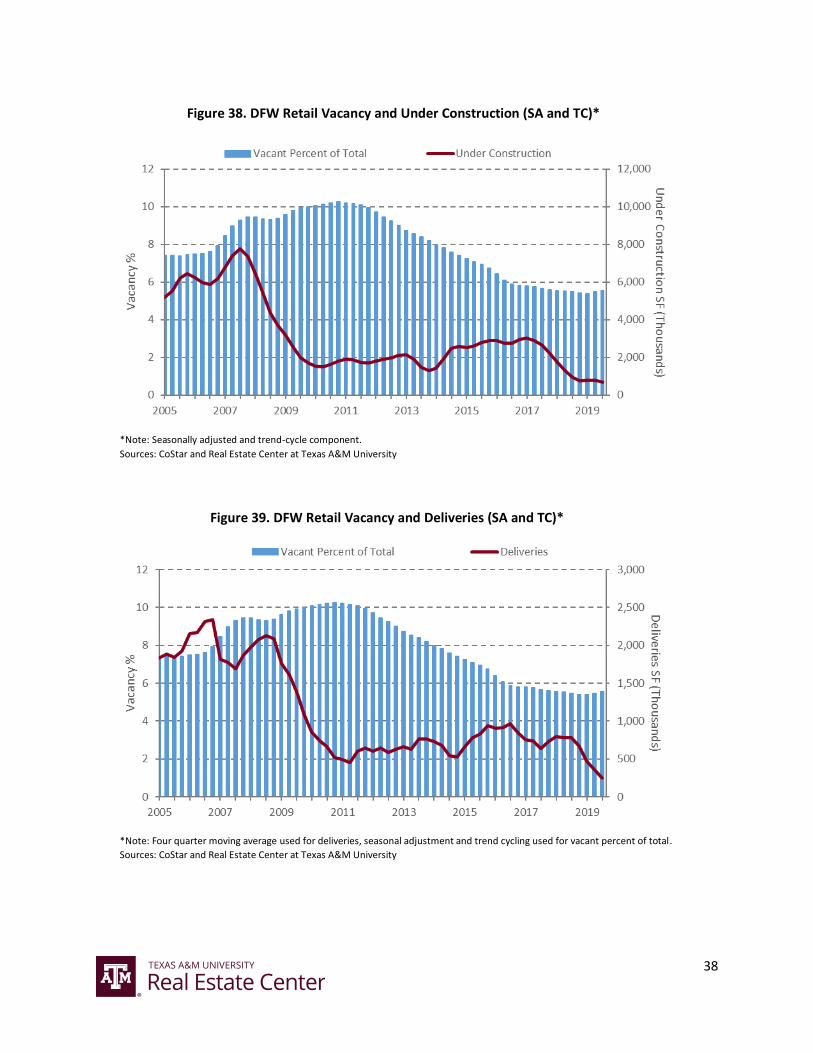
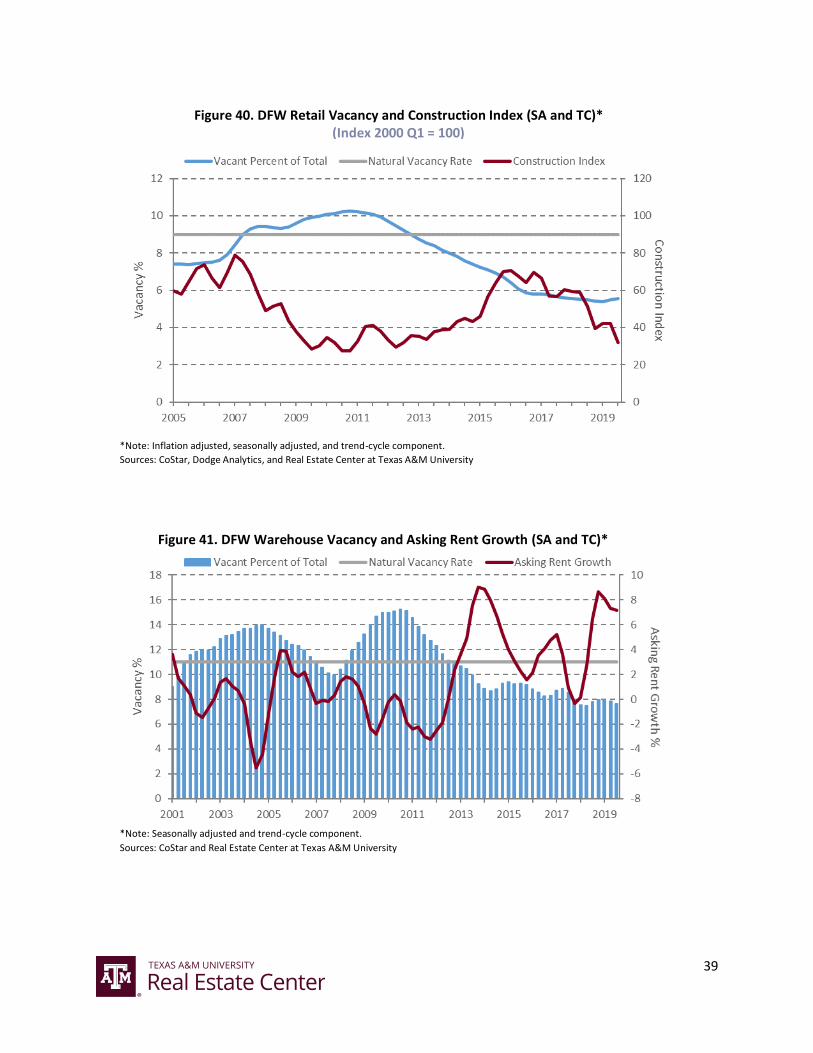
Retail (Figures 36 - 40)
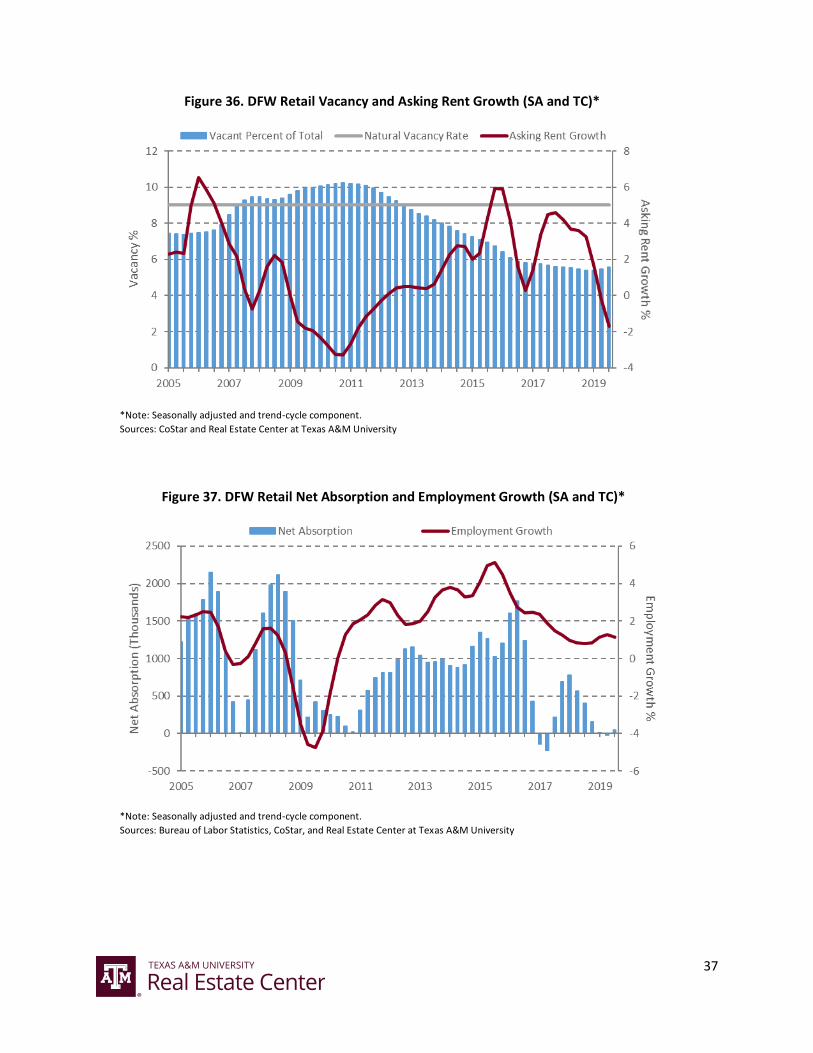
Overall actual vacancy has trended downward since late 2010, remaining well below the natural
vacancy of 9.0 percent for years. Recently, actual vacancy has trended slightly upward through
2019, registering 5.5 percent in 3Q2019. Retail employment growth continues to trend
downward, but that has not yet resulted in strong increases in vacancy rates. Similar to retail
employment growth, net absorption indicates weakening demand for space in the DFW market.
Net absorption trended downward after a modest increase in 4Q2017-2Q2018. Hardly any
square footage was absorbed in 2019. Vacancy is expected to continue a slight upward trend,
averaging 5.5 and 5.6 percent in 2019 and 2020, respectively. Despite strong vacancy rates,
asking rent growth has plummeted after peaking in 1Q2018. Asking rent growth entered
negative territory in 2Q2019 and is forecasted to remain there in 2019 and 2020, averaging -0.1
and -0.5 percent, respectively.
Construction starts have declined since 2017 in response to weaker demand for retail space in
the MSA. Square footage under construction and delivered have been low and are continuing
to decrease as new projects are not being sought out by developers. e-commerce sales
continue to taking their toll on the demand for retail space in the market.
11
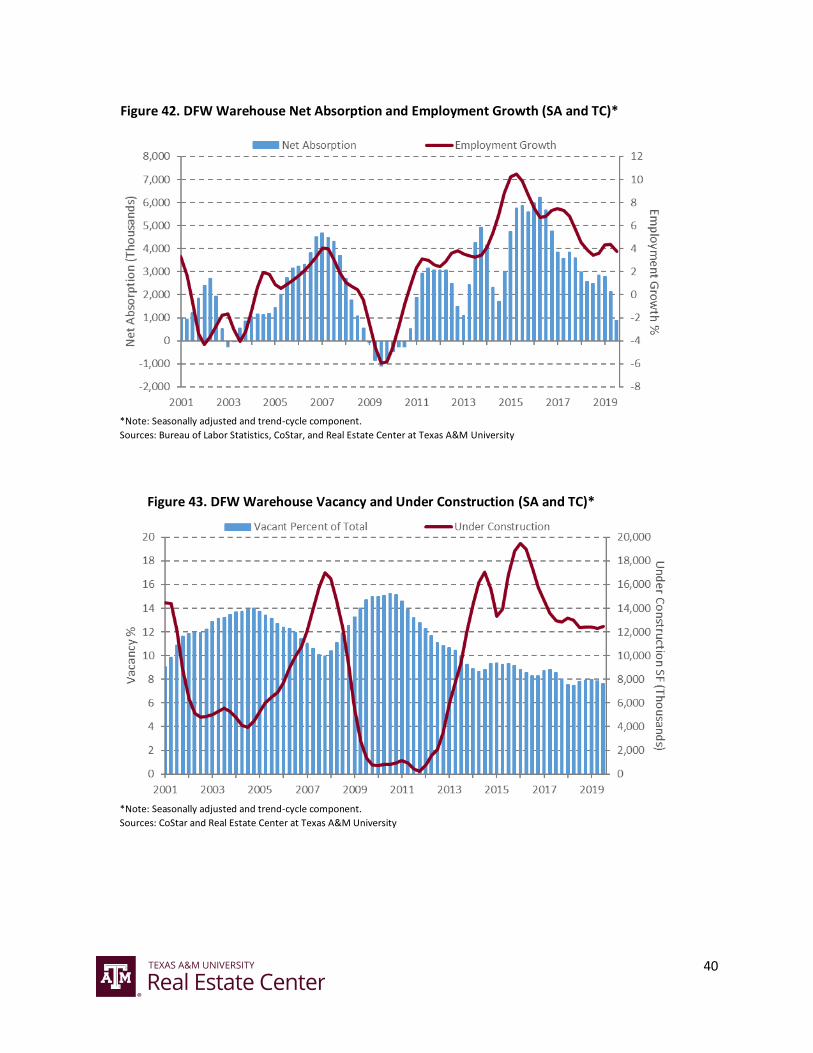
Warehouse (Figures 41 - 45)
Actual vacancy has hovered between 7 and 9 percent since 2014, well below the natural
vacancy of 11.0 percent, generally trending downward during this time. While vacancy rates
suggest a growing demand for industrial space, warehouse employment growth and net
absorption tell a different story. Employment growth has decreased after a record increase in
2015. Net absorption has declined after peaking in mid-2016. However, both employment
growth and net absorption remain positive. Despite both trending downward, the demand for
warehouse space remains strong. Employment growth recorded over 3.0 percent growth for
3Q2019, and the square footage absorbed remains strong. Vacancy rates are projected to
average 7.8 and 7.7 percent for 2019 and 2020, respectively. From 4Q2017 to 4Q2018, asking
rent growth increased solidly. Rent growth has since slowed through 2019. However, it remains
extremely strong, registering over 7.0 percent in 3Q2019. Asking rent growth is forecasted to
average 7.0 and 3.2 percent for 2019 and 2020, respectively.
Construction starts were at record levels in 2016-18, but they have declined since. Square
footage under construction increased in 2016, as expected, declining through 2017 before
increasing moderately in 2018-19. Deliveries declined sharply in 2019, possibly due to many
projects reaching completion in 2018. The supply of new warehouse space has caught up to the
large spike in demand experienced in the MSA from 2015-16. As vacancies continue to decrease
and rent and employment growth remain strong, developers may consider starting new
projects.
Table 2. Projected Overall Vacancy Rates and Asking Rent Growth
Vacancy Rates (%) Asking Rents (y-o-y %)
Property Type
Natural Vacancy
Rate 2018 2019 2020 2018 2019 2020
Office Overall 18.0 17.7 17.9 17.9 2.5 2.0 1.8
Office Class A 21.0 21.0 20.7 20.2 1.7 1.7 2.3
Retail 9.0 5.5 5.5 5.6 3.2 -0.1 -0.5
Warehouse 11.0 7.7 7.8 7.7 4.0 7.0 3.2 Note: Annual numbers represent the four-quarter average of the seasonally adjusted data. Rent growth is nominally estimated from the previous year’s average. Sources: CoStar and the Real Estate Center at Texas A&M University
12
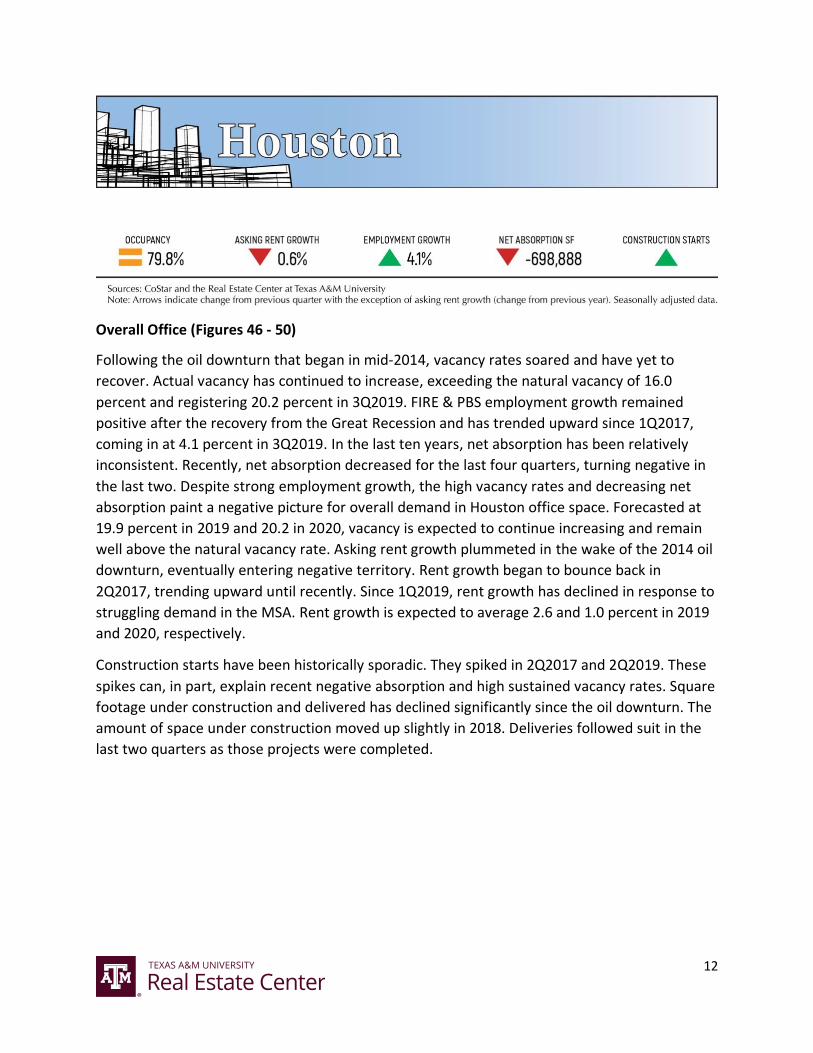
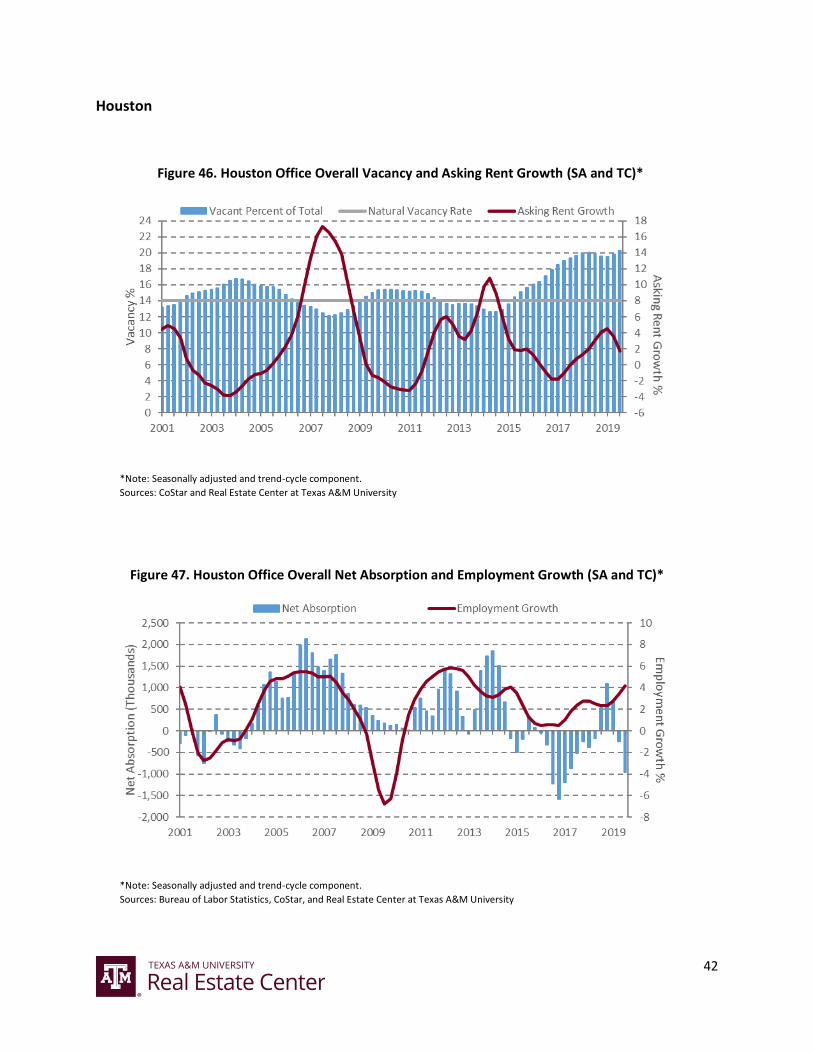
Overall Office (Figures 46 - 50)
Following the oil downturn that began in mid-2014, vacancy rates soared and have yet to
recover. Actual vacancy has continued to increase, exceeding the natural vacancy of 16.0
percent and registering 20.2 percent in 3Q2019. FIRE & PBS employment growth remained
positive after the recovery from the Great Recession and has trended upward since 1Q2017,
coming in at 4.1 percent in 3Q2019. In the last ten years, net absorption has been relatively
inconsistent. Recently, net absorption decreased for the last four quarters, turning negative in
the last two. Despite strong employment growth, the high vacancy rates and decreasing net
absorption paint a negative picture for overall demand in Houston office space. Forecasted at
19.9 percent in 2019 and 20.2 in 2020, vacancy is expected to continue increasing and remain
well above the natural vacancy rate. Asking rent growth plummeted in the wake of the 2014 oil
downturn, eventually entering negative territory. Rent growth began to bounce back in
2Q2017, trending upward until recently. Since 1Q2019, rent growth has declined in response to
struggling demand in the MSA. Rent growth is expected to average 2.6 and 1.0 percent in 2019
and 2020, respectively.
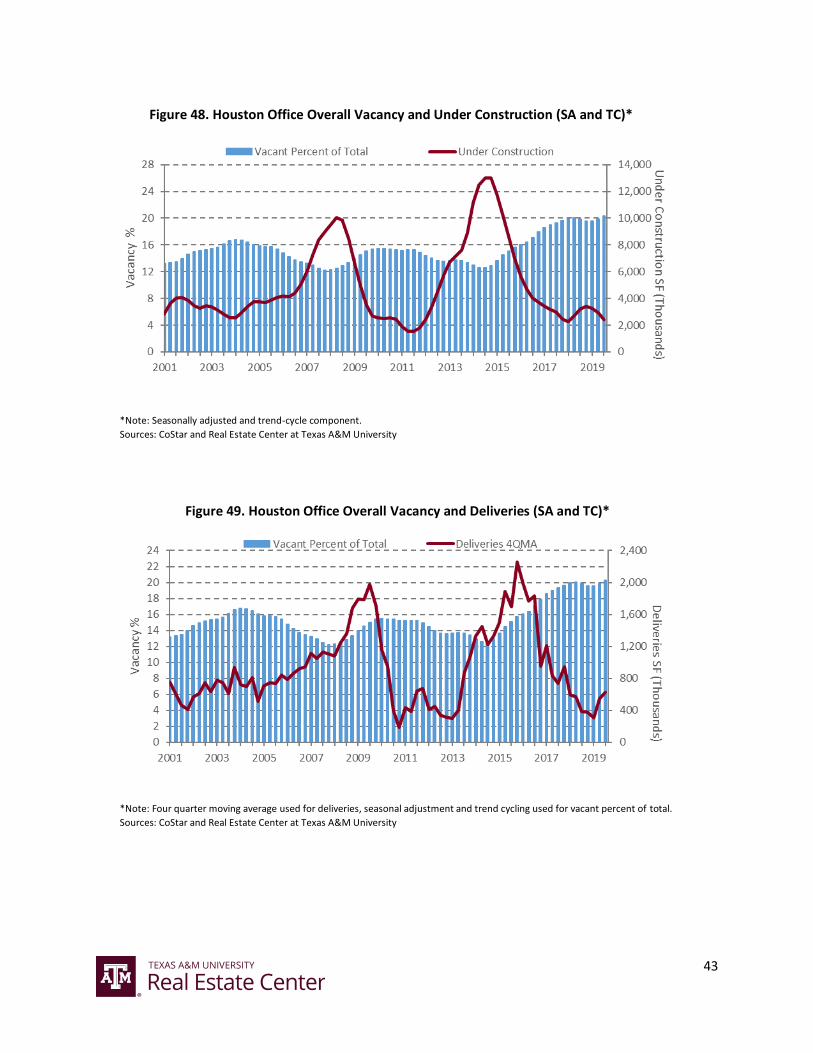
Construction starts have been historically sporadic. They spiked in 2Q2017 and 2Q2019. These
spikes can, in part, explain recent negative absorption and high sustained vacancy rates. Square
footage under construction and delivered has declined significantly since the oil downturn. The
amount of space under construction moved up slightly in 2018. Deliveries followed suit in the
last two quarters as those projects were completed.
13
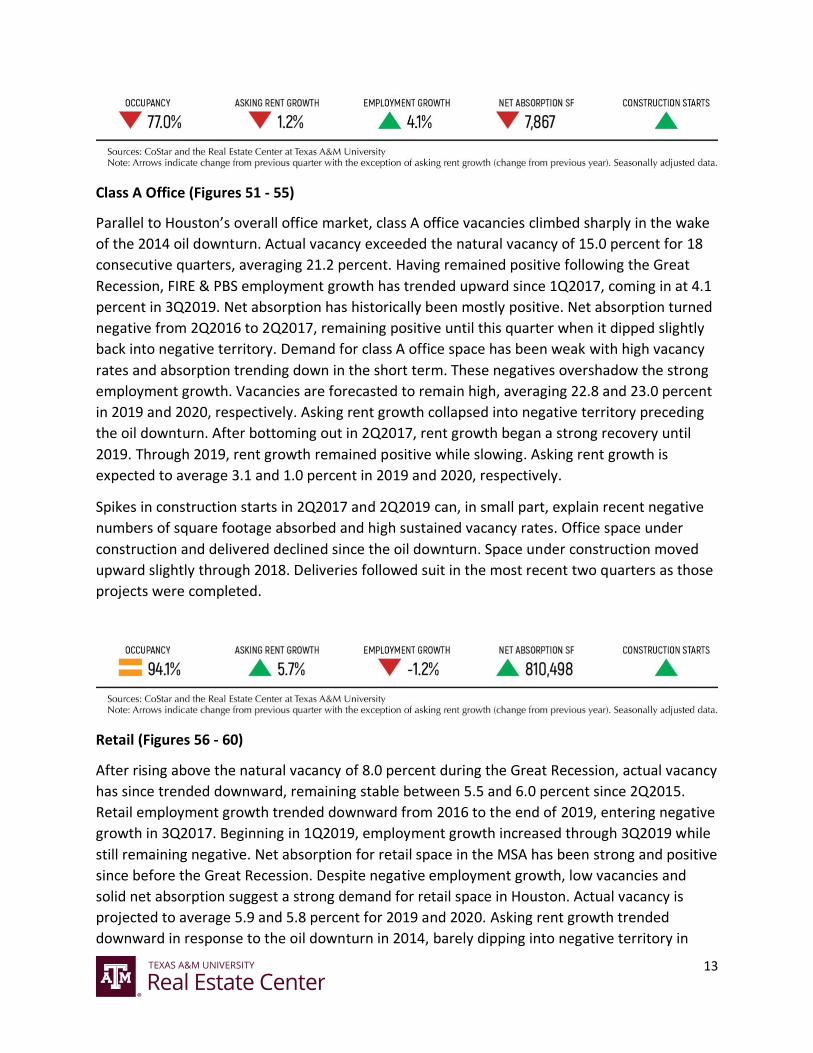
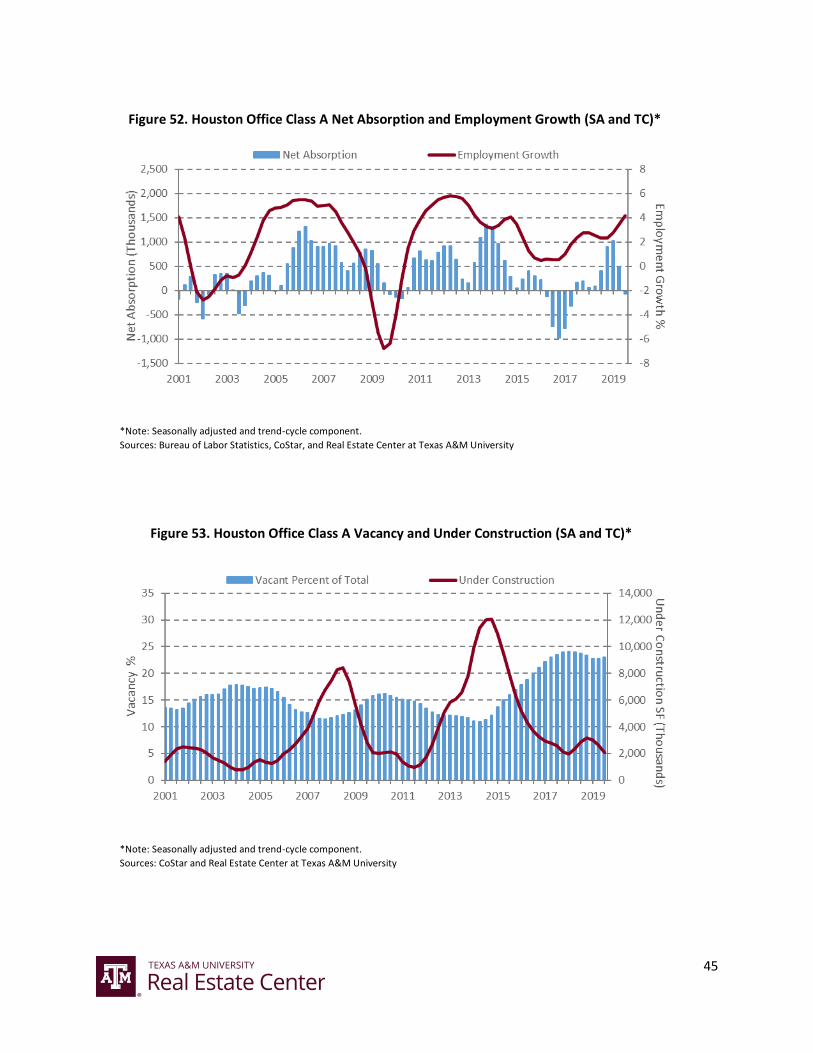
Class A Office (Figures 51 - 55)
Parallel to Houston’s overall office market, class A office vacancies climbed sharply in the wake
of the 2014 oil downturn. Actual vacancy exceeded the natural vacancy of 15.0 percent for 18
consecutive quarters, averaging 21.2 percent. Having remained positive following the Great
Recession, FIRE & PBS employment growth has trended upward since 1Q2017, coming in at 4.1
percent in 3Q2019. Net absorption has historically been mostly positive. Net absorption turned
negative from 2Q2016 to 2Q2017, remaining positive until this quarter when it dipped slightly
back into negative territory. Demand for class A office space has been weak with high vacancy
rates and absorption trending down in the short term. These negatives overshadow the strong
employment growth. Vacancies are forecasted to remain high, averaging 22.8 and 23.0 percent
in 2019 and 2020, respectively. Asking rent growth collapsed into negative territory preceding
the oil downturn. After bottoming out in 2Q2017, rent growth began a strong recovery until
2019. Through 2019, rent growth remained positive while slowing. Asking rent growth is
expected to average 3.1 and 1.0 percent in 2019 and 2020, respectively.
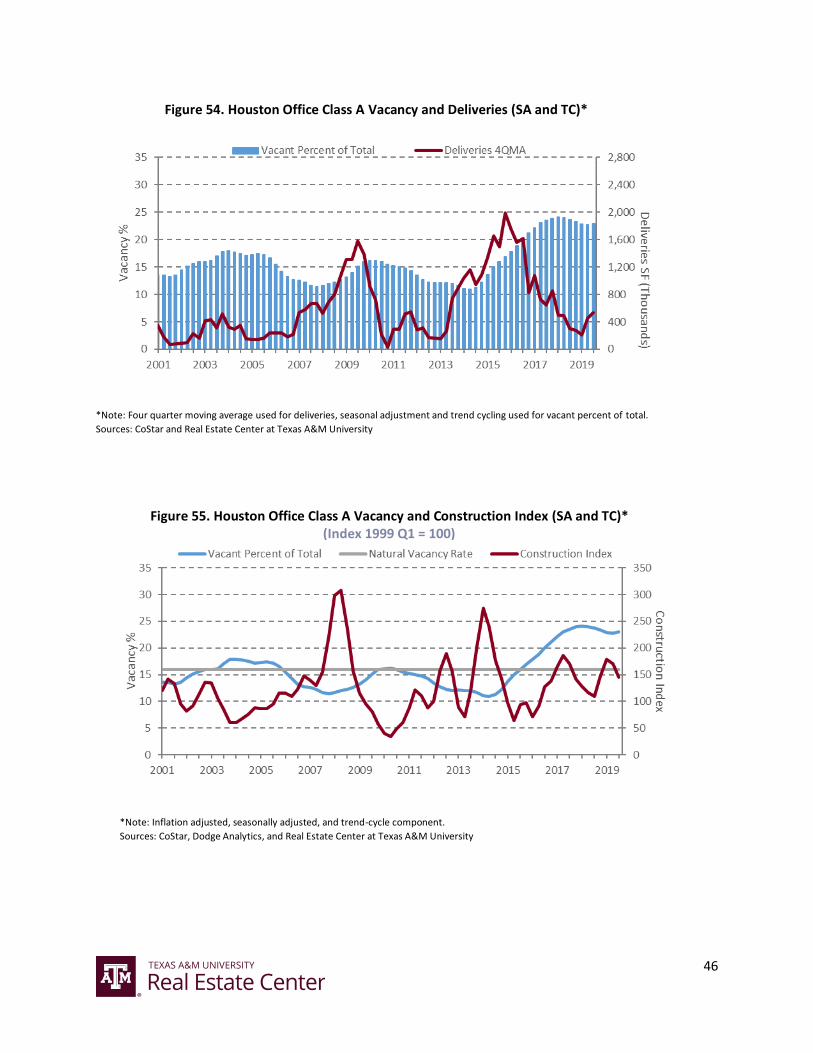
Spikes in construction starts in 2Q2017 and 2Q2019 can, in small part, explain recent negative
numbers of square footage absorbed and high sustained vacancy rates. Office space under
construction and delivered declined since the oil downturn. Space under construction moved
upward slightly through 2018. Deliveries followed suit in the most recent two quarters as those
projects were completed.
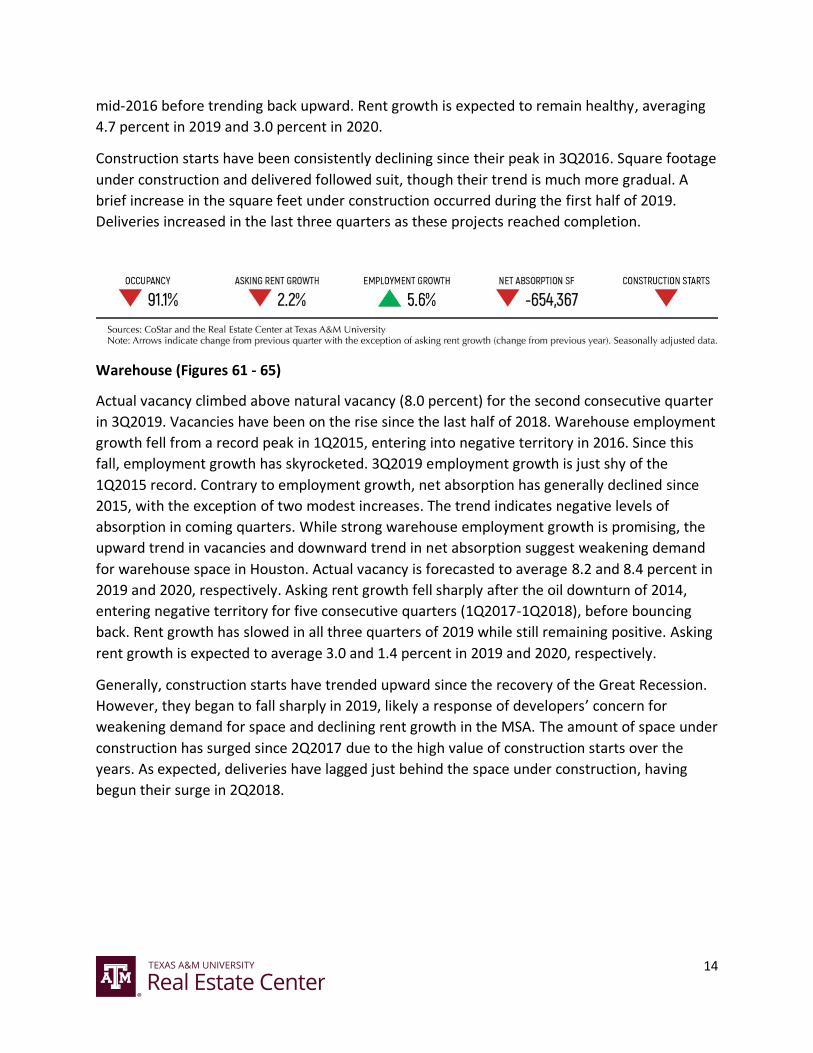
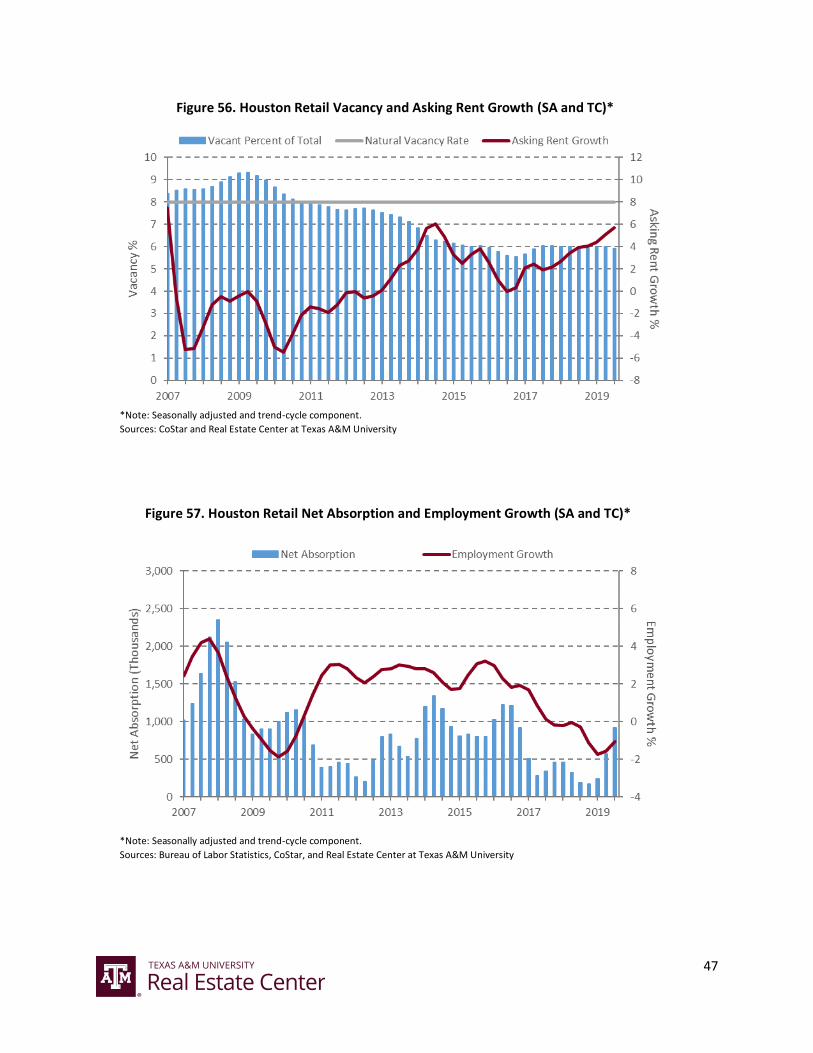
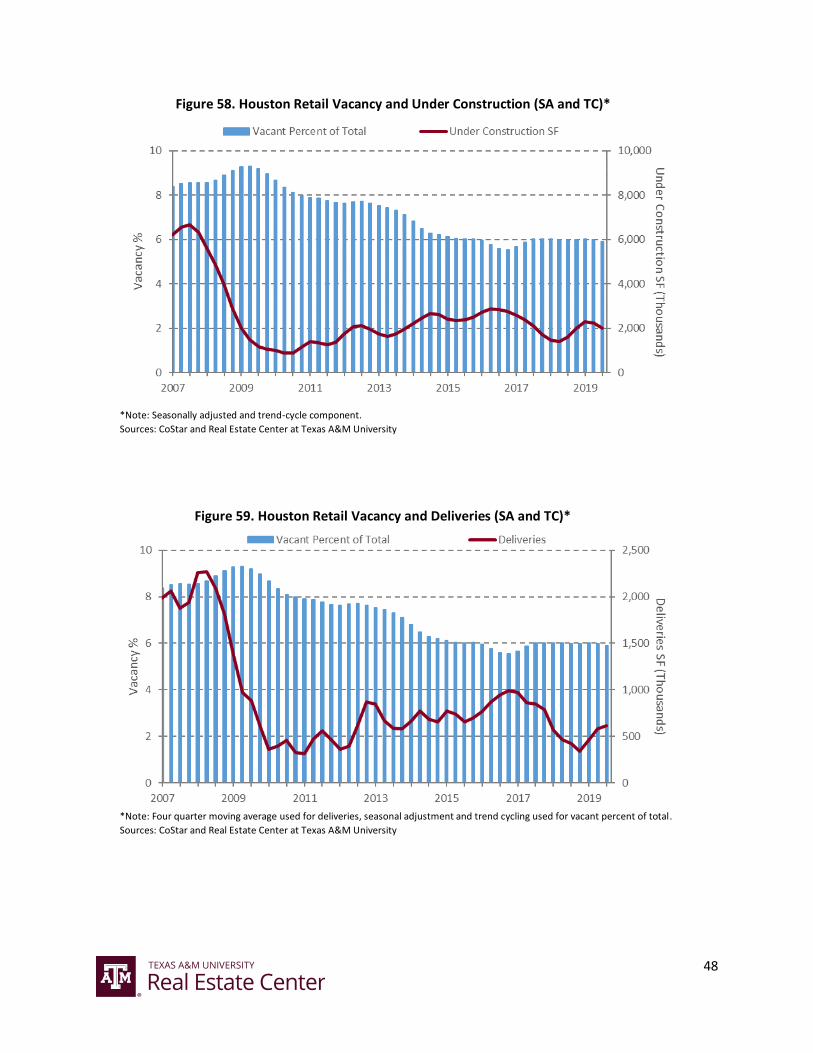
Retail (Figures 56 - 60)
After rising above the natural vacancy of 8.0 percent during the Great Recession, actual vacancy
has since trended downward, remaining stable between 5.5 and 6.0 percent since 2Q2015.
Retail employment growth trended downward from 2016 to the end of 2019, entering negative
growth in 3Q2017. Beginning in 1Q2019, employment growth increased through 3Q2019 while
still remaining negative. Net absorption for retail space in the MSA has been strong and positive
since before the Great Recession. Despite negative employment growth, low vacancies and
solid net absorption suggest a strong demand for retail space in Houston. Actual vacancy is
projected to average 5.9 and 5.8 percent for 2019 and 2020. Asking rent growth trended
downward in response to the oil downturn in 2014, barely dipping into negative territory in
14
mid-2016 before trending back upward. Rent growth is expected to remain healthy, averaging
4.7 percent in 2019 and 3.0 percent in 2020.
Construction starts have been consistently declining since their peak in 3Q2016. Square footage
under construction and delivered followed suit, though their trend is much more gradual. A
brief increase in the square feet under construction occurred during the first half of 2019.
Deliveries increased in the last three quarters as these projects reached completion.
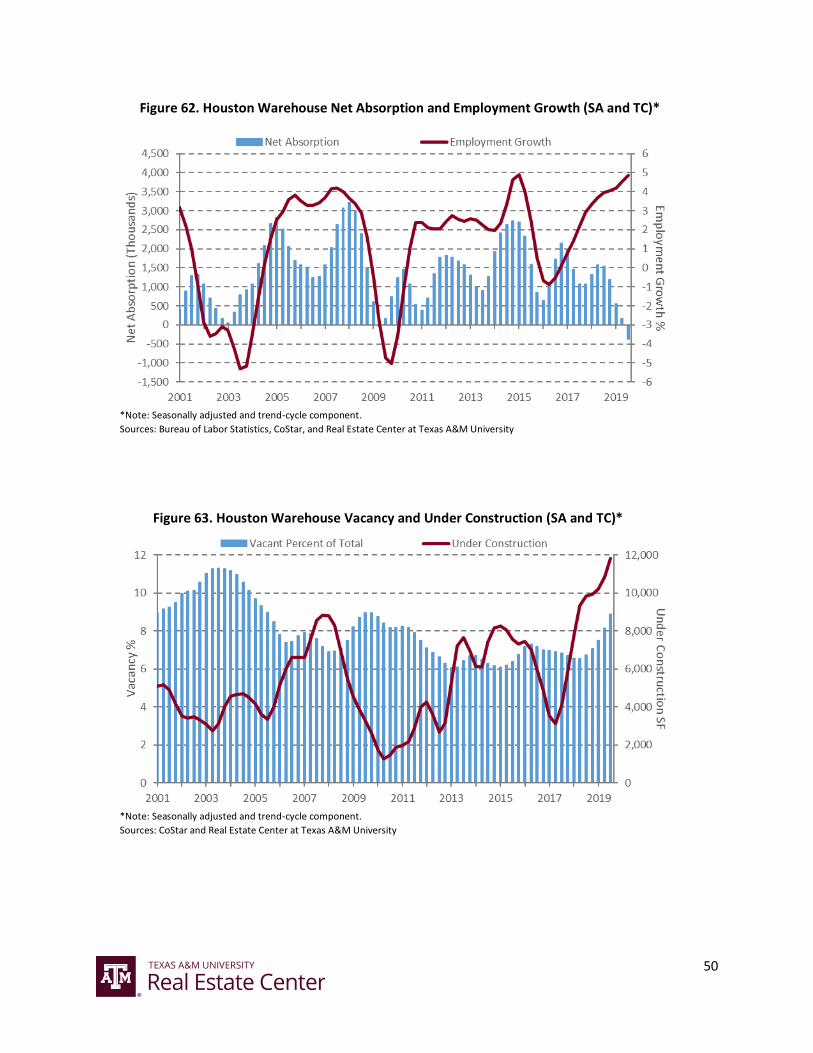
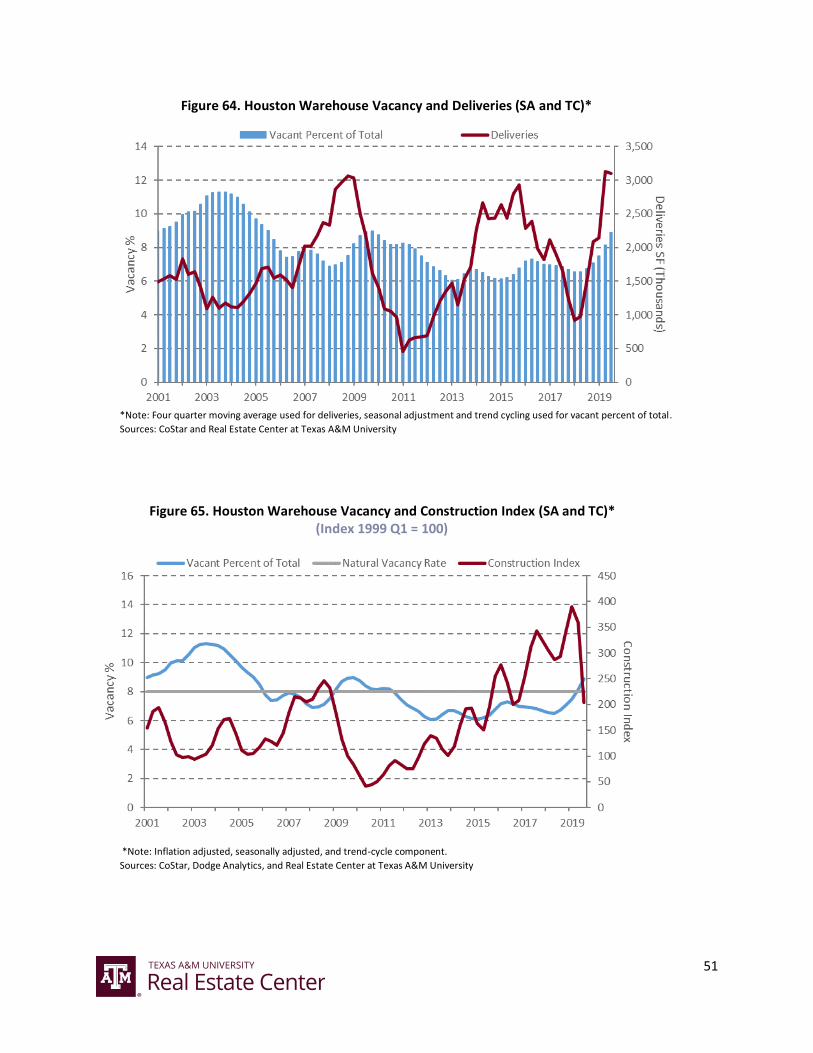
Warehouse (Figures 61 - 65)
Actual vacancy climbed above natural vacancy (8.0 percent) for the second consecutive quarter
in 3Q2019. Vacancies have been on the rise since the last half of 2018. Warehouse employment
growth fell from a record peak in 1Q2015, entering into negative territory in 2016. Since this
fall, employment growth has skyrocketed. 3Q2019 employment growth is just shy of the
1Q2015 record. Contrary to employment growth, net absorption has generally declined since
2015, with the exception of two modest increases. The trend indicates negative levels of
absorption in coming quarters. While strong warehouse employment growth is promising, the
upward trend in vacancies and downward trend in net absorption suggest weakening demand
for warehouse space in Houston. Actual vacancy is forecasted to average 8.2 and 8.4 percent in
2019 and 2020, respectively. Asking rent growth fell sharply after the oil downturn of 2014,
entering negative territory for five consecutive quarters (1Q2017-1Q2018), before bouncing
back. Rent growth has slowed in all three quarters of 2019 while still remaining positive. Asking
rent growth is expected to average 3.0 and 1.4 percent in 2019 and 2020, respectively.
Generally, construction starts have trended upward since the recovery of the Great Recession.
However, they began to fall sharply in 2019, likely a response of developers’ concern for
weakening demand for space and declining rent growth in the MSA. The amount of space under
construction has surged since 2Q2017 due to the high value of construction starts over the
years. As expected, deliveries have lagged just behind the space under construction, having
begun their surge in 2Q2018.

15
Table 3. Projected Overall Vacancy Rates and Asking Rent Growth
Vacancy Rates (%) Asking Rents (y-o-y %)
Property Type
Natural Vacancy
Rate 2018 2019 2020 2018 2019 2020
Office Overall 14.0 19.9 19.9 20.2 2.6 2.6 1.0
Office Class A 16.0 23.8 22.8 23.0 1.6 3.1 1.0
Retail 8.0 6.0 5.9 5.8 3.4 4.7 3.0
Warehouse 8.0 6.7 8.2 8.4 4.0 3.0 1.4 Note: Annual numbers represent the four-quarter average of the seasonally adjusted data. Rent growth is nominally estimated from the previous year’s average. Sources: CoStar and the Real Estate Center at Texas A&M University
16
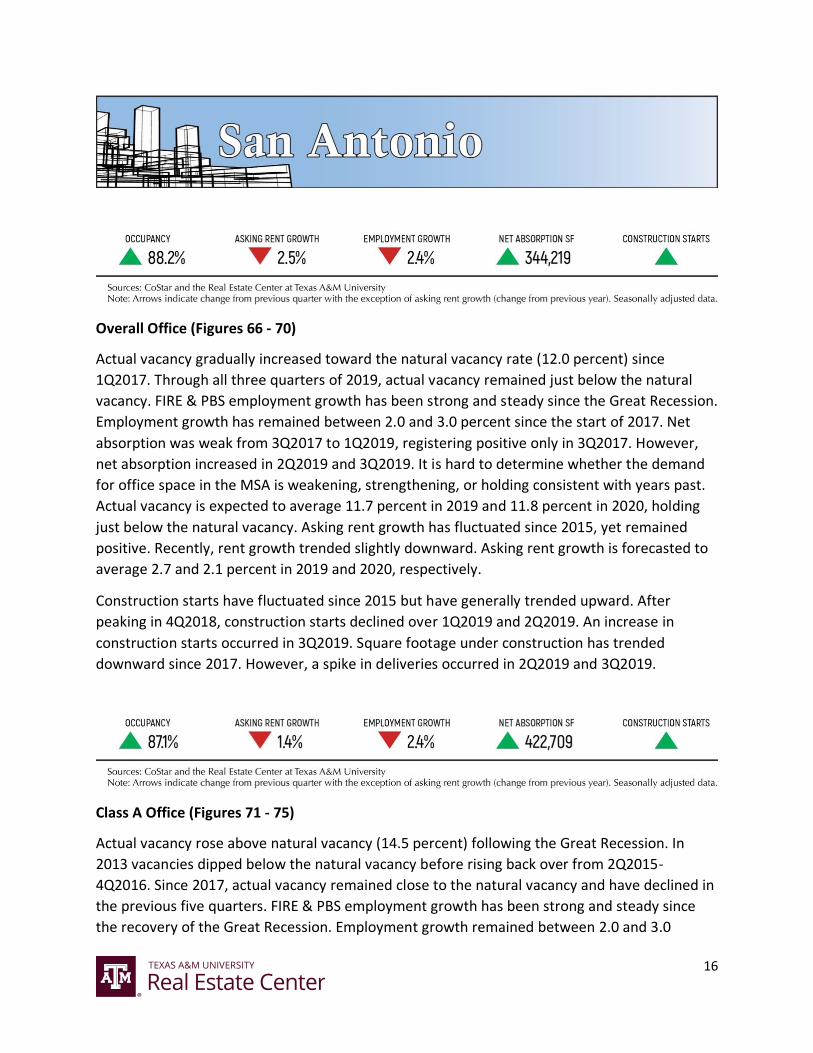
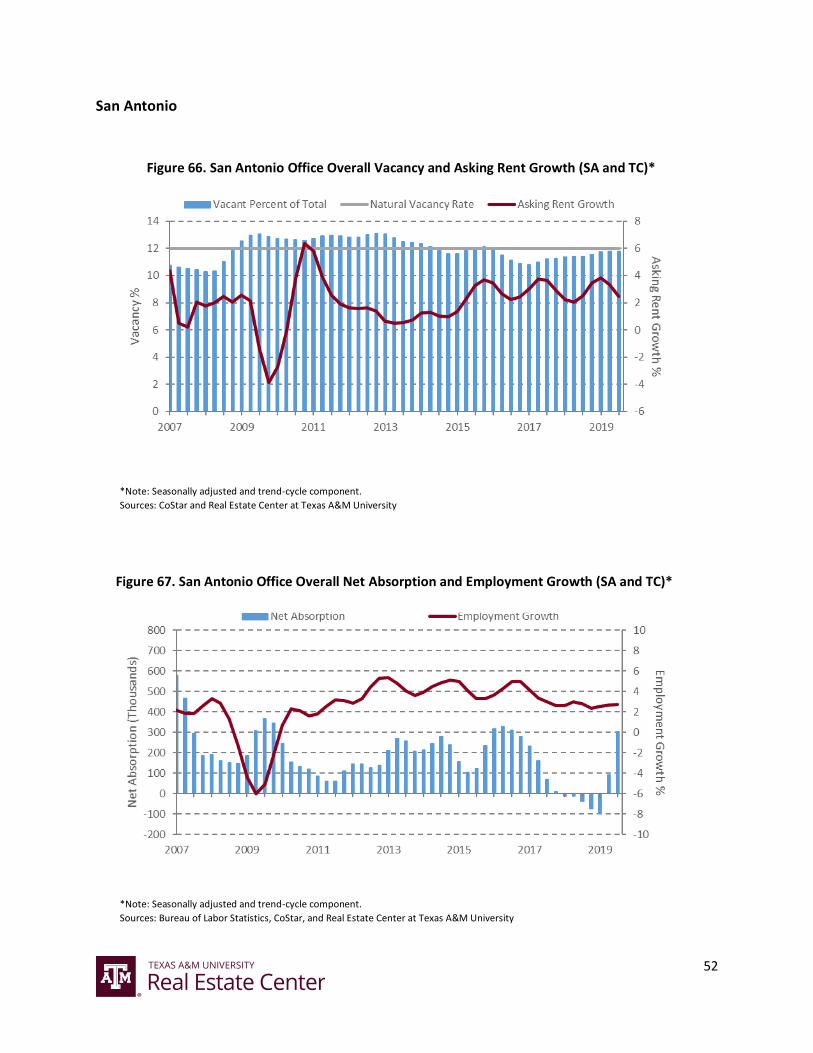
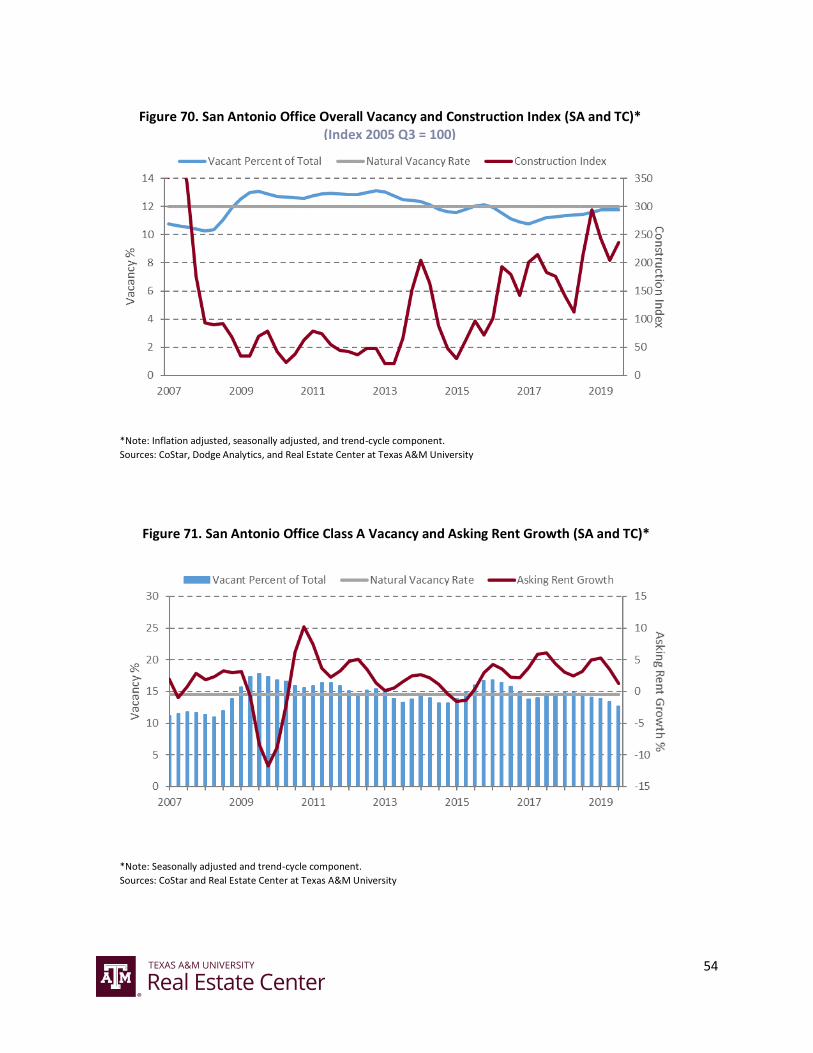
Overall Office (Figures 66 - 70)
Actual vacancy gradually increased toward the natural vacancy rate (12.0 percent) since
1Q2017. Through all three quarters of 2019, actual vacancy remained just below the natural
vacancy. FIRE & PBS employment growth has been strong and steady since the Great Recession.
Employment growth has remained between 2.0 and 3.0 percent since the start of 2017. Net
absorption was weak from 3Q2017 to 1Q2019, registering positive only in 3Q2017. However,
net absorption increased in 2Q2019 and 3Q2019. It is hard to determine whether the demand
for office space in the MSA is weakening, strengthening, or holding consistent with years past.
Actual vacancy is expected to average 11.7 percent in 2019 and 11.8 percent in 2020, holding
just below the natural vacancy. Asking rent growth has fluctuated since 2015, yet remained
positive. Recently, rent growth trended slightly downward. Asking rent growth is forecasted to
average 2.7 and 2.1 percent in 2019 and 2020, respectively.
Construction starts have fluctuated since 2015 but have generally trended upward. After
peaking in 4Q2018, construction starts declined over 1Q2019 and 2Q2019. An increase in
construction starts occurred in 3Q2019. Square footage under construction has trended
downward since 2017. However, a spike in deliveries occurred in 2Q2019 and 3Q2019.
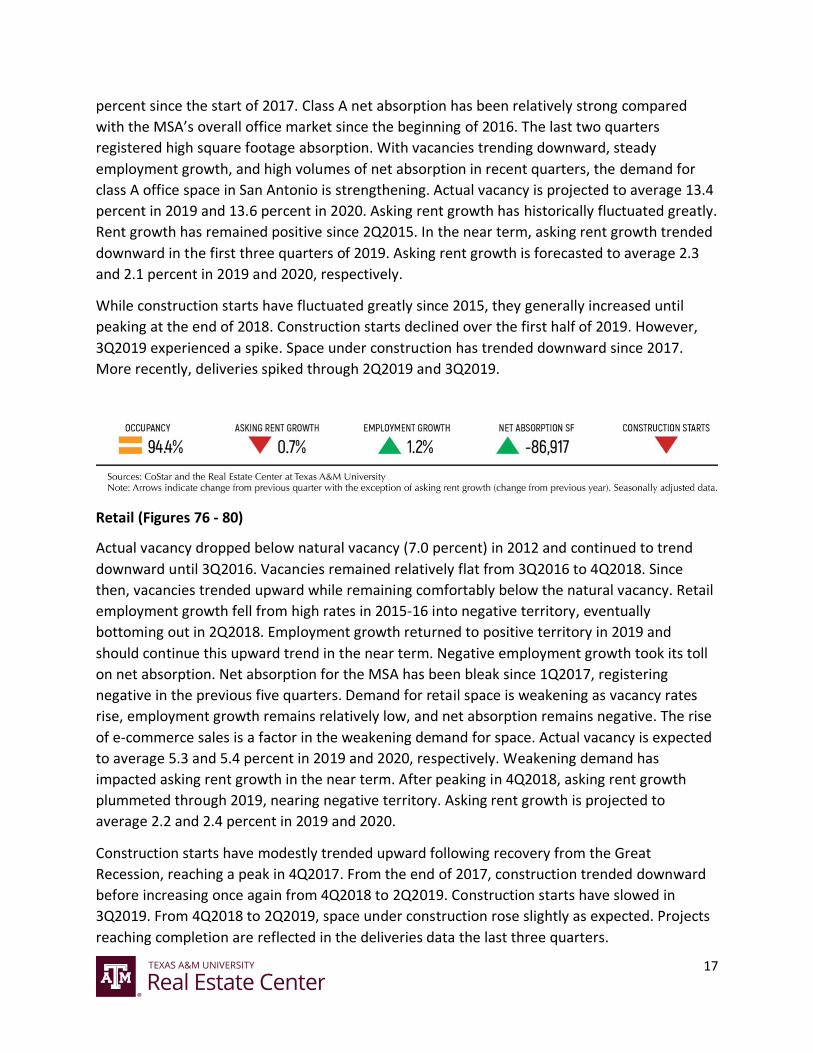
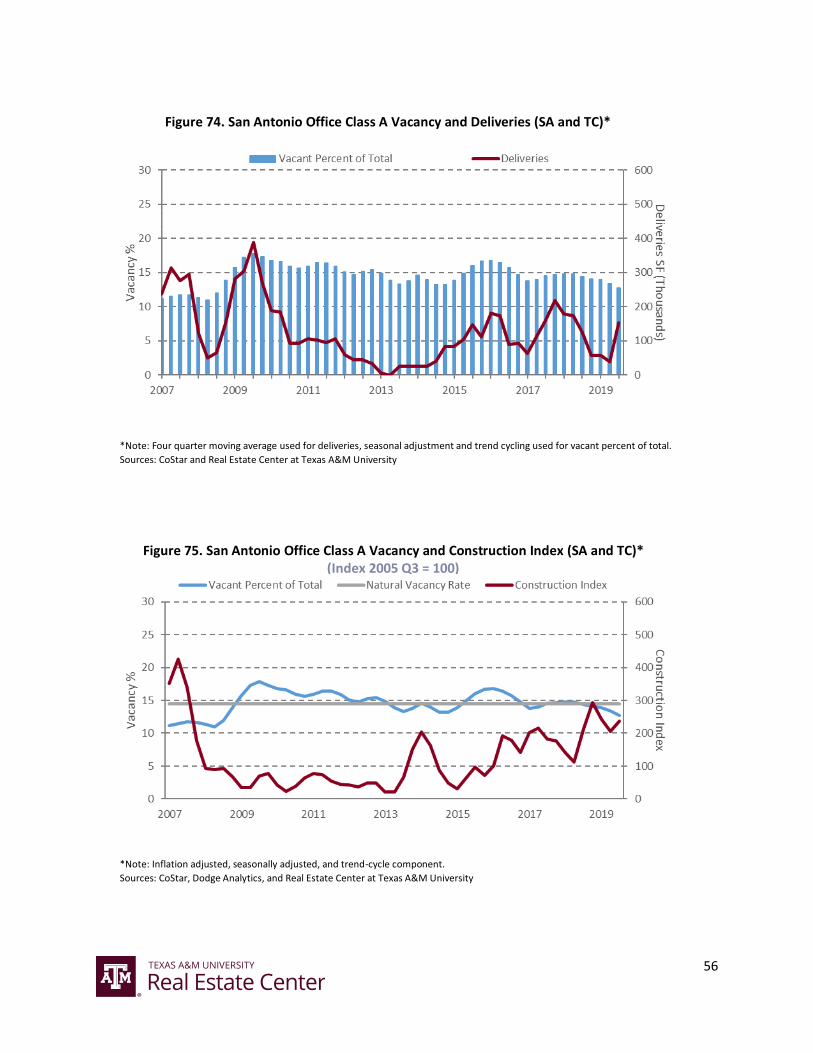
Class A Office (Figures 71 - 75)
Actual vacancy rose above natural vacancy (14.5 percent) following the Great Recession. In
2013 vacancies dipped below the natural vacancy before rising back over from 2Q2015-
4Q2016. Since 2017, actual vacancy remained close to the natural vacancy and have declined in
the previous five quarters. FIRE & PBS employment growth has been strong and steady since
the recovery of the Great Recession. Employment growth remained between 2.0 and 3.0
17
percent since the start of 2017. Class A net absorption has been relatively strong compared
with the MSA’s overall office market since the beginning of 2016. The last two quarters
registered high square footage absorption. With vacancies trending downward, steady
employment growth, and high volumes of net absorption in recent quarters, the demand for
class A office space in San Antonio is strengthening. Actual vacancy is projected to average 13.4
percent in 2019 and 13.6 percent in 2020. Asking rent growth has historically fluctuated greatly.
Rent growth has remained positive since 2Q2015. In the near term, asking rent growth trended
downward in the first three quarters of 2019. Asking rent growth is forecasted to average 2.3
and 2.1 percent in 2019 and 2020, respectively.
While construction starts have fluctuated greatly since 2015, they generally increased until
peaking at the end of 2018. Construction starts declined over the first half of 2019. However,
3Q2019 experienced a spike. Space under construction has trended downward since 2017.
More recently, deliveries spiked through 2Q2019 and 3Q2019.
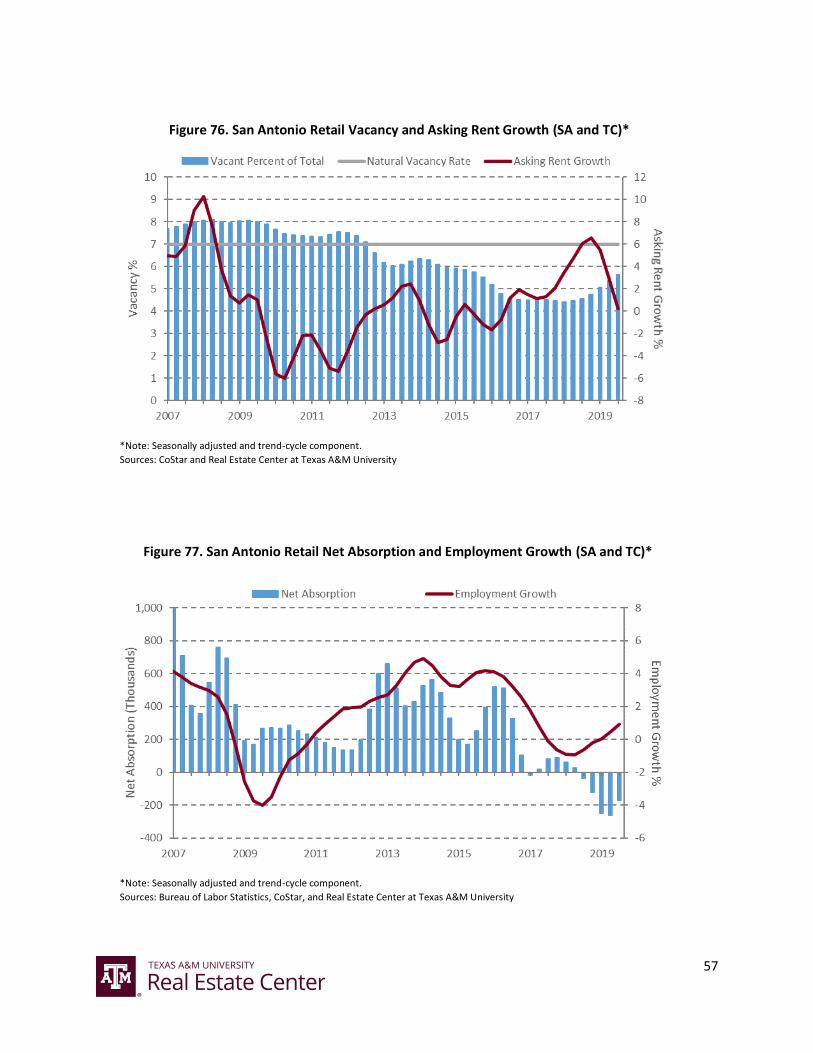
Retail (Figures 76 - 80)
Actual vacancy dropped below natural vacancy (7.0 percent) in 2012 and continued to trend
downward until 3Q2016. Vacancies remained relatively flat from 3Q2016 to 4Q2018. Since
then, vacancies trended upward while remaining comfortably below the natural vacancy. Retail
employment growth fell from high rates in 2015-16 into negative territory, eventually
bottoming out in 2Q2018. Employment growth returned to positive territory in 2019 and
should continue this upward trend in the near term. Negative employment growth took its toll
on net absorption. Net absorption for the MSA has been bleak since 1Q2017, registering
negative in the previous five quarters. Demand for retail space is weakening as vacancy rates
rise, employment growth remains relatively low, and net absorption remains negative. The rise
of e-commerce sales is a factor in the weakening demand for space. Actual vacancy is expected
to average 5.3 and 5.4 percent in 2019 and 2020, respectively. Weakening demand has
impacted asking rent growth in the near term. After peaking in 4Q2018, asking rent growth
plummeted through 2019, nearing negative territory. Asking rent growth is projected to
average 2.2 and 2.4 percent in 2019 and 2020.
Construction starts have modestly trended upward following recovery from the Great
Recession, reaching a peak in 4Q2017. From the end of 2017, construction trended downward
before increasing once again from 4Q2018 to 2Q2019. Construction starts have slowed in
3Q2019. From 4Q2018 to 2Q2019, space under construction rose slightly as expected. Projects
reaching completion are reflected in the deliveries data the last three quarters.
18
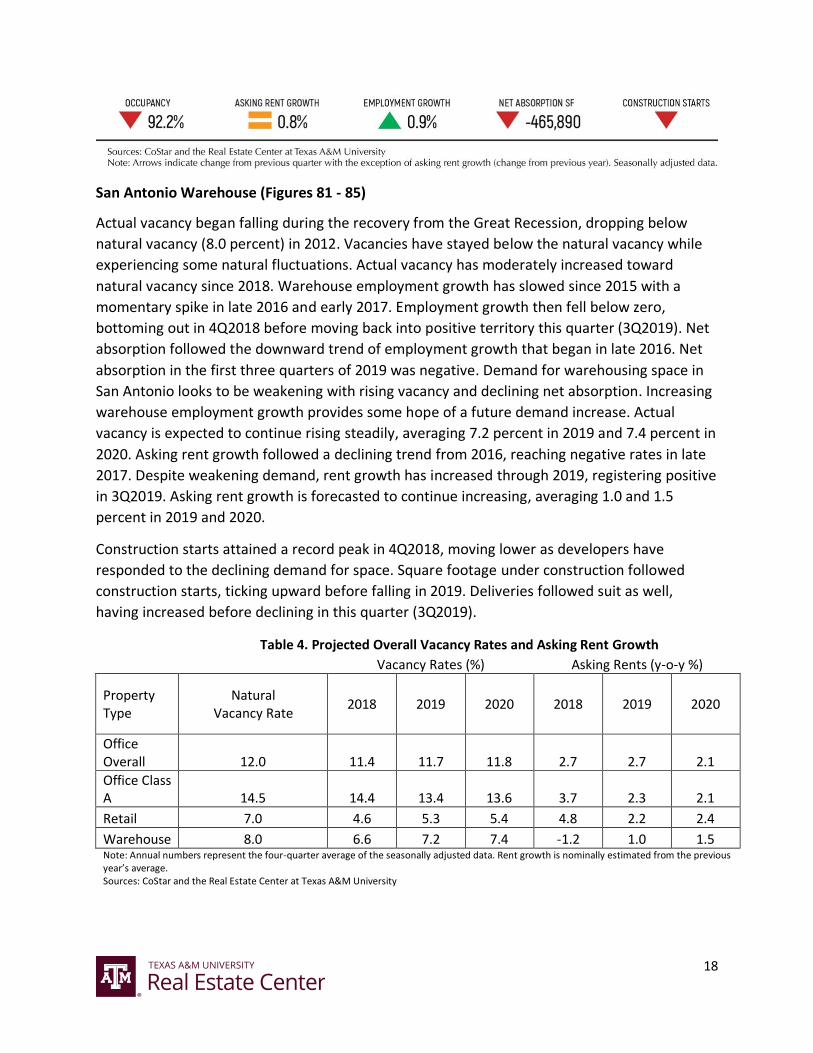
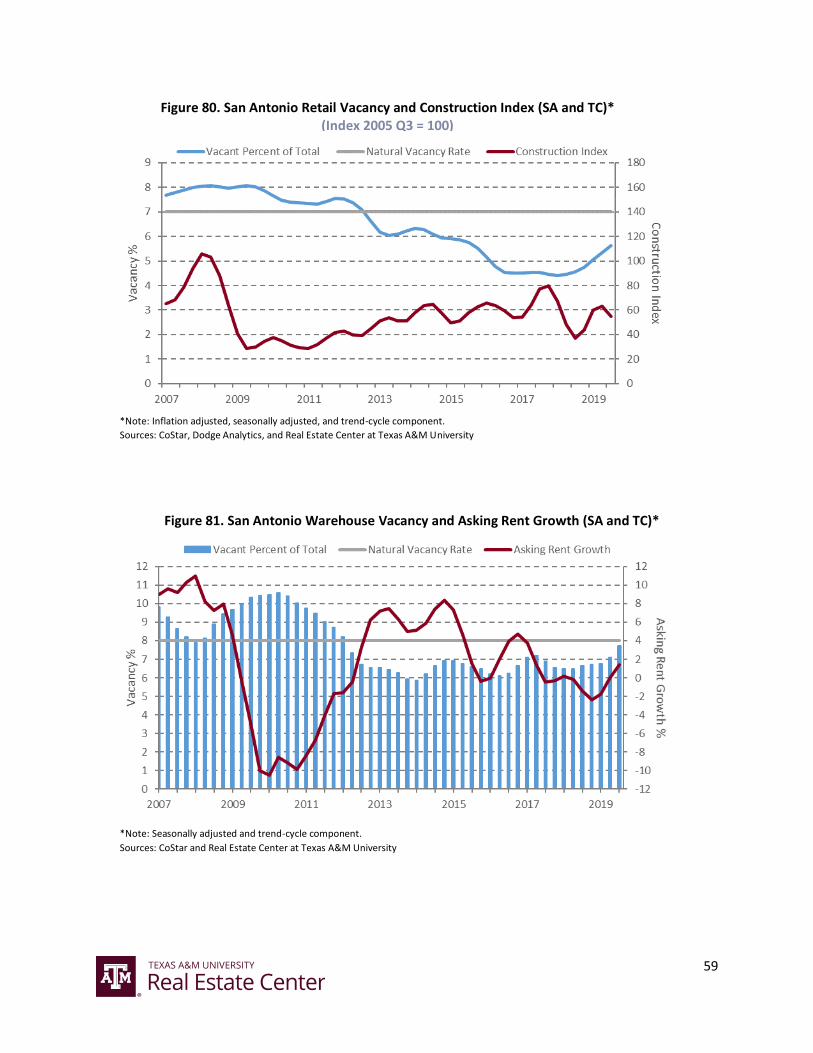
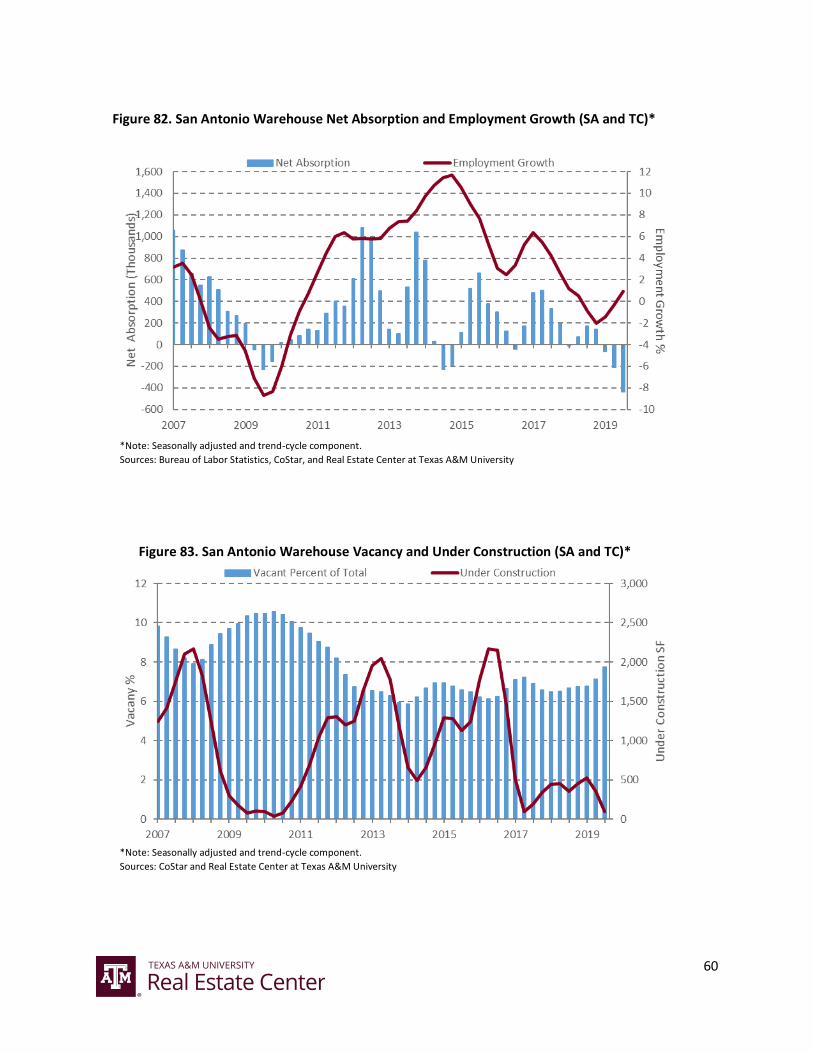
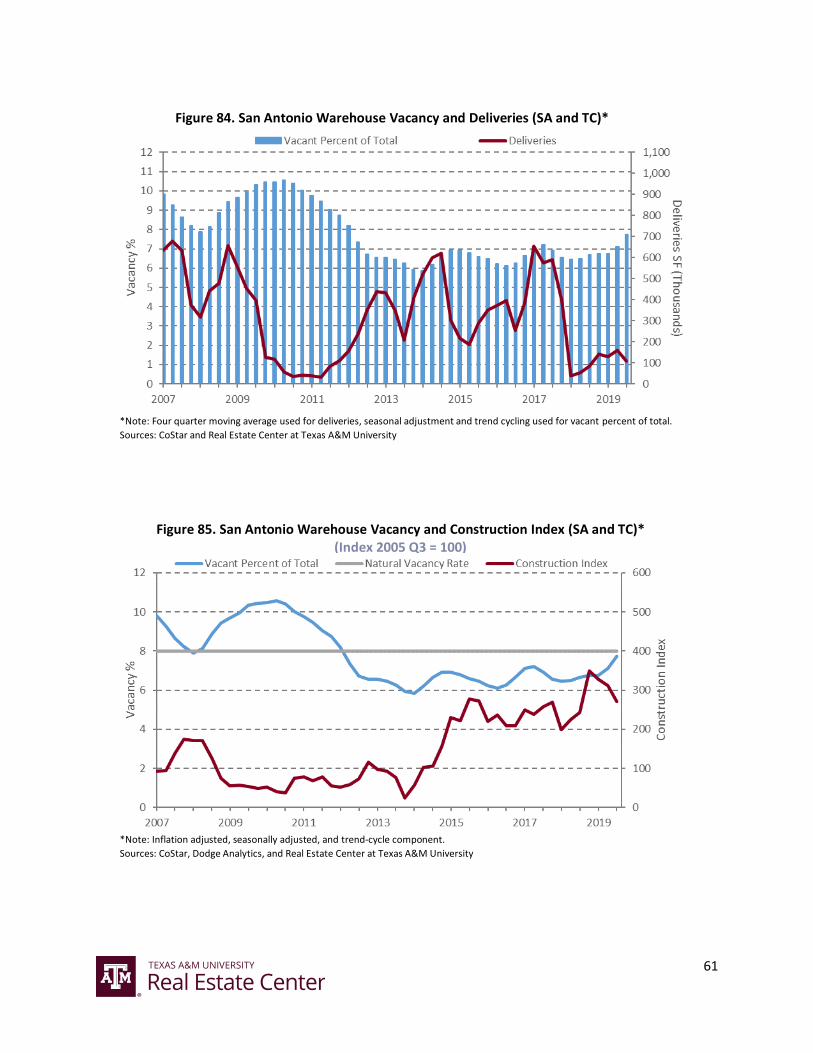
San Antonio Warehouse (Figures 81 - 85)
Actual vacancy began falling during the recovery from the Great Recession, dropping below
natural vacancy (8.0 percent) in 2012. Vacancies have stayed below the natural vacancy while
experiencing some natural fluctuations. Actual vacancy has moderately increased toward
natural vacancy since 2018. Warehouse employment growth has slowed since 2015 with a
momentary spike in late 2016 and early 2017. Employment growth then fell below zero,
bottoming out in 4Q2018 before moving back into positive territory this quarter (3Q2019). Net
absorption followed the downward trend of employment growth that began in late 2016. Net
absorption in the first three quarters of 2019 was negative. Demand for warehousing space in
San Antonio looks to be weakening with rising vacancy and declining net absorption. Increasing
warehouse employment growth provides some hope of a future demand increase. Actual
vacancy is expected to continue rising steadily, averaging 7.2 percent in 2019 and 7.4 percent in
2020. Asking rent growth followed a declining trend from 2016, reaching negative rates in late
2017. Despite weakening demand, rent growth has increased through 2019, registering positive
in 3Q2019. Asking rent growth is forecasted to continue increasing, averaging 1.0 and 1.5
percent in 2019 and 2020.
Construction starts attained a record peak in 4Q2018, moving lower as developers have
responded to the declining demand for space. Square footage under construction followed
construction starts, ticking upward before falling in 2019. Deliveries followed suit as well,
having increased before declining in this quarter (3Q2019).
Table 4. Projected Overall Vacancy Rates and Asking Rent Growth
Vacancy Rates (%) Asking Rents (y-o-y %)
Property Type
Natural Vacancy Rate
2018 2019 2020 2018 2019 2020
Office Overall 12.0 11.4 11.7 11.8 2.7 2.7 2.1
Office Class A 14.5 14.4 13.4 13.6 3.7 2.3 2.1
Retail 7.0 4.6 5.3 5.4 4.8 2.2 2.4
Warehouse 8.0 6.6 7.2 7.4 -1.2 1.0 1.5 Note: Annual numbers represent the four-quarter average of the seasonally adjusted data. Rent growth is nominally estimated from the previous year’s average. Sources: CoStar and the Real Estate Center at Texas A&M University
19
Source: Real Estate Center at Texas A&M University
Source: Real Estate Center at Texas A&M University
Figure 1. Texas Nonresidential Construction Coincident and Leading Indicators (Index Oct. 1990 = 100)
Figure 2. Austin Nonresidential Construction Leading Indicators (Index 2006 Q1 = 100)

20
Source: Real Estate Center at Texas A&M University
Source: Real Estate Center at Texas A&M University
Figure 3. DFW Nonresidential Construction Leading Indicators (Index 2006 Q1 = 100)
Figure 4. Houston Nonresidential Construction Leading Indicators (Index 2006 Q1 = 100)

21
Source: Real Estate Center at Texas A&M University
Figure 5. San Antonio Nonresidential Construction Leading Indicators (Index 2006 Q1 = 100)
22
Austin
*Note: Seasonally adjusted and trend-cycle component.
Sources: CoStar and Real Estate Center at Texas A&M University
*Note: Seasonally adjusted and trend-cycle component.
Sources: Bureau of Labor Statistics, CoStar, and Real Estate Center at Texas A&M University
Figure 6. Austin Office Overall Vacancy and Asking Rent Growth (SA and TC)*
Figure 7. Austin Office Overall Net Absorption and Employment Growth (SA and TC)*
23
*Note: Seasonally adjusted and trend-cycle component.
Sources: CoStar and Real Estate Center at Texas A&M University
*Note: Four quarter moving average used for deliveries, seasonal adjustment and trend cycling used for vacant percent of total.
Sources: CoStar and Real Estate Center at Texas A&M University
Figure 8. Austin Office Overall Vacancy and Under Construction (SA and TC)*
Figure 9. Austin Office Overall Vacancy and Deliveries (SA and TC)*
24
*Note: Inflation adjusted, seasonally adjusted, and trend-cycle component.
Sources: CoStar, Dodge Analytics, and Real Estate Center at Texas A&M University
*Note: Seasonally adjusted and trend-cycle component.
Sources: CoStar and Real Estate Center at Texas A&M University
Figure 10. Austin Office Overall Vacancy and Construction Index (SA and TC)* (Index 2000 Q4 = 100)
Figure 11. Austin Office Class A Vacancy and Asking Rent Growth (SA and TC)*
25
*Note: Seasonally adjusted and trend-cycle component.
Sources: Bureau of Labor Statistics, CoStar, and Real Estate Center at Texas A&M University
*Note: Seasonally adjusted and trend-cycle component.
Sources: CoStar and Real Estate Center at Texas A&M University
Figure 12. Austin Office Class A Net Absorption and Employment Growth (SA and TC)*
Figure 13. Austin Office Class A Vacancy and Under Construction (SA and TC)*

26
*Note: Four quarter moving average used for deliveries, seasonal adjustment and trend cycling used for vacant percent of total.
Sources: CoStar and Real Estate Center at Texas A&M University
*Note: Inflation adjusted, seasonally adjusted, and trend-cycle component.
Sources: CoStar, Dodge Analytics, and Real Estate Center at Texas A&M University
Figure 15. Austin Office Class A Vacancy and Construction Index (SA and TC)* (Index 2000 Q4 = 100)
Figure 14. Austin Office Class A Vacancy and Deliveries (SA and TC)*
27
*Note: Seasonally adjusted and trend-cycle component.
Sources: CoStar and Real Estate Center at Texas A&M University
*Note: Seasonally adjusted and trend-cycle component.
Sources: Bureau of Labor Statistics, CoStar, and Real Estate Center at Texas A&M University
Figure 16. Austin Retail Vacancy and Asking Rent Growth (SA and TC)*
Figure 17. Austin Retail Net Absorption SF and Employment Growth (SA and TC)*
28
*Note: Seasonally adjusted and trend-cycle component.
Sources: CoStar and Real Estate Center at Texas A&M University
*Note: Seasonally adjusted and trend-cycle component.
Sources: CoStar and Real Estate Center at Texas A&M University
Figure 18. Austin Retail Vacancy and Under Construction (SA and TC)*
Figure 19. Austin Retail Vacancy and Deliveries (SA and TC)*

29
*Note: Inflation adjusted, seasonally adjusted, and trend-cycle component.
Sources: CoStar, Dodge Analytics, and Real Estate Center at Texas A&M University
*Note: Seasonally adjusted and trend-cycle component.
Sources: CoStar and Real Estate Center at Texas A&M University
Figure 20. Austin Retail Vacancy and Construction Index (SA and TC)* (Index 2006 Q1 = 100)
Figure 21. Austin Warehouse Vacancy and Asking Rent Growth (SA and TC)*

30
*Note: Seasonally adjusted and trend-cycle component.
Sources: Bureau of Labor Statistics, CoStar, and Real Estate Center at Texas A&M University
*Note: Seasonally adjusted and trend-cycle component.
Sources: CoStar and Real Estate Center at Texas A&M University
Figure 22. Austin Warehouse Net Absorption and Employment Growth (SA and TC)*
Figure 23. Austin Warehouse Vacancy and Under Construction (SA and TC)*
31
*Note: Four quarter moving average used for deliveries, seasonal adjustment and trend cycling used for vacant percent of total.
Sources: CoStar and Real Estate Center at Texas A&M University
*Note: Inflation adjusted, seasonally adjusted, and trend-cycle component.
Sources: CoStar, Dodge Analytics, and Real Estate Center at Texas A&M University
Figure 24. Austin Warehouse Vacancy and Deliveries (SA and TC)*
Figure 25. Austin Warehouse Vacancy and Construction Index (SA and TC)* (Index 2000 Q4 = 100)
32
DFW
*Note: Seasonally adjusted and trend-cycle component.
Sources: CoStar and Real Estate Center at Texas A&M University
*Note: Seasonally adjusted and trend-cycle component.
Sources: Bureau of Labor Statistics, CoStar, and Real Estate Center at Texas A&M University
Figure 26. DFW Office Overall Vacancy and Asking Rent Growth (SA and TC)*
Figure 27. DFW Office Overall Net Absorption and Employment Growth (SA and TC)*
33
*Note: Seasonally adjusted and trend-cycle component.
Sources: CoStar and Real Estate Center at Texas A&M University
*Note: Four quarter moving average used for deliveries, seasonal adjustment and trend cycling used for vacant percent of total.
Sources: CoStar and Real Estate Center at Texas A&M University
Figure 28. DFW Office Overall Vacancy and Under Construction (SA and TC)*
Figure 29. DFW Office Overall Vacancy and Deliveries (SA and TC)*

34
*Note: Inflation adjusted, seasonally adjusted, and trend-cycle component.
Sources: CoStar, Dodge Analytics, and Real Estate Center at Texas A&M University
*Note: Seasonally adjusted and trend-cycle component.
Sources: CoStar and Real Estate Center at Texas A&M University
Figure 30. DFW Office Overall Vacancy and Construction Index (SA and TC)* (Index 1982 Q1 = 100)
Figure 31. DFW Office Class A Vacancy and Asking Rent Growth (SA and TC)*
35
*Note: Seasonally adjusted and trend-cycle component.
Sources: Bureau of Labor Statistics, CoStar, and Real Estate Center at Texas A&M University
*Note: Seasonally adjusted and trend-cycle component.
Sources: CoStar and Real Estate Center at Texas A&M University
Figure 33. DFW Office Class A Vacancy and Under Construction (SA and TC)*
Figure 32. DFW Office Class A Net Absorption and Employment Growth (SA and TC)*
36
*Note: Four quarter moving average used for deliveries, seasonal adjustment and trend cycling used for vacant percent of total.
Sources: CoStar and Real Estate Center at Texas A&M University
*Note: Inflation adjusted, seasonally adjusted, and trend-cycle component.
Sources: CoStar, Dodge Analytics, and Real Estate Center at Texas A&M University
Figure 35. DFW Office Class A Vacancy and Construction Index (SA and TC)* (Index 1982 Q1 = 100)
Figure 34. DFW Office Class A Vacancy and Deliveries (SA and TC)*
37
*Note: Seasonally adjusted and trend-cycle component.
Sources: CoStar and Real Estate Center at Texas A&M University
*Note: Seasonally adjusted and trend-cycle component.
Sources: Bureau of Labor Statistics, CoStar, and Real Estate Center at Texas A&M University
Figure 36. DFW Retail Vacancy and Asking Rent Growth (SA and TC)*
Figure 37. DFW Retail Net Absorption and Employment Growth (SA and TC)*
38
*Note: Seasonally adjusted and trend-cycle component.
Sources: CoStar and Real Estate Center at Texas A&M University
*Note: Four quarter moving average used for deliveries, seasonal adjustment and trend cycling used for vacant percent of total.
Sources: CoStar and Real Estate Center at Texas A&M University
Figure 38. DFW Retail Vacancy and Under Construction (SA and TC)*
Figure 39. DFW Retail Vacancy and Deliveries (SA and TC)*
39
*Note: Inflation adjusted, seasonally adjusted, and trend-cycle component.
Sources: CoStar, Dodge Analytics, and Real Estate Center at Texas A&M University
*Note: Seasonally adjusted and trend-cycle component.
Sources: CoStar and Real Estate Center at Texas A&M University
Figure 40. DFW Retail Vacancy and Construction Index (SA and TC)* (Index 2000 Q1 = 100)
Figure 41. DFW Warehouse Vacancy and Asking Rent Growth (SA and TC)*
40
*Note: Seasonally adjusted and trend-cycle component.
Sources: Bureau of Labor Statistics, CoStar, and Real Estate Center at Texas A&M University
*Note: Seasonally adjusted and trend-cycle component.
Sources: CoStar and Real Estate Center at Texas A&M University
Figure 42. DFW Warehouse Net Absorption and Employment Growth (SA and TC)*
Figure 43. DFW Warehouse Vacancy and Under Construction (SA and TC)*

41
*Note: Four quarter moving average used for deliveries, seasonal adjustment and trend cycling used for vacant percent of total.
Sources: CoStar and Real Estate Center at Texas A&M University
*Note: Inflation adjusted, seasonally adjusted, and trend-cycle component.
Sources: CoStar, Dodge Analytics, and Real Estate Center at Texas A&M University
Figure 44. DFW Warehouse Vacancy and Deliveries (SA and TC)*
Figure 45. DFW Warehouse Vacancy and Construction Index (SA and TC)* (Index 1995 Q1 = 100)
42
Houston
*Note: Seasonally adjusted and trend-cycle component.
Sources: CoStar and Real Estate Center at Texas A&M University
*Note: Seasonally adjusted and trend-cycle component.
Sources: Bureau of Labor Statistics, CoStar, and Real Estate Center at Texas A&M University
Figure 46. Houston Office Overall Vacancy and Asking Rent Growth (SA and TC)*
Figure 47. Houston Office Overall Net Absorption and Employment Growth (SA and TC)*
43
*Note: Seasonally adjusted and trend-cycle component.
Sources: CoStar and Real Estate Center at Texas A&M University
*Note: Four quarter moving average used for deliveries, seasonal adjustment and trend cycling used for vacant percent of total.
Sources: CoStar and Real Estate Center at Texas A&M University
Figure 48. Houston Office Overall Vacancy and Under Construction (SA and TC)*
Figure 49. Houston Office Overall Vacancy and Deliveries (SA and TC)*

44
*Note: Inflation adjusted, seasonally adjusted, and trend-cycle component.
Sources: CoStar, Dodge Analytics, and Real Estate Center at Texas A&M University
*Note: Seasonally adjusted and trend-cycle component.
Sources: CoStar and Real Estate Center at Texas A&M University
Figure 50. Houston Office Overall Vacancy and Construction Index (SA and TC)* (Index 1999 Q1 = 100)
Figure 51. Houston Office Class A Vacancy and Asking Rent Growth (SA and TC)*
45
*Note: Seasonally adjusted and trend-cycle component.
Sources: Bureau of Labor Statistics, CoStar, and Real Estate Center at Texas A&M University
*Note: Seasonally adjusted and trend-cycle component.
Sources: CoStar and Real Estate Center at Texas A&M University
Figure 53. Houston Office Class A Vacancy and Under Construction (SA and TC)*
Figure 52. Houston Office Class A Net Absorption and Employment Growth (SA and TC)*
46
*Note: Four quarter moving average used for deliveries, seasonal adjustment and trend cycling used for vacant percent of total.
Sources: CoStar and Real Estate Center at Texas A&M University
*Note: Inflation adjusted, seasonally adjusted, and trend-cycle component.
Sources: CoStar, Dodge Analytics, and Real Estate Center at Texas A&M University
Figure 55. Houston Office Class A Vacancy and Construction Index (SA and TC)* (Index 1999 Q1 = 100)
Figure 54. Houston Office Class A Vacancy and Deliveries (SA and TC)*
47
*Note: Seasonally adjusted and trend-cycle component.
Sources: CoStar and Real Estate Center at Texas A&M University
*Note: Seasonally adjusted and trend-cycle component.
Sources: Bureau of Labor Statistics, CoStar, and Real Estate Center at Texas A&M University
Figure 56. Houston Retail Vacancy and Asking Rent Growth (SA and TC)*
Figure 57. Houston Retail Net Absorption and Employment Growth (SA and TC)*
48
*Note: Seasonally adjusted and trend-cycle component.
Sources: CoStar and Real Estate Center at Texas A&M University
*Note: Four quarter moving average used for deliveries, seasonal adjustment and trend cycling used for vacant percent of total.
Sources: CoStar and Real Estate Center at Texas A&M University
Figure 58. Houston Retail Vacancy and Under Construction (SA and TC)*
Figure 59. Houston Retail Vacancy and Deliveries (SA and TC)*

49
*Note: Inflation adjusted, seasonally adjusted, and trend-cycle component.
Sources: CoStar, Dodge Analytics, and Real Estate Center at Texas A&M University
*Note: Seasonally adjusted and trend-cycle component.
Sources: CoStar and Real Estate Center at Texas A&M University
Figure 60. Houston Retail Vacancy and Construction Index (SA and TC)* (Index 2006 Q1 = 100)
Figure 61. Houston Warehouse Vacancy and Asking Rent Growth (SA and TC)*
50
*Note: Seasonally adjusted and trend-cycle component. Sources: Bureau of Labor Statistics, CoStar, and Real Estate Center at Texas A&M University
*Note: Seasonally adjusted and trend-cycle component.
Sources: CoStar and Real Estate Center at Texas A&M University
Figure 62. Houston Warehouse Net Absorption and Employment Growth (SA and TC)*
Figure 63. Houston Warehouse Vacancy and Under Construction (SA and TC)*
51
*Note: Four quarter moving average used for deliveries, seasonal adjustment and trend cycling used for vacant percent of total.
Sources: CoStar and Real Estate Center at Texas A&M University
*Note: Inflation adjusted, seasonally adjusted, and trend-cycle component.
Sources: CoStar, Dodge Analytics, and Real Estate Center at Texas A&M University
Figure 65. Houston Warehouse Vacancy and Construction Index (SA and TC)* (Index 1999 Q1 = 100)
Figure 64. Houston Warehouse Vacancy and Deliveries (SA and TC)*
52
San Antonio
*Note: Seasonally adjusted and trend-cycle component.
Sources: CoStar and Real Estate Center at Texas A&M University
*Note: Seasonally adjusted and trend-cycle component.
Sources: Bureau of Labor Statistics, CoStar, and Real Estate Center at Texas A&M University
Figure 66. San Antonio Office Overall Vacancy and Asking Rent Growth (SA and TC)*
Figure 67. San Antonio Office Overall Net Absorption and Employment Growth (SA and TC)*

53
*Note: Seasonally adjusted and trend-cycle component.
Sources: CoStar and Real Estate Center at Texas A&M University
*Note: Four quarter moving average used for deliveries, seasonal adjustment and trend cycling used for vacant percent of total.
Sources: CoStar and Real Estate Center at Texas A&M University
Figure 68. San Antonio Office Overall Vacancy and Under Construction (SA and TC)*
Figure 69. San Antonio Office Overall Vacancy and Deliveries (SA and
TC)*
54
*Note: Inflation adjusted, seasonally adjusted, and trend-cycle component.
Sources: CoStar, Dodge Analytics, and Real Estate Center at Texas A&M University
*Note: Seasonally adjusted and trend-cycle component.
Sources: CoStar and Real Estate Center at Texas A&M University
Figure 70. San Antonio Office Overall Vacancy and Construction Index (SA and TC)* (Index 2005 Q3 = 100)
Figure 71. San Antonio Office Class A Vacancy and Asking Rent Growth (SA and TC)*

55
*Note: Seasonally adjusted and trend-cycle component.
Sources: Bureau of Labor Statistics, CoStar, and Real Estate Center at Texas A&M University
*Note: Seasonally adjusted and trend-cycle component.
Sources: CoStar and Real Estate Center at Texas A&M University
Figure 72. San Antonio Office Class A Net Absorption and Employment Growth (SA and TC)*
Figure 73. San Antonio Office Class A Vacancy and Under Construction (SA and TC)*
56
*Note: Four quarter moving average used for deliveries, seasonal adjustment and trend cycling used for vacant percent of total.
Sources: CoStar and Real Estate Center at Texas A&M University
*Note: Inflation adjusted, seasonally adjusted, and trend-cycle component.
Sources: CoStar, Dodge Analytics, and Real Estate Center at Texas A&M University
Figure 75. San Antonio Office Class A Vacancy and Construction Index (SA and TC)* (Index 2005 Q3 = 100)
Figure 74. San Antonio Office Class A Vacancy and Deliveries (SA and TC)*
57
*Note: Seasonally adjusted and trend-cycle component.
Sources: CoStar and Real Estate Center at Texas A&M University
*Note: Seasonally adjusted and trend-cycle component.
Sources: Bureau of Labor Statistics, CoStar, and Real Estate Center at Texas A&M University
Figure 76. San Antonio Retail Vacancy and Asking Rent Growth (SA and TC)*
Figure 77. San Antonio Retail Net Absorption and Employment Growth (SA and TC)*

58
*Note: Seasonally adjusted and trend-cycle component.
Sources: CoStar and Real Estate Center at Texas A&M University
*Note: Four quarter moving average used for deliveries, seasonal adjustment and trend cycling used for vacant percent of total.
Sources: CoStar and Real Estate Center at Texas A&M University
Figure 78. San Antonio Retail Vacancy and Under Construction (SA and TC)*
Figure 79. San Antonio Retail Vacancy and Deliveries (SA and TC)*
59
*Note: Inflation adjusted, seasonally adjusted, and trend-cycle component.
Sources: CoStar, Dodge Analytics, and Real Estate Center at Texas A&M University
*Note: Seasonally adjusted and trend-cycle component.
Sources: CoStar and Real Estate Center at Texas A&M University
Figure 80. San Antonio Retail Vacancy and Construction Index (SA and TC)* (Index 2005 Q3 = 100)
Figure 81. San Antonio Warehouse Vacancy and Asking Rent Growth (SA and TC)*
60
*Note: Seasonally adjusted and trend-cycle component.
Sources: Bureau of Labor Statistics, CoStar, and Real Estate Center at Texas A&M University
*Note: Seasonally adjusted and trend-cycle component.
Sources: CoStar and Real Estate Center at Texas A&M University
Figure 82. San Antonio Warehouse Net Absorption and Employment Growth (SA and TC)*
Figure 83. San Antonio Warehouse Vacancy and Under Construction (SA and TC)*
61
*Note: Four quarter moving average used for deliveries, seasonal adjustment and trend cycling used for vacant percent of total.
Sources: CoStar and Real Estate Center at Texas A&M University
*Note: Inflation adjusted, seasonally adjusted, and trend-cycle component. Sources: CoStar, Dodge Analytics, and Real Estate Center at Texas A&M University
Figure 85. San Antonio Warehouse Vacancy and Construction Index (SA and TC)* (Index 2005 Q3 = 100)
Figure 84. San Antonio Warehouse Vacancy and Deliveries (SA and TC)*

62
Asking rents. The dollar amount per square foot the landlord requests from a tenant, excluding tenant improvements and concessions. Leases typically dictate this amount paid annually.
Construction Starts Index. Reflects the dollar value of construction starts in relation to a specified base year and is a precursor to future units under construction.
Dodge Analytics tracks commercial construction start figures as soon as a new project kicks off to estimate its total construction “value,” which is essentially total construction cost. We realize that some real estate professionals may question whether calling the total dollars to be spent on a project’s “construction value” actually equates to its “market value” at completion. However, for consistency, this report will use Dodge’s terminology.
Trend-cycle component. Removes the effects of accumulating data sets from a trend to show only the absolute changes in values while allowing potential cyclical patterns to be identified.
FIRE & PBS. A sector of the economy comprised of finance, insurance, and real estate. PBS employment represents professional and business services.
Net absorption. The net change in occupied space, measured in square feet, over a given period. Net absorption reflects the amount of space occupied as well as the amount of space vacated. Net absorption includes direct and sublease space.
Nominal. Value or rate reflecting current prices or rates, without adjusting for inflation.
Real. Value or rate reflecting current prices or rates adjusted for inflation.
Seasonal adjustment. A statistical method for removing the seasonal patterns in time series data.
SF. Square feet.
Under construction. The square footage being built within a particular market; applies to buildings that have not received a certificate of occupancy.
Vacancy rate. A measurement expressed as a percentage of the total amount of physically vacant space divided by the total amount of existing inventory.
63
Natural and actual vacancy.
The projected vacancy rates and rents for each commercial use in the four major metro areas
are made relative to each area’s natural vacancy rate for each property type.
The natural vacancy rate is the point at which zero real (inflation-adjusted) rent growth will
occur. Natural vacancy reflects the level to which current vacancy rates gravitate over the long
term.
The actual vacancy rate is seasonally adjusted and trend cycled to smooth fluctuations in the
data and provide a clearer, less volatile view of upward and downward movements.
Natural vacancies used to estimate the possibility of new construction are calculated separately
using historical construction data. The calculated natural vacancies were compared with the
actual vacancies to estimate whether new development could be expected in the various
commercial real estate markets. When actual vacancy in a local market falls below natural
vacancy, developers may consider building new space.
When actual vacancy in a local market falls below (rises above) natural vacancy, building
managers may consider increasing (decreasing) rents. A comparison of natural vacancy and
actual vacancy along with historical vacancy trends allows researchers to anticipate the future
direction of CRE rental rates in real terms. However, changes in asking rents in this report
reflect nominal changes since real estate professionals typically think in nominal terms.
Aggregate natural vacancy in an overall market may not reflect the vacancy rate an individual CRE professional uses to make decisions affecting a specific property or project. However, these measures indicate the direction of rents and new construction within the broader market.

i
ADVISORY COMMITTEE
MAYS BUSINESS SCHOOL
Texas A&M University 2115 TAMU
College Station, TX 77843-2115
http://recenter.tamu.edu 979-845-2031
DIRECTOR
GARY W. MALER
TROY ALLEY, JR. DeSoto
RUSSELL CAIN Port Lavaca
DOUG JENNINGS Fort Worth
BESA MARTIN Boerne
ALVIN COLLINS, CHAIRMAN Andrews
JJ CLEMENCE, VICE CHAIRMAN Sugar Land
TED NELSON HoustonDOUG ROBERTS AustinC. CLARK WELDER FredericksburgJAN FITE-MILLER, EX-OFFICIO Dallas
YouTubeYouTube.com/realestatecenter
Twitter@recentertx
FacebookInstagram@recentertx@recentertx
LinkedInlinkedin.com/company/recentertx