the 12th annual gallup poll of the public's attitudes
TRANSCRIPT

THE 12TH ANNUAL
GALLUP POLL OF THE PUBLIC'S
ATTITUDES TOWARD THE PUBLIC SCHOOLS
by George H. Gallup
Once again the Kappan is privileged to publish the full report of an attitude survey conducted by the Gallup Poll. The Gallup education polls are an established source of reliable information con cerning trends in opinion about significant school questions. For school officials, the polls are valu able in at least two important ways: They alert decision makers to overall public reaction to a variety of school programs and policies. And they serve as a national benchmark against which local attitudes may be measured.
If local officials wish to employ questions asked in the Gallup education surveys, they are welcome to do so. The questions are not copy righted. Moreover, no limitations are placed upon the use of information contained in this report,
beyond customary credit to source and observ ance of the usual canons of accuracy and com pleteness of quotation.
This year Phi Delta Kappa's Dissemination Divi sion, assisted by the Gallup Organization, is pre pared to help school districts and other agencies to survey local populations. For details of this ser vice, called PACE, see the box on page 46.
The Charles F. Kettering Foundation, through its affiliate, illDI ElAI, is now financing the educa tion poll, while Phi Delta Kappa has been author ized to publish it in full before distribution to other
media. We are grateful to B. Frank Brown and John Bahner of IIIDIEIAI and Kettering for their strong support of the project ? SME
SEPTEMBER 1980

Purpose of the Study
This survey, which measures the attitudes of Ameri cans toward their public schools, is the 12th annual survey in this series. Funding for the survey is currently provided by /l/D/E/A/, the Institute for Development of Educational Activities, Inc., an affiliate of the Charles F. Kettering Foundation. A great effort is made each year to deal with issues of greatest concern to both edu cators and to the public. New as well as trend questions are included in this and every survey.
To be sure that the survey would embrace the most important issues in the field of education, the Kettering
Foundation sent letters to educators across the nation asking for their ideas. Following this, an executive com mittee, including representatives of the Kettering Foundation and Gallup, met to discuss issues, evaluate proposed questions, and to suggest new questions for the survey.
We wish to thank all persons who contributed their ideas to this purvey.
Research Procedure
The Sample. The sample used in this survey em braced a total of 1,547 adults (18 years of age and older). It is described as a modified probability sample of the nation. Personal, in-home interviewing was conducted in all areas of the nation and in all types of communities.
A description of the sample will be found at the end of this report.
Time of Interviewing. The f ieldwork for this study was carried out during the period of 1-8 May 1980.
The Report. In the tables that follow, the heading "Parochial School Parents" includes not only parents of students who attend parochial schools but also parents of students who attend private or independent schools. This heading is used because parochial school students outnumber private or independent school students.
Due allowance must be made for statistical variation, especially in the case of findings for small groups where relatively few respondents were interviewed.
The findings of this report apply only to the U.S. as a whole and not to individual local communities. Local surveys, using the same questions, can be conducted to determine how local areas compare with the national norm.
Major Problems Confronting the Public Schools in 1980
Discipline continues to be cited most often when people are asked to name the major problems facing the public schools in their own communities. Approximate ly one person in every four names "discipline." As was the case last year, second place goes to the "use of dope and drugs." Named in third place is "poor cur riculum and poor standards."
Using such an "open" question permits persons interviewed to cite any problems that come to mind
without benefit of a list. In fact, they can name as many as they wish. This question approach permits any new problems that may arise in any part of the nation to find their way onto the list.
The list of problems, as named by the public this year, remains much the same as last year with no signifi cant changes.
Here is the question:
34 PHI DELTA KAPP AN
What do you think are the biggest problems with which the public schools in this community must deal?
Lack of discipline Use of dope/drugs Poor curriculum/poor standards
Lack of proper financial support Integration/busing (combined)
Large school/too many classes/overcrowding
Difficulty in getting good teachers
Parents' lack of interest Teachers' lack of
interest Pupils' lack of interest/ truancy
Crime/vandalism Mismanagement of
funds/programs Drinking/alcoholism Problems with adminis tration
Lack of proper facilities Communication prob
lems School board policies Government inter
ference Teachers' strikes Parents' involvement in school activities
Too many schools/de clining enrollment
Transportation Non-English-speaking students
There are no problems Miscellaneous Don't know
National Totals % 26 14
11
10
10
1 1
1 3 2 17
No Children In Schools
% 24 15
11
9
10
6
5 5
Public Parochial School School Parents Parents**
2 2
21
% 26 12
10
11
10
8
7 6
% 48 10
10
9
10
5
7 5
(Figures add to more than 100% because of multiple answers.) *Less than 1%. * includes parents of students attending private and independent
schools as well as parochial schools.
1980 Ratings of the Public Schools
Since 1974, when this rating series was first intro duced, there has been a decMne in the ratings given by the public to the public schools, but this decline has come to a halt. And there is some evidence from the results, although the changes are not statistically significant, that a turn has come.
The decline in the ratings may be due to changes in the emphasis placed upon the basics in many school districts, or to a better understanding among the general public of just what the schools are achieving. In any event, the downward trend has ended, at least for the present.
The question:
Students ar? often given the grades A, B, C, D, and FAIL to denote the quality of their work. Sup pose the public schools themselves, in this com munity, were graded in the same way. What grade would you give the public schools here ? A, B, C, D, or FAIL?
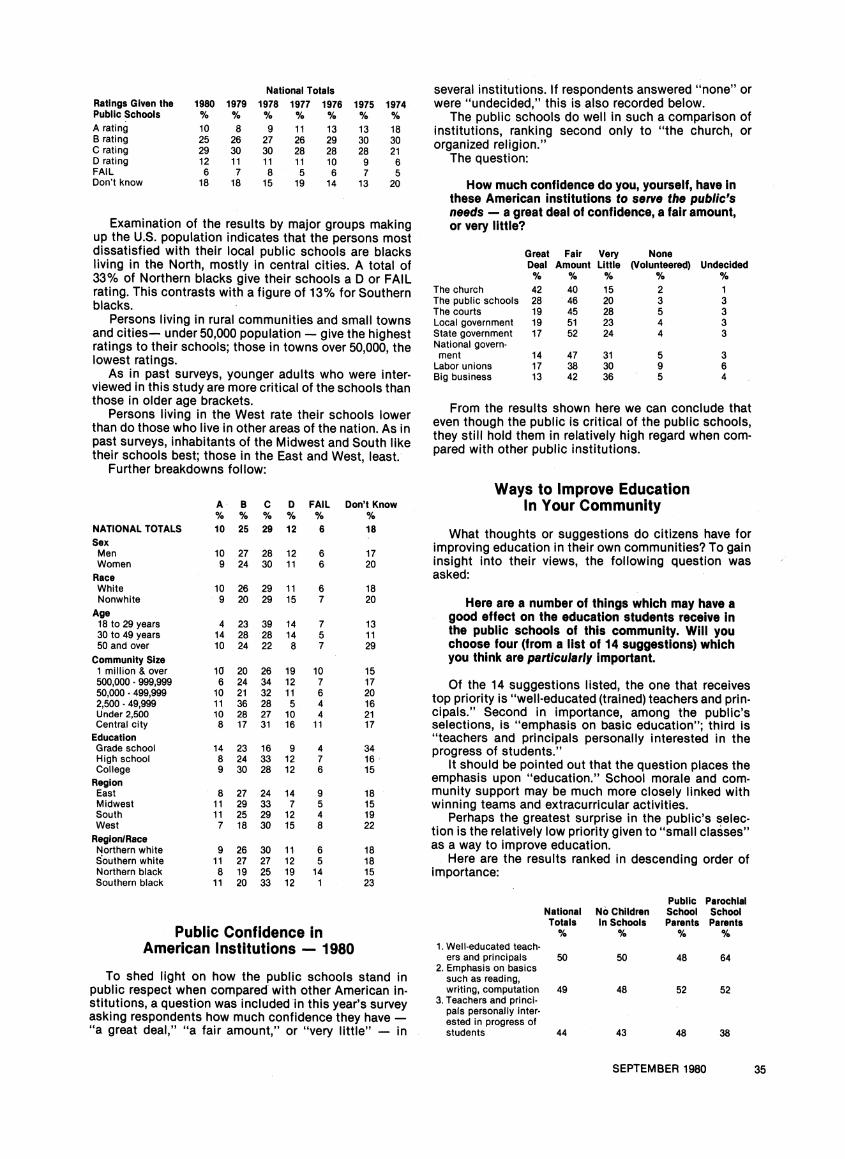
National Totals Ratings Given the Public Schools A rating B rating C rating D rating FAIL Don't know
1980 1979 1978 1977 1976 1975 1974 % % % % % % % 10 25 29 12 6 18
8 26 30 11 7 18
27 30 11 8 15
11 26 28 11 5 19
13 29 28 10 6 14
13 30 28 9 7 13
18 30 21 6 5
20
Examination of the results by major groups making up the U.S. population indicates that the persons most dissatisfied with their local public schools are blacks living in the North, mostly in central cities. A total of 33% of Northern blacks give their schools a D or FAIL rating. This contrasts with a figure of 13% for Southern blacks.
Persons living in rural communities and small towns and cities? under 50,000 population ? give the highest ratings to their schools; those in towns over 50,000, the lowest ratings.
As in past surveys, younger adults who were inter viewed in this study are more critical of the schools than those in older age brackets.
Persons living in the West rate their schools lower than do those who live in other areas of the nation. As in past surveys, inhabitants of the Midwest and South like their schools best; those in the East and West, least.
Further breakdowns follow:
NATIONAL TOTALS Sex Men Women Race White Nonwhite
Age 18 to 29 years 30 to 49 years 50 and over
Community Size 1 million & over 500,000 - 999,999 50,000 499,999 2,500 - 49,999 Under 2,500 Central city Education Grade school High school College
Region East Midwest South West Region/Race Northern white Southern white Northern black Southern black
AB C % % % 10 25 29
10 27 28 9 24 30
10 26 29 9 20 29
4 23 39 14 28 28 10 24 22
26 24 34 21 32
10 20 6 10 11 36 28 10 28 27 8 17 31
14 23 16 8 24 33 9 30 28
8 27 24 11 29 33 11 25 29 7 18 30
9 26 30 11 27 27 8 19 25 11 20 33
D % 12
12 11
11 15
19 12 11 5 10 16
14 7 12 15
11 12 19 12
FAIL % 6
6 6
6 7
14 7 14 5 8 7
10 7 6 4 4 11
9 4 12 7 12 6
9 5 4 8
6 5 14 1
Don't Know % 18
17 20
18 20
13 11 29
15 17 20 16 21 17
34 16 15
18 15 19 22
18 18 15 23
Public Confidence in American Institutions ? 1980
To shed light on how the public schools stand in public respect when compared with other American in stitutions, a question was included in this year's survey asking respondents how much confidence they have ? "a great deal," "a fair amount," or "very little" ? in
several institutions. If respondents answered "none" or were "undecided," this is also recorded below.
The public schools do well in such a comparison of institutions, ranking second only to "the church, or organized religion."
The question:
How much confidence do you, yourself, have in these American institutions to serve the public's needs ? a great deal of confidence, a fair amount, or very little?
Great Fair Very None Deal Amount Little (Volunteered) Undecided % % % % %
The church 42 40 15 2 1 The public schools 28 46 20 3 3 The courts 19 45 28 5 3 Local government 19 51 23 4 3 State government 17 52 24 4 3 National govern ment 14 47 31 5 3 Labor unions 17 38 30 9 6 Big business 13 42 36 5 4
From the results shown here we can conclude that even though the public is critical of the public schools, they still hold them in relatively high regard when com pared with other public institutions.
Ways to Improve Education In Your Community
What thoughts or suggestions do citizens have for improving education in their own communities? To gain insight into their views, the following question was asked:
Here are a number of things which may have a good effect on the education students receive in the public schools of this community. Will you choose four (from a list of 14 suggestions) which you think are particularly important.
Of the 14 suggestions listed, the one that receives top priority is "well-educated (trained) teachers and prin cipals." Second in importance, among the public's selections, is "emphasis on basic education"; third is "teachers and principals personally interested in the progress of students."
It should be pointed out that the question places the emphasis upon "education." School morale and com munity support may be much more closely linked with winning teams and extracurricular activities.
Perhaps the greatest surprise in the public's selec tion is the relatively low priority given to "small classes" as a way to improve education.
Here are the results ranked in descending order of importance:
Public Parochial National No Children School School Totals In Schools Parents Parents % % % %
1. Well-educated teach ers and principals 50 50 48 64 2. Emphasis on basics such as reading, writing, computation 49 48 52 52
3. Teachers and princi pals personally inter ested in progress of students 44 43 48 38
SEPTEMBER 1980 35
National Totals
4. Good parent/teacher relationships
5. Careful check on student progress and effort
6. An orderly but not rigid atmosphere
7. Useful materials and adequate supplies
8. Small classes 9. Special classes for
handicapped students
10. High goals and ex pectations on part of students
11. Wide variety of voca tional courses
12. Advanced classes for the gifted
13. Extracurricular activities
14. Successful athletic teams Don't know/ no answer
40
32
27
25 25
24
19
18
12
No Children In Schools
39
Public Parochial School School Parents Parents % %
32
26
25 24
25
19
17
12
5
4
7
42
32
28
27 28
21
17
19
11
7
5
44
39
38
16 20
17
25
20
14
7
5
1
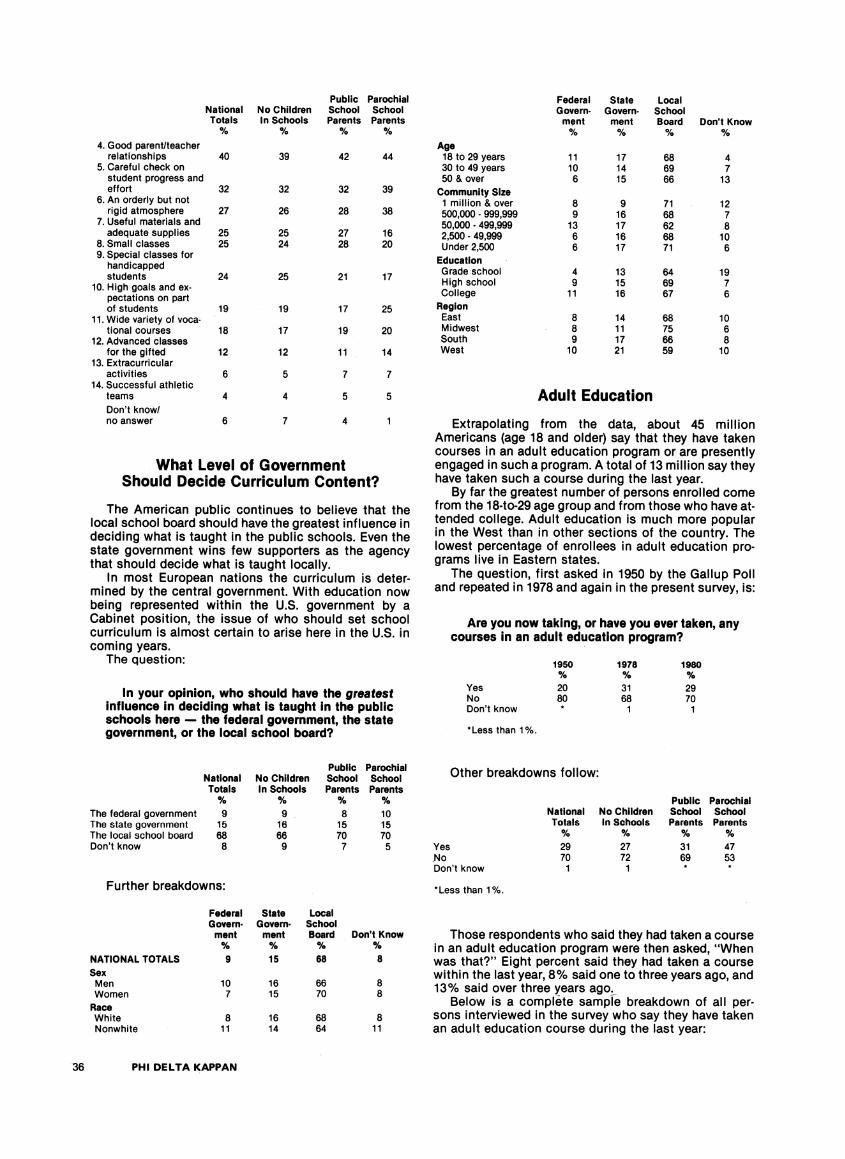
What Level of Government Should Decide Curriculum Content?
The American public continues to believe that the local school board should have the greatest influence in
deciding what is taught in the public schools. Even the state government wins few supporters as the agency that should decide what is taught locally.
In most European nations the curriculum is deter mined by the central government. With education now being represented within the U.S. government by a Cabinet position, the issue of who should set school curriculum is almost certain to arise here in the U.S. in coming years.
The question:
In your opinion, who should have the greatest influence in deciding what is taught in the public schools here ? the federal government, the state government, or the local school board?
The federal government The state government The local school board Don't know
National Totals % 9 15 68 8
No Children In Schools
% 9 16 66 9
Public Parochial School School Parents Parents % % 8 15 70 7
10 15 70 5
Further breakdowns:
NATIONAL TOTALS Sex Men Women Race White Nonwhite
Federal Govern ment % 9
10 7
8 11
State Govern ment % 15
16 15
16 14
Local School Board Don't Know % % 68 8
66 70
68 64
8 8
8 11
36 PHI DELTA KAPPAN
Age 18 to 29 years 30 to 49 years 50 & over
Community Size 1 million & over 500,000 - 999,999 50,000 - 499,999 2,500 - 49,999 Under 2,500
Education Grade school High school College Region East Midwest South West
Federal Govern ment %
11 10 6
8 9 13 6 6
4 9 11
8 8 9 10
State Govern ment %
17 14 15
9 16 17 16 17
13 15 16
14 11 17 21
Local School Board Don't Know %
68 69 66
71 68 62 68 71
64 69 67
68 75 66 59
%
4 7 13
12 7 8 10 6
19 7 6
10 6 8 10
Adult Education
Extrapolating from the data, about 45 million Americans (age 18 and older) say that they have taken courses in an adult education program or are presently engaged in such a program. A total of 13 million say they have taken such a course during the last year.
By far the greatest number of persons enrolled come from the 18-to-29 age group and from those who have at tended college. Adult education is much more popular in the West than in other sections of the country. The lowest percentage of enrollees in adult education pro grams live in Eastern states.
The question, first asked in 1950 by the Gallup Poll and repeated in 1978 and again in the present survey, is:
Are you now taking, or have you ever taken, any courses in an adult education program?
Yes No Don't know
*Less than 1%.
1950 % 20 80
1978 % 31 68
1
1980 % 29 70
1
Other breakdowns follow:
Yes No Don't know
* Less than 1%.
National Totals % 29 70
1
No Children in Schools
% 27 72 1
Public Parochial School School Parents Parents % % 31 47
53
Those respondents who said they had taken a course in an adult education program were then asked, "When
was that?" Eight percent said they had taken a course within the last year, 8% said one to three years ago, and 13% said over three years ago^
Below is a compl?te sample breakdown of all per sons interviewed in the survey who say they have taken an adult education course during the last year:
Sex % Men 8 Women 8 Race White 9 Nonwhite 5
Age 18 to 29 years 14 30 to 49 years 7 50 & over 4
Education Grade school 1 High school 6 College 15
Community Size 1 million & over 6 500,000-999,999 13 50,000 - 499,999 10 2,500 - 49,999 7 Under 2,500 6
Region East 5 Midwest 8 South 7 West 15
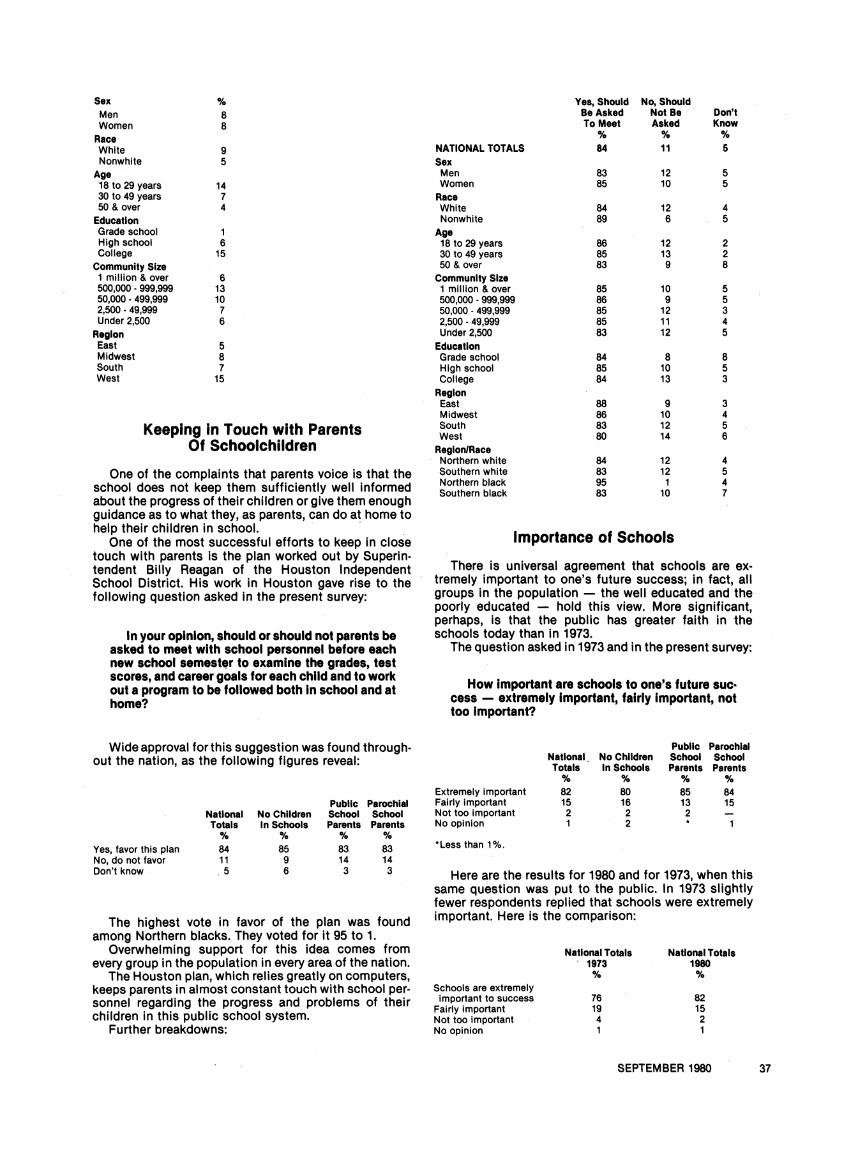
Keeping in Touch with Parents Of Schoolchildren
One of the complaints that parents voice is that the school does not keep them sufficiently well informed about the progress of their children or give them enough guidance as to what they, as parents, can do at home to help their children in school.
One of the most successful efforts to keep in close touch with parents is the plan worked out by Superin tendent Billy Reagan of the Houston Independent School District. His work in Houston gave rise to the following question asked in the present survey:
In your opinion, should or should not parents be asked to meet with school personnel before each new school semester to examine the grades, test scores, and career goals for each child and to work out a program to be followed both in school and at home?
Wide approval for this suggestion was found through out the nation, as the following figures reveal:
Public Parochial National No Children School School Totals In Schools Parents Parents % % % %
Yes, favor this plan 84 85 83 83 No, do not favor 11 9 14 14 Don't know 5 6 3 3
The highest vote in favor of the plan was found among Northern blacks. They voted for it 95 to 1. Overwhelming support for this idea comes from
every group in the population in every area of the nation. The Houston plan, which relies greatly on computers,
keeps parents in almost constant touch with school per sonnel regarding the progress and problems of their children in this public school system. Further breakdowns:
NATIONAL TOTALS Sex Men Women Race White Nonwhite
Age 18 to 29 years 30 to 49 years 50 & over
Community Size 1 million & over 500,000 - 999,999 50,000 - 499,999 2,500 - 49,999 Under 2,500
Education Grade school High school College
Region East Midwest South West Region/Race Northern white Southern white Northern black Southern black
Yes, Should Be Asked To Meet % 84
83 85
84 89
85 83
85 86 85 85 83
84 85 84
88 86 83 80
84 83 95 83
No, Should Not Be Asked % 11
12 10
12 6
12 13
10 9 12 11 12
8 10 13
9 10 12 14
12 12 1
10
Don't Know % 5
5 5
4 5
2 2 8
5 5 3 4 5
8 5 3
3 4 5 6
4 5 4 7
Importance of Schools
There is universal agreement that schools are ex tremely important to one's future success; in fact, all groups in the population ? the well educated and the poorly educated ? hold this view. More significant, perhaps, is that the public has greater faith in the schools today than in 1973.
The question asked in 1973 and in the present survey:
How important are schools to one's future suc cess ? extremely important, fairly important, not too important?
Extremely important Fairly important Not too important No opinion
*Less than 1%.
National Totals % 82 15 2 1
No Children In Schools % 80 16 2 2
Public Parochial School School Parents Parents % % 85 13 2
84 15
Here are the results for 1980 and for 1973, when this same question was put to the public. In 1973 slightly fewer respondents replied that schools were extremely important. Here is the comparison:
Schools are extremely important to success
Fairly important Not too important No opinion
National Totals 1973 %
76 19 4 1
National Totals 1980 %
82 15 2 1
SEPTEMBER 1980 37
Further breakdowns for 1980 follow:
NATIONAL TOTALS Sex Men Women Race White Nonwhite
Age 18 to 29 years 30 to 49 years 50 & over
Community Size 1 million & over 500,000 - 999,999 50,000 - 499,999 2,500 - 49,999 Under 2,500
Education Grade school High school College Region East Midwest South West
*Less than 1%.
Importance of Schools for Success
Extremely Fairly Not Too No Important Important Important Opinion % % % % 82 15 2 1
79 84
81 82
77 87 80
82 85 81 80 80
77 84 80
86 80 84 75
17 14
15 16
19 13 15
15 11 16 15 17
17 13 18
11 17 15 19
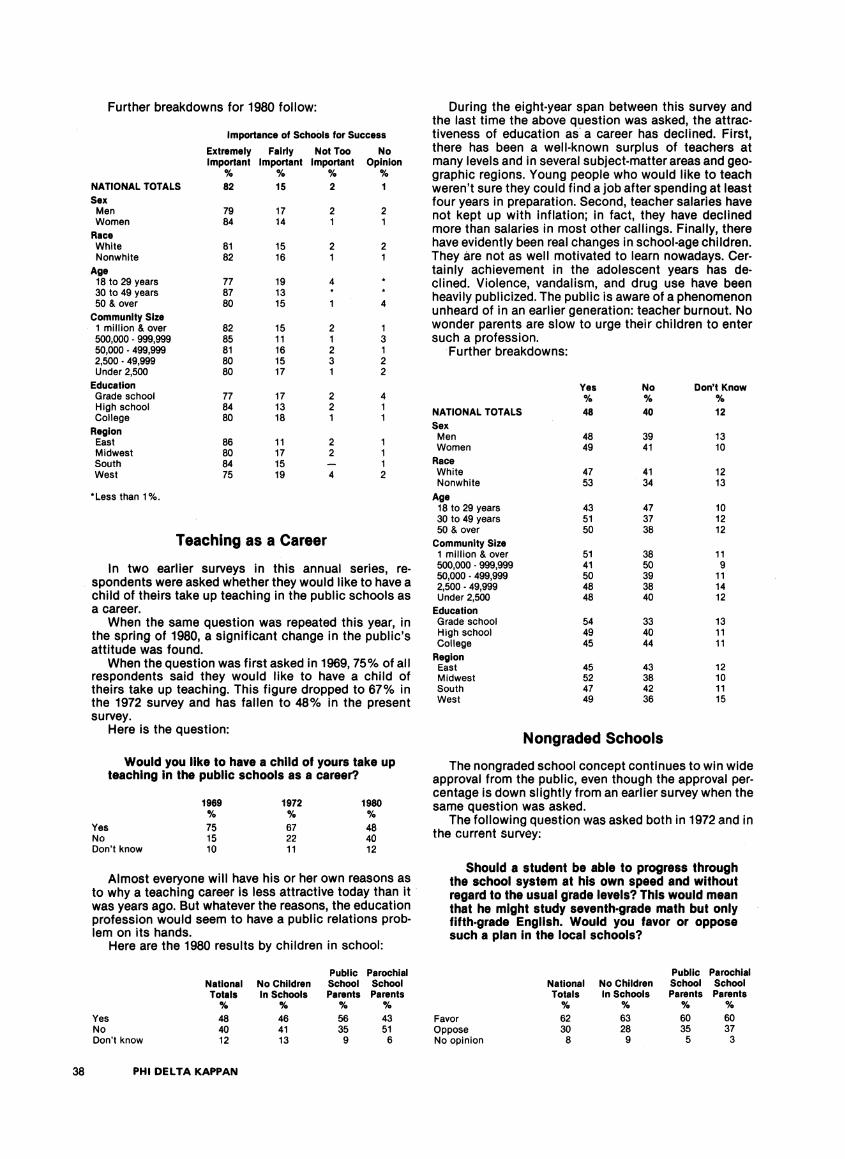
Teaching as a Career In two earlier surveys in this annual series, re
spondents were asked whether they would like to have a child of theirs take up teaching in the public schools as a career.
When the same question was repeated this year, in the spring of 1980, a significant change in the public's attitude was found.
When the question was first asked in 1969,75% of all respondents said they would like to have a child of theirs take up teaching. This figure dropped to 67% in the 1972 survey and has fallen to 48% in the present survey.
Here is the question:
Would you like to have a child of yours take up teaching in the public schools as a career?
Yes No Don't know
1969 % 75 15 10
1972 % 67 22 11
1980 % 48 40 12
Almost everyone will have his or her own reasons as to why a teaching career is less attractive today than it was years ago. But whatever the reasons, the education profession would seem to have a public relations prob lem on its hands. Here are the 1980 results by children in school:
Yes No Don't know
National Totals % 48 40 12
No Children In Schools
% 46 41 13
Public Parochial School School Parents Parents % % 56 35
43 51 6
38 PHI DELTA KAPPAN
During the eight-year span between this survey and the last time the above question was asked, the attrac tiveness of education as a career has declined. First, there has been a well-known surplus of teachers at many levels and in several subject-matter areas and geo graphic regions. Young people who would like to teach weren't sure they could find a job after spending at least four years in preparation. Second, teacher salaries have not kept up with inflation; in fact, they have declined more than salaries in most other callings. Finally, there have evidently been real changes in school-age children. They are not as well motivated to learn nowadays. Cer tainly achievement in the adolescent years has de clined. Violence, vandalism, and drug use have been heavily publicized. The public is aware of a phenomenon unheard of in an earlier generation: teacher burnout. No wonder parents are slow to urge their children to enter such a profession.
Further breakdowns:
Yes No Don't Know % % %
NATIONAL TOTALS 48 40 12 Sex
Men 48 39 13 Women 49 41 10 Race
White 47 41 12 Nonwhite 53 34 13
Age 18 to 29 years 43 47 10 30 to 49 years 51 37 12 50 & over 50 38 12 Community Size 1 million & over 51 38 11 500,000-999,999 41 50 9 50,000-499,999 50 39 11 2,500-49,999 48 38 14 Under 2,500 48 40 12
Education Grade school 54 33 13 High school 49 40 11 College 45 44 11 Region
East 45 43 12 Midwest 52 38 10
South 47 42 11 West 49 36 15
Nongraded Schools The nongraded school concept continues to win wide
approval from the public, even though the approval per centage is down slightly from an earlier survey when the same question was asked.
The following question was asked both in 1972 and in the current survey:
Should a student be able to progress through the school system at his own speed and without regard to the usual grade levels? This would mean that he might study seventh-grade math but only fifth-grade English. Would you favor or oppose such a plan in the local schools?
Public Parochial National No Children School School Totals In Schools Parents Parents % % % %
Favor 62 63 60 60 Oppose 30 28 35 37 No opinion 8 9 5 3
Here is the comparison of 1972 results with those of 1980:
National Totals National Totals 1972 1980 % %
Favor 71 62 Oppose 22 30 No opinion 7 8
Moral Instruction
In the 1975 survey in this series a question dealt with the need for instruction in morals and moral behavior. The vote at that time was overwhelmingly in favor: 79% in favor, 15% opposed, 6% no opinion. Interestingly, in the present survey a|most identical
results were found: 79% in favor, 16% opposed, and 5% with no opinion.
In the early years of public school education, the teaching of morals was regarded as an integral part of the educational program. Anyone who examines the McGuffey Readers, first published in 1836, will discover that the teaching of morals was as important as the teaching of reading. And as the Columbia Encyclopedia observes, "Their influence in shaping the American mind of the mid-19th century can scarcely be exag gerated."
No one has yet found a good modern equivalent of these readers as a way to instruct students in morals and moral behavior, but, as the survey findings indicate, the public is eagerly hoping that a way to achieve this type of instruction will be found. It is significant that parents of children now attending school are the group that favors this kind of instruction most, although all
major groups in the population strongly favor the idea. Here is the question asked both in 1975 and in the
present survey:
Would you favor or oppose instruction in the schools that would deal with morals and moral be havior?
Public Parochial National No Children School School Totals In Schools Parents Parents % % % %
Favor 79 78 84 83 Oppose 16 17 12 12 Don't know 5 5 4 5
Further breakdowns follow:
Favor Oppose Don't Know % % %
NATIONAL TOTALS 79 16 5 Sex Men 77 18 5 Women 81 14 5 Race White 79 16 5 Nonwhite 83 12 5
Age 18 to 29 years 73 24 3 30 to 49 years 81 14 5 50 & over 83 10 7 Community Size 1 million & over 77 18 5 500,000-999,999 78 19 3 50,000-499,999 79 16 5 2,500-49,999 78 15 7 Under 2,500 84 13 3
Education Grade school High school College
Region East Midwest South West
Favor %
81 84 71
79 79 82 78
Oppose %
11 12 24
18 16 14 15
Don't Know %
8 4 5
3 5 4 7
Cost of Education
The idea has been advanced that if parents and their school-age children knew how much money is spent to provide an education for them, ab senteeism would decline. In short, if being absent from school could be correlated with dollars, then the temptation to stay away from classes and from school would be reduced.
The costs can be estimated in this way: The average school year consists of 184 days, and the average cost for each child per school year is ap proximately $1,800 to $2,000, or about $10 per day. Since there are usually five class periods per day, then the cost per class per student is about $2.
One of the first questions to be asked is how these amounts ? $10 per school day, $2 per class
? strike the average citizen. Do the figures seem high, low, or about what is expected?
Here is the question put to respondents in this survey:
It costs taxpayers about $2 an hour for each student for each class he or she attends ? or about $10 for each school day. Are these figures higher, lower, or about the same as what you had thought?
NATIONAL TOTALS Sex Men Women Rape White Nonwhite
Age 18 to 29 years 30 to 49 years 50 & over
Community Size 1 million & over 500,000 - 999,999 50,000 - 499,999 2,500 - 49,999 Under 2,500
Education Grade school High school College Region East Midwest South West
Higher % 29
29 28
28 33
35 24 28
26 25 30 24 33
34 29 23
30 29 30 23
Cost Per School Day About
Lower The Same % % 19 34
20 18
19 22
17 27 14
20 28 20 21 13
10 19 25
21 18 17 24
35 33
35 26
35 32 34
32 28 33 33 39
33 33 36
34 32 35 33
Don't Know % 18
16 21
18 19
13 17 24
22 19 17 22 15
23 19 16
15 21 18 20
SEPTEMBER 1980 39
The greatest differences are found between the best educated group (those who have attended college) and the least well educated (those whose education ended with grade school). To the grade school group the fig ures were higher than expected: 34% to 10%; with the college educated the costs cited were slightly lower than expected: 23% to 25%.
Since lower-income respondents were much more in clined to underestimate the costs, and since the chil dren of the poorer families of the nation are most likely to drop out of school or be absent from classes, this argument about cost and wasted money might be useful to students and their parents in promoting regular school attendance. The student who has been absent 10 days has, in effect, lost $100.
Further breakdowns:
Cost Per School Day Higher Lower - About the same Don't know
National Totals % 29 19 34 18
No Children In Schools
% 29 17 34 20
Public School Parents % 29 23 33 15
Parochial School Parents % 16 29 39 16
Early Graduation
Every major group in the population believes that, if high school students can meet academic requirements in three years instead of four, they should be permitted to graduate early. The least enthusiastic about this pro posal are parents of children now attending school. On the other hand, those most in favor are recent graduates
? persons 18 to 29 years of age. When this question was first asked in 1977, similar
results were found. It can be argued that in an era of increasing speciali
zation, with students requiring more and more years of college and post-college training, an earlier start on col lege work would permit ? student to engage in his or her
chosen calling that much earlier. But many parents are reluctant to see their children go off to college at the age of 17 or earlier.
The question:
If high school students can meet academic re quirements in three years instead of four, should they, or should they not, be permitted to graduate early?
Yes, should No, should not Don't know
National Totals % 77 19 4
No Children In Schools
% 79 16 5
Public Parochial School School Parents Parents % % 73 70 24 26 3 4
Further breakdowns:
NATIONAL TOTALS Sex Men Women Race White Nonwhite
Yes, Should % 77
78 11
11 80
No, Should Not
% 19
18 19
19 16
Don't Know % 4
4 4
4 4
40 PHI DELTA KAPP AN
Yes, No, Don't Should Should Not Know % % %
Age 18 to 29 years 84 15 1 30 to 49 years 76 21 3 50 & over 72 20 8
Community Size 1 million & over 82 14 4 500,000-999,999 77 18 5 50,000-499,999 75 20 5 2,500-49,999 79 18 3 Under 2,500 76 21 3
Education Grade school 72 19 9 High school 75 22 3 College 84 13 3
Region East 76 21 3
Midwest 78 19 3 South 77 19 4 West 79 14 7
Should Public School Teachers Be Permifted to Strikf?
A conservative trend in most areas of American life evidenced by survey findings parallels increasing public opposition to strikes by public school teachers. In 1975, when this question was last put to the pubNc in this series, a slight majority opposed strikes. The vote then was 48% opposed to strikes and 45% in favor, with 7% having no opinion. When the same question was asked in the present survey, 52% opposed strikes, 40% favored them, and 8% had no opinion.
The question:
Should public school teachers be permitted to strike or not?
Public Parochial National No Children School School Totals In Schools Parents Parents % % % %
Yes 40 39 43 41 No 52 53 49 51 Don't know 8 8 8 8
The greatest changes were found among college educated respondents, a group that favored strikes five years ago by a 52% to 44% margin and now opposes strikes by nearly the same margin, 51% to 43%. In the Eastern states opinion was equally divided in
1975. A total of 46% favored strikes; 46% opposed them. Today the comparable figures are 34% in favor, 58% opposed.
Interestingly, parents of children attending the public schools have less objection to strikes than do those who have no children of school age. Further breakdowns follow:
Permit Teachers to Strike? Yes No Don't Know % % %
NATIONAL TOTALS 40 52 8 Sex Men 40 54 6 Women 39 51 10 Race White 38 54 8 Nonwhite 53 39 8
Age 18 to 29 years 57 40 3 30 to 49 years 42 49 9 50 & over 25 64 11
Permit Teachers to Strike? Yes No Don't Know
Community size 1 million & over 500,000 - 999,999 50,000 - 499,999 2,500 - 49,999 Under 2,500
Education Grade school High school College Region East Midwest South West
39 43 46 38 35
31 41 43
34 44 40 43
49 51 48 53 58
57 51 51
58 50 51 48
12 6 6
12 8 6
8 6 9 9
Hejping Students Get Jobs
One of the most perplexing problems that modern in dustrial societies face is how best to deal with student transition from ?phool to job. The very high unemploy ment rate in the U.S. among high school graduates and dropouts has yet to be solved. Some European nations have found that a combination of postsecondary school ing and job apprenticeship helps ease the transition from school to job. In the U.S. ? judging from the high unemployment rates of youth ? we have yet to find a solution. This fact accounts, perhaps, for the highly favorable vote for the proposal to add personnel to the school staff to help students and recent graduates get jobs.
Every group in the population favors this idea, and by very substantial amounts. Understandably, nonwhites, who have the highest youth unemployment rates in the population, are most in favor.
The question:
In your opinion, should or should not the public schools add personnel to help students and recent graduates get jobs?
Yes, they should add personnel
No, they should not Don't know
National Totals
64 30 6
No Children In Schools
65 29 6
Public Parochial School School Parents Parents %
64 32 4
%
53 45 2
Further breakdowns:
NATIONAL TOTALS Sex Men Women Race White Nonwhite
Age 18 to 29 years 30 to 49 years 50 & over
Yes, They Should Add
Personnel % 64
63 66
61
73 62 59
No, They Should
Not % 30
31 29
34 8
25 33 32
Don't Know % 6
6 5
5 6
2 5 9
Community Size 1 million & over 500,000 - 999,999 50,000 - 499,999 2,500 - 49,999 Under 2,500 Central city Education Grade school High school College
Region East Midwest South West
Yes, They Should Add
Personnel %
69 63 67 57 63 71
74 64 59
73 57 67 58
No, They Should
Not %
26 32 27 37 32 23
14 31 37
23 36 27 37
Don't Know %
5 5 6 6 5 6
12 5 4
4 7 6 5
Priorities for the New Federal Department of Education
To gain some insight into the priorities, as the American public perceives them, for the newly estab lished Department of Education in the federal govern
ment, respondents in the present survey were asked what this new department should give special attention to during the next few years. They were handed a list of 13 areas and asked to choose five of the 13 that they thought merited the most attention.
The list is by no means all-inclusive, and the areas listed are not necessarily the ones regarded as most im portant by either Congress or by top officials of the new Department of Education. The results, however, provide an indication of the way the public is thinking regarding educational priorities.
Here is the question asked:
As you may know, a new federal Department of Education has been established with Cabinet status. We would like to know what you think this new department should give special attention to in the next few years. Will you choose five of the areas listed on this card which you think are most important.
The priorities that follow are arranged in descending order of mention nationwide: Areas that the public hopes the new Depart ment of Education will National give special attention to Totals
No Children In Schools
%
Public School Parents %
Parochial School Parents % in the next few years: %
1. Basic education (reading, writing, arithmetic) 69 68 72 71
2. Vocational training (training students for
jobs) 56 55 57 53 3. Improving teacher
training and edu cation 46 44 50 51
4. Helping students choose careers 46 46 44 44
5. Parent training to help parents become more fully involved in their children's education 45 48 37 48
6. Helping more stu dents obtain a college education 35 34 38 34
SEPTEMBER 1980 41
7. Developing indi vidual educational plans for every child
8. Providing more op portunities for gifted students
9. Preschool education 10. Lifelong learning
(continuing educa tion through adult life)
11. Better educational use of television
12. International educa tion, including foreign language study
13. Improving oppor tunities for women and minorities
National Totals %
33
25 24
No Children In Schools
%
31
25 26
Public School Parents
38
26 21
Parochial School Parents %
35
23 19
23
20
19
18
22
20
19
18
21
21
20
17
33
19
20
14
(Figures add to more than 100% due to multiple responses.)
One-Year Internship for Teachers
A number of persons interviewed in this 12-year series of surveys complain about the difficulty of get ting "good" teachers, enough to place this problem among the top 10 "most important problems facing the local schools." This may explain, in part, why the public favors the idea of an internship of one year at half pay for those who wish to enter the teaching profession. On the other hand, an internship at half pay may discourage many youn?j persons from entering this profession, which is already losing some of its appeal.
The question:
Teachers now receive certificates to teach upon completion of their college coursework. Some people believe that teachers should be re quired to spend one year as interns in the schools at half pay before they are given a certificate to teach. Do you think this is a good idea or a poor idea?
Good idea Poor idea Don't know
National Totals % 56 36 8
No Children In Schools % 56 35 9
Public Parochial School School Parents Parents % % 55 37 8
56 42 2
Analysis of the vote by groups indicates that the most recent graduates ? those 18 to 29 years of age ? are most in fevor of the internship proposal. Those who are over 50 are most opposed.
Further breakdowns:
NATIONAL TOTALS Sex Men Women Race White Nonwhite
Internship for Teachers Good Poor Don't Idea Idea Know % % % 56 36 8
54 58
56 55
38 33
36 34
8 9
8 11
42 PHI DELTA KAPPAN
Internship for Teachers
Age 18 to 29 years 30 to 49 years 50 & over
Community Size 1 million & over 500,000 - 999,999 50,000 - 499,999 2,500 - 49,999 Under 2,500
Education Grade school High school College Region East Midwest South West
Good Idea % 62 59 49
64 57 54 47 56
48 59 54
60 56 50 59
Poor Idea % 32 35 39
28 37 36 43 36
35 34 40
33 36 41 30
D?P't Know % 6 6 12
8 6 10 10 8
17 7 6
7 8 9 11
Behavior Problems and Who Should Deal with Them
Of the more serious behavior problems with which the public schools must deal, only two of seven, in th? opinion of those interviewed in the survey, should be dealt with by the courts rather than by parents or by the school. The two are "vandalism of school property" and "bringing weapons to school." "Truancy" should be dealt with chiefly by parents, and the school should deal primarily with "fighting in school," "using alcohol or drugs on school property," "striking a teacher," and "stealing money or clothing from other students."
Here is the question:
Here are some student behavior problems which may occur in school. In your opinion, who should deal with each kind off problem ? should it be the parents, the school, or the courts?*
National Totals
Who Should Deal with:
Truancy (skipping school)
Vandalism of school property
Bringing weapons to school
Fighting in school Using alcohol or drugs on school property
Striking a teacher Stealing money or clothing from other students
Parents %
7? 44
41 42
50 43
48
School %
45
39
35 75
57 56
58
Courts %
9
50
59 10
35 35
30
Don't Know %
2
2
3 3
2 3
Multiple answers permitted.
The original data show that a substantial portion of the public believes most of these problems should be dealt with by a combination of school and parents, and in some instances by the courts also. Analysis of the findings by groups reveals no im
portant differences between those who have children now attending public school and those who have no children of school age. Those who have children now at tending independent schools are also in agreement as to where the prime responsibility rests.
Breakdowns for those with no children in school:
Who Should Deal with: Parents School % %
Truancy (skipping school) 71 45
Vandalism of school property 42 39
Bringing weapons to school 38 33 Fighting in school 39 74 Using alcohol or drugs on school property 47 57 Striking a teacher 41 55 Stealing money or clothing from other students 45 57
Courts %
10
51
62 10
36 36
31
Don't Know %
3
3
3 4
3 4
Breakdowns for those with children in public school:
Who Should Deal with:
Truancy (skipping school)
Vandalism of school property
Bringing weapons to school
Fighting in school Using alcohol or drugs on school property
Striking a teacher Stealing money or clothing from other students
Parents %
76
47
48 49
57 49
55
School %
42
39
39 77
58 57
59
Courts %
46
51 9
35 31
27
Don't Know %
2
Breakdowns for those with children in parochial school:
Who Should Deal with:
Truancy (skipping school)
Vandalism of school property
Bringing weapons to school
Fighting in school Using alcohol or drugs on school property
Striking a teacher Stealing money or clothing from other students
Parents %
64
45
34 46
58 44
44
School %
58
47
39 71
62 58
57
Courts %
5
53
58 12
29 41
41
Don't Know %
Requiring Nonunion Members To Pay Union Dues
The public is fairly evenly divided on the question of whether teachers ? in districts where there are teacher unions ? should be required to pay union dues even though they do not belong to the union. A slight plurality is found on the side of requiring them to pay dues. The public's ambivalence on unions has been evidenced in earlier surveys indicating that, while our respondents favor unions for teachers, they are opposed to strikes. The question:
In schools where there are teacher unions, should those teachers who do not belong to the union be required to pay union dues, since they share the benefits of union bargaining?
Yes, should be required to pay
No, should not Don't know
National Totals %
47 44 9
No Children In Schools
%
47 44 9
Public School Parents %
49 43 8
Parochial School Parents %
51 47 2
Differences are found on this issue by sections of the nation. Residents of the South oppose requiring teachers to pay union dues when they do not belong by a vote of 54% opposed to 37% in favor. Sentiment is evenly divided in the small cities and rural communities. The college educated, who are found largely in the upper-income levels, vote against this requirement by 58% to 35%.
Further breakdowns:
NATIONAL TOTALS Sex Men Women Race White Nonwhite
Age 18 to 29 years 30 to 49 years 50 & over
Community Size 1 million & over 500,000 - 999,999 50,000 - 499,999 2,500 - 49,999 Under 2,500
Education Grade school High school College
Region East Midwest South West
Yes, Should Be Required To Pay % 47
44 50
47 52
56 44 44
47 53 49 44 46
45 55 35
54 54 37 46
No, Should
Not % 44
47 41
45 37
40 46 44
43 38 42 45 47
39 37 58
39 37 54 43
Don't Know % 9
9 9
8 11
4 10 12
10 9 9 11 7
16 8 7
7 9 9 11
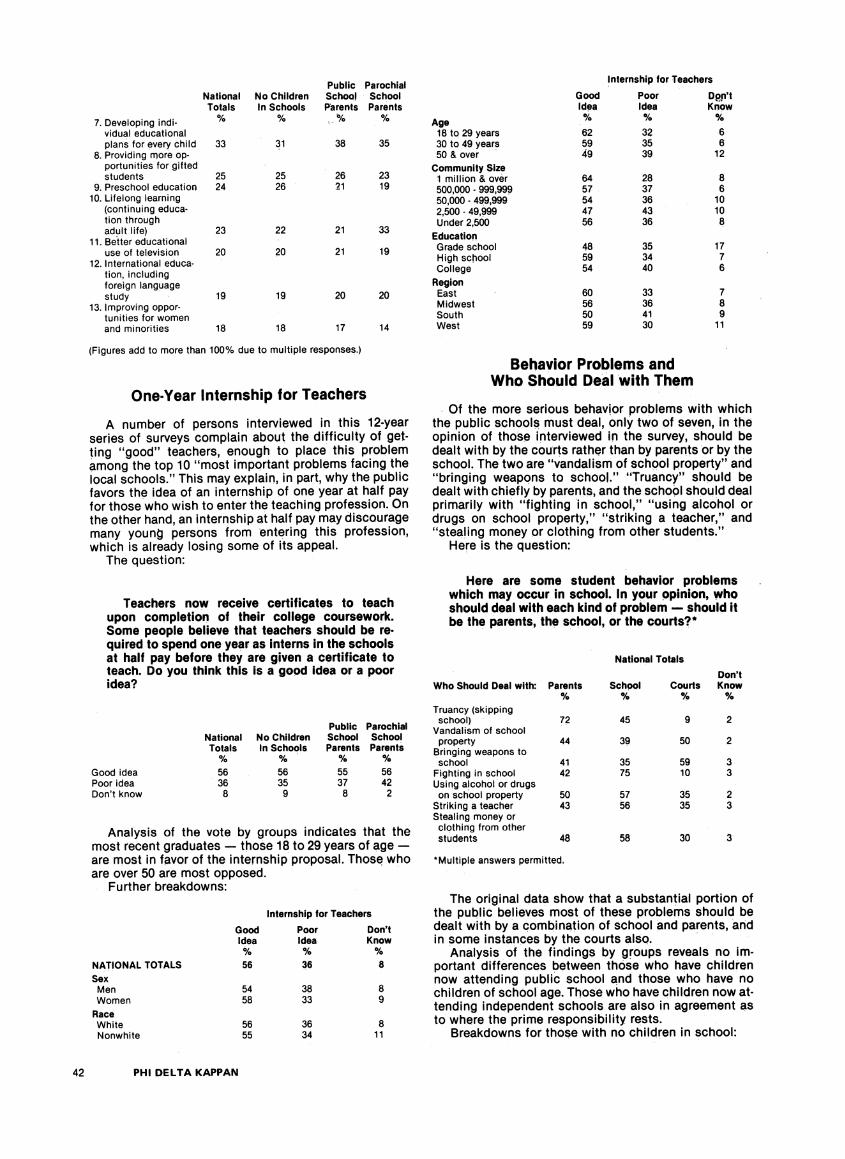
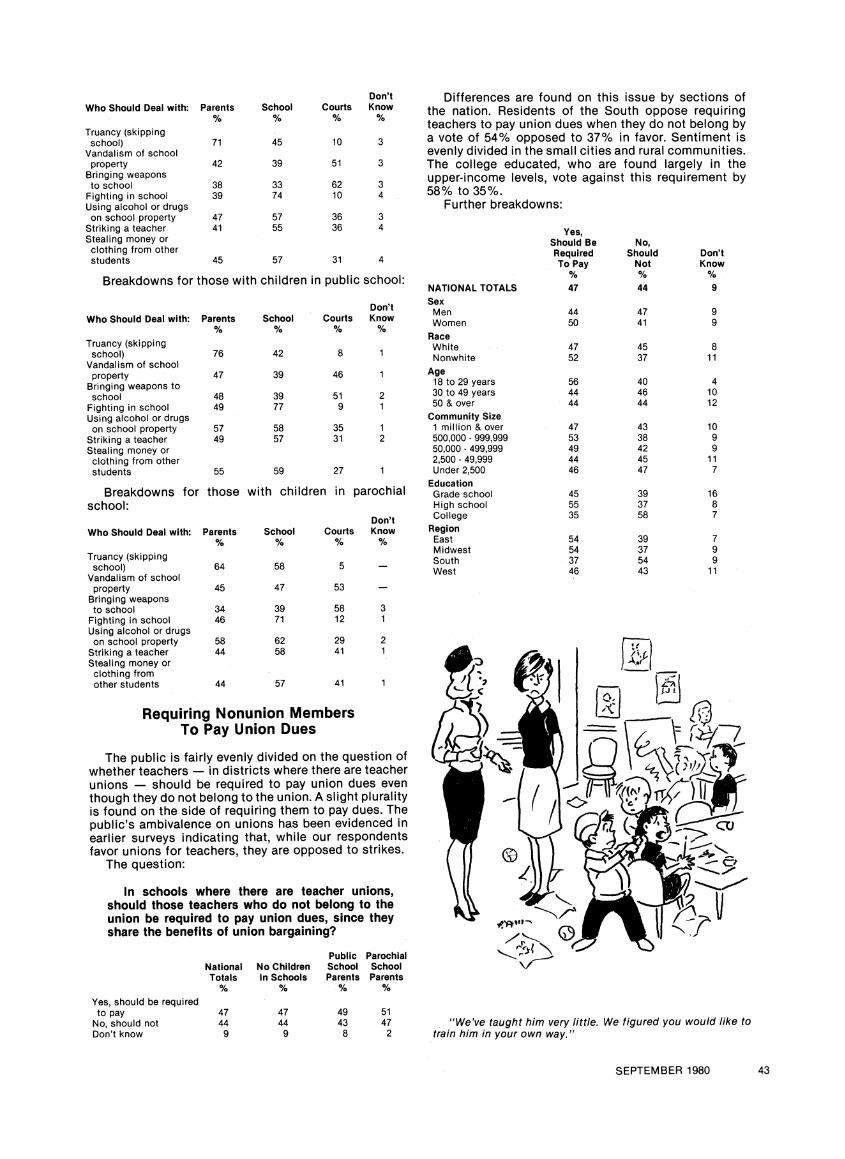
"We've taught him very little. We figured you would like to train him in your own way. "
SEPTEMBER 1980 43

Preparing for One-Parent Families
The American public appears to be ready to deal with a problem that is certain to have an important effect on schooling. Children who spend a substantial amount of time with a lone parent will undoubtedly have a different home environment, different training, and special needs.
To cope with this situation, three proposals were pre sented to those persons included in the survey; all three were approved by overwhelming majorities.
The question:
The number of one-parent families in the U.S. is growing each year due to the high divorce rate, and it is predicted that nearly half of the children born in 1980 will live, for a considerable period of time, with only one parent. Because of this, some people believe that the schools must find new ways to deal with the children from these broken homes. Of course, this will cost more money. Now, here are three proposals. For each one tell me whether you think it would be a good idea or a poor idea for the schools here.
Proposal 1 Make school personnel available for evening counseling with single parents who are working if their children are having trouble at school.
National Totals %
Good idea 86 Poor idea 10 Don't know 4
Proposal 2
National Totals %
Good idea 83 Poor idea 12 Don't know 5
Proposal 3
44 PHI DELTA KAPPAN
Public Parochial No Children School School In Schools Parents Parents % % % 86 85 84 9 12 15 5 3 1
Public Parochial No Children School School In Schools Parents Parents % % % 84 83 81 11 13 16 5 4 3
Provide activities so children can spend more time at school rather than going to an empty house.
Good idea Poor idea Don't know
National Totals % 76 18 6
No Children In Schools
% 79 15 6
Public Parochial School School Parents Parents % % 70 26
72 25 3
The Bilingual Problem
Bilingual education continues to be a controversial program. Should students be taught in the language of
Give teachers training to help them deal with special problems of children from one-parent families.
their parents? Should they be able to learn some of their subjects in their native language while they are learning English?
A third alternative is to require students to learn English in special classes before they are enrolled in the public schools. This alternative appeals to more than eight out of every 10 persons included in the present survey. And it receives overwhelming approval by all ma jor groups in the population.
Here is the question:
Many families who come from other countries have children who cannot speak English. Should or should not these children be required to learn English in special classes before they are enrolled in the public schools?
Yes, they should No, they should not Don't know
National Totals % 82 13 5
No Children In Schools % 82 13 5
Public Parochial School School Parents Parents % % 83 13 4
80 18 2
Further breakdowns:
NATIONAL TOTALS Sex Men Women Race White Nonwhite
Age 18 to 29 years 30 to 49 years 50 & over
Community Size 1 million & over 500,000 - 999,999 50,000 - 499,999 2,500 - 49,999 Under 2,500
Education Grade school High school College Region East Midwest South West
Yes, They
Should % 82
83 81
82 80
89 81 77
83 91 83 79 79
74 84 82
82 86 80 79
No, They Should
Not % 13
13 14
14
10 15 16
14 6 12 16 15
17 12 15
15 10 14 16,
Don't Know % 5
4 5
4 11
1 4 7
3 3 5 5 6
9 4 3
Learning About Other Nations
As communication and travel make the world smaller, and as the threat of a world-devastating war continues, should students spend more time learning about other nations of the world than they presently do? Many educators believe that global education is the trend of the future and that schools should begin to take account of this.
Parents of children now attending either public school or parochial school were asked if they thought students should spend more time studying about other people and the way they live. Those with children in the public schools were almost evenly divided: 45% said they should spend more time on global education; 46% said they spend enough time now. The vote of parents
with children now attending independent schools was also evenly divided.
The question:
Should students spend more time than they now do learning about other nations of the world and the way people live there, or do you think they spend enough time now?
Asked of Parents Only Public Parochial School School Parents Parents % %
Should spend more time 45 46 Spend enough time now 46 47 Don't know 9 7
Basic Education in Local Schools
Schools throughout the nation are giving more atten tion to basic education. But it may take time to convince parents and the general public that enough attention is being given to this program in their own schools. To gain some insight into how parents regard this move ment, this question was asked of parents with children in school:
Is it your impression that the local public school system gives enough attention, or not enough attention, to reading, writing, and arith metic?
Asked of Parents Only Public Parochial School School Parents Parents % %
Enough attention 34 17 Not enough attention 61 72 Don't know 5 11
Want Reprints? A 10-Year Compilation?
Reprints of this 12th annual Gallup survey of public attitudes toward the public schools may be ordered from Phi Delta Kappa. The minimum order is 25 copies for $6. Additional copies are 15 cents each. This price includes postage for parcel post delivery. Where possible, a check or money order should accompany orders. If faster delivery is desired, do not include a
remittance with your order. You will be billed at the above rates plus any additional cost involved in the method of delivery. Note also that copies of the first 10 Gallup sur
veys are now available in book form. The volume features an introductory analysis by George Gallup.
The Gallup Polls of Attitudes Toward Educa tion, 1969-1978 may be ordered for $5.50 each or $4.50 each in quantities of five or more.
Orders for reprints or the book should be ad dressed to Phi Delta Kappa, Box 789, Blooming ton, IN 47402. Ph. 812/339-1156.
Parents of children attending either public or paro chial school say not enough attention is being given to the basics in the local public schools. It is not surpris ing to find that parents with children attending parochial schools are even more critical of the public school curriculum than those with children attending public schools.
COMPOSITION OF THE SAMPLE
Analysis of Respondents
Adults % No children in schools 68 Public school parents 28* Parochial school parents 6*
* Total exceeds 32% because some parents have children attending more than one kind of school.
Sex % Men 48 Women 52
Race % White 86 Nonwhite 14
Age % 18 to 24 years 18 25 to 29 years 12 30 to 49 years 33 50 & over 37 Undesignated
* Less than 1%.
Occupation % Business & professional 27 Clerical & sales 7 Farm 3 Skilled labor 18 Unskilled labor 22 Non-labor force 21 Undesignated 2
Political affiliation % Republican 22 Democrat 45
Political affiliation (cont.) % Independent 30
Other 3
Income % $20,000 and over 36 $15,000 to $19,999 18 $10,000 to $14,999 19 $ 7,000 to $ 9,999 9 $ 5,000 to $ 6,999 7 $ 3,000 to $ 4,999 6 Under $3,000 4 Undesignated 1
Region % East 27 Midwest 27 South 28 West 18
Community size % 1 million and over 20 500,000 to 999,999 11 50,000 to 499,999 27 2,500 to 49,999 15 Under 2,500 27
Education % Elementary grades 15 High school incomplete 15 High school complete 36 Technical, trade, or business school 5
College incomplete 16 College graduate 13 Undesignated *
*Less than 1%.
THE DESIGN OF THE SAMPLE
The sampling procedure is designed to produce an approximation of the adult civilian population, age 18 and older, living in the U. S., except for those persons in institutions such as prisons or hospitals.
The design of the sample is that of a replicated probability sample, down to the block level in the case of urban areas and to segments of townships in the case of rural areas. Approximately 300 sampling loca tions are used in each survey. Interpenetrating samples can be provided for any given study when appropriate.
The sample design included stratification by these four size-of community strata, using 1970 census data: 1) cities of population 1,000,000 and over; 2) 250,000 to 999,999; 3) 50,000 to 249,999; 4) all other population. Each of these strata was further stratified into seven geographic regions: New England, Middle Atlantic, East Central, West Central, South, Mountain, and Pacific. Within each city-size/regional stratum, the population was arrayed in geographic order and zoned into equal-sized groups of sampling units. Pairs of localities were selected in each zone, with probability of selection of each locality proportional to its population size in the 1970 census, producing two replicated samples of localities.
SEPTEMBER 1980 45
Within localities so selected for which the requisite population data are reported, subdivisions were drawn with the probability of selection proportional to size of population. In all other localities, small definable geographic areas were selected with equal probability.
Separately for each survey, within each subdivision so selected for which block statistics are available, a sample of blocks or block clusters is drawn with probability of selection proportional to the number of
. dwelling units. In all other subdivisions or areas, blocks or segments are drawn at random or with equal probability.
In each cluster of blocks and each segment so selected, a randomly selected starting point is designated on the interviewer's map of the area. Starting at this point, interviewers are required to follow a given direction in the selection of households until their assignment is com pleted.
Interviewing is conducted at times when adults, in general, are most likely to be at home, which means on weekends, or, if on weekdays, after 4 p.m. for women and after 6 p.m. for men.
Allowance for persons not at home is made by a "times-at-home,' weighting procedure rather than by "call-backs." This procedure is a standard method for reducing the sample bias that would otherwise result from underrepresentation in the sample of persons who are dif ficult to find at home.
The prestratification by regions is routinely supplemented by fitting each obtained sample to the latest available Census Bureau estimates of the regional distribution of the population. Also, minor adjustments of the sample are made by educational attainment by men and women separately, based on the annual estimates of the Census Bureau (de rived from their Current Population Survey) and by age.
SAMPLING TOLERANCES
In interpreting survey results, it should be borne in mind that all sam ple surveys are subject to sampling error, i.e., the extent to which the results may differ from what would be obtained if the whole population surveyed had been interviewed. The size of sampling error depends largely on the number of interviews.
The following tables may be used in estimating the sampling error of any percentage in this report. The computed allowances have taken into account the effect of the sample design upon sampling error. They may be interpreted as indicating the range (plus or minus the figure shown) within which the results of repeated samplings in the same time period could be expected to vary 95% of the time, assuming the same sampling procedure, the same interviewers, and the same questionnaire.
The first table shows how much allowance should be made for the sampling error of a percentage:
Recommended Allowance for Sampling Error of a Percentage
In Percentage Points (at 95 in 100 confidence level)*
Sample Size 1,500 1,000 750 600 400 200 100
Percentages near 102 2 3 3 4 5 7 Percentages near 20 234457 9 Percentages near 30 3 4 4 4 6 8 10 Percentages near 40 3 4 4 5 6 8 11 Percentages near 50 3 4 4 5 6 8 11 Percentages near 60 3 4 4 5 6 8 11 Percentages near 70 3 4 4 4 6 8 10 Percentages near 80 234457 9 Percentages near 90 223345 7
*The chances are 95 in 100 that the sampling error is not larger than the figures shown.
The table would be used in the following manner: Let us say a reported percentage is 33 for a group that includes 1,500 respondents.
We go to the row for "percentages near 30" and across to the column headed "1,500." The number at this point is 3, which means that the 33% obtained in the sample is subject to a sampling error of plus or minus three points. Another way of saying it is that very probably (95 chances out of 100) the average of repeated samplings would be somewhere be tween 30 and 36, with the most likely figure the 33 obtained.
In comparing survey results in two samples such as, for example, men and women, the question arises as to how large a difference be tween them must be before one can be reasonably sure that it reflects a real difference. In the tables below, the number of points that must be allowed for in such comparisons is indicated.
Two tables are provided. One is for percentages near 20 or 80; the other for percentages near 50. For percentages in between, the error to be allowed for is between those shown in the two tables:
46 PHI DELTA KAPPAN
Recommended Allowance for Sampling Error Of the Difference
In Percentage Points (at 95 in 100 confidence level)
TABLE A Percentages near 20 or near 80 Size of Sample 750 600 400 200
750 5 600 5 6 400 6 6 7 200 8 8 8 10
TABLE B Percentages near 50 Size of Sample 750 600 400 200
750 6 600 7 7 400 7 8 8 200 10 10 10 12
Here is an example of how the tables would be used: Let us say that 50% of men respond a certain way and 40% of women respond that way also, for a difference of 10 percentage points between them. Can we say with any assurance that the 10-point difference reflects a real difference between men and women on the question? The sample contains approx imately 750 men and 750 women. Since the percentages are near 50, we consult Table B, and, since the
two samples are about 750 persons each, we look for the number in the column headed "750," which is also the row designated "750." We find the number 6 here. This means that the allowance for error should be six points and that, in concluding that the percentage among men is somewhere between four and 16 points higher than the percentage among women, we should be wrong only about 5% of the time. In other words, we can conclude with considerable confidence that a difference exists in the direction observed and that it amounts to at least four percentage points. If, in another case, men's responses amount to 22%, say, and
women's 24%, we consult Table A, because these percentages are near 20. We look in the column headed "750" and see that the number is 5. Obviously, then, the two-point difference is inconclusive.
PACE Materials Now Available
George Gallup calls them "unique; the first time anyone has ever put together in one package com plete instructions for the nonspecialist on how to conduct scientific polls of attitudes and opinion in education."
These are the PACE (for Polling Attitudes of the Community on Education) materials, now available in final form to school districts, regional con sortiums, and state agencies or groups interested in measuring opinion on vital education questions. Wilmer Bugher, associate executive secretary
for administration of Phi Delta Kappa, and Willard Duckett, his assistant, worked for more than a year to assemble the PACE kit. The Gallup Organiza tion gave advice and help at every stage of de velopment.
Here are chapter headings in the manual that constitutes the heart of the kit: The Questionnaire, Questions Classified According to Topics, Sam pling, Interviewing, and Analyzing the Data. There are seven appendices.
Persons interested in using PACE should write or call Bugher or Duckett at Phi Delta Kappa, Box 789, Bloomington, IN 47402, phone 812/339-1156. Price of the 291-page basic kit is $39.50. Additional items are available. Bugher and Duckett will con sult with PACE users when their schedules permit.