the 1992 ipcc supplement: scientific assessment
TRANSCRIPT

The 1992 IPCC Supplement: Scientific Assessment
Prepared by IPCC Working Group I

CONTENTS
1 Current Task 5
2 Our Major Conclusions 5 Gases and Aerosols 5 Scenarios 6 Modelling 6 Climate Observations 6
Box - How does the climate system work? 7
3 How has our Understanding of the Sources and Sinics of Greenhouse Gases and Aerosols Changed? 8
Atmospheric Concentrations and Trends of Long-lived Greenhouse Gases 8
Atmospheric Concentrations and Trends of Other Gases that Influence the Radiative Budget 8
Sources and Sinks of Carbon Dioxide 8 Sources of Methane 9 Sources of Nitrous Oxide 9 Sources of Halogenated Species 9 Stratospheric Ozone Depletion 9 Sources of Precursors of Tropospheric Ozone 9 Sources of Aerosols 9
4 Scenarios of Future Emissions 9 Scenario Results 10 Carbon Dioxide 10 Halocarbons 10 Methane, Nitrous Oxide, Ozone Precursors and Sulphur Gases 10
5 Relationship Between Emissions and Atmospheric 13 Concentrations and the Influence on Radiative Budget
Carbon Cycle Models 13 Atmospheric Gas Phase Chemistry Models 13
Atmospheric Sulphate Aerosol Models 13
6 How has our Understanding of Changes in Radiative Forcing Changed? 14
Radiative Forcing due to Changes in Stratospheric Ozone 14
Radiative Forcing due to Changes in Tropospheric Ozone 14
Radiative Effects of Sulphur Emissions 14 Global Warming Potentials 14
Direct Global Warming Potentials 14 Indirect Global Warming Potentials 14
Influence of Changes in Solar Output 15
7 Confidence in Model Predictions 15
8 Simulated Rates of Change in Climate and their Geographical Distribution 15
Box - What tools do we use? 16
9 What Would We Now Estimate for Climate Change? 17
10 The Updated Record of Global Mean Temperatures 17
11 Are There any Trends in Other Climatically Important Quantities? 19
12 Are the Observed Temperature Changes Consistent with Predicted Temperature Changes? 19
13 Key Uncertainties and Further Work Required 19
Annex: 21 Progress in the Development of an IPCC Methodology for National Inventories of Net Emissions of Greenhouse Gases


7992 IPCC Supplement 5
1. Current Task
The fifth session of the Intergovernmental Panel on Climate Change (IPCC) (Geneva, March 1991) adopted six tasks for the ongoing work of its three working groups. While successful completion of these tasks required cooperation between al l three groups, particular responsibility fell to the Scientific Assessment working group (WGI) for Tasks 1, 2 and 6:
Task 1: Assessment of net greenhouse gas emissions. Sub-section 1: Sources and sinks of greenhouse gases. Sub-section 2: Global Warming Potentials.
Task 2: Predictions of the regional distributions of climate change and associated impact studies; including model validation studies.
Task 6: Emissions scenarios.
The tasks were divided into long- and short-term components. The purpose of the short-term workplan, whose results are reported in the present document, was to provide an update to the 1990 IPCC Scientific Assessment, addressing some of the key issues of that report. This update is by definition less comprehensive than the 1990 report • for example sea level rise apart from the effect of thermal expansion is not included. It is against the background of that document that the findings of this update should be read.
This assessment, in order to incorporate as much recent material as possible, necessarily includes discussion of new results which have not yet been through, or are currently undergoing, the normal process of peer review. Where such is the case the provisional nature of the results has been taken into account.
A brief progress report on the preparation of guidelines for the compilation of national inventories of greenhouse gas emissions, part of WGI's long-term work under Task 1, appears as an Annex to this Supplement.
2. Our Major Conclusions
Findings of scientific research since 1990 do not affect our fundamental understanding of the science of the greenhouse effect and either confirm or do not justify alteration of the major conclusions of the first IPCC Scientific Assessment, in particular the following:
• emissions resulting from human activities are substantially increasing the atmospheric concentrations of the greenhouse gases: carbon dioxide, methane, chlorofluorocarbons, and nitrous oxide;
• the evidence from the modelling studies, from observations and the sensitivity analyses indicate that the sensitivity of global mean surface temperature to doubling C O 2 is unlikely to lie outside the range 1.5 to4.5''C;
• there are many uncertainties in our predictions particularly with regard to the timing, magnitude and regional patterns of climate change;
• global mean surface air temperature has increased by 0.3 to 0.6°C over the last 100 years;
• the size of this warming is broadly consistent with predictions of climate models, but it is also of the same magnitude as natural climate variability. Thus the observed increase could be largely due to this natural variability; alternatively this variability and other human factors could have offset a still larger human-induced greenhouse warming;
• the unequivocal detection of the enhanced greenhouse effect from observations is not likely for a decade or more.
There are also a number of significant new findings and conclusions which we summarize as follows:
Gases and Aerosols
• Depletion of ozone in the lower stratosphere in the middle and high latitudes results in a decrease in radiative forcing which is believed to be comparable in magnitude to the radiative forcing contribution of chlorofluorocarbons (CFCs) (globally-averaged) over the last decade or so.
• The cooling effect of aerosols f' -' resulting from sulphur emissions may have offset a significant part of the greenhouse warming in the Northern Hemisphere (NH) during the past several decades. Although this phenomenon was recognized in the 1990 report, some progress has been made in quantifying its effect.
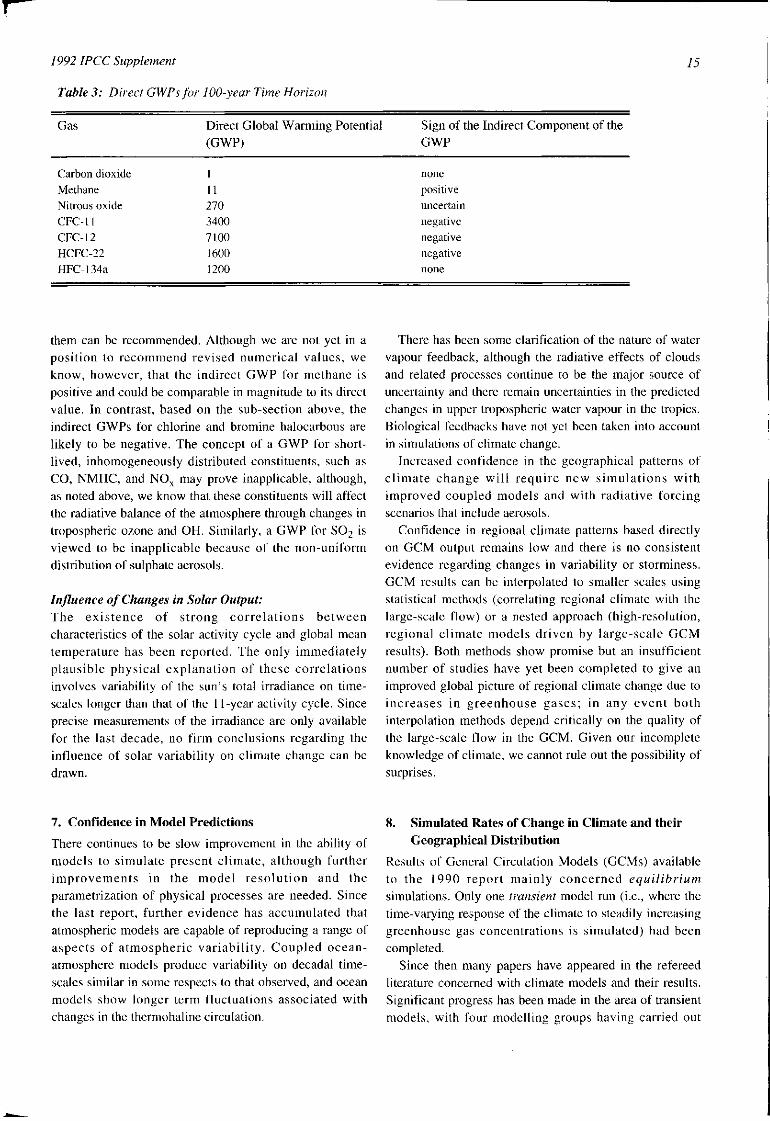
• The Global Warming Potential (GWP) remains a useful concept but its practical utility for many gases depends on adequate quantification of the indirect effects as well as the direct. We now recognize that there is increased uncertainty in the calculation of GWPs, particularly in the indirect components and, whilst indirect GWPs are likely to be significant for some gases, the numerical estimates in this Supplementary Report are limited to direct GWPs.
• Whilst the rates of increase in the atmospheric concentrations of many greenhouse gases have continued to grow or remain steady, those of methane and some halogen compounds have slowed.
' ' ^ The scientific definition of 'aerosol' is an airborne particle or collection of particles, but the word has become associated, erroneously, with the propellant used in 'aerosol sprays'. Throughout this report the term 'aerosol' means airborne particle or particles.

6 1992 IPCC Supplement
• Some data indicate that global emissions of methane from rice paddies may amount to less than previously estimated.
Scenarios
• Steps have been taken towards a more comprehensive analysis of the dependence of future greenhouse gas emissions on socio-economic assumptions and projections. A set of updated scenarios have been developed for use in modelling studies which describe a wide range of possible future emissions in the absence of a coordinated policy response to climate change.
Modelling
• Climate models have continued to improve in respect of both their physical realism and their ability to simulate present climate on large scales, and new techniques are being developed for the simulation of regional climate.
• Transient (time-dependent) simulations with coupled ocean-atmosphere models ( C G C M s ) , in which neither aerosols nor ozone changes have been included, suggest a rate of global warming that is consistent, within the range of uncertainties, with the 0.3°C per decade warming rate quoted by IPCC (1990) for Scenario A of greenhouse gas emissions.
• The large-scale geographical patterns of warming produced by the transient model runs with CGCMs are generally similar to the patterns produced by the earlier equilibrium models except that the transient simulations show reduced warming over the northern North At lant ic and the southern oceans near Antarctica.
• CGCMs are capable of reproducing some features of atmospheric variability on intra-decadal time-scales.
• Our understanding of some climate feedbacks and their incorporation in the models has improved. In particular, there has been some clarification of the role of upper tropospheric water vapour. The role of other processes, in particular cloud effects, remains unresolved.
Climate Observations
• The anomalously high global mean surface temperatures of the late 1980s have continued into 1990 and 1991 which are the warmest years in the record.
• Average warming over parts of the Northern Hemisphere mid-latitude continents has been found to be largely characterized by increases in minimum (night-time) rather than maximum (daytime) temperatures.
• Radiosonde data indicate that the lower troposphere
has warmed over recent decades. Since meaningful trends cannot be assessed over periods as short as a decade, the widely reported disagreements between decadal trends of air temperature from satellite and surface data cannot be confirmed because the trends are statistically indistinguishable.
• The volcanic eruption of Mount Pinatubo in 1991 is expected to lead to transitory stratospheric warming. With less certainty, because of other natural influences, surface and tropospheric cooling may occur during the next few years.
• Average warming over the Northern Hemisphere during the last four decades has not been uniform, with marked seasonal and geographic variations; this warming has been especially slow, or absent, over the extratropical north west Atlantic.
• The consistency between observations of global temperature changes over the past century and model simulations of the warming due to greenhouse gases over the same period is improved if allowance is made for the increasing evidence of a cooling effect due to sulphate aerosols and stratospheric ozone depletion.
The above conclusions have implications for future projections of global warming and somewhat modify the estimated rate of warming of 0.3°C per decade for the greenhouse gas emissions Scenario A of the IPCC 1990 Report. If sulphur emissions continue to increase, this warming rate is likely to be reduced, significantly in the Northern Hemisphere, by an amount dependent on the future magnitude and regional distribution of the emissions. Because sulphate aerosols are very short-lived in the atmosphere, their effect on global warming rapidly adjusts to increases or decreases in emissions. It should also be noted that while partially offsetting the greenhouse warming, the sulphur emissions are also responsible for acid rain and other environmental effects. There is a further small net reduction likely in the rate of global warming during the next few decades due to decreases in stratospheric ozone, partially offset by increases in tropospheric ozone.
Research carried out since the 1990 IPCC Assessment has served to improve our appreciation of key uncertainties. There is a continuing need for increased monitoring and research into climate processes and modelling. This must involve, in particular, strengthened international collaboration through the Wor ld Climate Research Programme ( W C R P ) , the International Geosphere Biosphere Programme (IGBP) and the Global Climate Observing System (GCOS).

1992 IPCC Supplement 7
H O W DOES T H E C L I M A T E S Y S T E M W O R K , A N D W H A T I N F O R M A T I O N D O W E N E E D T O E S T I M A T E F U T U R E C H A N G E S ?
How does the climate system work? The Earth absorbs radiation from the Sun, mainly at the surface. This energy is then redistributed by the atmosphere and ocean and re-radiated to space at longer ('thermal', 'terrestrial' or 'infrared') wavelengths. Some of the thermal radiation is absorbed by radiatively-active ('greenhouse') gases in the atmosphere, principally water vapour, but also carbon dioxide, methane, the CFCs, ozone and other greenhouse gases. The absorbed energy is re-radiated in all directions, downwards as well as upwards such that the radiation that is eventually lost to space is from higher, colder levels in the atmosphere (see diagram below). The result is that the surface loses less heat to space than it would do in the absence of the greenhouse gases and consequently stays warmer than it would otherwise be. This phenomenon, which acts rather like a 'blanket' around the Earth, is known as the greenhouse effect.
What factors can change climate? Any factor which alters the radiation received from the Sun or lost to space, or which alters the redistribution of energy within the atmosphere, and between the atmosphere, land and ocean, will affect climate.
The Sun's output of energy is known to change by small amounts over an 11-year cycle, and variations over longer periods may occur. On time-scales of tens to thousands of years, slow variations in the Earth's orbit have led to changes in the seasonal and latitudinal distribution of solar radiation; these changes have played an important part in controlling the variations of past climate.
Increases in the concentration of the greenhouse gases will reduce the efficiency with which the Earth cools to space and will tend to warm the lower atmosphere and surface. The amount of warming depends on the size of the increase in concentration of each greenhouse gas, the radiative properties of the gases involved, and the concentration of other greenhouse gases already present in the atmosphere. It also can depend on local effects such as the variation with height of the concentration of the greenhouse gas, a consideration that may be particularly germane to water vapour which is not uniformly mixed throughout the atmosphere. The effect is not a simple one and the balance which is struck between these factors depends on many aspects of the climate system.
Aerosols (small particles) from volcanoes, emissions of sulphates from industry and other sources can absorb and reflect radiation. Moreover, changes in aerosol concentrations can alter cloud reflectivity through their effect on cloud properties. In most cases aerosols tend to cool climate. In general, they have a much shorter lifetime than greenhouse gases so their concentrations respond much more quickly to changes in emissions.
Any changes in the radiative balance of the Earth, including those due to an increase in greenhouse gases or in aerosols, will tend to alter atmospheric and oceanic temperatures and the associated circulation and weather patterns. However, climate varies naturally on all time-scales due to both external and internal factors. To distinguish man-made climate variations from those natural changes, it is necessary to identify the man-made 'signal' against the background 'noise' of natural climate variability.
A necessary starting point for the prediction of changes in climate due to increases in greenhouse gases and aerosols is an estimate of their future concentrations. This requires a knowledge of both the strengths of their sources (natural and man-made) and also the mechanisms of their eventual removal from the atmosphere (their sinks). The projections of future concentrations can then be used in climate models to estimate the climatic response. We also need to determine whether or not the predicted changes will be noticeable above the natural variations in climate. Finally, observations are essential in order to monitor climate, to study climatic processes and to help in the development and validation of models.
8 1992 IPCC Supplement
3. How has our Understanding of the Sources and Sinks of Greenhouse Gases and Aerosols Changed?
During the last eighteen months there have been a number of important advances in our understanding of greenhouse gases and aerosols. These advances include an improved quantitative understanding of the atmospheric distributions, trends, sources and sinks of greenhouse gases, their precursors and aerosols, and an improved understanding of the processes controlling their global budgets.
Atmospheric Concentrations and Trends of Long-lived Greenhouse Gases: The atmospheric concentrations of the major long-lived greenhouse gases [carbon dioxide ( C O 2 ) , methane ( C H 4 ) ,
nitrous oxide (NiO), chlorofluorocarbons (CFCs), and carbon tetrachloride (CCI4)] continue to increase because of human activities. While the growth rates of most of these gases have been steady or increasing over the past decade, that of C H 4 and some of the halocarbons has been decreasing. The rate for C H 4 has declined from about 20 ppbv/yr in the late 1970s to possibly as low as 10 ppbv/yr in 1989. Whi le a number of hypotheses have been forwarded to explain these observations, none is completely satisfactory.
Atmospheric Concentrations and Trends of Other Gases that Influence the Radiative Budget: Ozone (O3) is an effective greenhouse gas both in the stratosphere and in the troposphere. Significant decreases have been observed during the last one to two decades in total column O3 at all latitudes - except the tropics - in spring, summer and winter. The downward trends were larger during the 1980s than in the 1970s. These decreases have occurred predominantly in the lower stratosphere (below 25km), where the rate of decrease has been up to 10% per decade depending on altitude. In addition, there is evidence to indicate that O3 levels in the troposphere up to 10km altitude above the few existing ozonesonde stations at northern middle latitudes have increased by about 10% per decade over the past two decades. Also, the abundance of carbon monoxide (CO) appears to be increasing in the N H at about 1% per year. However, there is little new information on the global trends of other tropospheric O3 precursors, (non-methane hydrocarbons ( N M H C ) and oxides of nitrogen (NOj^)).
Sources and Sinks of Carbon Dioxide: The two primary sources of the observed increase in atmospheric C O 2 are combustion of fossil fuels and land-use changes; cement production is a further important source.
The emission of C O 2 from the combustion of fossil fuels grew between 1987 and 1989. Preliminary data for 1990
indicate similar emissions to 1989. The best estimate for global fossil fuel emissions in 1989 and 1990 is 6.010.5 GtC (f>, compared to 5.7±0.5 GtC in 1987 (IPCC, 1990). The estimated total release of carbon in the form of C O 2
from oil well fires in Kuwait during 1991 was 0.065 GtC, about 1% of total annual anthropogenic emissions.
The direct net flux of C O 2 from land-use changes (primarily deforestation), integrated over time, depends upon the area of land deforested, the rate of reforestation and afforestation, the carbon density of the original and replacement forests, and the fate of above-ground and soil carbon. These and other factors are needed to estimate annual net emissions but significant uncertainties exist in our quantitative knowledge of them. Since IPCC (1990) some progress has been made in reducing the uncertainties associated with the rate of deforestation, at least in Brazil. A comprehensive, multi-year, high spatial resolution satellite data set has been used to estimate that the average rate of deforestation in the Brazilian Amazonian forest between 1978 and 1989 was 2.1 million hectares (Mha) per year. The rate increased between 1978 and the mid-1980s, and has decreased to 1.4 Mha/yr in 1990. The Food and Agriculture Organization (FAO), using information supplied by individual countries, recently estimated that the rate of global tropical deforestation in closed and open canopy forests for the period 1981-1990 was about 17 Mha/yr, approximately 50% higher than in the period 1976-1980.
Despite the new information regarding rates of deforestation, the uncertainties in estimating C O 2 emissions are so large that there is no strong reason to revise the IPCC 1990 estimate of annual average net flux to the atmosphere of 1.6+1.0 GtC from land-use change during the decade of the 1980s.
Since IPCC (1990) particular attention has focussed on understanding the processes controlling the release and uptake of C O 2 from both the terrestrial biosphere and the oceans, and on the quantification of the fluxes. Based on models and the atmospheric distribution of C O i , it appears that there is a small net addition of carbon to the atmosphere from the equatorial region, a combination of outgassing of C O 2 from warm tropical waters and a terrestrial biospheric component that is the residual between large sources (including deforestation) and sinks. There appears to be a strong Northern Hemisphere sink, containing both oceanic and terrestrial biospheric com-
' ^ 1 GtC (gigatonne of carbon) equals one billion (one thousand million (10 )) tonnes of carbon

1992 IPCC Supplement 9
ponents, and a weak Southern Hemisphere (SH) sink. The previous IPCC global estimate for an ocean sink of 2.0±0.8 GtC per year is still a reasonable one. The terrestrial biospheric processes which are suggested as contributing to the sinks are sequestration due to forest regeneration, and fertilization arising from the effects of both CO2 and nitrogen (N), but none of these can be adequately quantified. This implies that the imbalance (of order 1-2 GtC/yr) between sources and sinks, i.e., "the missing sink", has not yet been resolved. This fact has significant consequences for estimates of future atmospheric CO2 concentrations (see Section 5) and the analysis of the concept of the Global Warming Potential (see Section 6).
Sources of Methane: A total (anthropogenic plus natural) annual emission of C H 4 of about 500Tg can be deduced from the magnitude of its sinks combined with its rate of accumulation in the atmosphere. While the sum of the individual sources is consistent with a total of 500Tg C H 4 , there are still many uncertainties in accurately quantifying the magnitude of emissions from individual sources. Significant new information includes a revised rate of removal of C H 4 by atmospheric hydroxyl (OH) radicals (because of a lower rate constant), a new evaluation of some of the sources (e.g., from rice fields) and the addition of new sources (e.g., animal and domestic waste). Recent C H 4 isotopic studies suggest that approximately lOOTg C H 4 (20% of the total C H 4 source) is of fossil origin, largely from the coal, o i l , and natural gas industries. Recent studies of C H 4
emissions from rice agriculture, in particular Japan, India, Australia, Thailand and China, show that the emissions depend on growing conditions, particularly soi l characteristics, and vary significantly. While the overall uncertainty in the magnitude of global emissions from rice agriculture remains large, a detailed analysis now suggests significantly lower annual emissions than reported in IPCC (1990). The latest estimate of the atmospheric lifetime of C H 4 is about 11 years.
Sources of Nitrous Oxide: Adipic acid (nylon) production, nitric acid production and automobiles with three-way catalysts have been identified as possibly significant anthropogenic global sources of nitrous oxide. However, the sum of all known anthropogenic and natural sources is still barely sufficient to balance the calculated atmospheric sink or to explain the observed increase in the atmospheric abundance of N2O.
Sources of Halogenated Species: The worldwide consumption of CFCs 11, 12, and 113 is now 40% below 1986 levels, substantially below the amounts permitted under the Montreal Protocol. Further
reductions are mandated by the 1990 London Amendments to the Montreal Protocol. As CFCs are phased out, HCFCs and HFCs will substitute, but at lower emission rates.
Stratospheric Ozone Depletion: Even i f the control measures of the 1990 London Amendments to the Montreal Protocol were to be implemented by all nations, the abundance of stratospheric chlorine and bromine will increase over the next several years. The Antarctic ozone hole, caused by industrial halocarbons, will therefore recur each spring. In addition, as the weight of evidence suggests that these gases are also responsible for the observed reductions in middle and high latitude stratospheric O3, the depletion at these latitudes is predicted to continue unabated through the 1990s.
Sources of Precursors of Tropospheric Ozone: Little new information is available regarding the tropospheric ozone precursors (CO, N M H C , and NO^), all of which have significant natural and anthropogenic sources. Their detailed budgets therefore remain uncertain.
Source of Aerosols: Industrial activity, biomass burning, volcanic eruptions, and sub-sonic aircraft contribute substantially to the formation of tropospheric and stratospheric aerosols. Industrial activities are concentrated in the Northern Hemisphere where their impact on tropospheric sulphate aerosols is greatest. Sulphur emissions, which are due in large part to combustion effluents, have a similar emissions history to that of anthropogenic CO2. Estimates of emissions of natural sulphur compounds have been reduced from previous figures, thereby placing more emphasis on the anthropogenic contribution.
4. Scenarios of Future Emissions
Scenarios of net greenhouse gas and aerosol precursor emissions for the next 100 years or more are necessary to support study of potential anthropogenic impacts on the climate system. The scenarios provide inputs to climate models and assist in the examination of the relative importance of relevant trace gases and aerosol precursors in changing atmospheric composition and climate. Scenarios can also help in improving the understanding of key relationships among factors that drive future emissions.
Scenario outputs are not predictions of the future, and should not be used as such; they illustrate the effect of a wide range of economic, demographic and pol icy assumptions. They are inherently controversial because they reflect different views of the future. The results of scenarios can vary considerably from actual outcomes


»3
u u
u
"S. a, 3
SJD 01 e
o O
s s s o
B O
S O
B
u
l is
c a X O Z g
•S O •a 00
§ §
I F
s -a
lO O (N O O <N (N
6 6 ON ON
E .•s o B ^ . 8 g o 3 g |
I I I
g a « c — o (U Cd (D
G E c«
S° ^ 1 oo" r-" Z 3
O (N
<N O O ^ <N (N S8
o o o 0\ OS 0\ ON
2§ •a m
1=
OS
2§ •a m
OS V3
U
o E2 3 (N
m so
u
OS •a OS
i 00
o
i3 ,o
5 £0
I I w 3
o t3 C
P-1
s i ON OS
2§ •a oa
OS
31
4>
U
£8 I S
OS
a. >, c o C
3 a T3
6 S3
G
E -^ OS
•a :S
t» E
o
w 3 c/: O
c o
s l l
S O bp r- M TO
I 2
o - S c
OS ^ =«
05 o C
U ^ * 6 2 '3)
.-e a s > OS g-
a-
•o o
1- — (U
ra o) ^
00
u O
1-
tu o S o (U 0 0
^ p
ON .t:
" I I] a a
—3 ^ I ~ 5 O ^ —
,S E -2 : i s i
1 8 §
H <; H
•3 5
- E d
1 5d - O
1

u CS
> Hi
s o
e
11
u b
ca
« S .2
U Z M S
e 2
. s i
.S oi ~ ? V a.
M C U t/3
2 00 p S
r~ r- r . (N — 00 M
o\ oo q fN ir>
ON r-O v-i — u-, VO O
(N r , r-' (N O
oo 5S 5
oo oc
^ CI d d
oo o d —'
ON r-~ NO ON
o —
oo t--
d d
ON O
d —
in o
S 2 ON ON
.a
ON
!2 p:
ON NO OO
oo NO oo ^
S 8
ND
00 <N (N NO
t— NO d d
NO t~-d d
u
IT)
o d
o — CN) IT) NO
ON d d
oo 00 d d
•o ON (/3
NO to
— CNl
NO ON'
§ 8 CN) INI
00 Jo 5
o o o
rNi ( M
d d
ON t/5
5 i
NO ON
NO —
^ NO •* NO
g 2
lO NO CN OO r~ NO
d d
OO o d —
CNl ON
1992 IPCC Supplement 13
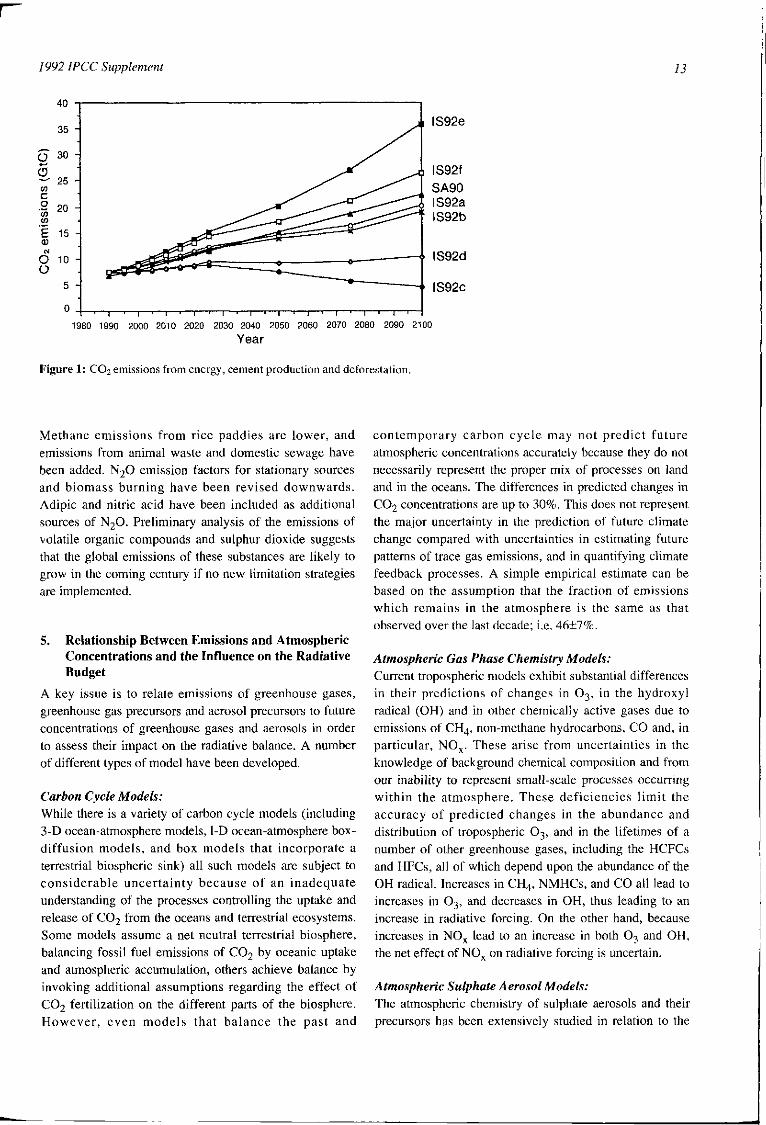
Figure 1: C O 2 emissions from energy, cement production and deforestation.
Methane emissions from rice paddies are lower, and emissions from animal waste and domestic sewage have been added. N2O emission factors for stationary sources and biomass burning have been revised downwards. Adipic and nitric acid have been included as additional sources of N2O. Preliminary analysis of the emissions of volatile organic compounds and sulphur dioxide suggests that the global emissions of these substances are likely to grow in the coming century if no new limitation strategies are implemented.
5. Relationship Between Emissions and Atmospheric Concentrations and the Influence on the Radiative Budget
A key issue is to relate emissions of greenhouse gases, greenhouse gas precursors and aerosol precursors to future concentrations of greenhouse gases and aerosols in order to assess their impact on the radiative balance. A number of different types of model have been developed.
Carbon Cycle Models: While there is a variety of carbon cycle models (including 3-D ocean-atmosphere models, 1-D ocean-atmosphere box-diffusion models, and box models that incorporate a terrestrial biospheric sink) all such models are subject to considerable uncertainty because of an inadequate understanding of the processes controlling the uptake and release of CO2 from the oceans and terrestrial ecosystems. Some models assume a net neutral terrestrial biosphere, balancing fossil fuel emissions of CO2 by oceanic uptake and atmospheric accumulation, others achieve balance by invoking additional assumptions regarding the effect of CO2 fertilization on the different parts of the biosphere. However, even models that balance the past and
contemporary carbon cycle may not predict future atmospheric concentrations accurately because they do not necessarily represent the proper mix of processes on land and in the oceans. The differences in predicted changes in CO2 concentrations are up to 30%. This does not represent the major uncertainty in the prediction of future climate change compared with uncertainties in estimating future patterns of trace gas emissions, and in quantifying climate feedback processes. A simple empirical estimate can be based on the assumption that the fraction of emissions which remains in the atmosphere is the same as that observed over the last decade; i.e. 46±7%.
Atmospheric Gas Phase Chemistry Models: Current tropospheric models exhibit substantial differences in their predictions of changes in O 3 , in the hydroxyl radical (OH) and in other chemically active gases due to emissions of C H 4 , non-methane hydrocarbons, CO and, in particular, NO^. These arise from uncertainties in the knowledge of background chemical composition and from our inability to represent small-scale processes occurring within the atmosphere. These deficiencies l imit the accuracy of predicted changes in the abundance and distribution of tropospheric O 3 , and in the lifetimes of a number of other greenhouse gases, including the HCFCs and HFCs, all of which depend upon the abundance of the O H radical. Increases in C H 4 , NMHCs, and CO all lead to increases in O 3 , and decreases in OH, thus leading to an increase in radiative forcing. On the other hand, because increases in NO^ lead to an increase in both O 3 and OH, the net effect of NO^ on radiative forcing is uncertain.
Atmospheric Sulphate Aerosol Models: The atmospheric chemistry of sulphate aerosols and their precursors has been extensively studied in relation to the

/ 992 IPCC Supplement 15
Table 3: Direct GWPsfor 100-year Time Horizon
Gas Direct Global Warming Potential (GWP)
Sign of the Indirect Component of the GWP
Carbon dioxide 1 none Methane 11 positive Nitrous oxide 270 uncertain CFC-11 3400 negative CFC-12 7100 negative HCFC-22 1600 negative HFC-134a 1200 none
them can be recommended. Although we are not yet in a position to recommend revised numerical values, we know, however, that the indirect G W P for methane is positive and could be comparable in magnitude to its direct value. In contrast, based on the sub-section above, the indirect GWPs for chlorine and bromine halocarbons are likely to be negative. The concept of a GWP for shortlived, inhomogeneously distributed constituents, such as CO, N M H C , and NO^ may prove inapplicable, although, as noted above, we know that these constituents will affect the radiative balance of the atmosphere through changes in tropospheric ozone and OH. Similarly, a GWP for SO2 is viewed to be inapplicable because of the non-uniform distribution of sulphate aerosols.
Influence of Changes in Solar Output: The existence of strong correlations between characteristics of the solar activity cycle and global mean temperature has been reported. The only immediately plausible physical explanation of these correlations involves variabihty of the sun's total irradiance on time-scales longer than that of the 11-year activity cycle. Since precise measurements of the irradiance are only available for the last decade, no firm conclusions regarding the intfuence of solar variability on climate change can be drawn.
There has been some clarification of the nature of water vapour feedback, although the radiative effects of clouds and related processes continue to be the major source of uncertainty and there remain uncertainties in the predicted changes in upper tropospheric water vapour in the tropics. Biological feedbacks have not yet been taken into account in simulations of climate change.
Increased confidence in the geographical patterns of climate change w i l l require new simulations with improved coupled models and with radiative forcing scenarios that include aerosols.
Confidence in regional climate patterns based directly on G C M output remains low and there is no consistent evidence regarding changes in variability or storminess. G C M results can be interpolated to smaller scales using statistical methods (correlating regional climate with the large-scale flow) or a nested approach (high-resolution, regional climate models driven by large-scale G C M results). Both methods show promise but an insufficient number of studies have yet been completed to give an improved global picture of regional climate change due to increases in greenhouse gases; in any event both interpolation methods depend critically on the quality of the large-scale flow in the G C M . Given our incomplete knowledge of climate, we cannot rule out the possibility of surprises.
7. Confidence in Model Predictions
There continues to be slow improvement in the ability of models to simulate present climate, although further improvements in the model resolution and the parametrization of physical processes are needed. Since the last report, further evidence has accumulated that atmospheric models are capable of reproducing a range of aspects of atmospheric variabil i ty. Coupled ocean-atmosphere models produce variability on decadal time-scales similar in some respects to that observed, and ocean models show longer term fluctuations associated with changes in the thermohaline circulation.
8. Simulated Rates of Change in Climate and their Geographical Distribution
Results of General Circulation Models (GCMs) available to the 1990 report mainly concerned equilibrium simulations. Only one transient model run (i.e., where the time-varying response of the climate to steadily increasing greenhouse gas concentrations is simulated) had been completed.
Since then many papers have appeared in the refereed literature concerned with climate models and their results. Significant progress has been made in the area of transient models, with four modelling groups having carried out

1992 IPCC Supplement 17
climate simulations for up to 100 years using coupled atmosphere-ocean global climate models (CGCMs) which incorporate a detailed description of the deep ocean and therefore can simulate the climate lag induced by the deep ocean circulation. These models require substantial adjustments to fluxes of heat and fresh water in order to achieve a realistic simulation of present climate and this may distort the models' response to small perturbations such as those associated with increasing greenhouse gases. For simulations of future climate with these models, carbon dioxide concentrations have been increased at rates close to 1% per year (approximately the equivalent radiatively to the current rate of increase of greenhouse gases).
Internal variability obscures the geographical patterns of change during the first few decades of the experiments. However, once these patterns become established, they vary relatively little as the integrations progress and are similar to those produced by equilibrium models in a number of ways, for instance:
(i) surface air temperatures increase more over land than over oceans;
(ii) precipitation increases on average at high latitudes, in the monsoon region of Asia and in the winter at mid-latitudes;
(iii) over some mid-latitude continental areas values of soil moisture are lower on average in summer.
The transient CO2 simulations, however, show that over the northern North Atlantic and the southem oceans near Antarctica the warming is reduced by 60% or more relative to equilibrium simulations at the time of doubling CO2.
Much further development and validation of coupled models is required.
9. What Would We Now Estimate for Climate Change?
The new simulations using coupled ocean-atmosphere GCMs, which do not include the effects of sulphates and ozone depletion, generally confirm the IPCC (1990) estimates of future warming at rates of about 0.3°C/decade (range 0.2 to 0.5°C/decade) over the next century for IPCC 1990 Scenario A . Because G C M s do not yet include possible opposing anthropogenic influences, including the forcing from sulphate aerosols and stratospheric ozone depletion, the net rate of increase in surface temperature is expected to be less, at least during the period for which sulphur emissions continue to increase, than would be expected from greenhouse gas forcing alone. However, the globally averaged magnitude of the effect of sulphate aerosols has not yet been calculated accurately and further work is needed.
The simulated rate of change of sea level due to oceanic thermal expansion only ranges from 2 to 4cm/decade, again consistent with the previous report.
New IPCC 1992 emissions scenarios (IS92a-f; see Section 4) have been derived in the light of new information and international agreements. In order to provide an initial assessment of the effect of the new scenarios, the change in surface temperature has been estimated with the simple climate model used in the IPCC 1990 report which has been calibrated against the more comprehensive coupled ocean-atmosphere models (see page 16 for a description of models). These calculations include, in the same way as did the 1990 calculations, the direct radiative forcing effects of all the greenhouse gases included in the scenarios. The effect of stratospheric ozone depletion and of sulphate aerosols have not been included, which again parallels the 1990 calculations. Figure 2 (see page 18) shows (a) the temporal evolution of surface temperature for IS92a, assuming the high, "best estimate" and low chmate sensitivities (4.5, 2.5 and 1.5°C), and (b) the temperature changes for the six 1992 IPCC scenarios and the 1990 Scenario A, assuming the "best estimate" of climate sensitivity (see page 16 for the definition of climate sensitivity).
10. The Updated Record of Global Mean Temperatures
Continuing research into the nineteenth century ocean temperature record has not significantly altered our calculation of surface temperature warming over the past 100-130 years of 0.45+0.15 °C. Furthermore, global surface temperatures for 1990 and 1991 have been similar to those of the warmest years of the 1980s and continue to be warmer than the rest of the record. The research has, however, led to a small adjustment in hemispheric temperatures. The long-term warming trends assessed in each hemisphere are now more nearly equal, with the Southern Hemisphere marginally warmer in the late nineteenth century and the Northern Hemisphere trend unchanged from previous estimates.
A notable feature over considerable areas of the continental land masses of the Northern Hemisphere is that warming over the last few decades is primarily due to an increase of night-time rather than daytime temperatures. These changes appear to be partly related to increases in cloudiness but other factors cannot be excluded such as a direct cooling effect of aerosols on maximum temperatures in sunny weather, an influence of increasing concentrations of greenhouse gases and some residual influence of urbanization on minimum temperatures. A more complete study is needed as only 25% of the global land area has been analysed. In this regard, regional changes in maximum, minimum and mean temperature related to changes in land use (e.g., desertification, deforestation or widespread irrigation) may need to be identified separately.


1992 IPCC Supplement 19
amounts of aerosol into the stratosphere by the eruptions of E l Chichon (1982) and Mt. Pinatubo (1991). Globally, temperature rises in the lower stratosphere were about T C and 1.3°C respectively; stratospheric warming due to E l Chichon lasted nearly two years while that due to Mt. Pinatubo is still underway. The longer radiosonde record, however, shows a significant global cooling trend of about 0.4°C per decade since the middle 1960s in the lower stratosphere.
11. Are There any Trends in Other Climatically Important Quantities?
Precipitation variations of practical significance have been documented on many time and space scales, but due to data coverage and inhomogeneity problems nothing can be said about global-scale changes. An apparent increase of water vapour in the tropics parallels the increase in lower tropospheric temperature but it is not yet possible to say to what extent the changes are real and whether they are larger than natural variability.
A small, irregular, decrease of about 8% has been observed in annually averaged snow cover extent over the Northern Hemisphere since 1973 in a new, improved, compilation of these data. The reduction is thought to be real because annual values of snow cover extent and surface air temperatures over the extratropical Northern Hemisphere land have a high correlation of -0.76.
There is evidence that, regionally, relatively fast (sometimes called abrupt) climate changes can occur. These changes may persist for up to several decades but are often a function of season. These fast changes are poorly understood, but can be of considerable practical importance.
12. Are the Observed Temperature Changes Consistent with Predicted Temperature Changes?
C G C M s , which do not yet take into account changes in aerosols, predict a greater degree of warming in the Northern Hemisphere (NH) than in the Southern Hemisphere (SH), a result of the greater extent of land in the N H which responds more rapidly to forcing. The observed larger warming of the SH in recent decades (0.3°C between 1955 and 1985) than in the N H (which hardly warmed at all over the same period) is at first sight in conflict with this prediction. Recently, however, the N H has started to warm quite rapidly. The reasons for the differences in observed warming rates in the two hemispheres are not known though man-made aerosols (see Section 6) and changes in ocean circulation may have played a part.
Furthermore, increases in CFCs may have reduced ozone levels sufficiently to offset in a globally-averaged sense the direct greenhouse effect of CFCs. Consequently,
the estimates of warming over the last 100 years due to increases in greenhouse gases made in the original report may be somewhat too rapid because they did not take account of these cooling influences. Taking this into account could bring the results of model simulations closer to the observed changes.
Individual volcanic eruptions, such as that of E l Chichon, may have led to surface cooling over several years but should have negligible effect on the long-term trend. Some influence of solar variations on time-scales associated with several sunspot cycles remains unproven but is a possibihty.
The conclusion of the 1990 report remains unchanged: "the size of this warming is broadly consistent with predictions of climate models, but it is also of the same magnitude as natural climate variability. Thus the observed increase could be largely due to this natural variability; alternatively this variability and other human factors could have offset a still larger human-induced greenhouse warming".
13. Key Uncertainties and Further Work Required
The prediction of future climate change is critically dependent on scenarios of future anthropogenic emissions of greenhouse gases and other climate forcing agents such as aerosols. These depend not only on factors which can be addressed by the natural sciences but also on factors such as population and economic growth and energy policy where there is much uncertainty and which are the concern of the social sciences. Natural and social scientists need to cooperate closely in the development of scenarios of future emissions.
Since the 1990 report there has been a greater appreciation of many of the uncertainties which affect our predictions of the timing, magnitude and regional patterns of climate change. These continue to be rooted in our inadequate understanding of:
• sources and sinks of greenhouse gases and aerosols and their atmospheric concentrations (including their indirect effects on global warming)
• clouds (particularly their feedback effect on greenhouse-gas-induced global warming, also the effect of aerosols on clouds and their radiative properties) and other elements of the atmospheric water budget, including the processes controlling upper level water vapour
• oceans, which through their thermal inertia and possible changes in circulation, influence the timing and pattern of climate change
• polar ice sheets (whose response to climate change also affects predictions of sea level rise)
• land surface processes and feedbacks, including hydrological and ecological processes which couple


1992 IPCC Supplement 21
ANNEX
Progress in tiie Development of an I P C C Methodology for National Inventories of Net Emissions of Greenhouse Gases
Scientific assessment is primarily concerned with sources and sinks at the global, and large region level but, in order to support national and international responses to climate change, it is necessary to estimate emissions and sinks at the national level in an agreed and consistent way.
IPCC (1991) has estabhshed a work programme to:
(i) develop an approved detailed methodology for calculating national inventories of greenhouse gas emissions and sinks
(ii) assist all participating countries to implement this methodology and provide results by the end of 1993.
This programme is based on preliminary work sponsored by the Organization for Economic Cooperation and Development ( O E C D , 1991). O E C D and the International Energy Agency ( lEA) are continuing to provide technical support to the IPCC work programme. The programme w i l l manage the development and approval of inventory methods and procedures, and the collection and evaluation of data. It will collaborate with other sponsors including the Global Environment Facility (GEF) , the Asian Development Bank, the European Community, U N E C E and individual donor countries, to encourage funding of technical cooperation projects in greenhouse gas (GHG) inventories.
The IPCC requested that participating countries provide any available G H G emissions inventory data to the IPCC by the end of September 1991. As of January 1992, 18 countries have submitted complete or partial G H G
inventories (see Table below); most relate to average emissions over one, two or three years in the period 1988 to 1990. This process has been particularly useful in identifying problems in coverage and consistency of currently available inventories.
An IPCC Workshop on National G H G Inventories, held in Geneva from 5 to 6 December 1991, provided guidance on needed improvements in the draft methodology and priorities for the work programme. Numerous improvements to the methodology were agreed upon, and priorities were proposed for the work programme and for technical cooperation activities. As a result of the preliminary data collection, the workshop, and other comments received, the fo l lowing major priorities for the I P C C work programme have been established:
Methodology
• Develop a simpler methodology and streamlined "workbook" document to assist users in its implementation
• Work with experts to develop a new and simpler method for calculating CO2 emissions from forestry and land-use change
• Establish technical expert groups to improve the methodology for C H 4 from rice and fossil fuel production, and other key gases and source types
• Work with experts to include halocarbons in the G H G inventory starting with data available from the Montreal Protocol process
• Develop and disseminate regionally-applicable emissions factors and assumptions.
Annex Table: Countries which have submitted complete or partial inventories of national greenhouse gas emissions (by January 1992)
Australia Germany Sweden Belgium haly Switzerland Canada Netherlands Thailand Denmark New Zealand Vietnam Finland Norway United Kingdom France Poland United States