the 19th annual casino gaming executive …...executive satisfaction survey received a total of...
TRANSCRIPT
The 19th Annual
CASINO GAMING EXECUTIVESATISFACTION SURVEYRESULTS


The 19th Annual
CASINO GAMING EXECUTIVESATISFACTION SURVEYRESULTS
TABLE OF CONTENTS
Welcome ........................................................................................................... 2Methodology ..................................................................................................... 3Employers Of Choice - Brick & Mortar Properties ................................................. 6Employers Of Choice - iGaming/Online Casino & Sportsbook ................................ 8Optimism ....................................................................................................... 10Employee Satisfaction .................................................................................... 11Location ......................................................................................................... 14Priorities ........................................................................................................ 16Work-Life Balance ........................................................................................... 18Vacation ......................................................................................................... 20Paid Time Off .................................................................................................. 22Conclusion ..................................................................................................... 24About The Authors .......................................................................................... 25

2 CASINO GAMING EXECUTIVE SATISFACTION SURVEY – 19TH ANNUAL
The 19th Annual Executive Satisfaction Survey, sponsored and produced by Bristol Associates, Inc. and Spectrum Gaming Group, is designed to help the gaming industry attract, retain, and motivate its executive talent. The analysis conveys how the attitudes and preferences of casino gaming professionals have changed over the past decade and how they relate to overall market conditions.
Questions newly added to the survey are related to work-life balance, paid time off (PTO), and executives’ perception of online gaming and sports betting organizations.
The authors of this report are Erika Castro, Benjamin Farber, and Jessa Farber of Bristol Associates, Inc. and Jeremy Pollock, Michael Pollock, and Joseph Weinert of Spectrum Gaming Group.
NUMBER OF RESPONDENTS PER YEAR
RESPONDENTS IN 2019FROM 2018+36%
0
200
400
600
800
1000
1200
1400
1600
1800
2000
2000
*There was no survey in 2002
2001 2002* 2003 2004 2005 2006 2007 2008 2009 2010 2011 2012 2013 2014 2015 2016 2017 2018 2019
Number of Respondents Per Year
WELCOME TO THE RESULTS OF OUR 2019 SURVEY
3THE RESULTS - 2019
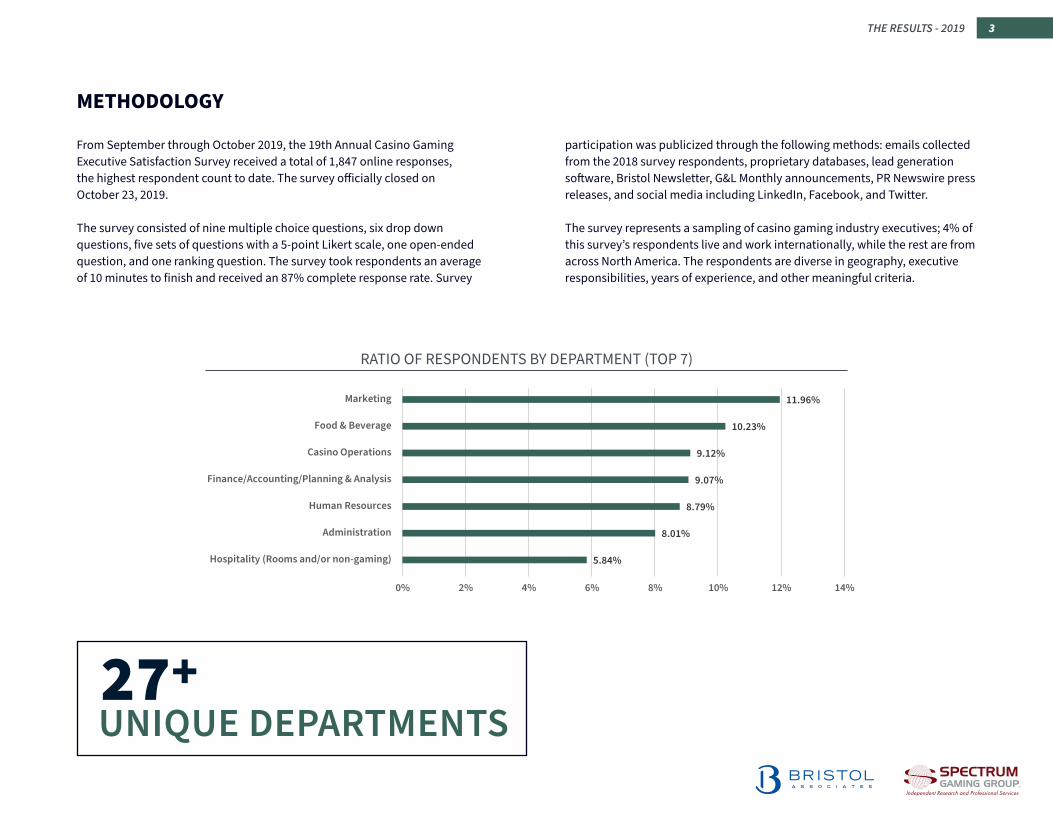
RATIO OF RESPONDENTS BY DEPARTMENT (TOP 7)
METHODOLOGY
UNIQUE DEPARTMENTS27+
From September through October 2019, the 19th Annual Casino Gaming Executive Satisfaction Survey received a total of 1,847 online responses, the highest respondent count to date. The survey officially closed on October 23, 2019.
The survey consisted of nine multiple choice questions, six drop down questions, five sets of questions with a 5-point Likert scale, one open-ended question, and one ranking question. The survey took respondents an average of 10 minutes to finish and received an 87% complete response rate. Survey
participation was publicized through the following methods: emails collected from the 2018 survey respondents, proprietary databases, lead generation software, Bristol Newsletter, G&L Monthly announcements, PR Newswire press releases, and social media including LinkedIn, Facebook, and Twitter.
The survey represents a sampling of casino gaming industry executives; 4% of this survey’s respondents live and work internationally, while the rest are from across North America. The respondents are diverse in geography, executive responsibilities, years of experience, and other meaningful criteria.
0% 2% 4% 6% 8% 10% 12% 14%
Departments
Hospitality (Rooms and/or non-gaming) 5.84%
Administration 8.01%
Human Resources 8.79%
Finance/Accounting/Planning & Analysis 9.07%
Casino Operations 9.12%
Food & Beverage 10.23%
Marketing 11.96%

4 CASINO GAMING EXECUTIVE SATISFACTION SURVEY – 19TH ANNUAL
EXECUTIVE LEVELS
OWNING/MANAGING ORGANIZATIONS
Property #1General Manager
7%
Property #4Sta� and All Other
5%
Corporate #1President
4%
Corporate #4Sta� and All Other
3%
Respondents - Executive Level
Property #2Director/VP
28%
Property #3Manager
20%
Corporate #2Vice President
15%
Corporate #3Director
18%
Casino Supplier2%
Regulatory Agency<1%
Lottery<1% Other
3%
Publicly HeldCasino Corporation
37%
Privately HeldCasino Corporation
22%
Native AmericanCasino
35%
Owning/Managing Organizations

5THE RESULTS - 2019
The survey design ensures that the individuals who participated have current or prior experience working in the casino industry and that no duplicates were recorded.
Additionally, the survey did not ask questions that could identify respondents by gender, age, or other criteria that could be perceived as potentially discriminatory in hiring. The survey is not scientific and simply measures the views of those who elect to respond. Changes in the qualities of respondents from year to year could be among the factors leading to swings in any particular measure.
SALARY RANGES
16%
15%
25%
17%
16%
5%2% 4%
Respondents - Salary
$500K+
$399K$300K -
$200
K - $
299K
$400K - $499K
$150K - $199K
$100K - $149K
$75K - $99K
Less than $75K

6 CASINO GAMING EXECUTIVE SATISFACTION SURVEY – 19TH ANNUAL
EMPLOYERS OF CHOICE - BRICK & MORTAR PROPERTIES
0%
5%
10%
15%
20%
25%
Full House
Resorts
, Inc.
Osage Casin
os
Jacobs E
nterta
inm
ent, In
c.
Nevada G
old
Seneca G
aming
Rush Stre
et Gam
ing
A inity G
amin
g
Golden Ente
rtain
ment
Foxwoods R
esort
Casino
Cherokee N
ation Ente
rtain
ment
Jack Ente
rtainm
ent
Marnell G
amin
g
Mucklesh
oot Casin
o
Gila River C
asinos
The Cordish
Companies
Choctaw Casin
os & Reso
rts
Churchill
Downs
Mohegan Sun
Statio
n Casinos
Delaware N
orth
Landry’s
(Gold
en Nugget)
Eldora
do Resorts
Las Vegas S
ands
Pechanga Reso
rt Casin
o
Boyd G
amin
g
Caesars
Enterta
inment
San Manuel C
asino
Wynn Reso
rts
MGM Resorts
Inte
rnatio
nal
Semin
ole Hard
Rock
Penn Natio
nal Gam
ing
Employers of Choice - Brick & Mortar Properties
17.71%; 7
.22%; 6
.73%
21.01%; 5
.69%; 6
.86%
1st Choice
2nd Choice
3rd Choice
% Firs
t; Seco
nd; Third
4.85%; 9
.27%; 6
.73%
4.97%; 8
.18%; 8
.47%
7.40%; 3
.19%; 2
.91%
7.77%; 1
1.63%; 1
3.20%
8.51%; 1
3.99%; 1
1.77%
2.92%; 4
.79%; 4
.92%
3.11%; 4
.73%; 4
.14%
3.17%; 4
.41%; 3
.04%
1.80%; 3
.71%; 4
.66%
1.86%; 1
.66%; 1
.88%
2.05%; 1
.47%; 2
.26%
1.62%; 2
.30%; 1
.94%
1.62%; 2
.75%; 3
.56%
1.18%; 1
.79%; 1
.36%
1.24%; 0
.96%; 1
.42%
0.62%; 0
.83%; 1
.03%
0.68%; 1
.28%; 0
.71%
1.06%; 0
.96%; 0
.78%
1.12%; 0
.83%; 0
.97%
0.50%; 1
.21%; 1
.55%
0.56%; 1
.92%; 2
.59%
0.62%; 0
.96%; 1
.36%
0.12%; 0
.45%; 0
.39%
0.19%; 0
.26%; 0
.39%
0.25%; 0
.51%; 0
.58%
0.25%; 0
.13%; 0
.71%
0.37%; 0
.64%; 0
.84%
0.44%; 1
.53%; 1
.16%
0.44%; 0
.77%; 1
.10%
Out of 31 listed casino corporations and standalone casino properties, casino gaming executives were asked to choose their top three employers of interest.
Penn National Gaming takes the top ranking with 21.01%, breaking Seminole Hard Rock’s four-year streak as top employer of choice from the annual survey. The last time that Penn National Gaming ranked top employer of choice was in 2014.
Wynn Resorts bumped up three rankings while Caesars Entertainment and Pechanga Resort Casino bumped up two rankings from 2018. Las Vegas Sands and Eldorado Resorts joined the top 10 ranking for 2019.
While MGM Resorts International ranked third place as a first choice, the organization received the most votes when executives chose their second employer of choice, followed by Wynn Resorts. Wynn Resorts also received the most votes for third employer of choice.
PENN NATIONALGAMING#1
SEMINOLEHARD ROCK#2
MGM RESORTSINTERNATIONAL#3

7THE RESULTS - 2019
0%
5%
10%
15%
20%
25%
Full House
Resorts
, Inc.
Osage Casin
os
Jacobs E
nterta
inm
ent, In
c.
Nevada G
old
Seneca G
aming
Rush Stre
et Gam
ing
A inity G
amin
g
Golden Ente
rtain
ment
Foxwoods R
esort
Casino
Cherokee N
ation Ente
rtain
ment
Jack Ente
rtainm
ent
Marnell G
amin
g
Mucklesh
oot Casin
o
Gila River C
asinos
The Cordish
Companies
Choctaw Casin
os & Reso
rts
Churchill
Downs
Mohegan Sun
Statio
n Casinos
Delaware N
orth
Landry’s
(Gold
en Nugget)
Eldora
do Resorts
Las Vegas S
ands
Pechanga Reso
rt Casin
o
Boyd G
amin
g
Caesars
Enterta
inment
San Manuel C
asino
Wynn Reso
rts
MGM Resorts
Inte
rnatio
nal
Semin
ole Hard
Rock
Penn Natio
nal Gam
ing
Employers of Choice - Brick & Mortar Properties
17.71%; 7
.22%; 6
.73%
21.01%; 5
.69%; 6
.86%
1st Choice
2nd Choice
3rd Choice
% Firs
t; Seco
nd; Third
4.85%; 9
.27%; 6
.73%
4.97%; 8
.18%; 8
.47%
7.40%; 3
.19%; 2
.91%
7.77%; 1
1.63%; 1
3.20%
8.51%; 1
3.99%; 1
1.77%
2.92%; 4
.79%; 4
.92%
3.11%; 4
.73%; 4
.14%
3.17%; 4
.41%; 3
.04%
1.80%; 3
.71%; 4
.66%
1.86%; 1
.66%; 1
.88%
2.05%; 1
.47%; 2
.26%
1.62%; 2
.30%; 1
.94%
1.62%; 2
.75%; 3
.56%
1.18%; 1
.79%; 1
.36%
1.24%; 0
.96%; 1
.42%
0.62%; 0
.83%; 1
.03%
0.68%; 1
.28%; 0
.71%
1.06%; 0
.96%; 0
.78%
1.12%; 0
.83%; 0
.97%
0.50%; 1
.21%; 1
.55%
0.56%; 1
.92%; 2
.59%
0.62%; 0
.96%; 1
.36%
0.12%; 0
.45%; 0
.39%
0.19%; 0
.26%; 0
.39%
0.25%; 0
.51%; 0
.58%
0.25%; 0
.13%; 0
.71%
0.37%; 0
.64%; 0
.84%
0.44%; 1
.53%; 1
.16%
0.44%; 0
.77%; 1
.10%

8 CASINO GAMING EXECUTIVE SATISFACTION SURVEY – 19TH ANNUAL
EMPLOYERS OF CHOICE - iGAMING/ONLINE CASINO & SPORTSBOOK
This was the first time that the survey asked respondents to select their most favored iGaming/Online Casino and Sportsbook organizations.
Hard Rock Online Casino ranked first for employer of first choice with 18.58% of respondents, William Hill Sports Book came in second place with 14.85%, and DraftKings Sportsbook came in third with 12.49%.
When determining second employer of choice, DraftKings Sportsbook ranked at the top, followed by Hard Rock Online Casino and FanDuel Online Casino & Sportsbook tying for second place.
For third employer of choice, Hard Rock Online Casino received the highest amount of votes, followed by William Hill Sports Book in second place and playMGM in third place.
0%
2%
4%
6%
8%
10%
12%
14%
16%
18%
20%
Party
Casin
o
Unibet
Onlin
e Cas
ino &
Sportsbook
Pokerst
ars N
J Cas
ino
Bovada
BetSta
rs
Resorts
Onlin
e Cas
ino &
Sportsbook
Betfa
ir Cas
ino
Pointsb
et Sports
book
SB Tech
BetAm
erica
SugarH
ouse O
nline C
asin
o & Sports
book
(Rush
stree
t Inte
ract
ive)
Virgin
Onlin
e Cas
ino
Pala O
nline C
asin
o
Harra
h’s Onlin
e Cas
ino
Mohegan
Sun Onlin
e
888 O
nline C
asin
o/Sports
book
Tropica
na Onlin
e Cas
ino
Golden
Nugg
et O
nline C
asin
o
Borgat
a Onlin
e Cas
ino
FanDuel
Online C
asin
o & Sports
book
playMGM
Caesa
rs Onlin
e Cas
ino &
Sports
Dra�Kin
gs Sports
book
William
Hill
Sports Book
Hard Rock
Onlin
e Cas
ino
Employers of Choice - iGaming & Sportsbook
1st Choice
2nd Choice
3rd Choice
% Firs
t; Seco
nd; Third
14.8
5%; 7
.91%
; 8.9
2%
18.5
8%; 1
1.13
%; 1
0.19
%
9.14
%; 9
.16%
; 7.7
9%
12.4
9%; 1
2.19
%; 6
.99%
2.49
%; 3
.89%
; 4.6
6%
2.86
%; 1
.71%
; 2.6
6%
4.04
%; 2
.50%
; 4.5
9%
4.79
%; 3
.89%
; 4.7
3%
4.97
%; 6
.46%
; 4.2
6%
5.66
%; 1
1.13
%; 7
.92%
6.46
%; 8
.37%
; 8.0
6%
0.68
%; 1
.38%
; 3.1
3%
0.75
%; 1
.45%
; 2.0
0%
1.55
%; 1
.58%
; 2.4
0%
1.68
%; 3
.23%
; 4.0
6%
2.05
%; 1
.12%
; 1.3
3%
2.49
%; 6
.52%
; 6.4
6%
0.81
%; 0
.66%
; 0.6
7%
0.81
%; 0
.79%
; 1.4
0%
0.93
%; 1
.78%
; 1.8
6%
0.37
%; 0
.92%
; 2.2
6%
0.50
%; 0
.53%
; 1.0
0%
0.56
%; 0
.72%
; 1.0
7%
0.25
%; 0
.59%
; 1.2
0%0.
25%
; 0.4
0%; 0
.40%HARD ROCK
ONLINE CASINO#1WILLIAM HILL#2DRAFTKINGS
SPORTSBOOK#3
SPORTS BOOK

9THE RESULTS - 2019
0%
2%
4%
6%
8%
10%
12%
14%
16%
18%
20%
Party
Casin
o
Unibet
Onlin
e Cas
ino &
Sportsbook
Pokerst
ars N
J Cas
ino
Bovada
BetSta
rs
Resorts
Onlin
e Cas
ino &
Sportsbook
Betfa
ir Cas
ino
Pointsb
et Sports
book
SB Tech
BetAm
erica
SugarH
ouse O
nline C
asin
o & Sports
book
(Rush
stree
t Inte
ract
ive)
Virgin
Onlin
e Cas
ino
Pala O
nline C
asin
o
Harra
h’s Onlin
e Cas
ino
Mohegan
Sun Onlin
e
888 O
nline C
asin
o/Sports
book
Tropica
na Onlin
e Cas
ino
Golden
Nugg
et O
nline C
asin
o
Borgat
a Onlin
e Cas
ino
FanDuel
Online C
asin
o & Sports
book
playMGM
Caesa
rs Onlin
e Cas
ino &
Sports
Dra�Kin
gs Sports
book
William
Hill
Sports Book
Hard Rock
Onlin
e Cas
ino
Employers of Choice - iGaming & Sportsbook
1st Choice
2nd Choice
3rd Choice
% Firs
t; Seco
nd; Third
14.8
5%; 7
.91%
; 8.9
2%
18.5
8%; 1
1.13
%; 1
0.19
%
9.14
%; 9
.16%
; 7.7
9%
12.4
9%; 1
2.19
%; 6
.99%
2.49
%; 3
.89%
; 4.6
6%
2.86
%; 1
.71%
; 2.6
6%
4.04
%; 2
.50%
; 4.5
9%
4.79
%; 3
.89%
; 4.7
3%
4.97
%; 6
.46%
; 4.2
6%
5.66
%; 1
1.13
%; 7
.92%
6.46
%; 8
.37%
; 8.0
6%
0.68
%; 1
.38%
; 3.1
3%
0.75
%; 1
.45%
; 2.0
0%
1.55
%; 1
.58%
; 2.4
0%
1.68
%; 3
.23%
; 4.0
6%
2.05
%; 1
.12%
; 1.3
3%
2.49
%; 6
.52%
; 6.4
6%
0.81
%; 0
.66%
; 0.6
7%
0.81
%; 0
.79%
; 1.4
0%
0.93
%; 1
.78%
; 1.8
6%
0.37
%; 0
.92%
; 2.2
6%
0.50
%; 0
.53%
; 1.0
0%
0.56
%; 0
.72%
; 1.0
7%
0.25
%; 0
.59%
; 1.2
0%0.
25%
; 0.4
0%; 0
.40%
10 CASINO GAMING EXECUTIVE SATISFACTION SURVEY – 19TH ANNUAL
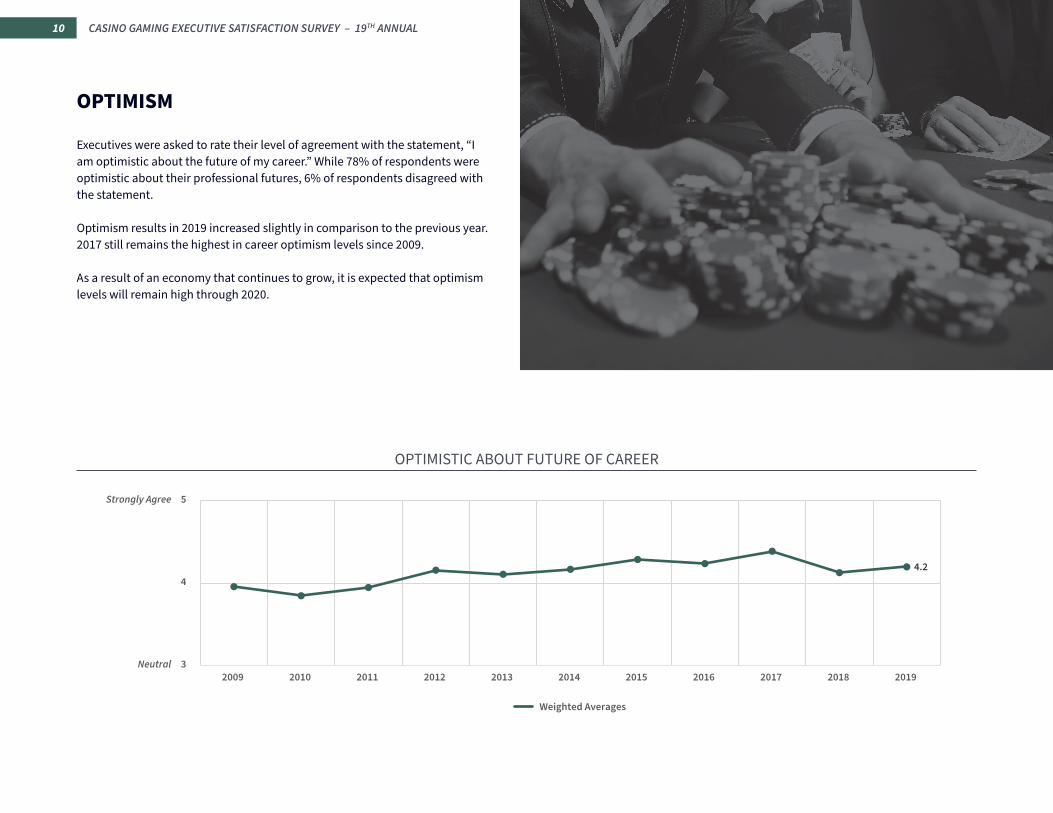
OPTIMISTIC ABOUT FUTURE OF CAREER
Executives were asked to rate their level of agreement with the statement, “I am optimistic about the future of my career.” While 78% of respondents were optimistic about their professional futures, 6% of respondents disagreed with the statement.
Optimism results in 2019 increased slightly in comparison to the previous year. 2017 still remains the highest in career optimism levels since 2009.
As a result of an economy that continues to grow, it is expected that optimism levels will remain high through 2020.
OPTIMISM
3
4
5
2009 2010 2011 2012 2013 2014 2015 2016 2017 2018 2019
I am optimistic about the future of my career
Strongly Agree
Weighted Averages
Neutral
4.2

11THE RESULTS - 2019
EMPLOYEE SATISFACTION 2019 vs 2018
EMPLOYEE SATISFACTION
Executives were asked to rate their level of agreement with statements that measure their satisfaction with their employer, management team, and staff employees as well as their job search status.
Employee satisfaction and retention has slightly increased over the past year. There has been a noticeable decrease since 2018 regarding confidence in finding a better job. As a result, fewer executives were actively searching for a new position in 2019.
Respondents were also asked how many different employers they have worked for in the last year and last five years. Within the past year, 76% of respondents have stayed at their current employer with less than 2% of respondents changing jobs three or more times. Within the past five years, 42% of respondents have stayed at their current employer with less than 2% of respondents changing employers five or more times.
3.44
3.69
2.54
3.10
3.78
3.65
3.61
1 2 3 4 5
Employee Satisfaction in 2019 vs 2018
2019 2018
I have no interest in leaving my present employer within the next two years
I would seriously consider a reasonable o er of new employment
I am actively searching for a new position
I am confident that I can find a better job somewhere else
My company is working hard to keep its sta employees satisfied
My company is working hard to keep its management employees satisfied
My company is working hard to keep me satisfied
Strongly Disagree Neutral Strongly Agree
12 CASINO GAMING EXECUTIVE SATISFACTION SURVEY – 19TH ANNUAL
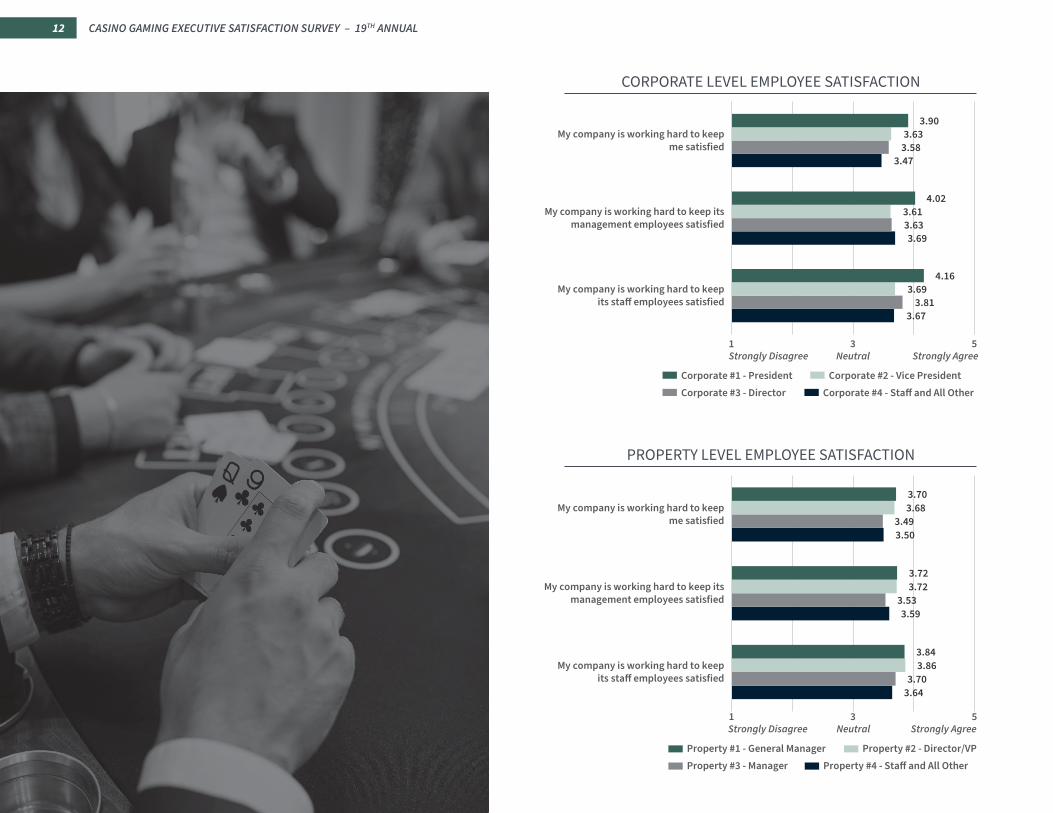
CORPORATE LEVEL EMPLOYEE SATISFACTION
PROPERTY LEVEL EMPLOYEE SATISFACTION
3.67
3.69
3.47
3.81
3.63
3.58
3.69
3.61
3.63
4.16
4.02
3.90
1 3 5
My company is working hard to keep its sta� employees satisfied
My company is working hard to keep its management employees satisfied
My company is working hard to keep me satisfied
Corporate Job Levels to Employee Satisfaction
Corporate #1 - President Corporate #2 - Vice PresidentCorporate #3 - Director Corporate #4 - Sta� and All Other
Strongly Disagree Neutral Strongly Agree
3.64
3.59
3.50
3.70
3.53
3.49
3.86
3.72
3.68
3.84
3.72
3.70
1 3 5
My company is working hard to keepits sta� employees satisfied
My company is working hard to keep itsmanagement employees satisfied
My company is working hard to keepme satisfied
Property Job Levels to Employee Satisfaction
Property #1 - General Manager Property #2 - Director/VPProperty #3 - Manager Property #4 - Sta� and All Other
Strongly Disagree Neutral Strongly Agree

13THE RESULTS - 2019
CONFIDENCE IN FINDING A BETTER JOB SOMEWHERE ELSE
Employee satisfaction levels were generally even across the board. Most respondents in the Corporate #1 - President level position believed their management, staff, and themselves to be satisfied.
While the majority of respondents are currently employed, 18% of the total are actively looking for a new employer.
There is an inverse relationship between respondents’ job search time span to their rating of the statement, “I am confident that I can find a better job somewhere else.” Nearly half of respondents who have been searching for six months or less agreed to being confident in finding a better job. Those who have been looking for work for longer than six months become much less optimistic.
0% 20% 40% 60% 80% 100%
Longer than a Year
10-12 Months
7-9 Months
3-6 Months
Less than 3 Months
Looking for work for:
I am confident that I can find a better job somewhere else.
Strongly Disagree Disagree Neutral Agree Strongly Agree
3%
4%
6%
1%
13%
6%
3%
5%
3%
28%
17%
18%
17%
20%
25%
38%
46%
28%
26%
30%
33%
33%
49%
48%

14 CASINO GAMING EXECUTIVE SATISFACTION SURVEY – 19TH ANNUAL
MOST PREFERRED LOCATIONS
WILLINGNESS TO RELOCATERespondents were asked where they would prefer to live and work. Nearly half of respondents currently reside in their preferred location while 19% of respondents have no preference in where they would like to reside. The top three most preferred locations to reside and work are Las Vegas (15% of respondents), Florida (13% of respondents), and Southern California (10% of respondents).
Of the 14% of total respondents who reside and work in Las Vegas, 70% prefer to stay in this location. Of the 12% of total survey respondents who currently reside and work in Florida, 73% of them claim that they are currently residing in their preferred location. Of the 11% of total respondents that currently reside and work in Southern California, 66% of them claim that they are currently residing in their preferred location.
Executives were asked if they would be willing to relocate from their current location. There were 22% of executives who indicated that they would not like to relocate, a 4% increase from 2018 results.
LOCATION
66%
73%
70%
34%
27%
30%
0% 20% 40% 60% 80% 100%
CA - Southern
Florida
NV - Las Vegas
Current and Preferred Location
Already In Preferred Location No Preference/Other
Residents of:
22%
5%
4%
18%
51%
Would casino executives be willing to relocate?
Yes, Anywhere
Yes, Within Region
Yes, Within Current State
Yes, Within City
No

15THE RESULTS - 2019
PERCEIVED CAREER ADVANCEMENT BY REGION
RELOCATEARE WILLING TO78%
Each year, executives are asked to rate their outlooks on US gaming markets. The graph compares the views of residents of these respective markets alongside the overall responses.
Overall, respondents perceived Las Vegas as the market with the greatest potential for offering career growth. California-based executives gave the greatest rating to their own market. Conversely, the majority of the executives in the Northeast, outside of the Atlantic City, perceived greater opportunities elsewhere.
4.11
4.02
4.06
3.79
3.02
3.19
3.52
3.76
3.57
3.53
2.88
3.46
1 2 3 4 5
California
Las Vegas
The Midwest
The South
Atlantic City
The Northeast(Excluding Atlantic City)
Areas O�ering Opportunities for Career Advancement
Residents All Respondents
Strongly Disagree Neutral Strongly Agree

16 CASINO GAMING EXECUTIVE SATISFACTION SURVEY – 19TH ANNUAL
RANKING OF PRIORITIES
Among the eight choices of career priorities, compensation once again placed second. Executives continue to prioritize Career Opportunity and Growth as they did last year. Corporate Culture received the highest percentage for third priority.
After comparing the ranking of priorities to respective years of experience in gaming, those with more than 20 years of experience ranked Compensation higher than Opportunity and Growth. Overall, executives do not prioritize weather and lifestyle, paid time off, or living closer to their family.
PRIORITIES
0% 20% 40% 60% 80% 100%
1
2
3
4
5
6
7
8
Highest Priority
Lowest Priority
Ranking of Priorities
Career Opportunity and Growth
Location Closer to Family
Compensation
Paid Time O�
Corporate Culture
Weather and Lifestyle
Job Security
Work-Life Balance
28% 26% 18% 9% 7% 1%2%9%
5%
7%
4%
6%
11%
15%
4%
4%
7%
8%
10%
11%
15%
16%
19%
15%
31%
20%
16%
21%
11%
16%
10%
9%
8%
6%
5%
10%
5%
4%
3%
2%
15%
11%
8%
7%
5%
23%
17%
12%
7%
5%
9%
19%
13%
16%
24%
29%
23%
12%
13%
27%
32%
13%
11%
15%

17THE RESULTS - 2019

18 CASINO GAMING EXECUTIVE SATISFACTION SURVEY – 19TH ANNUAL
Newly introduced questions to this year’s survey related to vacation and work-life balance. It was specified that working on vacation included checking emails and voicemails, answering work related calls, and performing other work-related tasks while away. The survey question regarding burnout was not intended to distinguish a medical diagnosis from perceived burnout.
Respondents were evenly split as to whether they were encouraged to work while on vacation. Over half of those encouraged to work felt burnout within the past year, while only a quarter of those who were not encouraged to work felt burnout.
Nevertheless, nine out of ten respondents voluntarily work while on vacation. About half of the respondents have the ability to work from home as needed and work flexible hours, allowing for greater work-life balance.
“In a customer service-based industry where we remain
open 24/7, it is especially important to take care of one’s
self physically, emotionally and mentally,” says Bristol
Associates President Ben Farber. “A balanced life cultivates
contentment. When one is content, the quality of their
work improves and productivity increases.”
WORK-LIFE BALANCEENCOURAGED TO WORK WHILE ON VACATION
(i.e. check emails and voicemails, etc.)
ABILITY TO WORK FROM HOME AS NEEDED
13%
20%
16%
30%
18%
3%
I have the ability to work from home as needed
15%
25%
18%
24%
16%
2%
I am encouraged to work while I am on vacation (i.e. check emails and voicemails, answer work related calls, etc.)
LEGEND
AgreeStrongly Agree Neutral
Disagree Strongly Disagree Not Applicable

19THE RESULTS - 2019
VOLUNTARILY WORK WHILE ON VACATION(i.e. check emails and voicemails, etc.)
ABILITY TO WORK FLEXIBLE HOURS
EXPERIENCED BURNOUT IN THE PAST YEAR
19%
23%
18%
25%
13%2%
I have experienced employee burnout within the past year
7%
14%
15%
37%
26%
1%
I have the ability to work flexible hours
4%6%
10%
46%
33%
1%
I voluntarily work while I am on vacation (i.e. check emails and voicemails, answer work related calls, etc.)
of those who check work every day while on vacation experienced employee burnout in the past year
of those who never check work while on vacation experienced employee burnout in the past year
41%28%
63%26%
of those who believe their company is not keeping them satisfied experienced burnout in the past year
of those who believe their company is keeping them satisfied experienced burnout in the past year
20 CASINO GAMING EXECUTIVE SATISFACTION SURVEY – 19TH ANNUAL
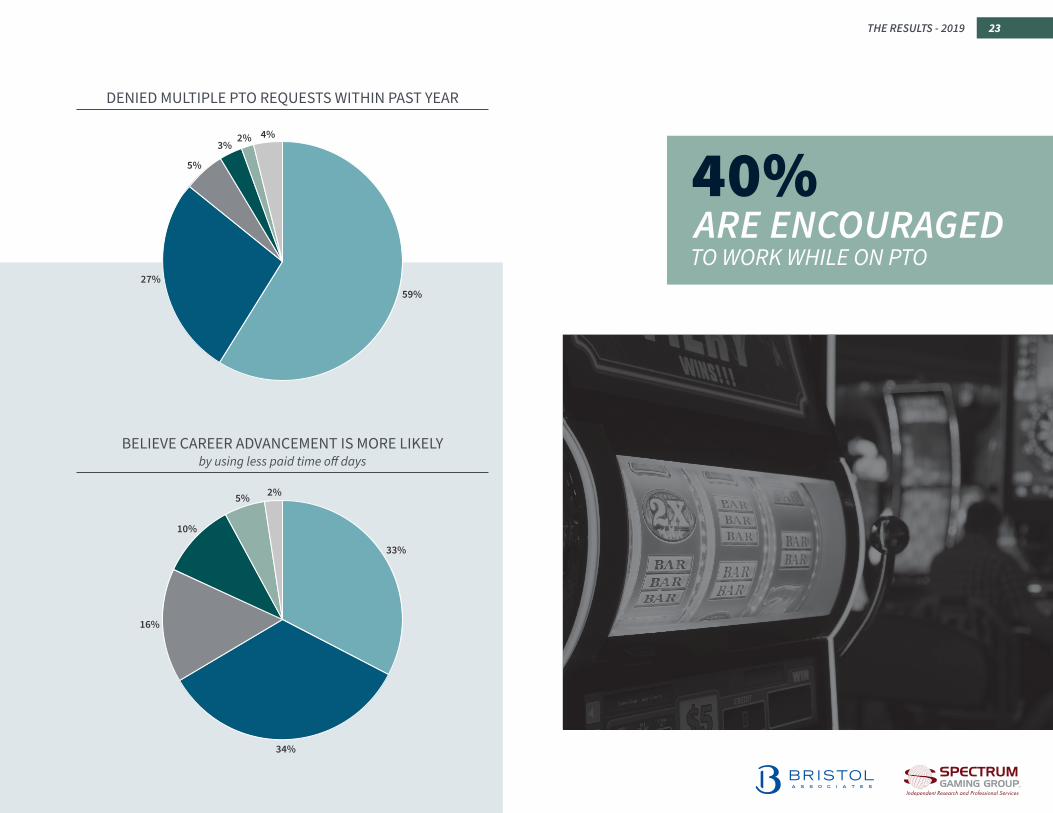
More than eight out of ten respondents had taken a vacation (3+ consecutive days) within the past year using paid time off. Out of the executives who have not taken a vacation in over a year, one out of three believe they will advance in their career by using less paid time off.
Thirty-two percent of those who vacationed within the past three months along with the 42% who vacationed in the past 4-6 months reported burnout.
In comparison, 54% of those who vacationed 10-12 months ago along with 50% of those who vacationed over a year ago reported burnout.
Three quarters of respondents check on work every day while on vacation. A few individuals even claimed to do so on an hourly basis. Out of those professionals who keep tabs on work every day, 92% are also actually working, albeit voluntarily.
VACATION

21THE RESULTS - 2019
VOLUNTARILYWORK WHILE ON VACATION
79%
MOST RECENT VACATION(3+ consecutive days of paid time off)
FREQUENCY OF CHECKING ON WORK WHILE ON VACATION
Less than 1 month ago16%
1-3 months ago33%
4-6 months ago19%
7-9 months ago8%
10-12 months ago6%
Over 1 year ago14%
Never3%
Other1%
When was the last time you took a vacation (3+ consecutive days of paid time o�) at your current (or most recent) employment?
Every Day76%
Twice a Week10%
Once a Week6%
Never5%
Other3%
How o�en do you check on work while on vacation at your current (or most recent) employment?

22 CASINO GAMING EXECUTIVE SATISFACTION SURVEY – 19TH ANNUAL
Overall, when deciding on a vacation, executives are more likely to consider their workload rather than pressure from coworkers or employers to remain at work. Over 20% of those individuals who felt pressured by their employer to not take paid time off were also denied multiple requests within the past year.
PAID TIME OFF
FELT RELUCTANT TO TAKE TIME OFFdue to amount of work needed to make up upon return
FELT GUILTY TAKING TIME OFFdue to coworkers being left to handle responsibilities
12%
30%
13%
29%
15%1%
I have felt reluctant to take time o� because of the amount of work I would need to make up upon my return
16%
38%
13%
21%
10%2%
I have felt guilty taking time o� because my coworkers are le� to handle my responsibilities
FELT DISCOURAGED FROM TAKING TIME OFFdue to employer’s reaction
29%
37%
12%
12%
9%1%
I have felt discouraged from taking time o� because of my employer's reaction to my absence
LEGEND
AgreeStrongly Agree Neutral
Disagree Strongly Disagree Not Applicable
23THE RESULTS - 2019
BELIEVE CAREER ADVANCEMENT IS MORE LIKELYby using less paid time off days
DENIED MULTIPLE PTO REQUESTS WITHIN PAST YEAR
59%27%
5%
3%2% 4%
I have been denied multiple PTO requests within the last year
33%
34%
16%
10%
5% 2%
I believe I am more likely to advance in my career if I use
less paid time o� days
ARE ENCOURAGEDTO WORK WHILE ON PTO
40%

24 CASINO GAMING EXECUTIVE SATISFACTION SURVEY – 19TH ANNUAL
Overall, employee satisfaction has remained above 80% since 2012. There is an increase in “passive candidates” – those who are not actively seeking a new job – in the casino industry within the last year because of this steady trend. Over half of them are willing to relocate anywhere for the right opportunity. Although this statistic is noteworthy, it is to be taken with a grain of salt. In this job market where unemployment is low and the majority are satisfied in their current role, the “right opportunity” may not exist. The results show that people are less optimistic about finding a better job (p.11).
Due to the majority’s strong disagreement to feeling discouraged or guilty from using paid time off, most executives do not necessarily experience “vacation guilt.” In fact, over half of executives have used vacation time within six months of taking the survey. Rather than feeling guilty or anxious about taking a vacation, most respondents voluntarily choose to work daily while on vacation. Through this finding, the majority of executives in the casino industry do not completely “unplug” from their workplace while on vacation, even though that is the intended use of paid time off. Technology grants us 24/7 access and convenience. Taking paid time off and vacation now comes
with the feeling that professionals should be working every day while away. The downside is that executives compromise their leisure time, increasing their likelihood for burnout.
Spectrum’s takeaway is that management should take note of these findings and consider how to accommodate requests for time off while respecting that time away, in order to improve employee satisfaction as well as production. Bristol agrees whole-heartedly. A simple technique to reducing burnout (p. 19) is to support and encourage each other’s efforts to recharge. Eliminating fear and negative judgments can significantly alleviate stress. Instead of asking “How much profit will be lost if he or she takes time off?” try asking, “Will he or she avoid burnout by taking a vacation?” Management should proactively monitor their team’s morale and remind them to use their paid time off throughout the year. Corporate culture is no longer driven solely by revenue generation. Today’s workforce is adopting a holistic approach where success is defined by professional growth and personal happiness. As an added benefit, when companies prioritize employee wellness, their financial goals can be achieved in a sustainable manner.
CONCLUSION

25THE RESULTS - 2019
About Bristol Associates, Inc.Founded in 1967, Bristol Associates, Inc. is an executive search firm that has well-established, successful recruitment practices in Casino Gaming; Hotels and Resorts; Travel, Tourism, and Attractions; Facilities and Concessions; Food and Beverage Manufacturing; Restaurant; Hospital and Healthcare; and Nonprofit.
Bristol is known for offering highly-focused personal service, depth of experience, and professional knowledge of the industries in which they work. The firm has been established with a focus on responsiveness, honesty, integrity, and strict adherence to ethical standards. Bristol maintains the largest proprietary database of executive talent in the industry.
Typical searches in the casino industry include key corporate and property-level executives within operations, finance and accounting, marketing, human resources, hospitality, information systems and development. Current searches and examples of completed searches can be found at www.bristolassoc.com/jobs/casino-gaming. The casino executive recruitment efforts are led directly by the Company President, Benjamin Farber.
For more information, visit www.bristolassoc.com.
About Spectrumetrix and Spectrum Gaming GroupSpectrum Gaming Group is a non-partisan consultancy that specializes in the economics, regulation and policy of legalized gambling worldwide. It has provided independent research and professional services to public- and private-sector clients since 1993. The company brings wide industry perspective to every engagement, having worked in 36 US states and territories and in 47 countries on six continents.
Employing renowned experts in every facet of the gaming industry, Spectrum serves state, tribal and national governments, casino operators, suppliers, regulators, developers, investors, law firms, and other gaming-related professionals in all sectors of the legalized gambling industry.
Through its offices in Atlantic City, Bangkok, Guangzhou, Hong Kong, New York and Tokyo, Spectrum provides an array of services, including:
Spectrum reports have been used by clients to shape public policy, secure financing, formulate marketing plans, determine the scope and size of development, establish gaming regulations, and make licensing decisions, among many other purposes.
For more information, visit www.spectrumgaming.com.
• Anti-money-laundering controls• Drafting of legislation and regulation• Economic impact reports• Establishment of investigative procedures• Evaluation of public policy
• Financial analysis• Investigations and due diligence (financial and Integrity)• Internet gambling research and analysis• Legal support services• Lottery management, advisory services
• Market analyses• Professional services for Indian Nations Public-policy
analysis• Regulatory services• Restructurings, distressed properties/acquisition services
ABOUT THE AUTHOR COMPANIES
