the 2016 budget and economic outlook
TRANSCRIPT

Congressional Budget Office
The 2016 Budget and Economic Outlook
Presentation to the National Association for Business Economics
March 7, 2016
Keith Hall Director
This presentation draws on The Budget and Economic Outlook: 2016 to 2026 (January 2016), www.cbo.gov/publication/51129.

1 CO N GR ES S IO N A L B UDGE T O F F IC E
Budget Outlook

2 CO N GR ES S IO N A L B UDGE T O F F IC E
Total Deficits or Surpluses
Percentage of Gross Domestic Product

3 CO N GR ES S IO N A L B UDGE T O F F IC E
Federal Debt Held by the Public
Percentage of Gross Domestic Product

4 CO N GR ES S IO N A L B UDGE T O F F IC E
Total Revenues and Outlays
Percentage of Gross Domestic Product

5 CO N GR ES S IO N A L B UDGE T O F F IC E
Total Outlays
Percentage of Gross Domestic Product

6 CO N GR ES S IO N A L B UDGE T O F F IC E
Components of the Total Increase in Outlays in CBO’s Baseline Between 2016 and 2026
Total Increasein Outlays:$2.5 Trillion
All Other Programs(17%)
Net Interest(23%)
Social Security(28%)
Major Health Care Programs(32%)Medicare
(20%)
Other(12%)

7 CO N GR ES S IO N A L B UDGE T O F F IC E
Projected Debt Held by the Public and Net Interest
Billions of Dollars
2015 2016 2017 2018 2019 2020 2021 2022 2023 2024 2025 20260
100
200
300
400
500
600
700
800
900
0
5,000
10,000
15,000
20,000
25,000Net Interest (Left axis)
Debt Held by the Public (Right axis)

8 CO N GR ES S IO N A L B UDGE T O F F IC E
Projected Outlays in Major Budget Categories
Percentage of Gross Domestic Product
2015 2016 2017 2018 2019 2020 2021 2022 2023 2024 2025 20260
1
2
3
4
5
6
7
Social Security
Major HealthCare Programs
Net Interest
5.9
5.2
2.5
Discretionary 6.6
Other Mandatory 3.0

9 CO N GR ES S IO N A L B UDGE T O F F IC E
Total Revenues
Percentage of Gross Domestic Product
18.2
Average Revenues,1966 to 2015
(17.4%)
Total Revenues
Actual Projected
1966 1971 1976 1981 1986 1991 1996 2001 2006 2011 2016 2021 20260
5
10
15
20
25

10 CO N GR ES S IO N A L B UDGE T O F F IC E
Spending and Revenues Projected in CBO’s Baseline, Compared With Actual Values in 1966 and 1991 Percentage of Gross Domestic Product

11 CO N GR ES S IO N A L B UDGE T O F F IC E
Economic Outlook

12 CO N GR ES S IO N A L B UDGE T O F F IC E
Growth of Real Gross Domestic Product
Percent, Fourth Quarter to Fourth Quarter

13 CO N GR ES S IO N A L B UDGE T O F F IC E
Rates of Short- and Long-Term Unemployment
Percent

14 CO N GR ES S IO N A L B UDGE T O F F IC E
Labor Force Participation Rates
Percent
15 CO N GR ES S IO N A L B UDGE T O F F IC E
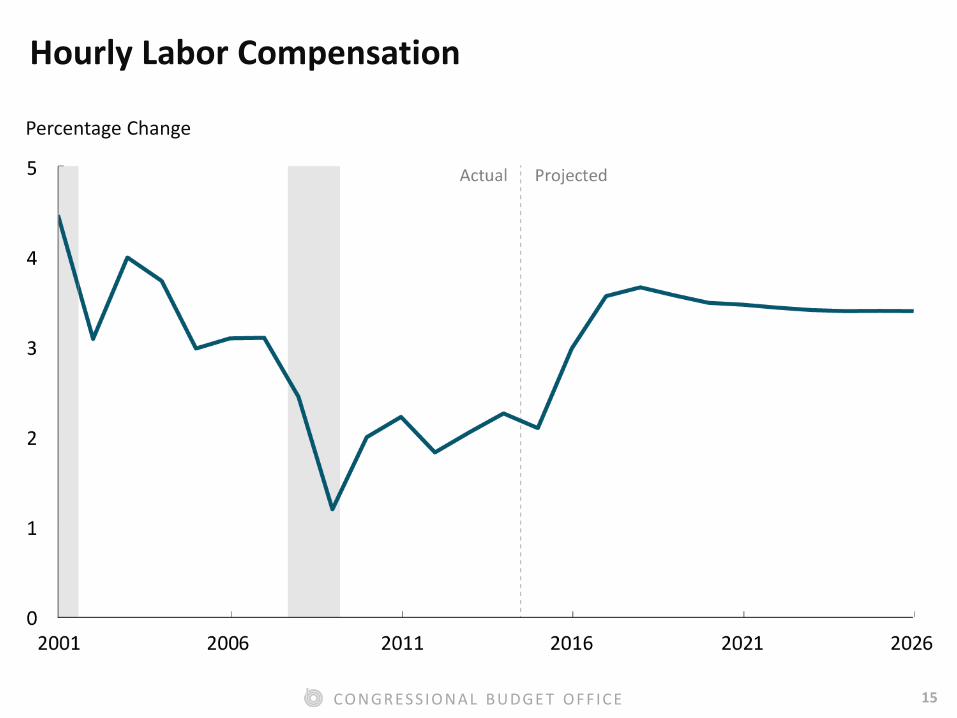
Hourly Labor Compensation
Percentage Change
16 CO N GR ES S IO N A L B UDGE T O F F IC E
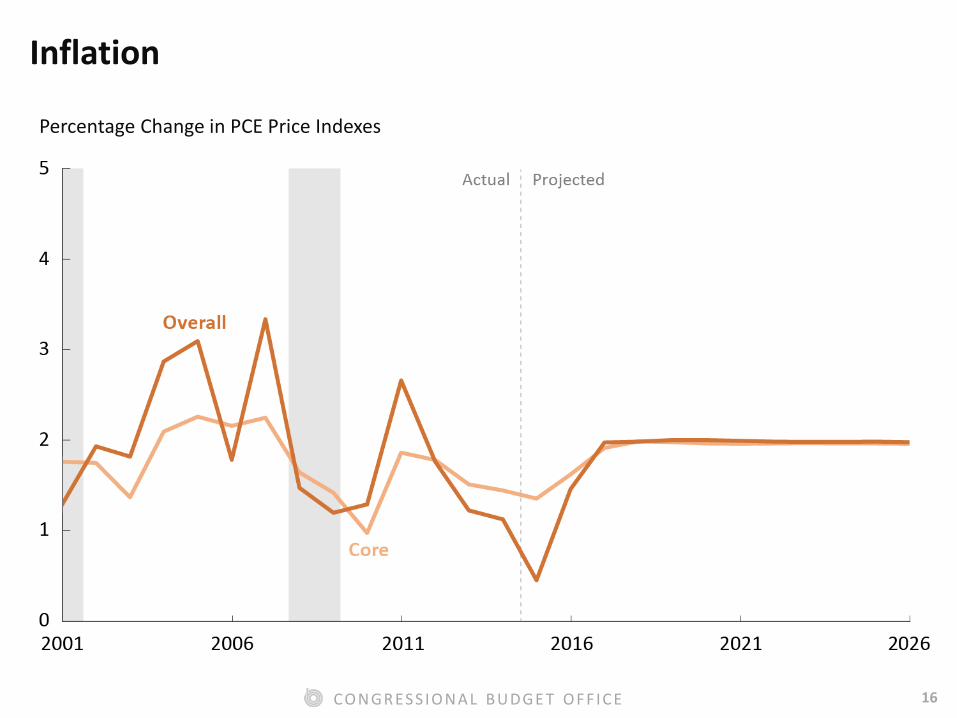
Inflation
Percentage Change in PCE Price Indexes

17 CO N GR ES S IO N A L B UDGE T O F F IC E
Interest Rates on Treasury Securities
Percent