the 2016 sales development benchmark report-1-1 · pdf filethe 2016 sales development...
TRANSCRIPT
THE 2016 SALES DEVELOPMENT BENCHMARK REPORTA research report focused on the strategies and tactics of high-growth sales development organizations.
RESEARCH REPORT
These materials have been prepared by TOPO for the exclusive and individual use of our clients. Unauthorized reproduction is strictly prohibited. These materials contain valuable confidential and proprietary information belonging to TOPO and they may not be shared with any third party without the prior approval of TOPO. To learn how you can become a TOPO client, visit www.topohq.com.
Kristina McMillan, Sales Development Practice Leader
August 2016

INTRODUCTION
The Sales Development Benchmark Overview 3Key Takeaways 4Benchmark Data Summary 10Benchmark Data
Sales Development Strategy & Process 1 1Sales Development Plays 20Sales Development Management 27Sales Development Technology 35
www.topohq.com | 2
The Sales Development Benchmark Report is the result of an annual study conducted by TOPO on sales development organizations at high growth B2B companies. We analyzed data and interviews from over 150 sales development leaders and practitioners to formulate the insights included in this report.
EXECUTIVE SUMMARYTABLE OF CONTENTS
Kristina McMillan leads the Sales Development practice at TOPO. She works with TOPO's analysts to develop best-practice frameworks and actionable research that help clients cultivate world-class sales development organizations. Prior to joining TOPO, Kristina spent over 10 years helping successful SaaS companies build and accelerate their Sales Development efforts.
SALES DEVELOPMENT ANALYST
“The 2016 TOPO Sales Development Framework”February 2016
“The 2015 Sales Development Benchmark Report”February 2015
“The 2015 Sales Development Technology Report”May 2015
RELATED RESOURCES
The 2016 Sales Development Benchmark Report © 2016 TOPO All rights reserved

BENCHMARK OVERVIEW
www.topohq.com | 3The 2016 Sales Development Benchmark Report © 2016 TOPO All rights reserved
TOPO’s Sales Development Practice set out to conduct an in-depth study of world-class sales development organizations. The focus of our research was to understand what separates exceptional sales development teams from their peers. We discovered a number of unique characteristics that drive the highest growth, including strategy, organizational structure, process, plays and technology.
The primary goal of our benchmark report is to provide sales development organizations with a framework to benchmark their performance against peers. The framework looks at 90 data points across four primary categories, to assess sales development performance.
OBJECTIVE
TOPO’s Sales Development Benchmark Report reveals the granular data behind our study and best practices behind top-performing teams. The report also provides actionable insights that your organization can leverage to improve its results. We have broken down our findings into four elements critical to success in the sales development organization:
1. Strategy & Process2. Plays 3. Management4. Technology
RESULTS
SURVEY DEMOGRAPHICS:
# of Respondents:
# of Data Points Surveyed:
Date Collected
150
90
Q2 2016
RESPONDENT TARGET ACVCLASSIFICATION:
$0 - $10K
$10K - $5OK
$50K - $100K
$100K+
% of RespondentsACV
23%
41%
20%
16%
RESPONDENT REVENUE CLASSIFICATION:
Enterprise:
Mid-Market:
Startup:
> $500M
$50M - $500M
$0 - $50M
Revenue % of Respondents
10%
27%
63%

KEY TAKEAWAYS
In 2016, we have seen sales development shift from a tactical, junior sales role to a strategic function that is critical to driving revenue growth. As part of this newly emerging strategic sales development agenda, organizations are creating thoughtful go-to-market strategies (versus a tactical activity-based focus) to support strategic sales and marketing goals. An example of this trend has been the rise of the Account-Based movement where SDRs are executing personalized campaigns against a well-defined target account list.
For our benchmark, we focused on identifying the attributes and strategies that separate exceptional sales development organizations from their peers. We looked at all the elements that make up the TOPO Sales Development Framework to provide insights on how top-performing organizations uniquely approach these strategies and tactics. Takeaways include the following:
ACV is the primary driver for all decisions around sales development. ACV (Annual Contract Value) is the key number that informs strategic sales development decisions, such as go-to-market strategy and organizational design.
The close rate on sales development-generated opportunities is 22%. Close rate is the ultimate arbiter of success for any program and further validates the value that sales development contributes to the organization.
The average SDR generates 18.2 SQLs per month. The specific SQL quota for your team is determined by your ACV and the volume of opportunities needed to generate sufficient pipeline for sales.
Only 10% of organizations use traditional BANT qualification criteria. “Budget” has been nearly eliminated from qualification, except in very specific use cases. The use of “budget” as a qualifier has fallen by 62% over the last year.
The average SDR-to-sales rep ratio is 1-to-2. The range of coverage ratios varies by the maturity of the sales team, with smaller sales teams reporting 1-to-1 ratios and larger sales teams 1-to-3+ ratios.
SDRs are executing a higher number of touches per prospect (15+) across multiple channels (3+). Automation has enabled SDRs to design and execute multi-touch campaigns across multiple channels (i.e., phone, email, social, etc.) over a concentrated period of time.
www.topohq.com | 4The 2016 Sales Development Benchmark Report © 2016 TOPO All rights reserved

KEY TAKEAWAY: SALES DEVELOPMENT CREATES OPPORTUNITIES THAT CLOSE AT A RATE OF 22%
© 2016 TOPO All rights reserved www.topohq.com | 5The 2016 Sales Development Benchmark Report
ANALYSIS
The ultimate measurement for sales development e ectiveness is close rate.For every 5 sales development opportunities created, 1 should close.
The number dips for larger opportunities ($100K+ ACV). This gap is due primarily to marketing’s ability (or inability) to deliver MQLs of that size.
The SQL-to-opportunity conversion rate measures the rate at which SQLs are turned into meaningful pipeline by sales. The benchmark for SQL-to-opportunity conversion is 59%. Organizations that fall below that rate are often su ering from an SQL definition that is not aligned with sales or an undefined follow-up process.
SALES DEVELOPMENT PROCESS CONVERSION RATES BY TARGET ACV
METRIC DESCRIPTION
CONVERSION RATE BY ACV
MQL to SQL
SQL to Oppty
Oppty to Close
21%
59%
22%
26%
62%
31%
18%
61%
20%
27%
58%
21%
13%
50%
15%
A prospect that is qualified by sales development.
A qualified prospect that is accepted by sales.
A sale process that is success-fully closed by a sales rep.
AVER
AGE
$0 -
$10K
$11K
- $5
OK
$51K
- $1
00K
$101
K+

www.topohq.com | 6
KEY TAKEAWAY: THE AVERAGE SDR GENERATES 18.2 SQLS PER MONTH
© 2016 TOPO All rights reservedThe 2016 Sales Development Benchmark Report
0
5
10
15
20
25
30
24.7
$0 - $10K $10K - $50K
AVERAGE ACV
# O
F SQ
LS P
ER S
DR
PER
MO
NTH
$50K - $100K $100K+
17.516
11.3
AVERAGE
18.2
SQLS GENERATED PER SDR PER MONTH ANALYSIS
The average SDR produces 18.2 SQLs per month. As the ACV level increases, the number of SQLs required decreases.
The appropriate SQL number for an organization is determined by the number of opportunities sales can effectively manage as well as the capacity of SQLs an SDR can produce.
For example, at the $10K ACV level, some SDR teams are generating upwards of 40+ SQLs per month. These SDRs have more potential targets to pursue and can thus produce more SQLs. Furthermore, sales has shorter, less complex sales cycles and requires a steady flow of opportunities to meet monthly quotas.
www.topohq.com | 7© 2016 TOPO All rights reserved
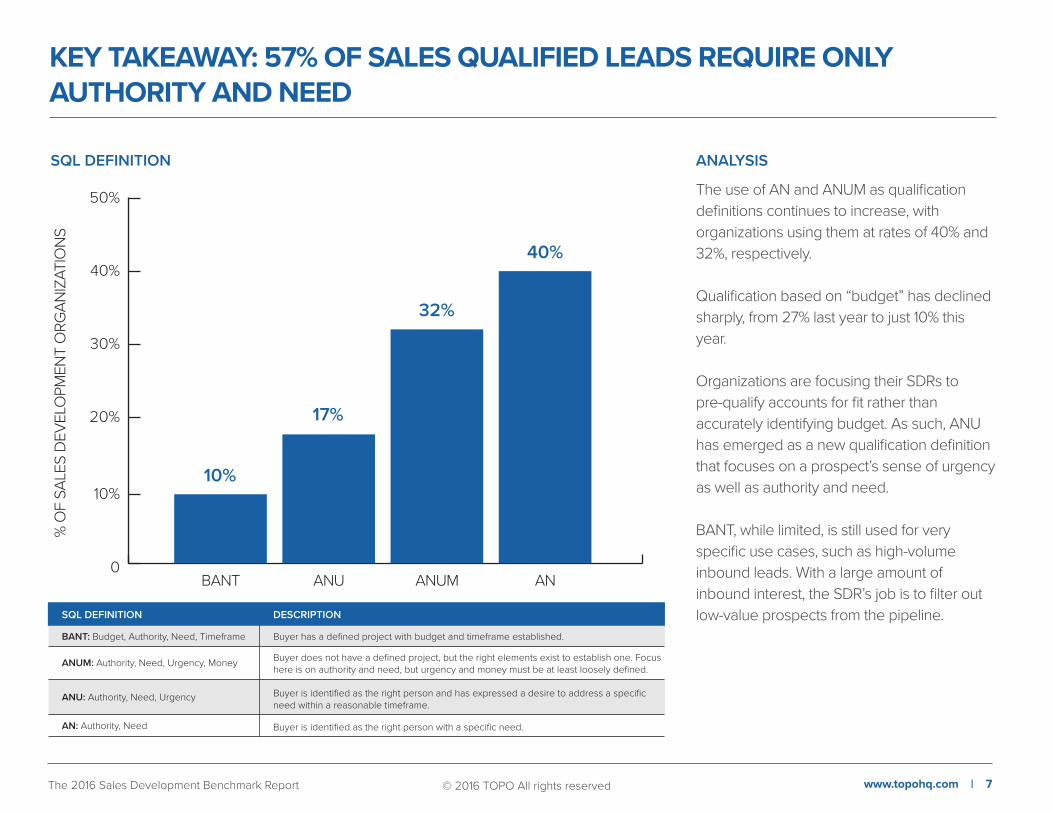
KEY TAKEAWAY: 57% OF SALES QUALIFIED LEADS REQUIRE ONLY AUTHORITY AND NEED
The 2016 Sales Development Benchmark Report
ANALYSIS
The use of AN and ANUM as qualification definitions continues to increase, with organizations using them at rates of 40% and 32%, respectively.
Qualification based on “budget” has declined sharply, from 27% last year to just 10% this year.
Organizations are focusing their SDRs to pre-qualify accounts for fit rather than accurately identifying budget. As such, ANU has emerged as a new qualification definition that focuses on a prospect’s sense of urgency as well as authority and need.
BANT, while limited, is still used for very specific use cases, such as high-volume inbound leads. With a large amount of inbound interest, the SDR’s job is to filter out low-value prospects from the pipeline.
0
20%
10%
30%
40%
50%
10%
BANT ANU
% O
F SA
LES
DEV
ELO
PMEN
T O
RGAN
IZAT
ION
S
ANUM AN
17%
32%
40%
SQL DEFINITION DESCRIPTION
BANT: Budget, Authority, Need, Timeframe Buyer has a defined project with budget and timeframe established.
ANUM: Authority, Need, Urgency, Money Buyer does not have a defined project, but the right elements exist to establish one. Focus here is on authority and need, but urgency and money must be at least loosely defined.
ANU: Authority, Need, Urgency Buyer is identified as the right person and has expressed a desire to address a specific need within a reasonable timeframe.
AN: Authority, Need Buyer is identified as the right person with a specific need.
SQL DEFINITION

www.topohq.com | 8
KEY TAKEAWAY: ON AVERAGE, ONE SDR SUPPORTS TWO SALES REPS
© 2016 TOPO All rights reserved
ANALYSIS
The average SDR-to-sales rep coverage ratio is 1-to-2.
Sales Reps in emerging sales organizations, where marketing efforts are still nascent, need dedicated, 1-to-1 SDR coverage to fill their pipeline. As the sales organization grows, the ratio widens.
While TOPO’s best practice shows a maximum spread of 1 SDR to 3 sales reps, many companies cannot maintain such low ratios because of resource constraints. They mitigate the gap by leveraging cross-sell/upsell opportunities, channel partners, increased name recognition and the maturation of marketing.
Ultimately, the number of SDRs needed correlates to the number of SQLs sales reps need to meet their quota. For example, if a sales rep needs 8 qualified meeting per month to meet their number and an SDR can deliver 16, then the SDR-to-sales rep ratio should be 1-to-2.
SDR-TO-SALES REP RATIO
0
2
1
3
4
5
6
1.3
1-10 REPS 11-50 REPS
SIZE OF SALES TEAM
# O
F SA
LES
REPS
TO
1 SD
R
51-100 REPS 100+ REPS
2.0
3.4
5.4
AVERAGE
1-TO-2
The 2016 Sales Development Benchmark Report
www.topohq.com | 9© 2016 TOPO All rights reserved
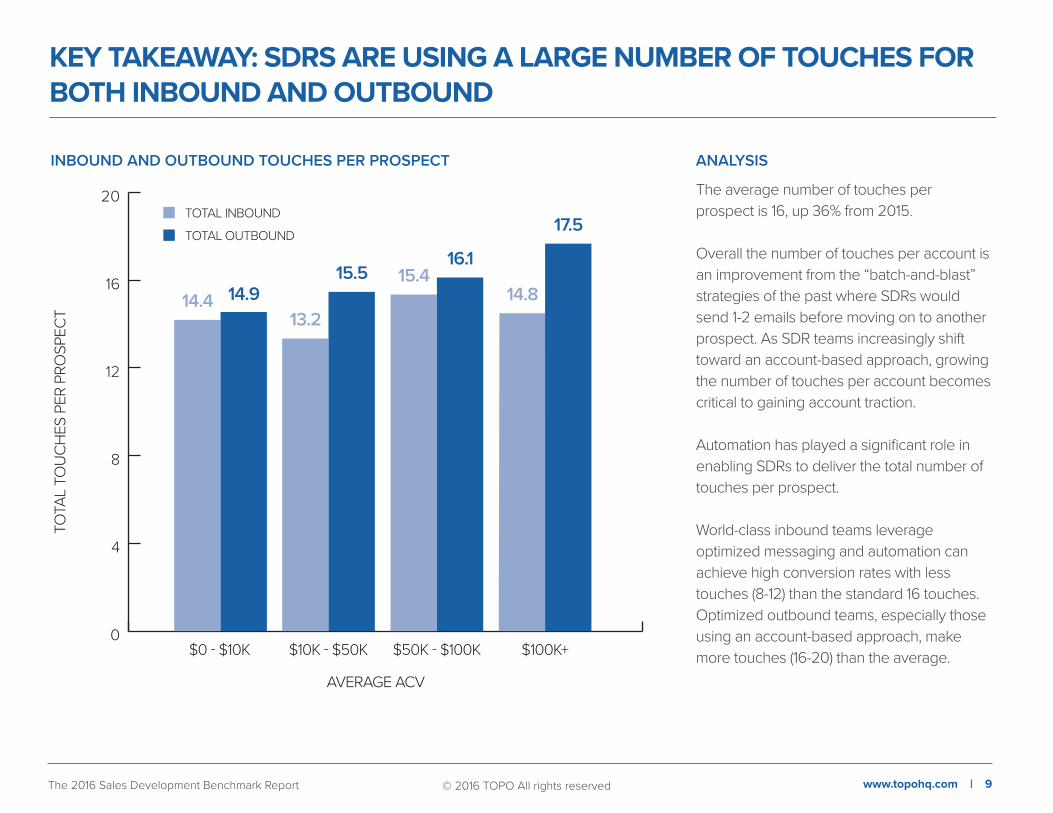
KEY TAKEAWAY: SDRS ARE USING A LARGE NUMBER OF TOUCHES FOR BOTH INBOUND AND OUTBOUND
The 2016 Sales Development Benchmark Report
ANALYSIS
The average number of touches per prospect is 16, up 36% from 2015.
Overall the number of touches per account is an improvement from the “batch-and-blast” strategies of the past where SDRs would send 1-2 emails before moving on to another prospect. As SDR teams increasingly shift toward an account-based approach, growing the number of touches per account becomes critical to gaining account traction.
Automation has played a significant role in enabling SDRs to deliver the total number of touches per prospect.
World-class inbound teams leverage optimized messaging and automation can achieve high conversion rates with less touches (8-12) than the standard 16 touches. Optimized outbound teams, especially those using an account-based approach, make more touches (16-20) than the average.
TOTA
L TO
UCH
ES P
ER P
ROSP
ECT
INBOUND AND OUTBOUND TOUCHES PER PROSPECT
AVERAGE ACV
0
4
8
12
16
20
14.4 14.913.2
15.5 15.416.1
14.8
17.5
$0 - $10K $10K - $50K $50K - $100K $100K+
TOTAL INBOUND
TOTAL OUTBOUND

www.topohq.com | 10© 2016 TOPO All rights reservedThe 2016 Sales Development Benchmark Report
THE 21 VARIABLES CRITICAL TO SALES DEVELOPMENT PERFORMANCE
CATEGORY
Process
#
1
2
3
4
5
6
7
8
9
10
11
12
13
14
15
16
17
18
19
20
21
Plays
People
Technology
METRIC
Qualified Lead Definition
Qualified Leads Passed
MQL-to-SQL Conversion Rate
MQL Definition
SQL-to-Opportunity Conversion Rate
% of Total Sales Pipeline created by SDRs
Closed Won Rate
# Inbound Leads per SDR
# Outbound Accounts per SDR
Lead Response Time
Touches per Lead
Lead Pursuit Duration
Daily SDR Activity
Types of Touches
Live Call Duration
Average SDR Tenure
SDR-to-Sales Rep Ratio
SDR-to-Manager Ratio
SDR Compensation
SDR Quota Definition
Baseline SDR Tech Stack
Authority, Need
18.2 / SDR / month
21%
Demographic + engagement scoring
59.1%
58%
22%
300 leads / month
97 accounts / month
< 1 hour
15.5 touches (Inbound), 15.6 touches (Outbound)
20 days (Inbound) 27 days (Outbound)
75 calls, 40 emails
Email, Dial, Voicemail, LinkedIn
6-10 minutes
14.3 months
1 to 2
9 to 1
$46,703 Base Salary, $24,047 Bonus
SQLs created / month
CRM, LinkedIn, Contact Data
BENCHMARK
When measuring your sales development organization, consider the following 21 elements and their respective benchmarks. To compare against top-performing SDR teams, see how your team stacks up against the TOPO standard.
Authority, Need
18 / SDR / month
21%
Demographic + engagement scoring
65-75%
60%
20%
300-400 leads / month
100 accounts / month
< 1 hour
10-12 touches (Inbound), 16-20 touches (Outbound)
18 days (Inbound) 30-45 days (Outbound)
75 calls, 40 emails
Email, Dial, Voicemail, LinkedIn
6-10 minutes
14.3 months
1 to 2
8 to 1
$46,703 Base Salary, $24,047 Bonus
SQLs created / month
CRM, LinkedIn, Contact Data, Sales Email App
TOPO STANDARD

www.topohq.com | 11© 2016 TOPO All rights reserved
BENCHMARK DATA: SALES DEVELOPMENT STRATEGY & PROCESS
The 2016 Sales Development Benchmark Report

www.topohq.com | 12© 2016 TOPO All rights reserved
SDR EFFECTIVENESS AND PERFORMANCE DOMINATE TOP CHALLENGES
The 2016 Sales Development Benchmark Report
ANALYSIS
Sales development leaders in 2016 are focused on SDR effectiveness (e.g. connect rates) and performance (e.g. conversion rates).
This is a dramatic shift over last year, where sales development leaders were focused primarily on HR issues (e.g. hiring and retention).
Traditionally, alignment is a top issue. In 2016, more world-class sales organizations have developed solutions for alignment and can focus their resources on SDR effectiveness. We believe alignment with sales is always a challenge that, if not consistently managed, can become a problem again.
TOP SALES DEVELOPMENT CHALLENGES
0 10% 20% 30% 40% 50%
CONNECT RATES 43%
34%
32%
28%
21%
21%
19%
17%
16%
15%
CONVERSION RATES
LEAD VOLUME
LEAD QUALITY
TRAINING / ONBOARDING
SDR ACTIVITY
MEASUREMENT / TRACKING
SALES-TO-SDR ALIGNMENT
HIRING
OTHER
% OF SALES DEVELOPMENT ORGANIZATIONS
CHAL
LEN
GES

www.topohq.com | 13© 2016 TOPO All rights reserved
SALES DEVELOPMENT PRIORITIES VARY, BUT MESSAGING TOPS RANKINGS
The 2016 Sales Development Benchmark Report
ANALYSIS
As sales development leaders look to address ‘connect rate’ and ‘conversion rate’ challenges, they are focused on two main areas: improved messaging and improved automation.
Messaging is vital to improving conversion rates. Optimizing the quality of touches with targeted, buyer-centric messaging in emails, calls, etc. yields measurable conversion rate increases versus raising the quantity of touches alone. As more SDR teams shift to an account-based approach, effective messaging becomes paramount to success.
Leveraging automation reduces mundane tasks so SDRs can focus on higher impact activities, such as completing more touches and customizing messaging.
TOP SALES DEVELOPMENT PRIORITIES
0 10% 20% 40%30% 50% 60% 70%
INCREASED TOUCHES 20%
IMPROVED CALL EXECUTION 37%
IMPROVED EMAIL EXECUTION 39%
IMPROVED TRAINING 39%
PRIORITIZING LEADS 44%
USING AUTOMATION TECHNOLOGY 55%
IMPROVED MESSAGING 61%
% OF SALES DEVELOPMENT ORGANIZATIONS
PRIO
RITI
ES
www.topohq.com | 14© 2016 TOPO All rights reserved
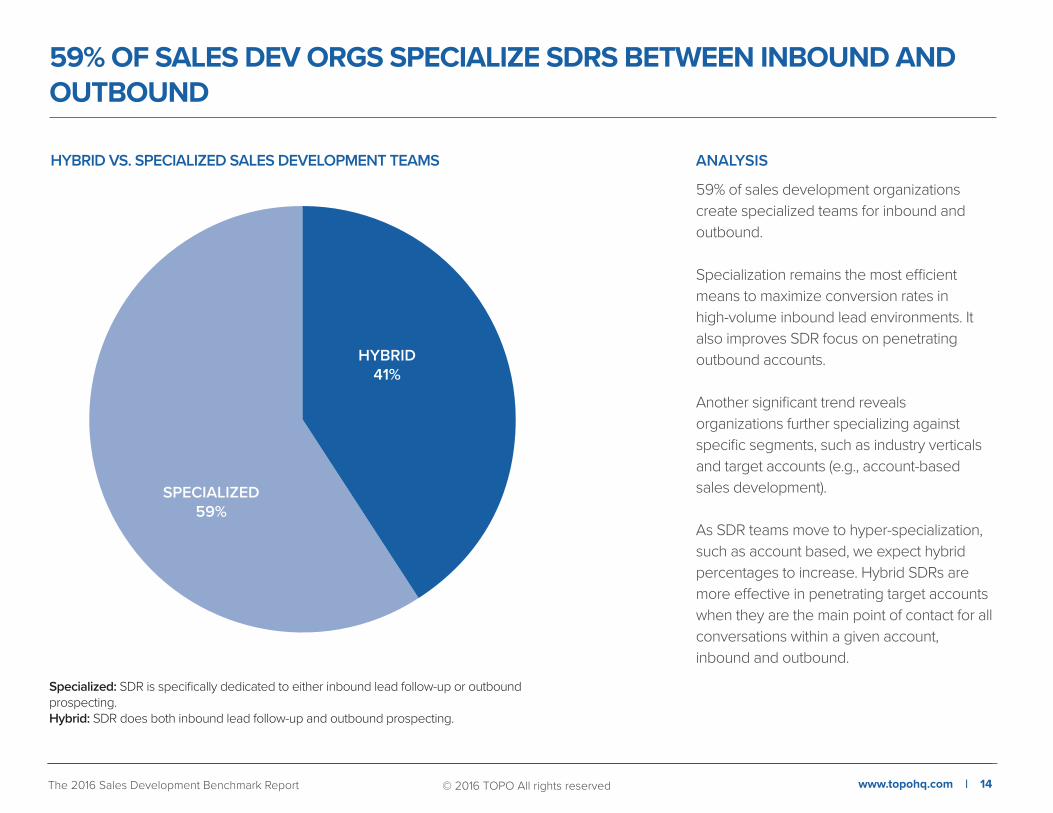
59% OF SALES DEV ORGS SPECIALIZE SDRS BETWEEN INBOUND AND OUTBOUND
The 2016 Sales Development Benchmark Report
ANALYSIS
59% of sales development organizations create specialized teams for inbound and outbound.
Specialization remains the most efficient means to maximize conversion rates in high-volume inbound lead environments. It also improves SDR focus on penetrating outbound accounts.
Another significant trend reveals organizations further specializing against specific segments, such as industry verticals and target accounts (e.g., account-based sales development).
As SDR teams move to hyper-specialization, such as account based, we expect hybrid percentages to increase. Hybrid SDRs are more effective in penetrating target accounts when they are the main point of contact for all conversations within a given account, inbound and outbound.
HYBRID VS. SPECIALIZED SALES DEVELOPMENT TEAMS
Specialized: SDR is specifically dedicated to either inbound lead follow-up or outbound prospecting. Hybrid: SDR does both inbound lead follow-up and outbound prospecting.
HYBRID41%
SPECIALIZED59%
AUTHORITY AND NEED ARE THE MOST COMMON QUALIFICATION CRITERIA
© 2016 TOPO All rights reserved www.topohq.com | 15The 2016 Sales Development Benchmark Report
ANALYSIS
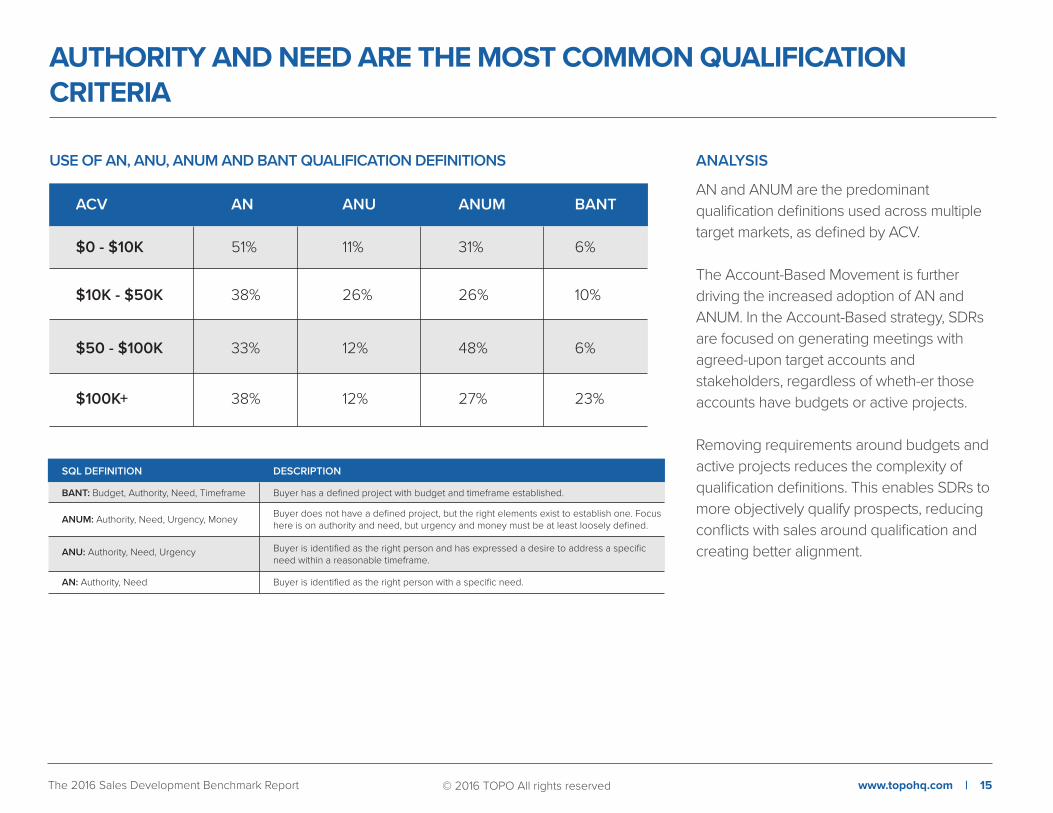
AN and ANUM are the predominant qualification definitions used across multiple target markets, as defined by ACV.
The Account-Based Movement is further driving the increased adoption of AN and ANUM. In the Account-Based strategy, SDRs are focused on generating meetings with agreed-upon target accounts and stakeholders, regardless of wheth-er those accounts have budgets or active projects.
Removing requirements around budgets and active projects reduces the complexity of qualification definitions. This enables SDRs to more objectively qualify prospects, reducing conflicts with sales around qualification and creating better alignment.
USE OF AN, ANU, ANUM AND BANT QUALIFICATION DEFINITIONS
ACV
$0 - $10K
$10K - $50K
$50 - $100K
$100K+
AN
51%
38%
33%
38%
ANU
11%
26%
12%
12%
ANUM
31%
26%
48%
27%
BANT
6%
10%
6%
23%
SQL DEFINITION DESCRIPTION
BANT: Budget, Authority, Need, Timeframe Buyer has a defined project with budget and timeframe established.
ANUM: Authority, Need, Urgency, Money Buyer does not have a defined project, but the right elements exist to establish one. Focus here is on authority and need, but urgency and money must be at least loosely defined.
ANU: Authority, Need, Urgency Buyer is identified as the right person and has expressed a desire to address a specific need within a reasonable timeframe.
AN: Authority, Need Buyer is identified as the right person with a specific need.
QUALIFIED LEAD DEFINITIONS HAVE A MATERIAL IMPACT ON SQL QUOTAS
© 2016 TOPO All rights reserved www.topohq.com | 16The 2016 Sales Development Benchmark Report
AVERAGE MONTHLY QUOTA PER SDR
SQL DEFINITION
AN
ANU
ANUM
BANT
AVERAGE MONTHLY SQLS PER SDR
Inbound
Outbound
Hybrid
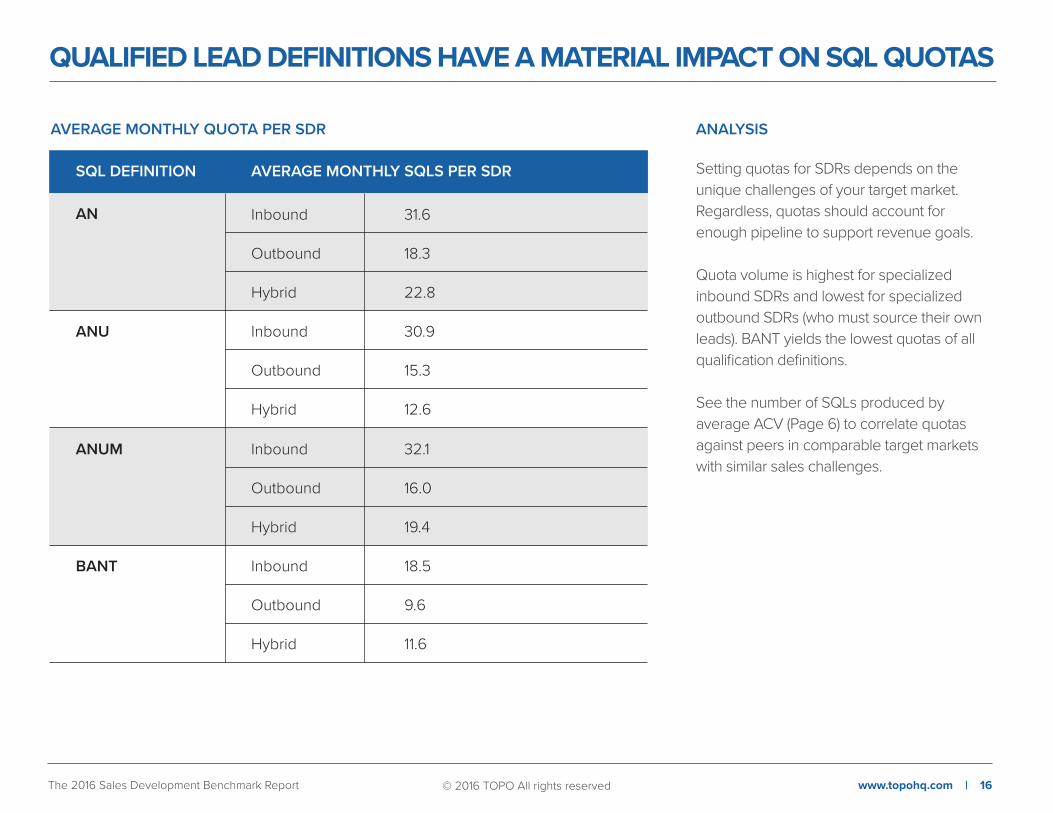
ANALYSIS
Setting quotas for SDRs depends on the unique challenges of your target market. Regardless, quotas should account for enough pipeline to support revenue goals.
Quota volume is highest for specialized inbound SDRs and lowest for specialized outbound SDRs (who must source their own leads). BANT yields the lowest quotas of all qualification definitions.
See the number of SQLs produced by average ACV (Page 6) to correlate quotas against peers in comparable target markets with similar sales challenges.
Inbound
Outbound
Hybrid
Inbound
Outbound
Hybrid
Inbound
Outbound
Hybrid
31.6
18.3
22.8
30.9
15.3
12.6
32.1
16.0
19.4
18.5
9.6
11.6
www.topohq.com | 17© 2016 TOPO All rights reserved
68% OF MQLS THAT SALES DEVELOPMENT RECEIVES ARE SCORED
The 2016 Sales Development Benchmark Report
ANALYSIS
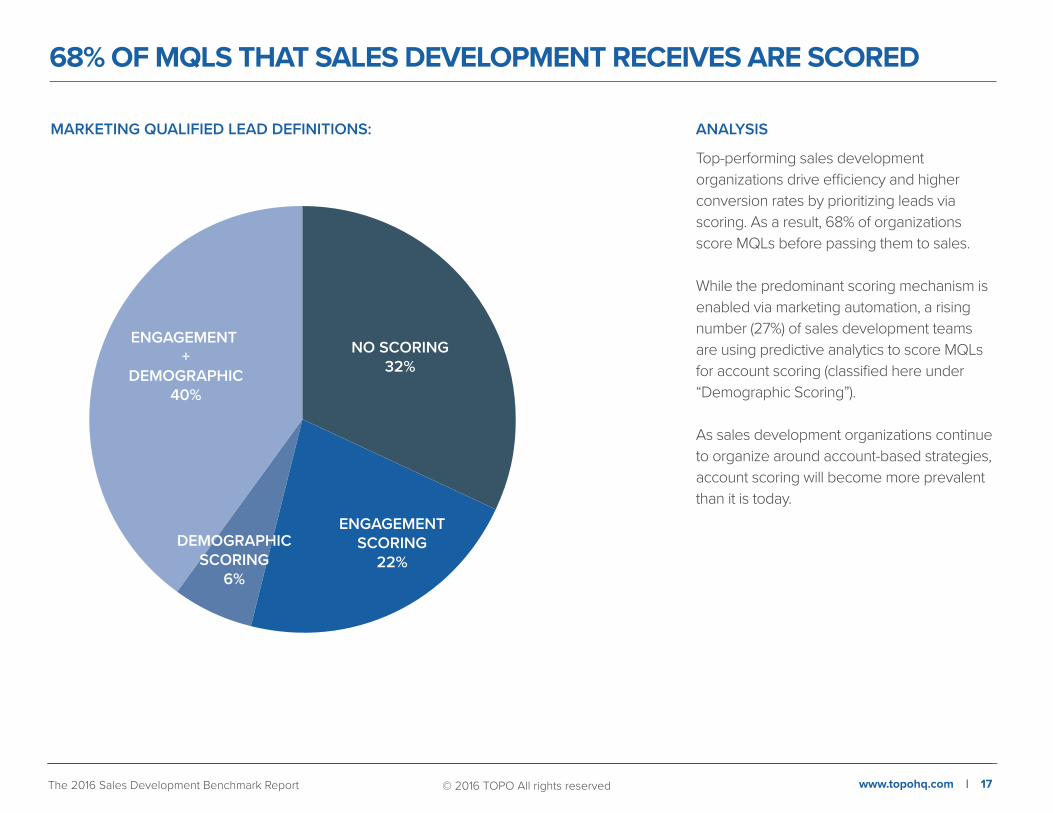
Top-performing sales development organizations drive efficiency and higher conversion rates by prioritizing leads via scoring. As a result, 68% of organizations score MQLs before passing them to sales.
While the predominant scoring mechanism is enabled via marketing automation, a rising number (27%) of sales development teams are using predictive analytics to score MQLs for account scoring (classified here under “Demographic Scoring”).
As sales development organizations continue to organize around account-based strategies, account scoring will become more prevalent than it is today.
MARKETING QUALIFIED LEAD DEFINITIONS:
NO SCORING32%
ENGAGEMENTSCORING
22%DEMOGRAPHIC
SCORING6%
ENGAGEMENT +
DEMOGRAPHIC40%
SALES DEVELOPMENT IS ADOPTING AN ACCOUNT BASED GO-TO-MARKET STRATEGY
OUTBOUND ACCOUNT STRATEGY ANALYSIS
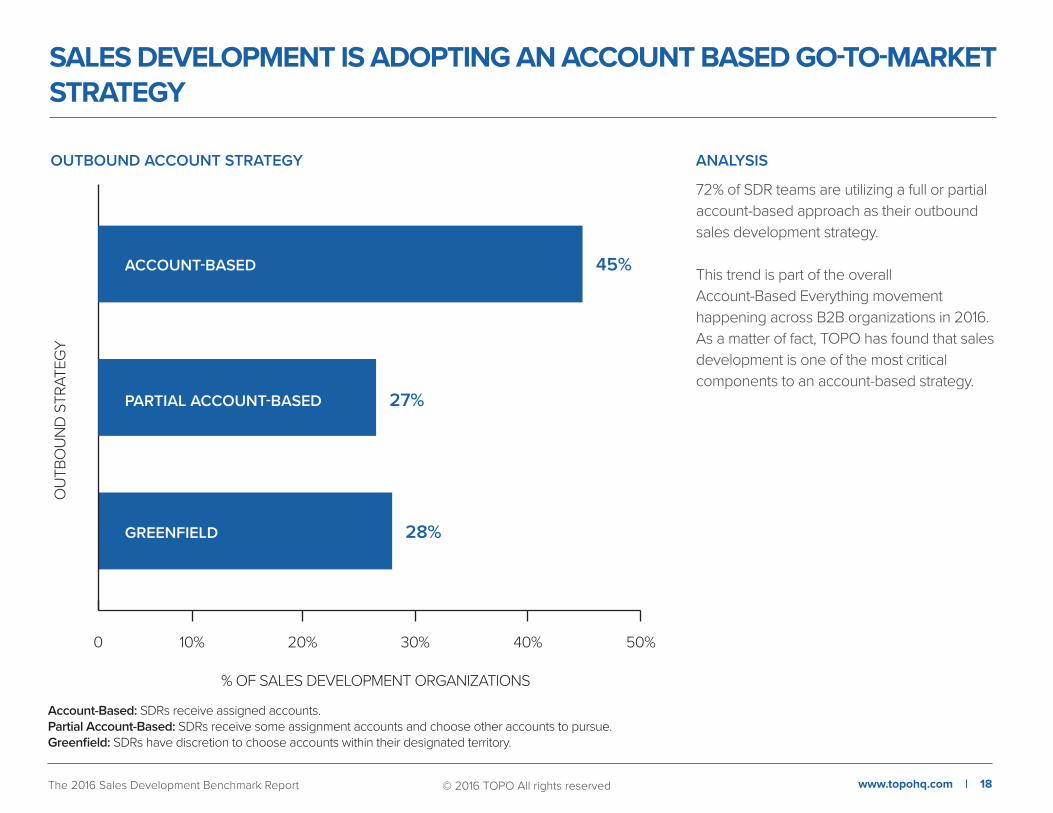
72% of SDR teams are utilizing a full or partial account-based approach as their outbound sales development strategy.
This trend is part of the overall Account-Based Everything movement happening across B2B organizations in 2016. As a matter of fact, TOPO has found that sales development is one of the most critical components to an account-based strategy.
0 10% 20% 30% 40% 50%
ACCOUNT-BASED 45%
PARTIAL ACCOUNT-BASED 27%
GREENFIELD 28%
% OF SALES DEVELOPMENT ORGANIZATIONS
OU
TBO
UN
D S
TRAT
EGY
Account-Based: SDRs receive assigned accounts.Partial Account-Based: SDRs receive some assignment accounts and choose other accounts to pursue.Greenfield: SDRs have discretion to choose accounts within their designated territory.
www.topohq.com | 18© 2016 TOPO All rights reservedThe 2016 Sales Development Benchmark Report
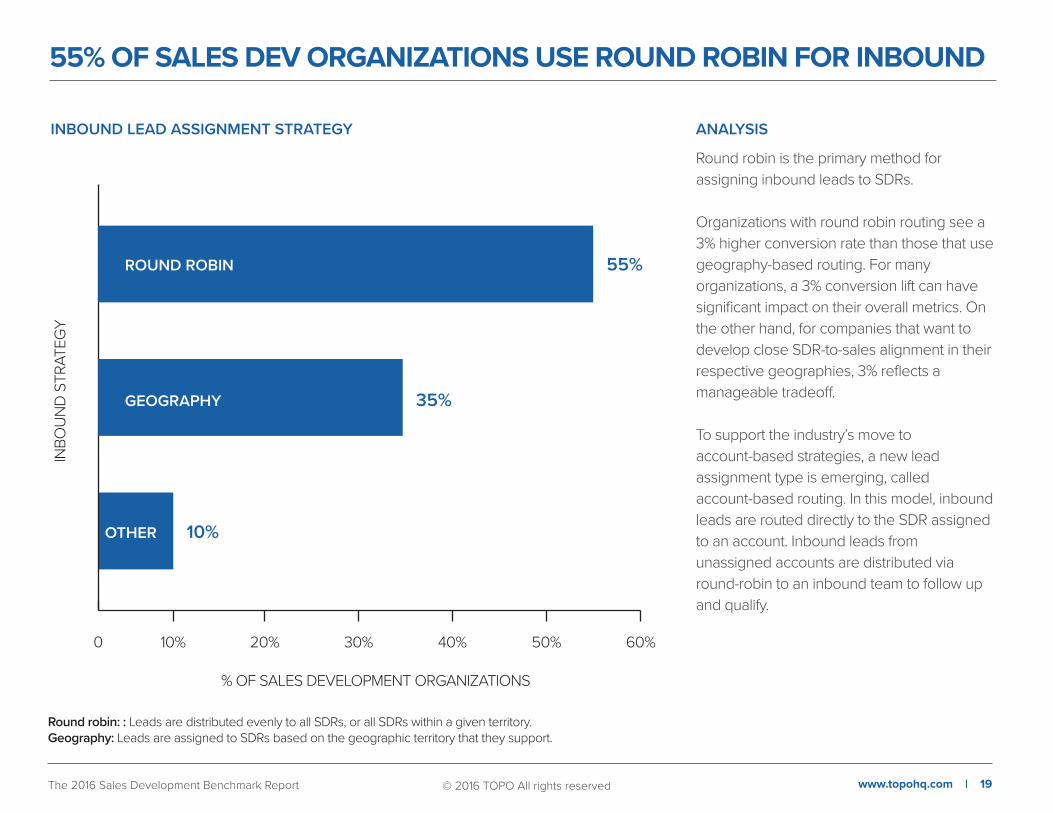
55% OF SALES DEV ORGANIZATIONS USE ROUND ROBIN FOR INBOUND
INBOUND LEAD ASSIGNMENT STRATEGY ANALYSIS
Round robin is the primary method for assigning inbound leads to SDRs.
Organizations with round robin routing see a 3% higher conversion rate than those that use geography-based routing. For many organizations, a 3% conversion lift can have significant impact on their overall metrics. On the other hand, for companies that want to develop close SDR-to-sales alignment in their respective geographies, 3% reflects a manageable tradeoff.
To support the industry’s move to account-based strategies, a new lead assignment type is emerging, called account-based routing. In this model, inbound leads are routed directly to the SDR assigned to an account. Inbound leads from unassigned accounts are distributed via round-robin to an inbound team to follow up and qualify.
0 10% 20% 30% 40% 50% 60%
ROUND ROBIN 55%
GEOGRAPHY 35%
OTHER 10%
% OF SALES DEVELOPMENT ORGANIZATIONS
INBO
UN
D S
TRAT
EGY
www.topohq.com | 19© 2016 TOPO All rights reservedThe 2016 Sales Development Benchmark Report
Round robin: : Leads are distributed evenly to all SDRs, or all SDRs within a given territory.Geography: Leads are assigned to SDRs based on the geographic territory that they support.

BENCHMARK DATA: SALES DEVELOPMENT PLAYS
www.topohq.com | 20© 2016 TOPO All rights reservedThe 2016 Sales Development Benchmark Report

www.topohq.com | 21© 2016 TOPO All rights reservedThe 2016 Sales Development Benchmark Report
THE SDR TOUCH PATTERN: MULTIPLE TOUCHES OVER MULTIPLE CHANNELS
ELEMENTCATEGORY INBOUND
Touch Pattern Total Touches 15.5 touches 15.6 touches
Channel Dials, Voicemails, Emails, LinkedIn Dials, Voicemails, Emails, LinkedIn
Duration 20 days 27 days
# of Emails
# of Dials
Total Daily Touches
# of Conversations
Conversation Rate
74 emails 77 emails
45 dials 49 dials
119 touches 126 touches
6 conversations 7 conversations
19.8 touches-to-1 conversation 18 touches-to-1 conversation
Daily Activity
OUTBOUND
TOUCH PATTERN AND ACTIVTY METRICS FOR INBOUND AND OUTBOUND

TOTAL TOUCHES HAVE INCREASED TO 16 PER PROSPECT
www.topohq.com | 22© 2016 TOPO All rights reservedThe 2016 Sales Development Benchmark Report
TOTAL TOUCHES PER PROSPECT BY TOUCH CHANNEL ANALYSIS
SDRs are delivering a high number of touches across multiple channels, over a 2-4 week time span.
Phone and email remain the primary channels for SDR touches, with social channels adding an incremental 1-2 touches per prospect.
The length of time in which SDRs pursue prospects has increased to 20 days for inbound and 27 days for outbound, on average.
TOUCH CHANNEL
NU
MBE
R O
F TO
UCH
ES
0
3
6
9
12
15
18
15.5 15.6
TOTAL
5.1 5.4
EMAILS
5.55.0
DIALS
3.2 3.2
VMS
1.7 1.9
SOCIAL
TOTAL INBOUND
TOTAL OUTBOUND

80% OF SDR TEAMS LEVERAGE TRIPLE TOUCHES
USE OF DIFFERENT TOUCH TYPES
www.topohq.com | 23© 2016 TOPO All rights reservedThe 2016 Sales Development Benchmark Report
ANALYSIS
80% of SDR teams are leveraging a triple touch, up from 50% last year.
SDRs that leverage a triple touch have 28% higher MQL-to-SQL rates than SDRs that use just phone and email.
19% of inbound SDR teams are leveraging chat touches, up from 3% last year.
Text and direct mail are emerging as additional touch types for SDRs.
0
40%
10%
20%
30%
19%
EMAIL, PHONE,LINKEDIN,
SOCIAL,CHAT
TOUCH TYPE
% O
F SA
LES
DEV
ELO
PMEN
T O
RGAN
IZAT
ION
S
EMAIL, PHONE,LINKEDIN,
SOCIAL
24%
EMAIL, PHONE,LINKEDIN
37%
EMAIL, PHONE
17%
EMAIL ONLY
2%
Triple Touch: a method of prospect outreach that involves an SDR sending an email, leaving a voicemail, and sending a LinkedIn InMail, all within minutes of each other.
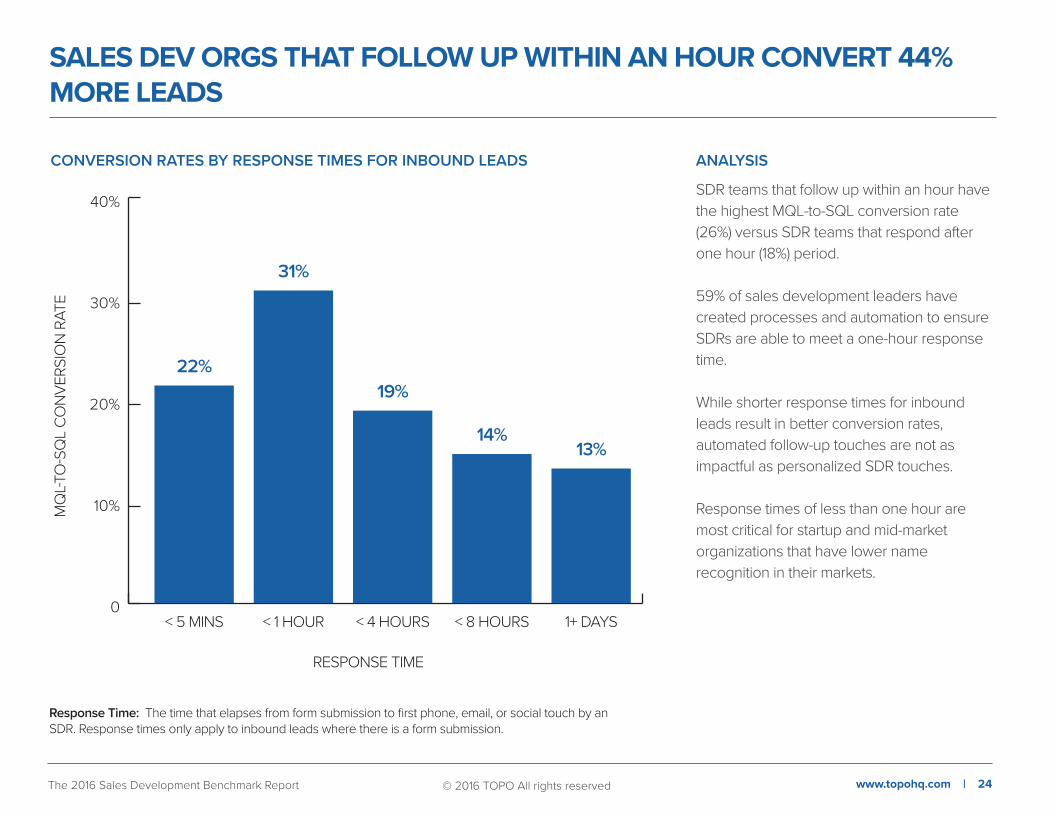
SALES DEV ORGS THAT FOLLOW UP WITHIN AN HOUR CONVERT 44% MORE LEADS
CONVERSION RATES BY RESPONSE TIMES FOR INBOUND LEADS
www.topohq.com | 24© 2016 TOPO All rights reservedThe 2016 Sales Development Benchmark Report
ANALYSIS
SDR teams that follow up within an hour have the highest MQL-to-SQL conversion rate (26%) versus SDR teams that respond after one hour (18%) period.
59% of sales development leaders have created processes and automation to ensure SDRs are able to meet a one-hour response time.
While shorter response times for inbound leads result in better conversion rates, automated follow-up touches are not as impactful as personalized SDR touches.
Response times of less than one hour are most critical for startup and mid-market organizations that have lower name recognition in their markets.
0
10%
20%
30%
40%
22%
< 5 MINS
RESPONSE TIME
MQ
L-TO-S
QL
CON
VERS
ION
RAT
E
< 1 HOUR
31%
< 4 HOURS
19%
< 8 HOURS
14%
1+ DAYS
13%
Response Time: The time that elapses from form submission to first phone, email, or social touch by an SDR. Response times only apply to inbound leads where there is a form submission.
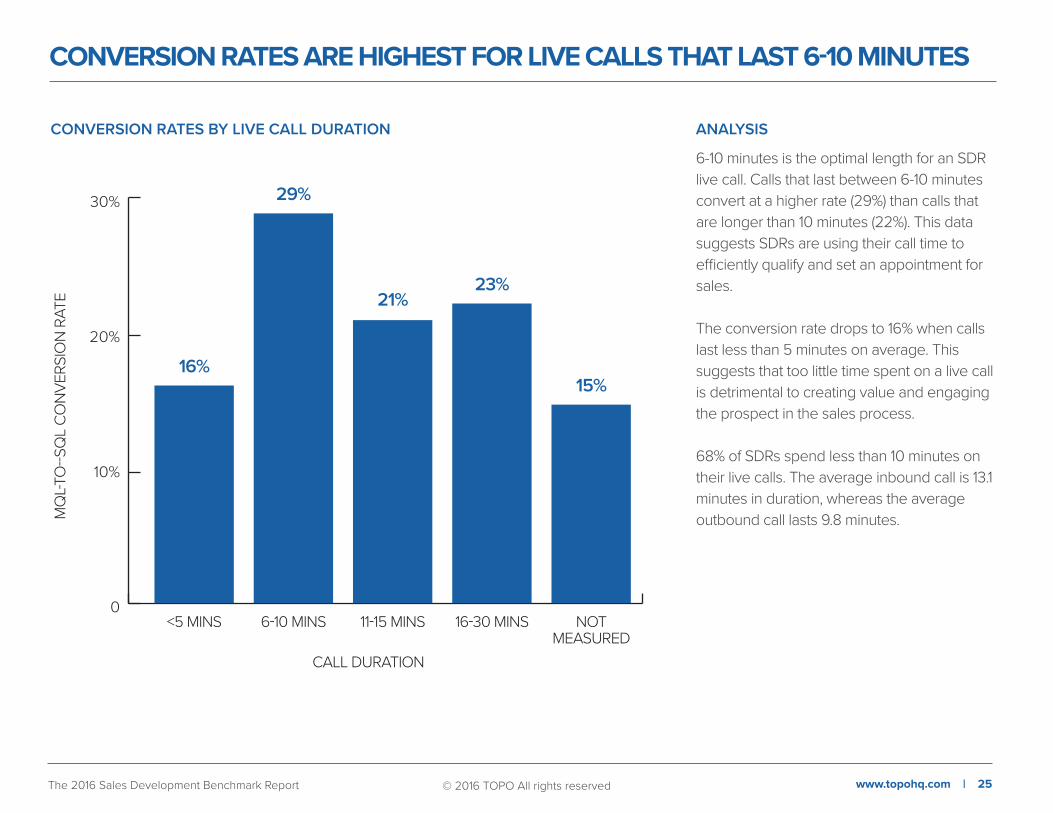
CONVERSION RATES ARE HIGHEST FOR LIVE CALLS THAT LAST 6-10 MINUTES
CONVERSION RATES BY LIVE CALL DURATION
www.topohq.com | 25© 2016 TOPO All rights reservedThe 2016 Sales Development Benchmark Report
ANALYSIS
6-10 minutes is the optimal length for an SDR live call. Calls that last between 6-10 minutes convert at a higher rate (29%) than calls that are longer than 10 minutes (22%). This data suggests SDRs are using their call time to efficiently qualify and set an appointment for sales.
The conversion rate drops to 16% when calls last less than 5 minutes on average. This suggests that too little time spent on a live call is detrimental to creating value and engaging the prospect in the sales process.
68% of SDRs spend less than 10 minutes on their live calls. The average inbound call is 13.1 minutes in duration, whereas the average outbound call lasts 9.8 minutes.
0
10%
20%
30%
16%
<5 MINS
CALL DURATION
MQ
L-TO--S
QL
CON
VERS
ION
RAT
E
6-10 MINS
29%
11-15 MINS
21%
16-30 MINS
23%
NOTMEASURED
15%
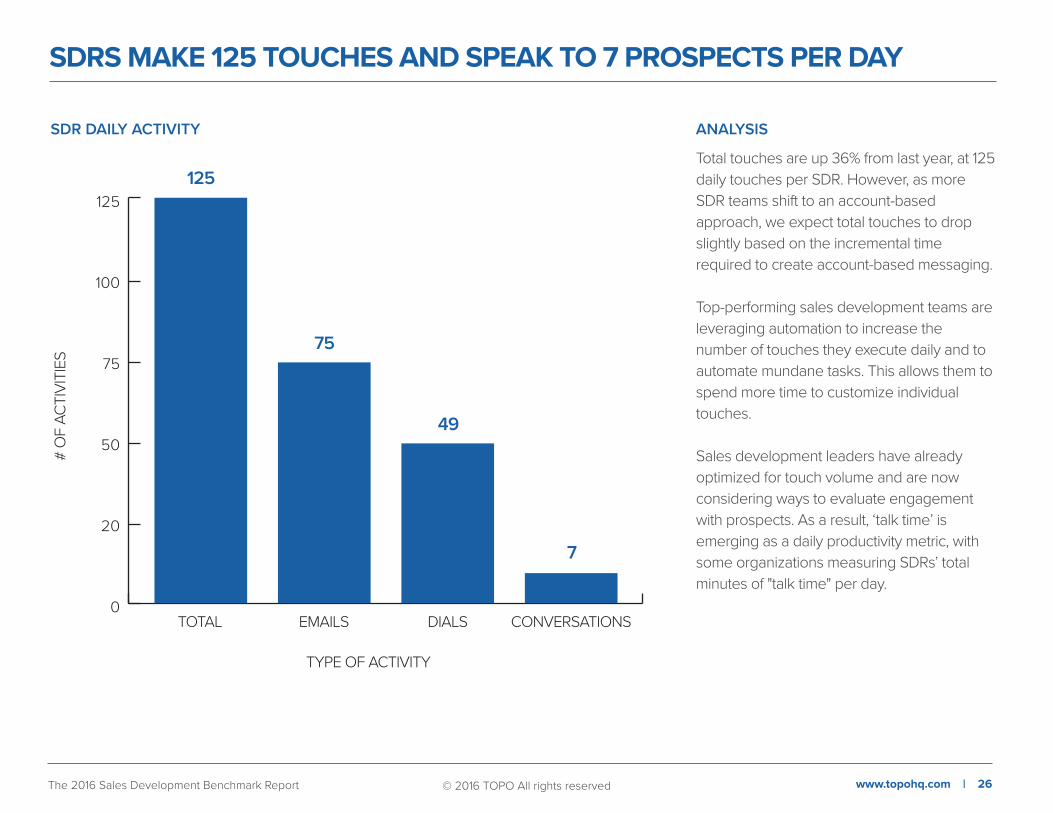
SDRS MAKE 125 TOUCHES AND SPEAK TO 7 PROSPECTS PER DAY
SDR DAILY ACTIVITY
www.topohq.com | 26© 2016 TOPO All rights reservedThe 2016 Sales Development Benchmark Report
ANALYSIS
Total touches are up 36% from last year, at 125 daily touches per SDR. However, as more SDR teams shift to an account-based approach, we expect total touches to drop slightly based on the incremental time required to create account-based messaging.
Top-performing sales development teams are leveraging automation to increase the number of touches they execute daily and to automate mundane tasks. This allows them to spend more time to customize individual touches.
Sales development leaders have already optimized for touch volume and are now considering ways to evaluate engagement with prospects. As a result, ‘talk time’ is emerging as a daily productivity metric, with some organizations measuring SDRs’ total minutes of "talk time" per day.
0
50
75
20
100
125125
TOTAL
TYPE OF ACTIVITY
# O
F AC
TIVI
TIES
EMAILS
75
DIALS
49
CONVERSATIONS
7
BENCHMARK DATA: SALES DEVELOPMENT MANAGEMENT
www.topohq.com | 27© 2016 TOPO All rights reservedThe 2016 Sales Development Benchmark Report
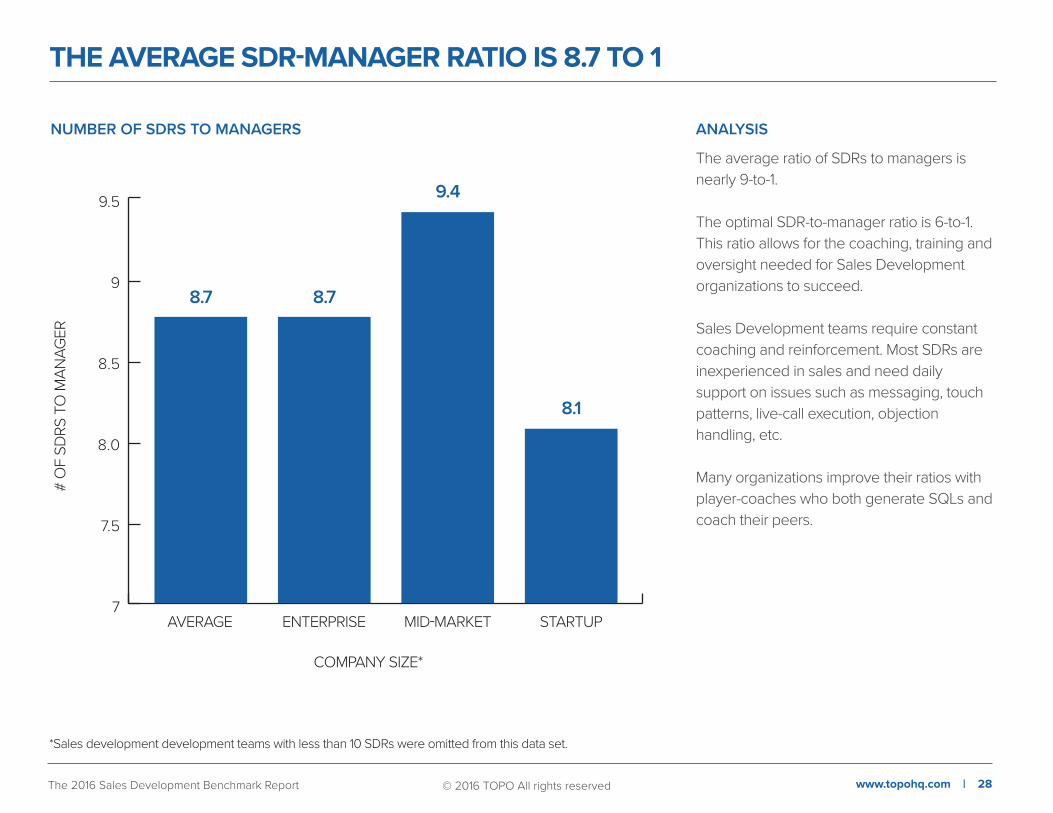
THE AVERAGE SDR-MANAGER RATIO IS 8.7 TO 1
NUMBER OF SDRS TO MANAGERS
www.topohq.com | 28© 2016 TOPO All rights reservedThe 2016 Sales Development Benchmark Report
ANALYSIS
The average ratio of SDRs to managers is nearly 9-to-1.
The optimal SDR-to-manager ratio is 6-to-1. This ratio allows for the coaching, training and oversight needed for Sales Development organizations to succeed.
Sales Development teams require constant coaching and reinforcement. Most SDRs are inexperienced in sales and need daily support on issues such as messaging, touch patterns, live-call execution, objection handling, etc.
Many organizations improve their ratios with player-coaches who both generate SQLs and coach their peers.
7
8.0
8.5
7.5
9
9.5
8.7
AVERAGE
COMPANY SIZE*
# O
F SD
RS T
O M
ANAG
ER
ENTERPRISE
8.7
MID-MARKET
9.4
STARTUP
8.1
*Sales development development teams with less than 10 SDRs were omitted from this data set.

www.topohq.com | 29© 2016 TOPO All rights reserved
64% OF SALES DEV ORGANIZATIONS REPORT TO SALES
The 2016 Sales Development Benchmark Report
ANALYSIS
Overall, sales development organizations primarily report to sales, with 64% of teams positioned within the sales organization.
However, among larger enterprises, more than half (53%) of SDR teams report to marketing.
The data suggests that there is no fundamental difference in results based on where SD reports. The overall outputs and conversion rates are roughly the same.
SALES DEVELOPMENT ORGANIZATIONS THAT REPORT INTO MARKETING VS. SALES
MARKETING25%
SALES64%
OTHER11%

www.topohq.com | 30© 2016 TOPO All rights reserved
95% OF SDRS HAVE LESS THAN 2 YEARS OF WORK EXPERIENCE
The 2016 Sales Development Benchmark Report
ANALYSIS
Hiring inexperienced candidates has become the norm in sales development. 95% of sales development leaders purposely hire SDRs with less than two years of experience.
Organizations view SDRs as an entry point into a sales and the rest of the organization. Also, sales development leaders prefer inexperienced candidates because they are open to building good habits and accepting the preferred sales methodology.
Successfully hiring reps without a quantifiable track record is challenging. SDR leaders mitigate this issue by creating hiring profiles focused on specific traits that support successful performance. Common traits include drive, competitiveness, and “coach-ability.”
SDR’S EXPERIENCE PRIOR TO HIRING
NO EXPERIENCE17%
<1 YEAR33%
1 TO 2 YEARS45%
2 + YEARS5%
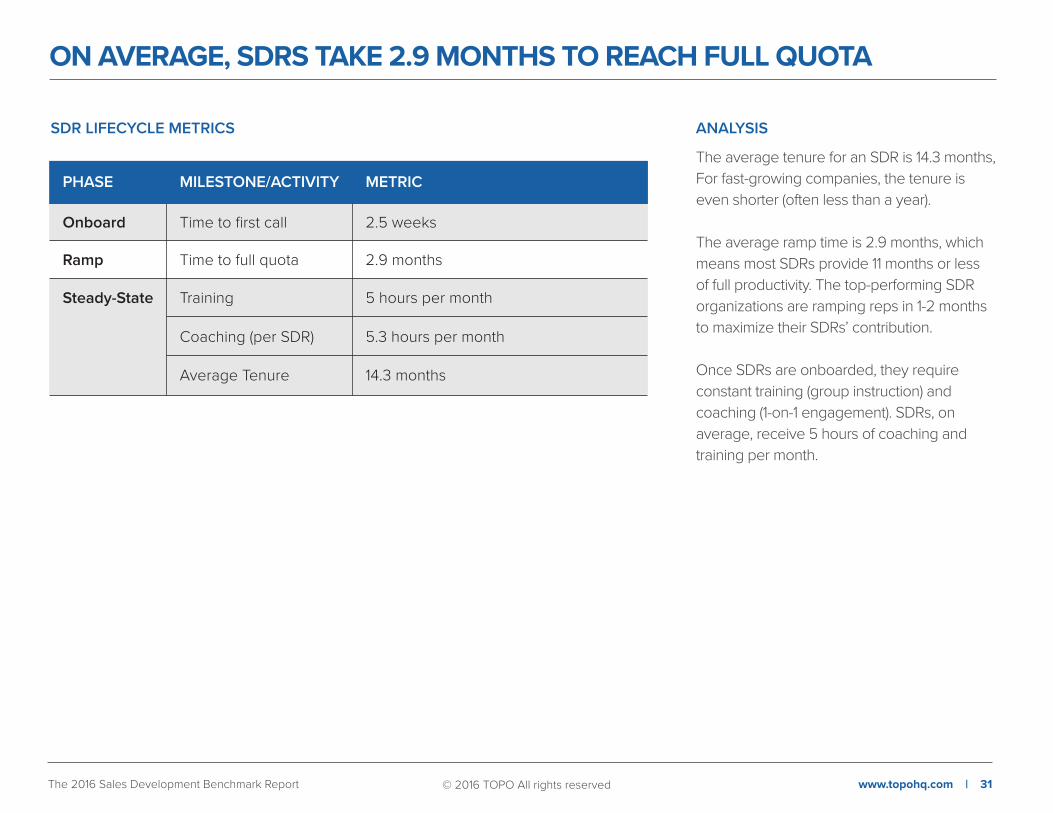
ON AVERAGE, SDRS TAKE 2.9 MONTHS TO REACH FULL QUOTA
© 2016 TOPO All rights reserved www.topohq.com | 31The 2016 Sales Development Benchmark Report
ANALYSIS
The average tenure for an SDR is 14.3 months, For fast-growing companies, the tenure is even shorter (often less than a year).
The average ramp time is 2.9 months, which means most SDRs provide 11 months or less of full productivity. The top-performing SDR organizations are ramping reps in 1-2 months to maximize their SDRs’ contribution.
Once SDRs are onboarded, they require constant training (group instruction) and coaching (1-on-1 engagement). SDRs, on average, receive 5 hours of coaching and training per month.
SDR LIFECYCLE METRICS
PHASE MILESTONE/ACTIVITY METRIC
Onboard
Ramp
Steady-State
Time to first call
Time to full quota
Training
Coaching (per SDR)
Average Tenure
2.5 weeks
2.9 months
5 hours per month
5.3 hours per month
14.3 months
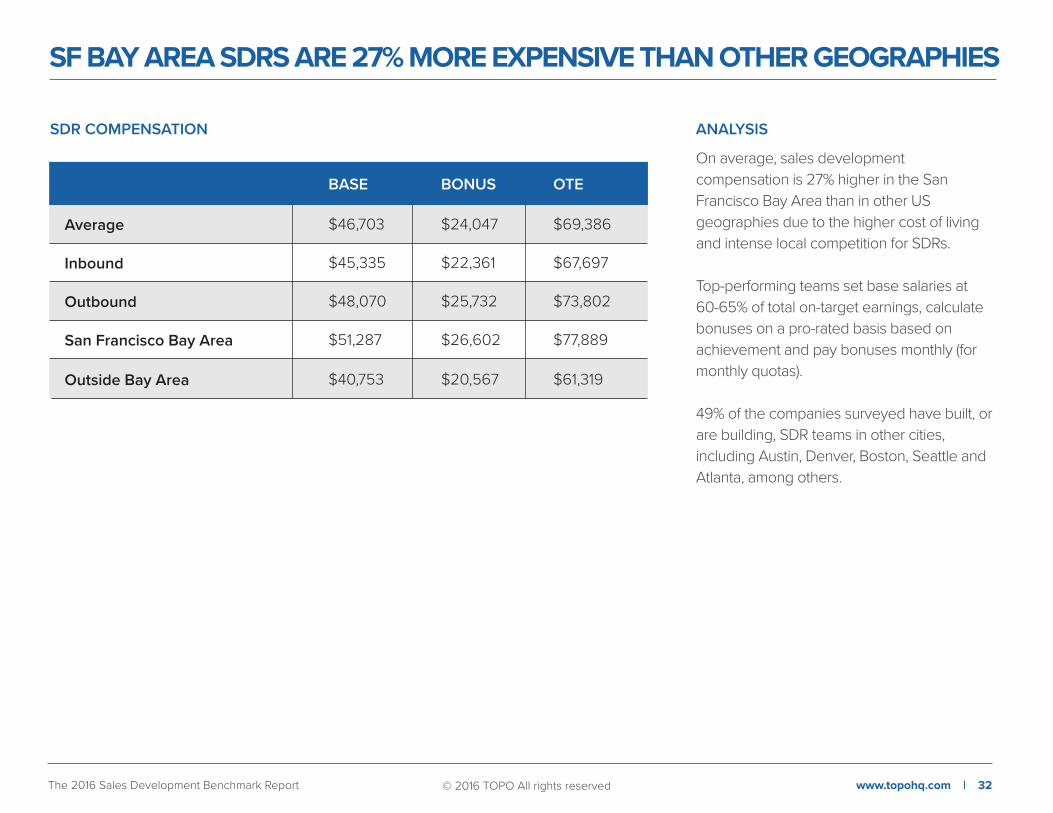
SF BAY AREA SDRS ARE 27% MORE EXPENSIVE THAN OTHER GEOGRAPHIES
© 2016 TOPO All rights reserved www.topohq.com | 32The 2016 Sales Development Benchmark Report
ANALYSIS
On average, sales development compensation is 27% higher in the San Francisco Bay Area than in other US geographies due to the higher cost of living and intense local competition for SDRs.
Top-performing teams set base salaries at 60-65% of total on-target earnings, calculate bonuses on a pro-rated basis based on achievement and pay bonuses monthly (for monthly quotas).
49% of the companies surveyed have built, or are building, SDR teams in other cities, including Austin, Denver, Boston, Seattle and Atlanta, among others.
SDR COMPENSATION
BASE BONUS OTE
Average
Inbound
Outbound
San Francisco Bay Area
Outside Bay Area
$46,703 $24,047 $69,386
$45,335 $22,361 $67,697
$48,070 $25,732 $73,802
$51,287 $26,602 $77,889
$40,753 $20,567 $61,319
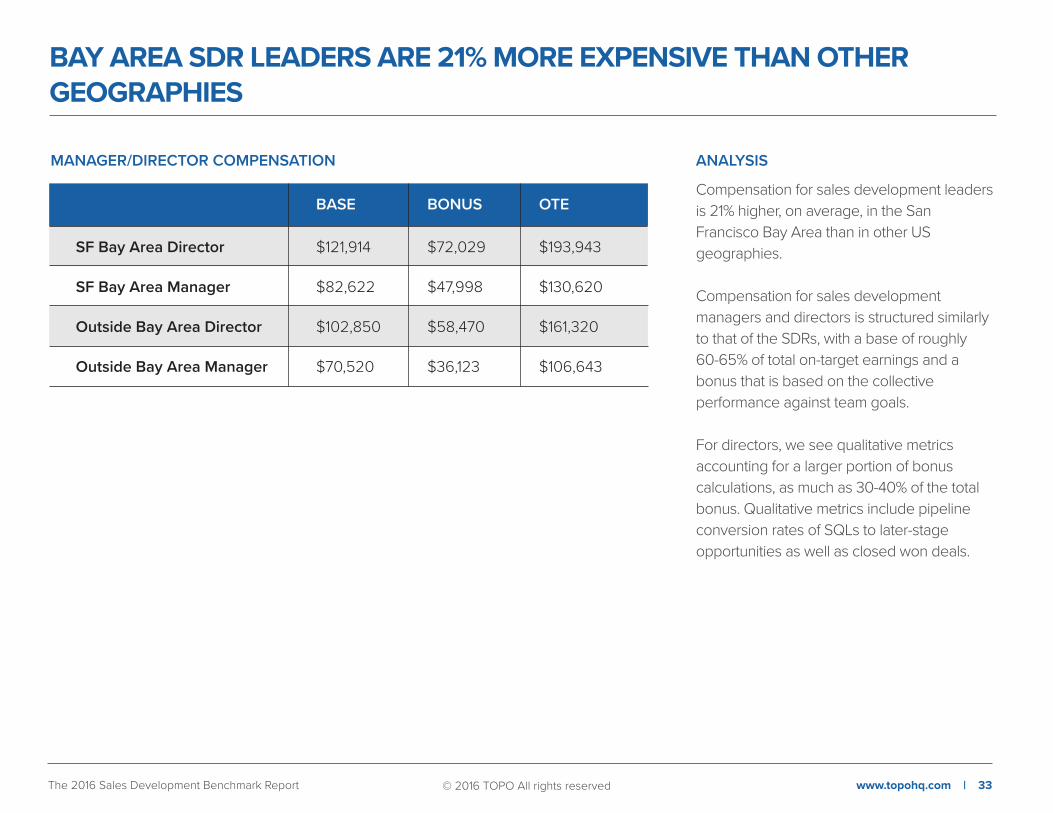
BAY AREA SDR LEADERS ARE 21% MORE EXPENSIVE THAN OTHER GEOGRAPHIES
© 2016 TOPO All rights reserved www.topohq.com | 33The 2016 Sales Development Benchmark Report
ANALYSIS
Compensation for sales development leaders is 21% higher, on average, in the San Francisco Bay Area than in other US geographies.
Compensation for sales development managers and directors is structured similarly to that of the SDRs, with a base of roughly 60-65% of total on-target earnings and a bonus that is based on the collective performance against team goals.
For directors, we see qualitative metrics accounting for a larger portion of bonus calculations, as much as 30-40% of the total bonus. Qualitative metrics include pipeline conversion rates of SQLs to later-stage opportunities as well as closed won deals.
MANAGER/DIRECTOR COMPENSATION
SF Bay Area Director
SF Bay Area Manager
Outside Bay Area Director
Outside Bay Area Manager
BASE
$121,914
$82,622
$102,850
$70,520
BONUS
$72,029
$47,998
$58,470
$36,123
OTE
$193,943
$130,620
$161,320
$106,643
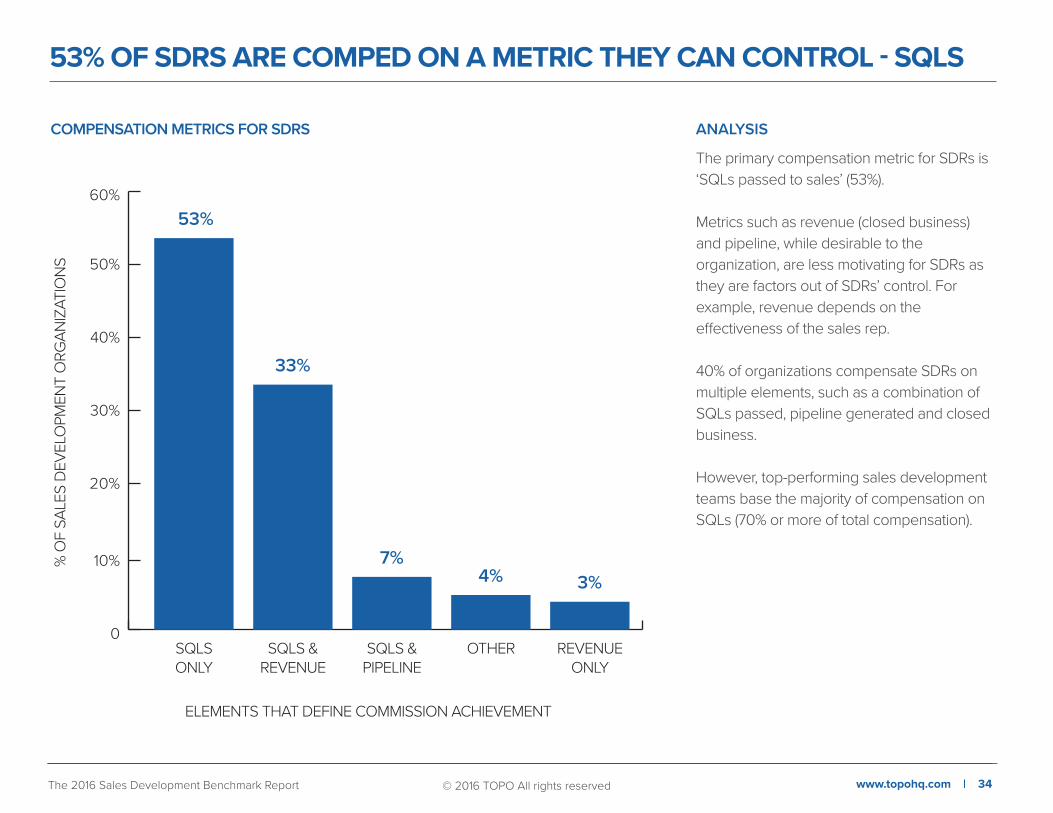
53% OF SDRS ARE COMPED ON A METRIC THEY CAN CONTROL - SQLS
www.topohq.com | 34© 2016 TOPO All rights reservedThe 2016 Sales Development Benchmark Report
ANALYSIS
The primary compensation metric for SDRs is ‘SQLs passed to sales’ (53%).
Metrics such as revenue (closed business) and pipeline, while desirable to the organization, are less motivating for SDRs as they are factors out of SDRs’ control. For example, revenue depends on the effectiveness of the sales rep.
40% of organizations compensate SDRs on multiple elements, such as a combination of SQLs passed, pipeline generated and closed business.
However, top-performing sales development teams base the majority of compensation on SQLs (70% or more of total compensation).
0
10%
20%
30%
40%
50%
60%53%
SQLSONLY
SQLS &REVENUE
ELEMENTS THAT DEFINE COMMISSION ACHIEVEMENT
% O
F SA
LES
DEV
ELO
PMEN
T O
RGAN
IZAT
ION
S
SQLS &PIPELINE
OTHER
33%
7%4%
REVENUEONLY
3%
COMPENSATION METRICS FOR SDRS
BENCHMARK DATA: SALES DEVELOPMENT TECHNOLOGY
www.topohq.com | 35© 2016 TOPO All rights reservedThe 2016 Sales Development Benchmark Report
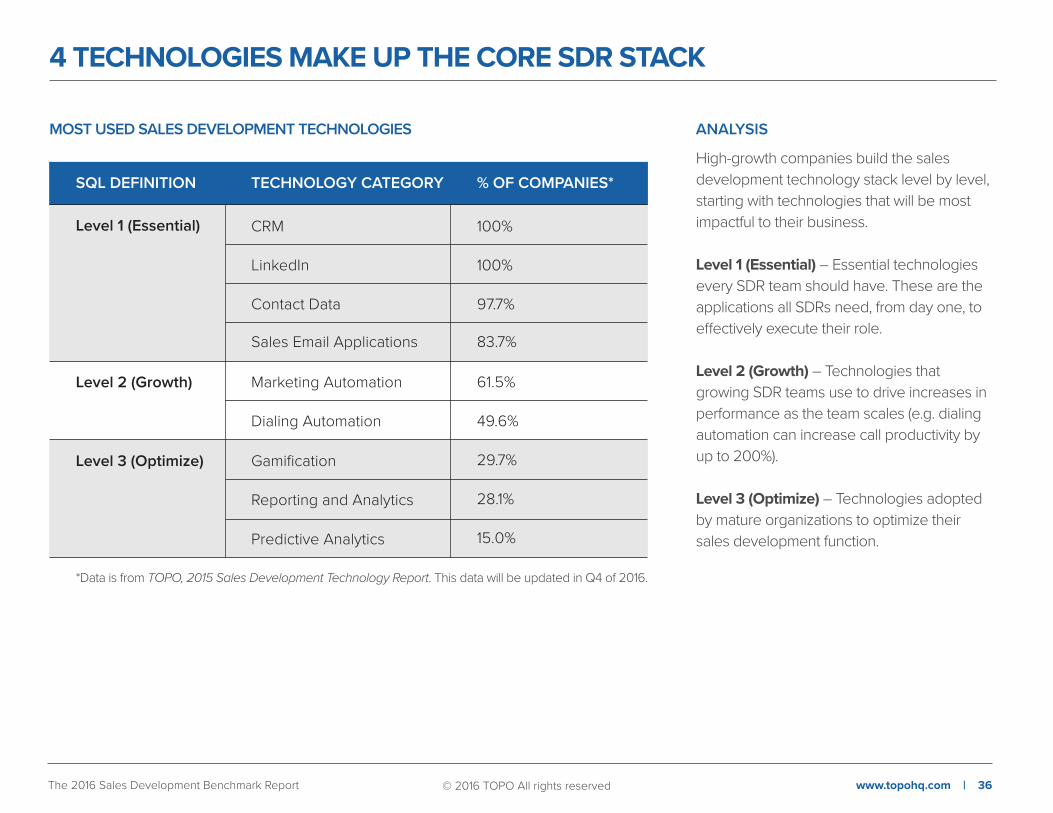
ANALYSIS
High-growth companies build the sales development technology stack level by level, starting with technologies that will be most impactful to their business.
Level 1 (Essential) – Essential technologies every SDR team should have. These are the applications all SDRs need, from day one, to effectively execute their role.
Level 2 (Growth) – Technologies that growing SDR teams use to drive increases in performance as the team scales (e.g. dialing automation can increase call productivity by up to 200%).
Level 3 (Optimize) – Technologies adopted by mature organizations to optimize their sales development function.
MOST USED SALES DEVELOPMENT TECHNOLOGIES
SQL DEFINITION
Level 1 (Essential)
Level 2 (Growth)
Level 3 (Optimize)
TECHNOLOGY CATEGORY % OF COMPANIES*
CRM 100%
100%
97.7%
83.7%
61.5%
49.6%
29.7%
28.1%
15.0%
Contact Data
Sales Email Applications
Marketing Automation
Dialing Automation
Gamification
Reporting and Analytics
Predictive Analytics
4 TECHNOLOGIES MAKE UP THE CORE SDR STACK
© 2016 TOPO All rights reserved www.topohq.com | 36The 2016 Sales Development Benchmark Report
*Data is from TOPO, 2015 Sales Development Technology Report. This data will be updated in Q4 of 2016.
ABOUT THE TOPO SALES DEVELOPMENT PRACTICE
TOPO’s Sales Development Practice works with high-growth companies to transform their sales development organizations into the best in the world. Sales development organizations depend on our research, best practices and tools to make informed strategic decisions that drive pipeline growth and enable sales development reps to generate more opportunities for sales.
Data: Benchmarks collected from the world’s fastest growing companies across hundreds of key sales development data points.
Research: Best practices and tools that make faster revenue growth a reality by focusing on specific, actionable strategies, tactics and plays.
Advisory: Personalized advice and support from sales development’s best and brightest – TOPO Analysts and your peers from the world’s fastest growing companies.
Events: Council events and workshops focused on learning and sharing of best practices to define success for top-performing SDR teams, with peer networking among leading sales development practitioners.
Playbooks & Training: Custom-built playbooks and training sessions to ensure your sales and marketing organizations are utilizing the best practices of the world’s fastest growing companies.
1.
2.
3.
4.
5.
We do this by offering:
FOR MORE INFORMATION
To find out how TOPO can help you grow revenue faster, contact us at:
Email: [email protected]: www.topohq.comBlog: blog.topohq.comAnalysts: [email protected]
www.topohq.com | 37© 2016 TOPO All rights reservedThe 2016 Sales Development Benchmark Report