the 2nd asean energy outlook revapr14 - commend: community for
TRANSCRIPT

The 2nd ASEAN Energy Demand Outlook
Prepared in conjunction with theEnergy Supply Security Planning
for the ASEAN (ESSPA)
Prepared byThe Energy Data and Modeling Center
The Institute of Energy Economics, Japan,
The ASEAN Center for Energy
andThe National ESSPA Project Teams
for theASEAN SOE Leaders
and theMinistry of the Economy, Trade and Industry, Japan
March 2009


DISCLAIMER
This report was prepared as part of the activity under SOME-METI Programme onEnergy Supply Security Planning for the ASEAN (ESSPA). The data and assumptionsused were discussed and agreed on by the representatives of the participating ASEANmember states to enable harmonization of forecasting techniques and assumptions.These assumptions and modeling approaches may differ from those used in eachmember states. Therefore, the projections presented here should not be viewed asofficial national projections of the ASEAN member states.

i
FOREWORD
Japan has been involved in two cooperation programs in ASEAN region based on the SOME-METI Energy Cooperation Program. They are:
a. Energy Supply Security Planning in the ASEAN (ESSPA)
b. Promotion on Energy Efficiency and Conservation (PROMEEC)
This report contains the results of “2nd Energy Demand Supply Outlook in ASEAN” project,one of ESSPA activities, which was started in December 2007.
In order to evaluate past and current energy security situation in ASEAN region, Japan assistedthe ASEAN CENTER FOR ENERGY (hereafter referred to as ACE), the representative body ofASEAN region regarding energy issue, to develop the ASEAN Energy Database from year2001 to 2003, in order to maintain consistent annual historical energy data of the membercountries. Japan also conducted the project for forecasting future energy security situation inASEAN region based on future energy demand projected using the energy demand outlookmodel from 2003 to 2005. However, the main purpose of this cooperation program is capacitybuilding, thus The Institute of Energy Economics, Japan (hereafter referred to as IEEJ)transferred its technical know-how on energy demand supply outlook work to ASEANparticipants of this project in 2007 and the participants implemented the practical workthemselves. It was marvelous that all the participants which included even beginners couldreach the final step, in other words, succeeded to simulate energy outlook up to year 2030 usingthe model.
This report is the 2nd version of the outlook project. Differences from the 1st version of thereport are break-down of petroleum products, incorporation of refinery process and treatment ofindigenous production, and so on. In other words, the 2nd version of the ASEAN energy outlookmodel is enriched with more precise details than the 1st version. The participants prepared themain part of this report - the country discussions – while IEEJ and ACE worked on the otherparts.
I hope that this report would contribute as one of the references for policy decision making inmaintaining future energy security of Japan as well as the ASEAN.
Shigeru KimuraSenior Research FellowThe Energy Data and Modelling CenterThe Institute of Energy Economic, Japan
March 2009

ii
ACKNOWLEDGEMENT
The 2nd Energy Demand and Supply Outlook in the ASEAN is a project under the SOME-METIEnergy Cooperation Program on the Energy Supply Security Planning in the ASEAN. Thisoutlook is a product of a joint effort between ASEAN Member States, ASEAN Centre forEnergy (ACE) and Institute of Energy Economy Japan (IEEJ) to develop an energy demand andsupply outlook model for the ASEAN region up to 2030 and at the same time to enhance thecapacity building of ASEAN people in energy modeling.
We would like to acknowledge and express our sincere gratitude for all the supports providedby everyone who were involved as follows:
1. Mr. Kiyoshi Mori, Director, International Affairs Division, Agency for NaturalResources and Energy, METI, Japan, for the provision of the funding support necessaryto realize this activity and to release the publication,
2. Mr. Yukinori Seki, Section Chief, METI, for his full support in approving and realizingthe implementation of this activity under ESSPA Work Programme 2007 – 2008,
3. Dr. Weerawat Chantanakome for his support and advice on this activity in his role asACE Executive Director during the initial phase of ESSPA Programme 2007 – 2008,
4. Mr. Shigeru Kimura, Research Fellow, General Manager of the Energy Data andModeling Centre (EDMC), IEEJ, for his expertise, continuous guidance and advices,encouragement, and patience in proposing, negotiating, implementing and finalizing thesecond publication of Development of Energy Demand Supply Outlook in the ASEANfrom 2007 to 2009.
5. Mr. Edito Barcelona, Senior Researcher of IEEJ, for his kind guidance and advices toall the participants of ASEAN member states and for his patience in directing theparticipants as well as his editing of this report,
6. Mrs. Cecilya Malik Sastrohartono, Energy Expert from the Agency for the Assessmentand Application of Technology on her capacity as ACE representative, for her expertisein managing, implementing, reporting and finalizing the second publication ofDevelopment of Energy Demand Supply Outlook in the ASEAN and for her strong andsincere commitment to cooperate with IEEJ since 2003,
7. SOE Leaders of Brunei Darussalam, Cambodia, Indonesia, Lao PDR, Malaysia,Myanmar, Philippines, Singapore, Thailand and Vietnam for approving the 2nd EnergyDemand and Supply Outlook in the ASEAN and continuously supporting the activitiesunder ESSPA Work Programme until now,
8. ESSPA / REPP-SSN Focal Points for their cooperation in approving and providingappropriate technical personnel to participate in the 2nd Energy Demand and SupplyOutlook in the ASEAN,
9. Ms. Noor Dina Zharina Yahya, Ms. Adelina Jaya and other Brunei personnel for theirhard work in modeling and finalizing the Brunei Energy Demand and Supply Outlook,
10. Mr. Heng Kunleang, Mr. Sok Chandareth and other Cambodia personnel for their hardwork in modeling and finalizing the Cambodia Energy Demand and Supply Outlook,
11. Mr. Golfritz Sahat, Ms. Fifi Indarwati and other Indonesia personnel for their hard workin modeling and finalizing the Indonesia Energy Demand and Supply Outlook,

iii
12. Mr. Khamso Kouphokham, Ms. Sengdeuane Vonginh and other Lao PDR personnel fortheir hard work in modeling and finalizing the Lao PDR Energy Demand and SupplyOutlook,
13. Ms. Yuzlina Mohd. Yusop, Mr. Zaharin Zulkifli, Ms. Marhaini binti Mat and otherMalaysia personnel for their hard work in modeling and finalizing the Malaysia EnergyDemand and Supply Outlook,
14. Mr. Zaw Aung, Mr. U Kyaw Min Thu for their hard work in modeling and finalizingthe Myanmar Energy Demand and Supply Outlook,
15. Mr. Danilo Javier and Mr. Michael Sinocruz for their hard work in modeling andfinalizing the Philippines Energy Demand and Supply Outlook,
16. Ms. Latha R. Ganesh and other Singapore personnel for their hard work in modelingand finalizing the Singapore Energy Demand and Supply Outlook,
17. Ms. Supit Padprem, Mr. Wattanapong Kurovat, and other Thailand personnel for theirhard work in modeling and finalizing the Thailand Energy Demand and Supply Outlook,
18. Mr. Nguyen Minh Bao, Ms. Pham Thi Quynh Nga for their hard work in modeling andfinalizing the Vietnam Energy Demand and Supply Outlook,
19. Mr. Akhmad Nidlom, Ms. Andini Desita Ekaputri, and other ACE personnel for alltheir support and commitment in the initiation, implementation, proofreading andfinalization of the 2nd Energy Demand and Supply Outlook in the ASEAN,
20. Other experts and personnel from, among others, IEEJ, APERC, ASEAN member stateswho participated and provided valuable inputs from the initiation, implementation, andfinalization of the 2nd Energy Demand and Supply Outlook in the ASEAN.
Nguyen Manh Hung
Executive Director
ASEAN Centre for Energy

iv
ABBREVIATIONS AND ACRONYMS
ACE – ASEAN Center for EnergyAEEMTRC – ASEAN-EC Energy Management Training and Research CenterAPSA – ASEAN Petroleum Sharing AgreementASEAN – Association of Southeast Asian NationsCCGT – Combined-cycle gas turbineCDM – Clean Development MechanismCNG – Compressed natural gasCO2 – Carbon dioxideEDMC – The Energy Data and Modeling CenterESSPA – Energy Supply Security Planning for the ASEANGDP – Gross domestic productGTL – Gas-to-liquidGVA – Gross value addedIEA – International Energy AgencyIEEJ – The Institute of Energy Economics, Japankt-C – Thousand tons of Carbon equivalentKTOE – Thousand tons of oil equivalentLEAP – Long-range Energy Alternative Planning SystemLNG – Liquefied natural gasMETI – Ministry of the Economy, Trade and Industry, JapanMTOE – Million tons of oil equivalentOECD – Organization for Economic Cooperation and DevelopmentR&D – Research and developmentSOE – Senior Official on EnergyTOE – Tons of oil equivalentTWh – Terawatt-hourUSD – United States Dollar

v
TABLE OF CONTENTS
Foreword iAcknowledgement iiAbbreviations and Acronyms iv
Executive Summary 1Introduction 3Socio-Economic and Energy Situation in the ASEAN in 2005 5Methodological Framework 6Forecast Assumptions 9Energy Demand and CO2 Emission Outlook 12
Final Energy Consumption 12Primary Energy Supply 14Power Generation 16CO2 Emission Outlook 17
Implications and Policy Recommendations 18
Annex 1 – Country Reports 21Brunei Darussalam 23Cambodia 29Indonesia 35Lao PDR 41Malaysia 47Myanmar 53Philippines 59Singapore 69Thailand 75Vietnam 81
Annex 2 – Final Energy Demand Equations 87Annex 3 – Naming Conventions for Sectors, Energy and Key Variables 121Annex 4 – Results Summary Tables 123
vi
LIST OF FIGURES
Figure 1 – Structure of the ASEAN Energy Model 7Figure 2 – Nominal Oil Price Assumption 11Figure 3 – Projected Final Energy Consumption in ASEAN by Sector 12Figure 4 – Projected Final Energy Consumption in ASEAN by Fuel Type 13Figure 5 – Primary Energy Requirements in ASEAN 15Figure 6 – CO2 Emissions in the Reference and High Scenarios, in Mt-C 17
LIST OF TABLES
Table 1 – Work Schedule of the ESSPA energy Demand Outlook ModelActivities 5
Table 2 – Average Annual GDP Growth Assumptions, Reference Scenario, inPercent 10
Table 3 – Average Annual GDP Growth Assumptions, High Scenario, in Percent 10Table 4 – Average Annual Population Growth Assumptions, in Percent 11Table 5 – Electricity Production in ASEAN (Reference and High Scenarios), in
TWh 16Table 6 – Fuel Inputs to Power Generation in ASEAN, in MTOE 16

THE 2ND ASEAN ENERGY OUTLOOK
EXECUTIVE SUMMARY
The 2nd ASEAN Energy Outlook is an update of the 1st ASEAN Energy Outlook prepared in2005 in conjunction with the SOME-METI joint cooperation program on capacity building forEnergy Supply Security Planning in the ASEAN. The intention was to develop an energydemand outlook model in ASEAN while at the same time provide capacity building to ASEANenergy analysts in energy demand modeling.
This outlook has covered all the 10 member states of the ASEAN while the 1st outlook was onlyable to cover 6 member states due to limitations in data availability for 2 states andunavailability of technical staff that could participate in the forecasting work from 2 other states.
This work is a joint output of Japan being represented by The Institute of Energy Economics,Japan (IEEJ) and 10 national energy outlook teams from the 10 member states with thecoordination and logistics work handled by the ASEAN Centre for Energy (ACE).
The energy data used in the modeling work were taken from the Energy Balances for Non-OECD Members Countries that is published by the International Energy Agency annually. Theeconomic and social indicators were obtained from the World Bank’s World DevelopmentIndicators that is also published annually. Other relevant data that are not available from thispublication are obtained from national sources.
The assumptions used were proposed by IEEJ which includes GDP growth rate for theReference scenario, population growth rate obtained from UN Department of Economic andSocial Affairs, crude oil price assumptions and GDP deflators which were projected by IEEJ.
The methodology applied for the final energy demand forecasting was econometrics while theestimation of primary energy consumption used an engineering based model but thedevelopment programs of each member states were the major inputs used in the models. Themodeling work was carried out in three 1-week working/training meetings and in sets ofhomework given to each national team after every meeting.
As results of the foregoing, the following are the energy and CO2 emission outlook in the nexttwo and a half decades:
Final energy consumption in ASEAN will grow at an average annual rate of 3.9 percentfrom 343 MTOE 2005 to 901 MTOE 2030 in the Reference scenario with thetransportation sector experiencing the highest growth in consumption of 5.1 percent perannum. The industry sector consumption will grow at an annual rate of 4.6 percentwhile the consumption of the combined residential, commercial and agriculture sectorswill have a slower growth of 2.4 percent per annum. Electricity will have the highestgrowth rate among the energy consumed in the final consumption sector at 6.1 percentper annum. This is followed by coal at 5.9 percent, natural gas at 5.0 percent and oil at4.5 percent. Biomass will have a slow growth rate of 0.2 percent per annum.
The corresponding primary energy consumption will have a faster growth rate of 4.0percent per annum with coal having the fastest annual growth rate of 6.9 percent. This isdue to the projected rapid growth in electricity consumption that will be met largely bycoal-fired generation. Hydropower will have the second fastest growth rate of 5.4percent as countries in the Great Mekong Sub-region decide to develop their vasthydropower potential. Oil and natural gas will have the next fastest growth rates of 4.0

2
percent per annum. Oil will remain as the major source of energy in the region evenincreasing its share to the total primary energy supply from 40.9 percent in 2005 to 41.5percent in 2030. Nuclear energy will be introduced in the region before 2020 and willhave a 0.9 percent share of the total by 2020 which will increase to 1.6 percent in 2030.Geothermal energy will be developed in the Philippines and Indonesia which will resultto 3.9 percent annual growth rate in the primary energy supply. Biomass will continueto grow albeit at a slow pace of 0.2 percent per annum. The growth in energyconsumption will increase per capita energy consumption from 0.9 TOE per person in2005 to 1.8 TOE per person in 2030. However, energy consumption per unit of GDPwill decrease from 627 TOE/million US dollars1 (USD) in 2005 to 500 TOE/millionUSD in 2030, a reduction of 20.3 percent over a 25-year period.
The above growth in primary energy consumption will result to a corresponding 5.1percent annual growth in CO2 emission. This is due to the faster growth rate in theconsumption of carbon-based energy sources than in the growth of carbon-free sourcessuch as nuclear and renewable energy. As a result, CO2 emission per unit of energyconsumption will increase from 0.52 tons of carbon equivalent (kt-C)/TOE in 2005 to0.68 kt-C/TOE in 2030. CO2 emission per unit of GDP will also increase at averageannual rate of 0.2 percent from 325 kt-C/million USD in 2005 to 339 kt-C/million USDin 2030
The abovementioned findings raised implications to the energy supply security and globalenvironmental stability. There was an agreement among the national teams that the followingmeasures need to be taken to face the future challenges posed by rapidly increasing energyconsumption:
Utilize CDM to mitigate climate change
Diversify the energy mix to reduce overdependence on certain energy sources andincrease utilization of indigenous energy, such as low-grade coal, to decreasedependence on imported energy.
Promote technology transfer and development on clean coal technology from thedeveloped world and encourage R&D in renewable energy, energy efficient and cleantechnologies as well as alternative fuels.
Promote energy efficiency and conservation by encouraging modal shift in thetransportation sector, use more efficient technologies to reduce consumption of biomassand intensify energy efficiency and conservation program in the short- and long-termsacross all sectors.
Accelerate development of clean energy such as renewables and alternative energy byencouraging the use of alternative fuels from biomass, enhancing renewable energy toreplace oil consumption in the final sector, increasing renewable energy and attain amore balanced mix in electricity generation, utilizing alternative fuels such as CNG inthe transportation sector., and formulating policies to promote the utilization ofrenewables, alternative fuels and nuclear energy.
Create an energy investment climate conducive to investors by formulating appropriatepolicies and incentives to encourage investment to develop geothermal, hydropower aswell as hydrocarbon resource potential.
Strengthen regional cooperation especially in sharing best practices in energydevelopment and utilization
1 All US dollar (USD) values are in constant 2000 prices unless specified

3
1. INTRODUCTION
This section explains the circumstances that resulted to the publication of the ASEAN EnergyOutlook in 2005. Discussion on the preparation of the energy outlook in the ASEAN arosewhen ACE with the assistance of IEEJ started to analyze the energy supply security in theregion.
After this introductory section the methodological framework follows with the basicassumptions of the model coming next. The next section discusses in detail the energy outlookof the ASEAN region with the energy outlooks of individual participating member statesdiscussed in Annex 1. The implications of the outlook outcomes to energy security of the regionare also discussed. The policy recommendation to address the emerging energy security as wellas environmental problems will be presented in the last part of the main body of the report.
1.1. Energy Supply Security Planning in the ASEAN (ESSPA) and Development of theASEAN Outlook Model
On January 1, 1999, ASEAN established the ASEAN Centre for Energy (ACE) as a successorof the 10-year old organization AEEMTRC (ASEAN-EC Energy Management training andResearch Centre) established jointly by the ASEAN and the European Union (EU) in 1988.
As a full-pledge ASEAN body, ACE conducted specific projects on energy in the region. Oneof the activities conducted by ACE was ESSPA. This activity is part of the SOME-METI jointCooperation Program on energy initiated in 2000 and agreed by the ASEAN and Japan SOELeaders during their First SOME-METI Consultation.
This ASEAN-Japan Energy Security Cooperation program was established on the basis of thefollowing:
A stable energy supply is indispensable to economic growth, and oil is and will be a mainplayer in energy.
Future high economic growth will inevitably increase energy use. Though there are someAsian countries which produce oil, Asia as a whole, as well as ASEAN, will rapidlyincrease oil imports from outside Asia. Therefore, securing a stable supply of energy,particularly oil, is important for policy makers in Asia.
Recent trends show a high volatility in the volume and price of oil. The increase of oilimports may aggravate the fragility of the ASEAN economy against oil supply disruptionsand fluctuations in oil price.
Securing a stable trade in oil, in terms of volume and price, is an essential task of thegovernments. There must be mechanisms and infrastructure to cope with this issue.
Japan has experienced two oil shocks, and the Japanese Ministry of Economy, Trade andIndustry (METI), previously Ministry of International Trade and Industry (MITI), has beenformulating and improving its energy policy.
These experiences in Japan may be useful for ASEAN in considering the strengthening ofits energy security by revising the ASEAN Petroleum Sharing Agreement (APSA) and othermeasures such as emergency preparedness and stockpiling.
The scope of the cooperation program covers the following:
Information exchange and seminars for energy policy experts of ASEAN and Japan.
Visits to facilities and study of the mechanisms in Japan by ASEAN energy policy officials.

4
Initiate joint research on how to strengthen energy security in ASEAN, which willcontribute to the revision of APSA, and the establishment of emergency preparedness andnecessary infrastructure such as oil stockpiling.
Recognizing the importance of energy supply security in ASEAN, the Energy Supply SecurityProgram in ASEAN (ESSPA) was then conducted by establishing a working group responsiblefor analyzing energy security in ASEAN with ACE and IEEJ as implementing agencies.Because future energy demand is a key factor for evaluating energy security in ASEAN, ESSPAfocal points decided to develop an ASEAN Energy Demand Model as part of the ESSPAactivities for 2004-2005.
The objectives for conducting the Energy Demand Outlook Model activity for 2004-2005 weretwo folds. First was capacity building to increase and enhance the participating membercountries capability in developing energy demand outlook model based on econometricapproach. Second, the objective was to develop the outlook model of these participatingmember countries in order to forecast their energy demand up to year 2030 and study theimplications in securing future energy supply of ASEAN through comparison between theforecasted energy demand and energy supply planning information.
The Energy Demand Outlook Model was conducted focusing only on the six major ASEANcountries namely Indonesia, Malaysia, Myanmar, Philippines, Thailand and Vietnam. Theoutcome of which was published in 2006 with the title Final Report on the Development ofEnergy Demand Outlook Model for the ASEAN Project.
1.2. The 2nd Energy Demand Outlook Model Project
To update the ASEAN energy demand outlook model of 2005, the ESSPA activities for 2007-2008 focused on the 2nd energy demand outlook model project. The coverage of the secondoutlook demand outlook model expanded to include the remaining four ASEAN membercountries. Thus, Brunei Darussalam, Cambodia, Laos and Singapore joined the modelingactivities in addition to the previous six ASEAN member countries, Indonesia, Malaysia,Myanmar,Philippines, Thailand and Vietnam.
Prior to development of the 2nd ASEAN energy demand outlook model, a pre-meeting wasconducted in Vietnam on 28 February to 1 March 2007. The objective of the pre-meeting was toexplain the works conducted in the initial ASEAN demand outlook mainly to the four newlyparticipating countries and also to share and understand purposes and outcomes of 2nd EnergyDemand Outlook:
Estimate demand by each petroleum product
Collect local energy prices & activity data and apply them for estimation of demandfunction
Collect future national energy plans, such as electricity and gas
Reconstruct power generation module
Incorporate refinery module
Other transformation like GTL, LNG
As in the first ASEAN energy demand model outlook development, the implementation of thisproject was also in phases consisting of training and homework in model development, modelimprovement, model simulation and finally report writing. There were three meetings organizedin 2007 to monitor and evaluate the model development process. These were:

5
a. Kick-off Meeting conducted on 3 - 5 December 2007, in Jakarta, Indonesia.
b. Follow-Up Meeting conducted on 30 January - 1 February 2008 in Bangkok, Thailand
c. Final Meeting conducted on 17-18 March 2008 in Singapore.
Table 1 shows the working schedule for the 2nd Energy Demand Outlook Model Project. Thisreport on the 2nd Energy Demand Outlook of ASEAN is the outcome of the Energy DemandOutlook Model Project.
Table 1 - Work Schedule of the ESSPAEnergy Demand Outlook Model Activities
Month Training Home Work
3-5 December, 2007(Kick-off work meeting)
Import the data into MICOFIT,understand how to use MICROFITand confirm the model structure
December 2007- January2008
Estimate energy demandequations using MICROFIT,complete the model systemand confirm it to IEEJ
End of January 2008(Follow-up work meeting)
Finalize future assumption,understand to use LEAP and completeBAU scenario
February – March 2008 Future simulation of severalscenarios by LEAP andsummarize energy demand to2030
Middle of March 2008(Review work meeting)
Finalization of future energy demandand Extraction of implications
By the end of May 2008 Prepare country report basedon the finalized energyoutlook and the extractedimplications
2. SOCIO-ECONOMIC AND ENERGY SITUATION IN THE ASEAN IN 2005
The Association of Southeast Asian Nations or ASEAN is a regional organization that wasestablished on 8 August 1967 in Bangkok by the five original Member Countries, namely,Indonesia, Malaysia, Philippines, Singapore, and Thailand2. Brunei Darussalam joined on 8January 1984, Vietnam on 28 July 1995, Laos and Myanmar on 23 July 1997, and Cambodia on30 April 1999.
The ASEAN region’s total land area covers 4.33 million square kilometers equivalent to 3.3percent of the world’s land area (bigger than India but is less than half of Brazil). It has a totalpopulation of 552 million in 2005 which is about 8.5 percent of the total world population. TotalGDP was 757 billion USD and per capita GDP among the 10 member states ranged from 260 to26,000 USD during the same period.
2 http://www.aseansec.org/64.htm

6
The region’s economy has experienced a rapid growth during the past two and a half decadeswith GDP growing at an average annual rate of 5.5 percent from 1980 to 2005. The populationgrew at an average rate of 1.7 percent per annum during the same period indicating acorresponding growth in per capita GDP.
Total primary energy consumption in 2005 reached 474 MTOE which grew at an averageannual rate of 4.3 percent from 1990. Per capita primary energy consumption stood at 0.9 TOEper person in 2005 while the region’s primary energy intensity was 627 TOE/million USD.Energy to GDP elasticity from 1990 to 2005 was 0.86 indicating that energy consumption isgrowing at a slower rate than GDP.
The region collectively, exported 74.8 MTOE of coal and 60.7 MTOE of natural gas in 2005. Itused to be a net oil exporter but has become a net importer since 1995 and in 2005, 30 percentof its total oil requirements has to be imported.
The 2nd Energy Demand Outlook for the ASEAN now covers the ten ASEAN member states;i.e.: Brunei Darussalam, Cambodia, Indonesia, Laos, Malaysia, Myanmar, Philippines,Singapore, Thailand and Vietnam.
3. METHODOLOGICAL FRAMEWORK
The energy demand projections of all the member states up to 2030 were estimated using theeconometrics approach wherever possible. Historical energy demand data were taken from theEnergy Balances for Non-Organization for Economic Cooperation and Development (Non-OECD) Countries of the International Energy Agency (IEA). The economic indicators used inenergy modeling such as Gross Domestic Products (GDP) and Gross Value Added (GVA) weretaken from the World Development Indicators Publication of the World Bank. Other socioeconomic data such as numbers of households and vehicles were obtained from national sources.
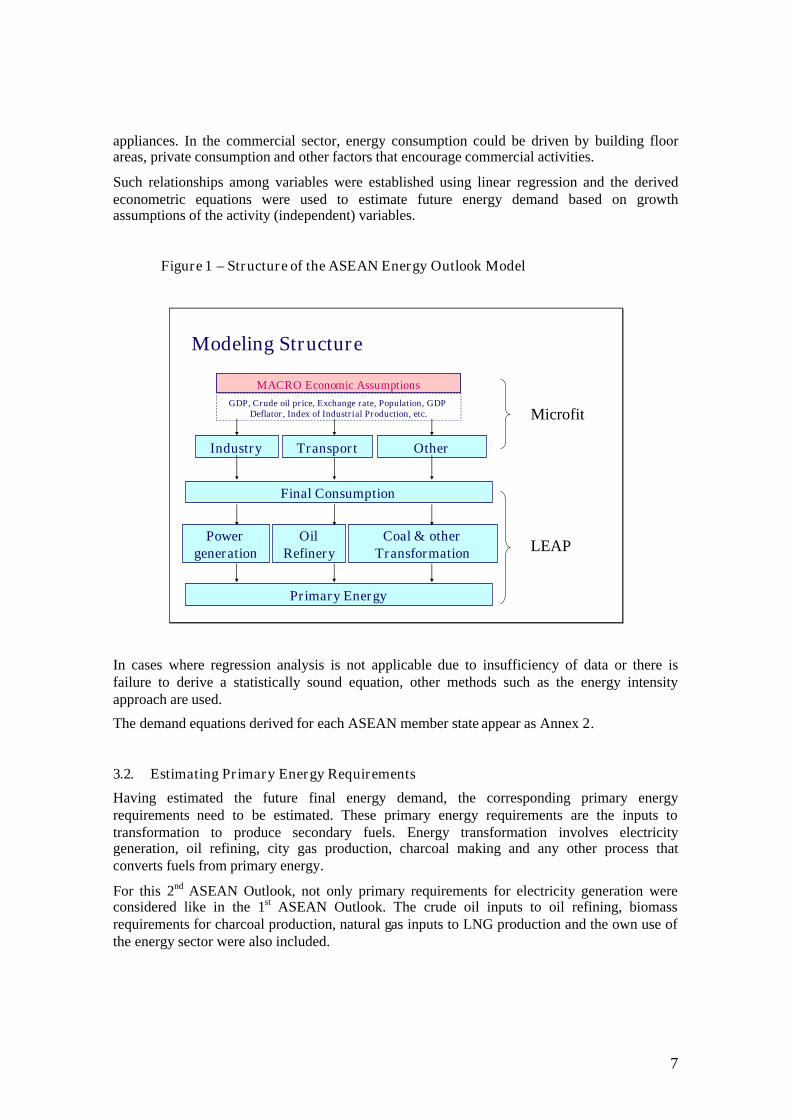
Energy modeling involved the estimation of final energy consumption (FEC) and thecorresponding primary energy requirements or supply. Figure 1 shows the model structure fromfinal energy demand projection and estimation of transformation inputs to arrive at the primaryenergy requirements including the computer software used in the modeling work.
3.1. Forecasting Final Energy Demand
The method applied in forecasting final energy demand as mentioned earlier was theeconometric approach. The historical correlation between energy demand as well asmacroeconomic and activity indicators were derived by regression analysis using Microfit3.
The future energy demand for various energy sources were estimated using assumed values ofthe macro-economic and activity indicators. Future values of these indicators were also derivedusing historical data depending on the sufficiency for such analysis.
In the model structure, energy demand is modeled as a function of activity such as income,industrial production, number of vehicles, number of households, number of appliances, floorarea of buildings and etc. In the residential sector for example, the demand for electricity couldbe a function of number of households, disposable income and penetration rate of electrical
3 Microfit is a computer program that offers an extensive choice of data analysis options. It is a versatileaid in evaluating and designing of advanced univariate and multivariate time series models. It is aninteractive, menu-driven program with a host of facilities for estimating and testing equations, forecasting,data processing, file management, and graphic display.
7
appliances. In the commercial sector, energy consumption could be driven by building floorareas, private consumption and other factors that encourage commercial activities.
Such relationships among variables were established using linear regression and the derivedeconometric equations were used to estimate future energy demand based on growthassumptions of the activity (independent) variables.
Figure 1 – Structure of the ASEAN Energy Outlook Model
Modeling Structure
MACRO Economic Assumptions
Industry
Primary Energy
GDP, Crude oil price, Exchange rate, Population, GDPDeflator, Index of Industrial Production, etc.
Transport Other
Final Consumption
Powergeneration
OilRefinery
Coal & otherTransformation
Microfit
LEAP
In cases where regression analysis is not applicable due to insufficiency of data or there isfailure to derive a statistically sound equation, other methods such as the energy intensityapproach are used.
The demand equations derived for each ASEAN member state appear as Annex 2.
3.2. Estimating Primary Energy Requirements
Having estimated the future final energy demand, the corresponding primary energyrequirements need to be estimated. These primary energy requirements are the inputs totransformation to produce secondary fuels. Energy transformation involves electricitygeneration, oil refining, city gas production, charcoal making and any other process thatconverts fuels from primary energy.
For this 2nd ASEAN Outlook, not only primary requirements for electricity generation wereconsidered like in the 1st ASEAN Outlook. The crude oil inputs to oil refining, biomassrequirements for charcoal production, natural gas inputs to LNG production and the own use ofthe energy sector were also included.

8
The Long-range Energy Alternatives Planning System (LEAP)4 is used to estimate primaryenergy consumption and produce the energy balance tables.
3.2.1. Electricity Generation
Electricity can be produced using various technologies and fuels. In ASEAN, the most commonsource of electricity is oil power plants which exist in all of the 10 member states. The nextmost common source is hydroelectric power plants followed by natural gas and coal powerplants. Geothermal power plants also exist in 3 member states and there is also an increasingcapacity of wind and solar photovoltaic power plants. Biomass-powered plants also exist inThailand
Electricity generation requires fuels to produce outputs and this section covers how these fuelsare calculated. The calculation of the primary energy requirements for electricity generationinvolves the following steps:
Estimating total electricity generation requirements
The total electricity generation requirement is greater than the final electricity demand tocover the electricity consumption in the power stations and the expected losses in thetransmission and distribution systems. The additional requirement among ASEAN memberstates is generally above 10 percent of the total final demand.
Estimating electricity generation capacity requirements
This involves two processes. First is estimating total capacity requirements which is thecapacity needed to meet the peak demand. The total capacity requirement is the peakdemand plus the assumed reserve margin which is a percentage of the peak demand.Reserve margin is the preferred amount of available capacity above the peak demand inorder for the electrical system to ensure that there is no or minimal disruption in the supply.
The second process is determining the power plants that should be added when the totalcapacity of the existing power plants cannot meet the peak demand. In five of the ASEANcountries, it is assumed that power plants for the base load should be coal-fired power plantsin view of its relatively low operating costs. For intermediate and peak loads, it is assumedthat these will be met by natural gas power plants. Myanmar is one of the exceptions inview of its government policy of developing the vast hydroelectric potential of the country.Viet Nam, Lao PDR and Cambodia are also developing a sizeable amount of their hydroresources. In Brunei Darussalam and Singapore, future electricity demand will be met bynatural gas power plants. Oil power plants are considered only in isolated areas that cannotbe connected economically to the electricity grids.
There is no strict criterion for determining the amount of coal and natural gas additions inview of the flexibility of the CCGT technology which could be used to supply theintermediate and peak requirements.
Estimating generation by each type of power plant
Generation by individual types of power plants is assumed to follow the order of ascendingoperating costs. That is, the power plant with cheapest operating cost are made to generateat maximum available capacity before the next cheapest power plant is made to produceelectricity. This order is followed until the generation requirement is met. In this case,
4 LEAP or the Long-range Energy Alternatives Planning System is an energy policy analysis and climatechange mitigation assessment software developed at the Stockholm Environment Institute. For moreinformation see: http://www.energycommunity.org/default.asp?action=47

9
hydroelectric, wind and geothermal power plants which have zero marginal costs areassumed to operate first before nuclear, coal, natural gas and oil power plants.
The operating cost is derived from the formula below:
i
iii Efficiency
CostFuelCostMOVariableCostOperating
__&__ ,
where i are the types of power plants
Estimating fuel inputs
Finally, the information of electricity generation together with conversion efficiencyvariables or the thermal efficiencies are used to calculate the input fuels required by powerplant for the amount of calculated output. This can be derived from the simple formulabelow:
i
ii Efficiency
GenerationyElectricitInputFuel
__
3.2.2. Oil Refining and other Transformation
In oil refining, the amount of crude oil and other inputs is calculated from capacity, capacityutilization, efficiency information and auxiliary fuels. Auxiliary fuels are the fuels needed forthe operation of the refinery. The estimation of primary energy requirements for othertransformation uses the same information as those in oil refining.
3.3. Projection Scenarios
Two scenarios were forecasted in the modeling work as follows:
The first scenario which was agreed upon by the members of the ASEAN technicalworking group is identified as the Reference scenario or the base case scenario. Thescenario used historical trends (1980 to 2000) of GDP, GVA, population, number ofvehicles in forecasting their future values. It is assumed that the future growth trends wouldfollow the historical development paths.
The other scenario is the High GDP Growth scenario, which will be known as Highscenario from this point onwards. In this scenario, the growth rates of GDP were takenfrom the official targets of each of the 10 ASEAN member states, which incidentally arehigher that the growth rates in the Reference scenario.
4. FORECAST ASSUMPTIONS
4.1. GDP Growth
The GDP growth assumptions for the Reference scenario were derived by IEEJ and weresuggested to the working group during the second working meeting in January 2008 in Bangkok.Table 2 shows these GDP Growth assumptions. These growth rates are basically derived fromlong-term trends obtained from historical data.

10
As mentioned above, the assumptions for the High GDP growth scenario were collected by theworking group members from their respective countries and are these shown in Table 3. Most ofthese growth rates are economic growth targets of ASEAN member states.
Table 2 – AverageAnnual GDP Growth Assumptions, Reference Scenario, inPercent
2005-2010 2010-2020 2020-2030 2005-2030Brunei Darussalam 4.2 3.8 3.5 3.8Cambodia 7.5 5.3 4.3 5.3Indonesia 6.0 4.5 4.0 4.6Lao PDR 7.5 5.3 4.3 5.3Malaysia 5.4 4.4 4.2 4.5Myanmar 7.5 5.3 4.3 5.3Philippines 5.5 4.7 4.0 4.6Singapore 4.7 3.7 3.9 4.0Thailand 4.8 4.8 4.6 4.7Vietnam 7.0 6.5 6.0 6.4ASEAN 5.5 5.1 4.5 4.9
Source: EDMC/IEEJ.
Table 3 –AverageAnnual GDP Growth Assumptions, High Scenario, in Percent
2005-2010 2010-2020 2020-2030 2005-2030Brunei Darussalam 5.2 4.8 4.5 4.8Cambodia 10.4 7.0 6.7 7.6Indonesia 6.5 6.5 6.5 6.5Lao PDR 7.2 7.5 7.4 7.4Malaysia 5.5 6.0 5.0 5.5Myanmar 7.1 13.1 9.8 10.6Philippines 5.8 6.3 6.0 6.1Singapore 5.5 5.0 4.8 5.0Thailand 6.2 5.8 5.3 5.7Vietnam 9.9 9.6 9.8 9.8ASEAN 6.2 6.4 6.1 6.2
Sources: EDMC/IEEJ, National Project Teams
4.2. Population Growth Rates
Population growth assumptions are obtained from the United Nations Department of Economicand social Affairs, Population Division Homepage5. From Table 4 below, there is a wide rangeof growth projections from 0.4 percent per annum in Thailand to 2.4 percent per annum inBrunei Darussalam.
5 http://esa.un.org/unpp

11
Table 4 – AverageAnnual Population Growth Assumptions, in Percent
2005-2010 2010-2020 2020-2030 2005-2030Brunei Darussalam 2.1 1.7 1.3 1.6Cambodia 1.1 1.0 0.8 0.9Indonesia 1.2 0.9 0.6 0.9Lao PDR 1.1 1.0 0.8 0.9Malaysia 1.7 1.4 1.0 1.3Myanmar 1.1 1.0 0.8 0.9Philippines 1.9 1.6 1.2 1.5Singapore 1.9 1.6 1.2 1.5Thailand 0.6 0.4 0.2 0.4Vietnam 1.3 1.1 0.8 1.1ASEAN 1.2 1.0 0.7 0.7
Source: UN Department of Economic and Social Affairs, Population Division
4.3. Crude Oil Price Assumptions
Nominal crude oil price, which is based on Japan CIF (includes cost of insurance and freight) isprojected to increase gradually from 53.8 US$/barrel in 2005 to 112.6 US$/barrel in 2030.
From these assumptions, the nominal domestic prices are calculated using exchange rates.These prices are converted to constant prices using GDP Deflators.
Figure 2 – Nominal Oil Price Assumption
0
20
40
60
80
100
120
2002
2004
2006
2008
2010
2012
2014
2016
2018
2020
2022
2024
2026
2028
2030
$/b
arre
l(n
om
ina
l)
Source: EDMC/IEEJ.

12
5. ENERGY DEMAND AND CO2 EMISSION OUTLOOK
5.1. Final Energy Consumption
The total ASEAN final energy consumption increased to 343 MTOE in 2005 growing at anaverage annual growth rate of 4.2 percent over the 1990 to 2005 period. On a sectoral basis, thetransport sector contributed around 19.5 percent of the total ASEAN demand in 1990 while theindustry and the other sectors contributed 22.4 percent and 53.8 percent respectively. From thento 2005, the transport and industrial demand had been growing rapidly almost at the same rate.Industry grew at a slightly faster average annual growth rate of 6.4 percent per year while thetransport demand growth was 6.2 percent per year. The rapid growth of these sectors resulted inan increase of their shares in the total ASEAN demand to 25.8 percent and 30.4 percentrespectively in 2005. The consumption of the other sectors, which comprise of commercial,residential and agricultural sub-sectors, grew the slowest at 2.3 percent per annum, reducing itsshare in the total demand to 40.6 percent from 53.8 percent in 1990.
Figure 3 – Projected Final Energy Consumption in ASEAN by Sector
0
200
400
600
800
1,000
1,200
Mto
e
Others 107 150 209 220 274 317
Trans po rt 36 88 191 218 305 394
Indus try 41 104 208 231 322 412
1990 20052020
Reference2020 High
2030Reference
2030 High
Non-energy use accounted only around 4.3 percent of the total ASEAN final energyconsumption in 1990 and its share decreased to 3.3 percent in 2005. The average annual growthof energy consumption as feedstock was 2.4 percent over the 1990 to 2005 period.
5.1.1. Reference Scenario
For the future, under the Reference scenario, the total final energy consumption of the ASEANis projected to grow at a slower annual rate of 3.9 percent from 2005 to 2030. The transportsector consumption will grow the fastest during the period with annual growth projected at 5.1percent driven by the increasing per capita income. The industrial sector consumption will

13
grow at 4.6 percent and other sectors which include residential, commercial and agriculturalsectors will have an average annual growth of 2.4 percent. Non-energy consumption will growat an average rate of 2.9 percent per annum.
Figure 4 – Final Energy Consumption in ASEAN by Fuel Type
0
200
400
600
800
1,000
1,200
Mto
e
Others 89 109 114 114 113 112
Heat 0 0 0 0 0 0
Electrici ty 11 38 94 108 164 214
Natural gas 8 21 46 50 70 87
Oil 71 152 292 328 454 573
Coal 4 24 60 69 100 136
1990 20052020
Re ference2020 High
2030Reference
2030 High
Among the types of energy, electricity will grow the fastest, at 6.1 percent per annum in view ofthe projected growth in industrial GDP. This result corresponds to the result in the first ASEANoutlook published in 2005. Electricity share to the total will consequently increase from 11.0percent in 2005 to 18.2 percent by 2030. Coal will have the second highest growth rate of 5.9percent per annum. Its share will increase from 6.9 percent in 2005 to 11.1 percent in 2030.Natural gas consumption will be growing at a slower average rate of 5.0 percent per annum overthe 2005 to 2030 period.
Oil will remain as the most used fuel and is projected to grow at 4.5 percent per annum over theforecast period. Its share to the total consumption mix will also increase from 44.4 percent in2005 to 50.4 percent in 2030. This is driven by the rapid growth in consumption of thetransport sector, which is largely fuelled by oil products.
Consumption of other fuels, which are mostly biomass, will increase at an average annual rateof 0.2 percent resulting to a decreased share to the total consumption from 31.7 percent in 2005to 12.5 percent in 2030.
5.1.2. High Scenario
In the High scenario, final energy consumption will grow at a faster annual rate of 4.9 percentdriven by the transportation sector consumption, which will grow by 6.2 percent per annum.Those of the industrial and other sectors will have annual growth rates of 5.7 percent and 3.0percent, respectively.

14
As in the Reference scenario, oil share will increase reaching 51.1 percent in 2030. This is dueto faster growth rate of the transport sector demand compared to the Reference scenario.
Final consumption of electricity will however post the highest growth rate at 7.2 percent. Itsshare will subsequently increase from 11.0 percent in 2005 to 19.1 percent in 2030. Likewise,coal share will increase from 6.9 percent in 2005 to 12.1 percent brought about by the growth inconsumption of 7.2 percent annually.
Consumption of biomass which is largely used in the residential sector in rural areas is projectedto grow at a very slow rate of 0.1 percent per annum. Consequently, its share to the total finalenergy consumption will decline from 31.7 percent in 2005 to 10.0 percent in 2030. This wouldbe made possible by fuel switching to more convenient fuels such as LPG for cooking as percapita income increases.
5.2. Primary Energy Supply
Historically, the total primary energy supply in the ASEAN increased from 251 MTOE in 1990to 474 MTOE in 2005. This is an average increase of 4.3 percent per annum. Indonesia has thelargest share, amounting to 41 percent of the total primary energy requirement in 1990 butdecreasing to 38 percent in 2005. This decreased share of Indonesia’s primary energy supply isdue to the rapid increase of the requirement of Singapore and Thailand that grew at similaraverage annual rates of 5.6 percent and Malaysia at 5.4 percent.
Coal supply grew the fastest during the same period at 10.6 percent per annum due to the rapidgrowth in the consumption of the industrial sector and the construction of coal-fired powerplants. Gas supply grew at a slower rate of 7.0 percent per annum which is largely due to thecoming-on-stream of natural gas power plants in Malaysia, the Philippines, Singapore andThailand
5.2.1. Reference Scenario
The primary energy requirements in the ASEAN will grow at an annual rate of 4.0 percent from474 MTOE in 2005 to 1252 MTOE in 2030. Among the energy sources, coal will have thehighest annual growth rate of 6.9 percent per annum due to the increasing demand for fuel forelectricity generation and the industrial sector. From 56 MTOE in 2005, primary coal supplywill increase to 297 MTOE in 2030.
Oil supply, in view of the fast growth rate of the transport sector will grow by 4.0 percentannually. Gas will have a similar annual growth rate of 4.0 percent. Gas for power generationwill comprise 67 percent of the total gas requirements in 2030. Its share to the total primaryenergy mix will remain at 19.2 percent in 2030.
Hydropower share in the total primary energy supply in ASEAN is small, only 1.0 percent in2005. The growth of hydropower however, will be significant at 5.4 percent per annum over the2005 to 2030 period. This is due to the plan for aggressive development of hydroelectricpotential in the Great Mekong Sub-region. Among the states in this sub-region, Cambodia willhave the fastest growth of hydropower supply at almost 12.6 percent per annum followed byLao PDR at 11.0 percent per annum. Hydropower development in Lao PDR is due largely to theplanned increase in electricity exports mainly to Thailand. For Myanmar, electricity is mainlyhydropower based (almost 100%). The hydropower supply in Myanmar will experience fastgrowth at an average rate of 9.2 percent per annum as the state also plans to export excesselectricity generation in the future. Vietnam electricity generation from hydropower will grow atan average annual rate of 5.8 percent and will account for at least 25 percent of the country’s

15
total power generation in 2030. From outside of the sub-region, Malaysia, with its Bakunhydropower development will increase its hydropower supply at an average growth of 4.7percent per annum.
Philippines and Indonesia are the two countries in ASEAN having geothermal resources forpower generation. The share of geothermal energy to total requirement in the region is 3 percent.This is projected to grow at an average growth of 3.9 percent per annum from 2005 to 2030. Itsshare to the total will however remain at the same level as in 2005.
Indonesia, the Philippines and Vietnam plan to construct nuclear power plants to meet demandfor electricity from 2020 onwards. As a result, nuclear energy could take a 1.6 percent share ofthe total ASEAN primary energy supply in 2030.
Other energy will have a slower growth rate of 0.2 percent per annum. This covers mostlybiomass that is used by the final sector, supply of other renewables such as bio-fuels, wind,solar, etc.
Figure 5 – Primary Energy Requirements in ASEAN
0
200
400
600
800
1,000
1,200
1,400
1,600
1,800
Mto
e
Others 101 114 123 122 120 117
Geothermal 6 14 37 37 37 37
Hydro 3 5 17 18 18 22
Nuclear 0 0 7 7 20 19
Natural gas 33 91 149 169 240 307
Oil 97 194 348 383 520 639
Coal 12 56 162 189 297 405
1990 20052020
Reference2020 High
2030Re ference
2030 High
5.2.2. High Scenario
In the High scenario, total energy requirement will reach 1,548 in 2030, 23.6 percent higherthan in the Reference scenario. Coal supply will exhibit the fastest growth at 8.3 percent perannum in view of the more rapid increase in the requirements for electricity generation in thisscenario. Natural gas will grow at 5.0 percent per annum almost similar to the growth of the oilrequirements (4.9 percent per annum).
Hydropower will grow at 6.2 percent per annum. Its share to total primary energy requirementwill increase to 1.5 percent, similar to that of the Reference scenario. Other fuels will be

16
growing at a slightly lower rate of 0.1 percent as compared to its growth rate in the Referencescenario as higher per capita GDP in this scenario is expected to result to lower consumption ofbiomass in the households.
5.3. Power Generation
Electricity production increased from 155 TWh in 1990 to 509 TWh in 2005. This is equivalentto an average annual growth rate of 8.3 percent over the same period. In the future, electricityproduction is projected to increase to 2,234 TWh in the Reference scenario and 2,923 TWh inthe High scenario or at average annual growth rates of 6.1 percent and 7.2 percent, respectively.
Both gas and coal will continue to form the bulk of the supply for power generation in theReference and High scenarios. Coal share will reach 40.8 percent in the Reference scenario and42.8 percent in the High scenario by 2030. Natural gas share will be 41.5 percent in theReference scenario and 42.1 percent in the High scenario.
Table 5 - Electricity Production in ASEAN (Reference and High Scenarios), in TWh
By TYPE 1990 20052030
(Reference)2030
(High)Thermal 119 431 1,888 2,530Nuclear 0 0 75 74Hydro 29 58 213 262Geothermal 7 17 43 43Other 0 3 15 15Total 155 509 2,234 2,923
Oil share will decrease significantly from 14.4 percent in 2005 to 2.1 percent by 2030 in theReference scenario and 1.6 percent in the High scenario. This indicates that the role of oil inpower generation will become minimal due to the diversification program for alternative fuelsin most of the ASEAN member states. In addition, the renewable portfolio standardimplemented in some ASEAN states recently has also reduced the role of oil in powergeneration.
Hydropower will grow at an average annual growth rate of 5.4 percent in the Reference scenarioand 6.2 percent in the High scenario. Geothermal will also grow but at a slower pace of 3.9percent due mainly to resource constraint.
In regards to fuel inputs for power generation, oil formed the bulk of supply in 1990 at 55.6percent. In 2005, natural gas became the main fuel input for power generation in the region at50.6 percent. Oil was reduced to 16.9 percent of the total while coal increased from 23.6 percentin 1990 to 32.5 percent in 2005.
Coal and natural gas are expected to continue to dominate the future fuel mix for powergeneration. In the Reference scenario, coal share will increase to 53.7 percent while gas sharewill be 43.5 percent in 2030. In the High scenario, coal share will be 55.1 percent while that ofgas will be 42.8 percent.
In view of the increasing utilization of coal and natural gas which could be used in new andmore efficient technologies for power generation, thermal efficiency of the region is expected toincrease from 38 percent in 2005 to 44 percent in 2030 for both the Reference and Highscenarios.

17
Table 6 - Fuel Inputs to Power Generation in ASEAN, in MTOE
1990 20052030
(Reference)2030
(High)Coal 7 32 197 270Oil 17 17 10 10Gas 6 50 160 209ThermalEfficiency 33% 38 % 44 % 44 %
5.4. CO2 Emission Outlook
The 4.0 percent annual growth in primary energy consumption in the Reference scenario willresult to a corresponding 5.1 percent growth in CO2 emission. This is due largely to theprojected 6.9 percent annual escalation of coal consumption which is the most carbon-intensivefossil fuel. The similar 4.0 percent annual growth rates in oil and natural gas consumption willalso contribute to this increasing emission.
Figure 6 – CO2 Emission in the Reference and High Scenarios, in Mt-C
0
200
400
600
800
1,000
1,200
2005
2007
2009
2011
2013
2015
2017
2019
2021
2023
2025
2027
2029M
illi
on
Met
ric
Ton
so
fCar
bo
nE
quiv
alen
t(M
t-C)
High Scena rio Reference Scena rio
In the High scenario, CO2 emission will have a faster annual growth rate of 6.2 percent. This isdue to the projected 8.3 percent annual growth in coal consumption and the 5.0 percent and 4.9percent annual growth of natural gas and oil consumption, respectively.
18
6. IMPLICATIONS AND POLICY RECOMMENDATIONS
6.1. Implications
Primary energy consumption in ASEAN will increase significantly from 2.6 times in theReference scenario to 3.3 times in the High scenario. Whichever scenario materializesin the future, there will be increasing pressure on energy security and to globalenvironmental stability.
Likewise, oil consumption in the region will also increase to around triple from 194MTOE in 2005 to 520 MTOE by 2030 in the Reference scenario and possibly to 639MTOE in the High scenario. Being a net importer of oil, the region is becomingincreasingly vulnerable to various supply disruptions in the oil market.
Although the region is still a net exporter of natural gas, its consumption of the fuel willincrease from 91 MTOE in 2005 to 240 MTOE in 2030 in the Reference scenario andpossibly to 307 MTOE in the High scenario. If current production levels in the regiondo not increase, the region will have to source out this additional demand from outsidethe region.
Coal consumption will also significantly increase from 56 MTOE in 2005 to 297 MTOEby 2030 in the Reference scenario and possibly to 405 MTOE in the High scenario.This increasing consumption will have a corresponding increase in CO2 emission whichis said to contribute to global warming.
6.2. Policy Recommendations
The increasing demand for energy and the resultant increase in CO2 emission needsserious attention from policy makers in the region. Such policies would includemeasures on the following:
Utilization of CDM to mitigate climate change
Diversification of the energy mix to reduce overdependence on certain energysources and increase utilization of indigenous energy, such as low-grade coal, todecrease dependence on imported energy.
Promotion of technology transfer and development on clean coal technologyfrom the developed world and encourage R&D in renewable energy, energyefficient and clean technologies as well as alternative fuels.
Promotion of more aggressive energy efficiency and conservation byencouraging modal shift in the transportation sector, use more efficienttechnologies to reduce consumption of biomass and intensify energy efficiencyand conservation program in the short- and long-terms across all sectors.
Acceleration of development of clean energy such as renewables and alternativeenergy by encouraging the use of alternative fuels from biomass, enhancingrenewable energy to replace oil consumption in the final sector, increasingrenewable energy and attain a more balanced mix in electricity generation,utilizing alternative fuels such as CNG in the transportation sector and

19
formulating policies to promote the utilization of renewables, alternative fuelsand nuclear energy.
Creating an energy investment climate that is conducive to investors byformulating appropriate policies and incentives to encourage investment todevelop geothermal, hydropower and hydrocarbon resource potential as well asnuclear energy.
Strengthening regional cooperation especially in sharing best practices in energydevelopment and utilization
The foregoing implications are big hurdles but they also offer a lot of opportunities suchas: technological advancement to improve energy efficiency in the demand and supplysides, technology transfer from the developed to less developed countries, possibleimprovement of investment regimes in each ASEAN member states and increased flowof foreign investments for energy resource development and electricity generation.
Likewise, as these implications are common to all member states, collaborative actionsto address these issues would deepen the ties among the member states.

20

21
ANNEX 1: Country Reports

22

23
BRUNEI DARUSSALAM
1. BACKGROUND
Brunei Darussalam is situated on the northwest end of the Island of Borneo in South East Asia,covering a total land area of 5,765 square kilometers. The population of Brunei Darussalam in2005 stood at 370,100 registering an increase of 2.9 percent from 2004.
Brunei Darussalam has one of the highest per capita incomes among the countries in the Asia-Pacific region owing mainly to its significant natural gas and oil resources. The economicactivity in the country is dominated by oil and gas sector production. The share of these tworesources alone accounted for 66 percent of GDP in 2005. Brunei Darussalam’s economicgrowth rate was 3 percent in 2005 compared with 1.7 percent in 2004. The rate of inflation asmeasured by the consumer price index (CPI) rose by 1.1 percent in 2005 compared with 0.9percent in 2004. The higher rate in 2005 was mainly a reflection of the increase in transportationcost.
2. ENERGY DEMAND AND CO2 EMISSION OUTLOOK
2.1. Final Energy Consumption
In 2005, Brunei Darussalam’s total final energy consumption (TFEC) was 719 KTOE. Thetransport sector was the largest consumer accounting for 56.2 percent (404 KTOE) of TFEC.This is followed by the residential/commercial with 32.8 percent (236 KTOE). BruneiDarussalam’s industry sector accounted for 11.0 percent (79 KTOE) of TFEC.
Taking into account the socio-economic assumptions which were previously set accordingly, wehave simulated the two scenarios i.e. reference case and high growth case using the LEAPmodel. As such the following shows the summarized results based on the assumptions.
2.1.1. Reference Scenario
In the reference scenario, Brunei Darussalam’s total final energy consumption is projected togrow at an average annual growth rate of 3.8 percent from 2005 to 2030. This escalation isexpected to be contributed mainly by Brunei Darussalam’s transport sector as well as the othersectors, which comprise of the combined sectors of residential/commercial and agriculture. Bothof these sectors are projected to increase at an average annual growth rate of 3.9 percent untilthe end of the planning period. These are driven by the increasing economic growth in view ofthe nation’s aspiration to further its development.
The industrial sector final energy consumption shall reflect a 2.3 percent annual growth rateduring the projected period. This reflects the anticipated development of Brunei Darussalam’spetrochemical industries in particular, in the future. This is an effort of the Government ofBrunei Darussalam to make full use of its oil and gas resources and further expand its economy.
Among the types of energy, it is expected that oil and electricity will remain as the two mainenergy types during the projection period.

24
Figure 7 – Final Energy Consumption by Sector to 2030
0
500
1,000
1,500
2,000
2,500kt
oe
Others 101 236 425 491 620 787
Transport 226 404 714 830 1,044 1,351
Indus try 60 79 105 119 141 179
1990 20052020
Reference2020 High
2030Reference
2030 High
Figure 8 – Final Energy Consumption by Fuel Type to 2030
0
500
1,000
1,500
2,000
2,500
ktoe
Others 0 0 0 0 0 0
Heat 0 0 0 0 0 0
Electricity 87 234 428 500 633 820
Natural gas 0 0 0 0 0 0
Oil 300 485 816 940 1,172 1,497
Coa l 0 0 0 0 0 0
1990 20052020
Reference2020 High
2030Reference
2030 High
Oil will account for approximately 65 percent of the future energy source for TFEC, thusmaintaining the largest share for fuel usage. It is projected that the average annual growth rate

25
will be around 3.6 percent. Electricity however, will account for the remaining 35 percent oftotal energy source. Although it reflects the smaller share, it is foreseen to have the fastergrowth rate of 4.1 percent. All this growth is a result of the process of urbanization and also inview of emerging commercial and industrial activities in the future.
2.1.2. High GDP Growth Scenario
In the High GDP Growth scenario (High scenario from this point onwards), the total finalenergy consumption is expected to grow at a faster annual rate of 4.8 percent as compared to theReference scenario. This is expected to be driven mainly by the transport sector as well as theresidential/commercial and agriculture sector which will grow at identical average annualgrowth rates of 4.9 percent. The industrial sector energy consumption is expected to grow at anannual rate of 3.3 percent.
Among the types of fuels, oil is expected to remain as the most used fuel and is projected togrow at an annual average rate of 4.6 percent. Its share of the TFEC will however decreasefrom 67.5 percent in 2005 to 64.6 percent in 2030. This is because electricity’s share of theenergy mix will increase from 32.5 percent in 2005 to 35.4 percent in 2030, which will begrowing at a much faster annual growth rate of 5.1 percent.
2.2. Primary Energy Consumption
In 2005, Brunei Darussalam’s primary energy requirements were around 2,435 KTOE, with oiland gas as its only energy sources. Natural gas accounted for the highest percentage share of thetotal final energy requirement with 75.6 percent with the remaining having been supplied by oil.
In general, Brunei Darussalam uses around 20 percent of its gas production for its domestic usewhilst the remaining 80 percent is exported as liquefied natural gas. Whereas oil produced aremostly exported. Only a small percentage (around 6 percent of the daily production) is refinedin Brunei Darussalam. The petroleum products are mostly used in its transport sector, whereautomobiles (cars) are the main mode of transportation.
2.2.1. Reference Scenario
From 2005 to 2030, oil and natural gas are projected to remain as Brunei Darussalam’s primaryenergy sources. Primary energy requirement will increase to 4,165 KTOE in 2030 at an averagegrowth rate of 2.2 percent per annum between 2005 and 2030.
Oil is projected to grow faster with an annual growth rate of 4.0 percent per annum driven bythe transport sector. Oil share in the total energy requirements will also increase from 24.4percent in 2005 to 38.2 percent in 2030.
Natural gas will remain as the main source for primary energy requirement increasing from1,840 KTOE in 2005 and 2,575 KTOE in 2030 despite of its reducing share in the total primaryenergy requirements. Natural gas held 75.6 percent of the total primary energy requirementshare in 2005 and projected to contribute a lower 61.8 percent of the total mix in 2030.
2.2.2. High Scenario
Increase in the GDP growth will cause the total primary energy requirement to grow more thandouble in 2030 from 2,435 KTOE in 2005 with an annual average growth of 3.1 percent. Oilwill grow at a more rapid rate throughout the projection period with an average growth of 5.2

26
percent per year from 2005 to 2030. Similar to the Reference scenario, natural gas share in thetotal primary energy requirement mix is projected to decline from 75.6 percent in 2005 to 59.6percent in 2030, as a result of a lower 2.1% annual growth rate.
Figure 9 - Primary Energy Consumption by Energy Type
0
1,000
2,000
3,000
4,000
5,000
6,000
ktoe
Others 0 0 0 0 0 0
Hydro 0 0 0 0 0 0
Nuclear 0 0 0 0 0 0
Natural gas 1,676 1,840 2,208 2,442 2,575 3,089
Oil 122 595 1,050 1,238 1,590 2,093
Coa l 0 0 0 0 0 0
1990 20052020
Reference2020 High
2030Reference
2030 High
2.3. Power Generation
Electricity production was at 2,907 GWh in 2005 and is projected to increase to about 7,867GWh in the Reference scenario and 10,185 GWh in the High scenario.
Table 7 – Projected Electricity Production to 2030, in GWh
By Type 2005 2030 (Reference) 2030 (High)
Natural Gas 2,890 7,845 10,156
Oil 17 22 29
Total 2,907 7,867 10,185
Power generation in Brunei Darussalam is almost solely being sourced from natural gas as fueland is projected to remain as the only major fuel input to power generation in Brunei until 2030.
In view of the installation of more efficient technologies for electricity generation, thermalefficiency of Brunei is expected to increase from 25.5 percent in 2005 to 40 percent in 2030 forboth the Reference and High scenarios.

27
Table 8 – Fuel Inputs for Power Generation to 2030, in KTOE
By Type 2005 2030 (Reference) 2030 (High)
Natural Gas 976 1,686 2,183
Oil 4 5 7
Total 980 1,691 2,190
2.4. CO2 Emissions
In 2005 Brunei Darussalam’s CO2 emissions reached 1,392 thousand tons of Carbon equivalent(kt-C), 30.6 percent of which were derived from oil-based fuels while the remaining 69.4percent were from natural gas. Based on the estimated demand growth for these fuels, CO2
emissions will increase at an average annual rate of 2.5 percent. This growth rate is higher thanthe growth of primary energy consumption of 2.2 percent. The reason for this disparity ingrowth is the faster growth of oil consumption which has higher carbon content than natural gas.
In the High scenario, CO2 emission will increase at a faster rate of 3.4 percent faster than thegrowth rate of primary energy consumption of 3.1 percent. Again, this is attributed to the fastergrowth rate of oil consumption.
Figure 10 - CO2 Emissions in the Reference and High Growth Scenarios
0
500
1000
1500
2000
2500
3000
3500
200
5
200
7
200
9
201
1
201
3
201
5
201
7
201
9
202
1
202
3
202
5
202
7
202
9
Th
ous
and
Met
ric
To
ns
ofC
arb
on
Eq
uiv
ale
nt(k
t-C
)
High Scena rio Reference Scenario

28
3. FINDINGS AND POLICY IMPLICATIONS
The total final energy consumption in Brunei Darussalam is expected to grow at a faster rate of3.8 percent compared to its final energy requirement that will grow at 2.2 percent from 2005 to2030 in the reference scenario. Natural gas will remain as the main source of fuel for finalenergy requirement throughout the projection period, whereas for final energy consumption oilwill continue to be the main source of energy. The purely oil-based transport sector is thecurrent largest consumer in Brunei Darussalam and this is projected to grow at an annual rate of3.9 percent. Electricity generation will grow at 4.1 percent per annum with natural gas as its solesource of fuel.
Thus with the projected increase in final energy consumption, there is an urgency for BruneiDarussalam to reduce its final energy consumption. Various efforts have already been put inmotion such as adopting energy efficiency and conservation (EEC) techniques and technologieswithin the nation. Having only oil and natural gas for its main sources for energy, it is alsoimperative for Brunei Darussalam to diversify its energy sources to alternative and renewableenergy resources not only for final energy requirement, but also for its electricity generation.Diversification of its energy mix would result in a less dependent energy sector on the currentfossil fuels and an enhanced energy security for the country. As Brunei Darussalam is highlydependent on oil-based automobile for transportation, a shift in mode of transportation to a lessenergy intensive mode would help reduce the nation’s consumption in the transport sector.

29
CAMBODIA
1. BACKGROUND
The Kingdom of Cambodia is located in the tropical region of Southeast Asia’s Lower Mekongregion. It has 800 km border with Thailand in the west, 450 km with Lao PDR in the north,1,250 km with Viet Nam in the east and a coastline of 440 km long in the south. The physicallandscape is dominated by the lowland plains around the Mekong River and the Tonle Sap Lake.Of the country’s total land area 181,035 km2, approximately 49 percent remains covered byforest. There are about 2.5 million hectares of arable land and over 0.5 million hectares ofpasture land.
The GDP recorded a growth rate of 8.4 percent in 2000, and in 2004 and 2005, growth rateswere recorded at 10.0 percent and 13.4 percent, respectively. Investments are financedpredominantly from foreign sources, which accounts for 21.6 % of GDP. More than half ofthem are made up by grants, with the remaining parts consisting of Foreign Direct Investmentand soft loans. Public investment grew by 5.2 %, with national budget and funding from theWorld Bank, Asian Development Bank (ADB), and assistance from other countries focusing onpriority areas including agriculture, rural development, education, health care, and physicalinfrastructure. The Royal Government of Cambodia (RGC) considers the private sector, bothdomestic and foreign, as the major sources of investment, and thus an engine for growth.Consequently the RGC has doubled efforts to create favourable conditions and a climate ofconfidence for investors. The population of Cambodia in the year 2005 was 14.07 million, whileGDP per capita was around US$451/person at constant 2000 US$ values.
Cambodia has substantial hydropower resources and indications of oil, gas and coal deposits;there is an urgent need to assess the extent of these energy resources. Other renewable energysources are available and their use is being started, such as biomass, solar and mini-hydro. Theproblem is to diversify the sources of supply, and intensify the exploration for natural gas andthe development of renewable energy resources.
2. ENERGY AND CO2 EMISSION OUTLOOK
2.1. Final Energy Consumption
The total final energy consumption of Cambodia increased from 3,278 KTOE in 1995 to 4,530KTOE in 2005, growing at an average annual rate of 3.3 percent. The other sectors, whichconsist of residential, commercial and agricultural sectors, consumed the largest portion ofenergy with a share 89.4 percent in 2005. The transportation sector was the next largestconsumer with 9.5 percent of the total with the industrial sector taking the remaining 1.1 percent.
2.1.1. Reference Scenario
Using the basic assumptions as mentioned in the previous section, final energy consumption inCambodia is projected to grow at an annual growth rate of 2.6 percent from 2005 to 2030. Forthe simulation period, the industrial sector final energy consumption is expected to increase atan average annual growth rate of 6.3 percent while the transport sector energy consumption isprojected to increase at an average annual growth rate of 5.0 percent. The combined

30
commercial and residential sectors final energy consumption is expected to increase at anaverage annual growth rate of 2.1 percent until the end of the planning period, 2030.
Figure 11: Sectoral Final Energy Consumption (Reference and High Scenarios)
0
2,000
4,000
6,000
8,000
10,000
12,000
ktoe
Others 2,991 4,050 5,511 5,990 6,862 7,954
Transport 284 429 883 1,255 1,436 2,333
Indus try 3 51 133 204 236 415
1990 20052020
Reference2020 High
2030Reference
2030 High
Electricity consumption will grow at an annual growth rate of 6.1 percent in the period 2005-2030. Its share to total energy consumption is expected to increase from 1.4 percent in 2005 to3.3 percent by 2030. Final consumption of oil will increase at an average rate of 4.8 percentannually and will form 35.1 percent of the total consumption by 2030 increasing from 20.5percent in 2005. Meanwhile, biomass consumption will grow at a relatively low rate of 1.6percent per annum over the simulation period. However, its share, although decreasing, will stillbe substantial at 61.6 percent in 2030.
2.1.2. High Scenario
In the High scenario, final energy consumption will grow at an annual rate of 3.5 percent to2030 driven by the industry sector, which will grow by 8.7 percent per annum. The transportsector energy consumption and the other sectors will grow at annual rates of 7.0 percent and 2.7percent, respectively.
Among the types of fuels consumed, biomass share will decrease from 78.1 percent in 2005 toabout 49.1 percent in 2030. The decline in the biomass consumption would be due to theincreasing use of electricity.

31
Figure 12: Final Energy Consumption by Energy Type
0
2,000
4,000
6,000
8,000
10,000
12,000kt
oe
Others 2,901 3,536 4,442 4,442 5,258 5,258
Heat 0 0 0 0 0 0
Electricity 9 64 161 279 279 562
Natural gas 0 0 0 0 0 0
Oil 369 930 1,924 2,727 2,997 4,881
Coa l 0 0 0 0 0 0
1990 20052020
Reference2020 High
2030Reference
2030 High
2.2. Primary Energy Supply
The primary energy supply of Cambodia was about 4,812 KTOE in 2005. It increased at anaverage annual rate of 3.6 per annum from 3,385 KTOE in 1995. The bulk of the primaryenergy supply in 2005 came from biomass which formed 73.5 percent of the total or 3,536KTOE. Oil supply was 1,272 KTOE or 26.4 percent and the remaining amount of 4 KTOE (0.1percent) came from hydro.
2.2.1. Reference Scenario
Cambodia’s primary energy requirements will grow at an annual rate of 2.4 percent from 2005to 2030. Primary energy consumption per capita will increase from 0.34 to 0.41 toe, which isstill significantly lower as compared to majority of the member states of the ASEAN.
Among the energy sources, hydro will have the highest annual growth rate of 12.6 percent perannum from 2005 to 2030. This is due to the planned construction of hydropower plants tosupply the projected increasing electricity demand.
Oil, in view of the fast growth rate of 3.5 percent per annum will increase its share to the totalprimary energy supply from 26.4 percent in 2005 to 34.2 percent in 2030. Other energy, whichis mostly biomass will have growth rate of 1.6 percent.
Coal and natural gas are envisioned to figure in the energy mix in the future as fuel forelectricity generation. Their combined shares will however be low at 2.2 percent in 2020 and 4.9percent in 2030. Biomass will remain as the major energy source with a share of 60.0 percent in2030.

32
Figure 13: Primary Energy Consumption by Energy to 2030
0
2,000
4,000
6,000
8,000
10,000
12,000
kto
e
Others 2,901 3,536 4,442 4,442 5,258 5,258
Hydro 0 4 24 69 74 176
Nuclear 0 0 0 0 0 0
Natural gas 0 0 33 86 97 217
Oil 484 1,272 1,924 2,727 2,997 4,881
Coa l 0 0 112 298 333 747
1990 20052020
Reference2020 High
2030Reference
2030 High
2.2.2. High Scenario
In view of the higher economic growth assumption in this scenario, primary energy supply willgrow at a faster rate of 3.5 percent per annum. Per capita primary energy consumption willincrease from 0.34 TOE to 0.63 TOE by 2030.
Hydro will exhibit the fastest growth in supply at 16.6 percent per annum from 2005 to 2030.Oil will also grow faster at 5.5 percent per year. Coal and natural gas will garner higher sharesin view of higher demand for electricity. Their combined shares will be 5.0 percent in 2020 and8.5 percent in 2030.
2.3. Power Generation
Electricity production was 879 GWh in 2005. In the future, electricity production is projectedto increase to 2,845 GWh in the Base Case with an annual growth rate of 4.8 percent and 6,502GWh in the High scenario posting an annual growth rate of 8.3 percent.
As regards, fuel inputs to power generation, coal and natural gas are projected to replace oil forboth the Reference and High scenarios.
In view of the shift from old oil power generating facilities to technologies using coal andnatural gas with higher efficiencies, thermal efficiency of Cambodia is expected to increasefrom 21.0 percent in 2005 to 39.7 percent in 2030 in the both scenarios.
33
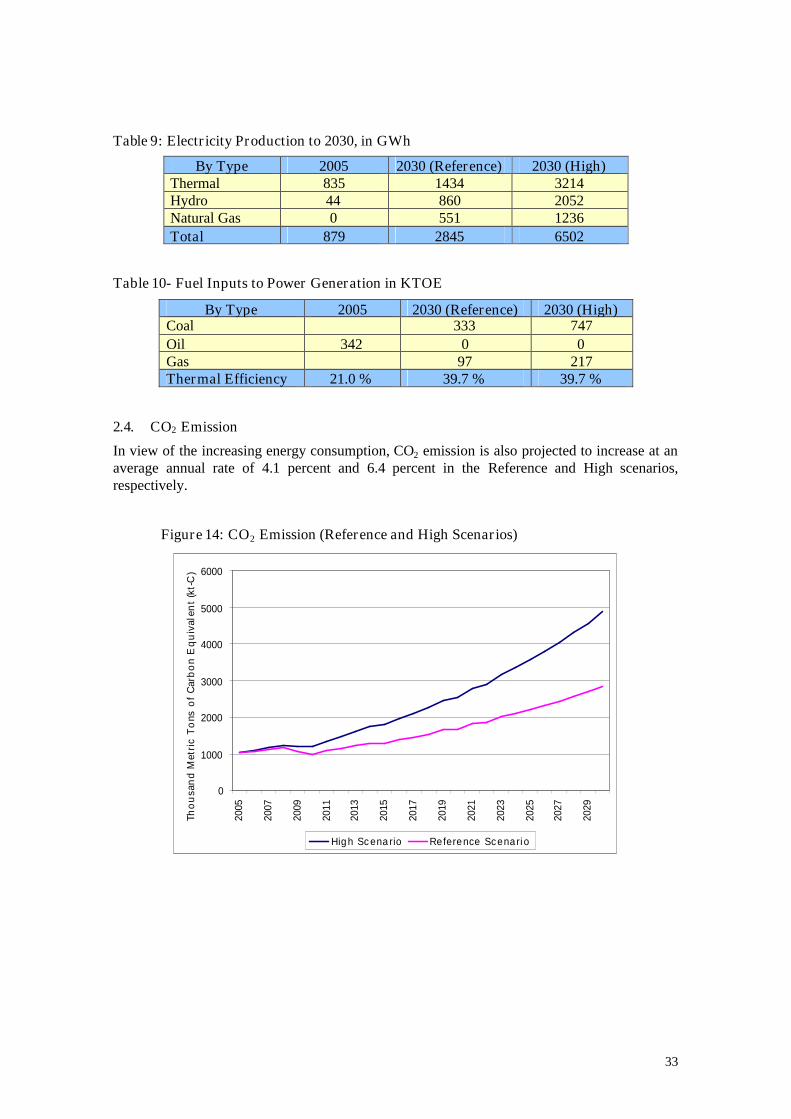
Table 9: Electricity Production to 2030, in GWh
By Type 2005 2030 (Reference) 2030 (High)Thermal 835 1434 3214Hydro 44 860 2052Natural Gas 0 551 1236Total 879 2845 6502
Table 10- Fuel Inputs to Power Generation in KTOE
By Type 2005 2030 (Reference) 2030 (High)Coal 333 747Oil 342 0 0Gas 97 217Thermal Efficiency 21.0 % 39.7 % 39.7 %
2.4. CO2 Emission
In view of the increasing energy consumption, CO2 emission is also projected to increase at anaverage annual rate of 4.1 percent and 6.4 percent in the Reference and High scenarios,respectively.
Figure 14: CO2 Emission (Reference and High Scenarios)
0
1000
2000
3000
4000
5000
6000
2005
2007
2009
2011
2013
2015
2017
2019
2021
2023
2025
2027
2029
Tho
usa
nd
Met
ric
To
nso
fC
arb
on
Eq
uiv
alen
t(k
t-C
)
High Scena rio Reference Scenario

34
3. FINDINGS AND POLICY IMPLICATIONS
3.1. Findings:
• Energy demand in industry sector in both scenarios is increasing with the highest annualgrowth rate of 6.3 percent in the BAU scenario and 8.7 percent in the High Growthscenario.
• Biomass consumption is the major source of energy and will increase at an annual rateof 1.6%.
• Energy demand in others sector is increasing with the annual growth rate of 2.1 percentin the Reference scenario and 2.7 percent in High Growth scenario.
• The elasticity between energy demand and GDP in both scenarios is smaller than 1.This indicates the economic efficiency of Cambodia in the future.
• CO2 emissions per unit of GDP and per unit of primary energy consumption (t-C/toe)would be increasing. This is due to the fact that Cambodia is just starting to enjoyimproved energy services.
3.2. Policy Implications
From findings above, there are some solutions proposed for saving energy in Cambodia whichinclude:
• Need to diversify power generation mix.
• Need to encourage the use of alternative fuels to biomass as well as more efficient cookstoves in residential sector to reduce consumption of biomass.
• Replacement of incandescent light bulbs by energy-efficient compact fluorescent lamps.
• Replacement of existing refrigerators and air conditioners by energy-efficient models.
• Promotion of renewable energy technology dissemination such as solar heating, biogascooking and wind power generation.

35
INDONESIA
1. BACKGROUND
Indonesia is the largest country in Southeast Asia in terms of land area and population. Its17,508 islands with a total land area of almost two million square kilometers are inhabited bymore than 220 million people6.
The GDP of the country in 2005 was 208 million US$ in constant 2000 US$ value, with the percapita GDP at 942 US$/person. The major component of GDP was from commercial sectorcontributing 35.2 percent, followed by industry with 25.3 percent and the remaining iscontributed by the agricultural sector at 14.5 percent. Energy intensity of GDP was 0.87 TOEper thousand US$.
Total primary energy consumption in 2005 amounted to 180 MTOE while final energyconsumption stood at 135 MTOE. PES and FEC per capita were computed at 0.81 TOE perperson and 0.61 TOE per person, respectively.
Indonesia is a net exporter of energy exporting oil, natural gas and coal. Its oil exports howeverhave been declining and the country may need to import crude oil and oil products in the nearfuture should production remain at its current levels.
2. ENERGY DEMAND AND CO2 EMISSION OUTLOOK
2.1. Final Energy Consumption
Total final energy consumption of Indonesia was around 79.2 MTOE in 1990 and increased to134.7 MTOE in 2005 growing at an average annual growth rate of 3.6 percent. The transportsector was the fastest growing consumer at 5.9 percent per annum followed by the industrialsector at 4.9 percent. The consumption of the other sectors which comprise of commercial,residential and agricultural sectors grew the slowest at 2.5 percent.
Oil was the most consumed fuel by final consumers in 2005 with 38.6 percent share of the totalconsumption. Biomass was a close second at 38.0 percent. The average annual growth rate ofoil consumption from 1990 to 2005 was 4.3 percent. Coal had the highest growth rate of 19.8percent per annum resulting to an increase in its share to the total from 0.8 percent in 1990 to7.1 percent in 2005. Electricity had the second fastest annual growth rate of 9.6 percent whilenatural gas consumption grew at 4.4 percent per annum. Biomass consumption grew slowly at1.3 percent per annum.
2.1.1. Reference Scenario
Using the socio-economic assumptions stated in Section 4 of the main report, final energyconsumption in Indonesia is projected to grow at an annual rate of 3.8 percent from 2005 to2030 in the Reference scenario. The transport sector consumption will grow the fastest duringthe period with annual growth projected at 5.7 percent driven by the increasing per capitaincome. The industrial sector consumption will grow 5.0 percent per annum and other sectorswhich include residential, commercial and agricultural sectors will have an average annualgrowth of 1.7 percent. Non-energy consumption will grow at an annual rate of 2.9 percent.
6 Central Bureau of Statistics (CBS), Statistical Year Book of Indonesia 2006

36
Among the types of energy, electricity will grow the fastest at 7.1 percent per annum in view ofthe projected growth in industrial GDP. Its share to the total will consequently increase from 6.8in 2005 to 15.0 percent by 2030. Coal will have the second highest growth rate of 5.7 percent.Its share will increase from 7.1 percent in 2005 to 11.3 percent in 2030. Consumption of naturalgas will grow by 4.2 percent annually. The fuel will be used mainly in the industrial sector.
Oil will remain as the most used fuel and is projected to grow at 4.8 percent per annum. Itsshare to the total consumption mix will also increase from 38.6 percent in 2005 to 49.8 percentin 2030. Consumption of other fuels, which are mostly biomass, will decrease at an averageannual rate of 0.5 percent which is due to fuel switching in the rural areas as a result ofincreasing per capita income.
Figure 15 - Projected Final Energy Consumption in Indonesia by Sector
0
50
100
150
200
250
300
350
400
450
Mto
e
Non-energy 7.8 11.2 17.9 18.5 22.7 25.6
Others 43.6 63.1 74.2 75.3 95.5 102.6
Transport 11.0 26.1 62.2 65.1 103.9 122.2
Indus try 16.7 34.4 74.7 78.7 116.4 141.4
1990 20052020
Reference2020 High
2030Reference
2030 High
2.1.2. High Scenario
In the High scenario, final energy consumption will grow at a faster annual rate of 4.4 percent.The transportation sector consumption will grow by 6.4 percent per annum. The industrial, othersectors and non-energy consumption will have annual growth rates of 5.8 percent, 2.0 percentand 3.3 percent, respectively.
Final consumption of electricity will post the highest annual growth rate at 7.7 percent. Its shareshall increase from 6.8 percent in 2005 to 14.9 percent in 2030. Following next is coalconsumption which will grow by 6.8 percent annually and its share will increase from 7.1percent in 2005 to 12.7 percent in 2030. Oil consumption share will increase from 38.6 percentin 2005 to 50.6 percent in 2030 due to its fast growth rate of 5.5 percent per annum. This isdriven by the rapid growth in consumption of the transport sector which will be responsible for31.2 percent of the total oil demand in 2030. Natural gas consumption will grow at 4.8 percentper annum while biomass will have a 0.5 percent decline annually.

37
Figure 16 - Final Energy Consumption in Indonesia by Energy Type
0
50
100
150
200
250
300
350
400
450M
toe
Others 42.0 51.2 47 .1 47 .1 44.8 44.8
Heat 0.0 0.0 0.0 0.0 0.0 0.0
Electricity 2.3 9.2 26 .8 28 .0 50.7 58.2
Natural gas 6.6 12.7 24 .9 25 .8 35.9 40.9
Oil 27 .6 52.0 105.7 110.4 168.7 198.1
Coa l 0.6 9.6 24 .4 26 .2 38.4 49.7
1990 20052020
Reference2020 High
2030Reference
2030 High
2.2. Primary Energy Requirement
Historically, the primary energy supply of Indonesia increased from 103.2 MTOE in 1990 to180.1 MTOE in 2005. This is an average increase of 3.8 percent per annum. Coal supply grewthe fastest during the same period at 13.2 percent per annum brought about by the rapid growthin the consumption of the industrial sector and the construction of coal-fired power plants.Natural gas supply grew at an average annual growth rate of 3.4 percent which is largely due tothe coming-on-stream of natural gas power plants during the period. The period also saw rapiddevelopment of geothermal energy in Indonesia. The average annual growth rate of geothermalenergy utilization was 12.7 percent during the period. Biomass energy consumption grew at aslow rate of 0.9 percent per annum.
2.2.1. Reference Scenario
Indonesia's primary energy requirements will grow at an annual rate of 3.8 percent from 180.1MTOE in 2005 to 460.3 MTOE in 2030. Among the energy sources, coal will have the highestannual growth rate of 6.5 percent per annum due to the increasing demand for fuel for electricitygeneration and industrial sector. From 25.4 MTOE in 2005, primary coal supply will increase to123.2 MTOE in 2030.
The annual growth of geothermal energy utilization will remain high at 5.9 percent. This reflectsthe preference of The Government of Indonesia to replace fossil fuel by renewable energy.
Oil supply, in view of the fast growth rate of the transport sector, will grow by 4.2 percent perannum. Natural gas will have an annual growth rate of 3.6 percent while hydro will have anannual growth rate of 3.3 percent. The growth rate of biomass-based fuel will be -0.5 percentper annum.

38
Figure 17 - Primary Energy Requirements in Indonesia
0
100
200
300
400
500
600
Mto
e
Others 45.0 51.2 47.4 47 .4 45.1 45.1
Geotherm al 0.9 5.7 23.9 23 .9 24.0 24.0
Hydro 0.6 0.9 1.8 1.8 2.1 2.1
Nuclear 0.0 0.0 3.8 3.7 8.3 8.2
Natural gas 18.5 30.6 44.8 47 .6 73.6 86.2
Oil 34 .2 66.3 120.8 125.4 184.0 213.3
Coa l 3.9 25.4 66.8 69 .7 123.2 147.2
1990 20052020
Reference2020 High
2030Reference
2030 High
2.2.2. High Scenario
Like in the Base Case, coal supply will exhibit the fastest growth at 7.3 percent per annum inview of the more rapid increase in the requirements for electricity generation. Geothermalfollows next with an annual growth rate of 5.9 percent. Oil supply will grow at 4.8 percentannually and will remain as the most consumed fuel with its 40.5 percent share of the total in2030. Natural gas supply will grow at 4.2 percent per annum while hydro will have the samegrowth rate of 3.3 percent as in the Reference scenario. The consumption of other fuels (mostlybiomass) will decline at a rate of 0.5 percent per annum.
2.3. Power Generation
Electricity production increased from 33,336 GWh in 1990 to 130,213 GWh in 2005. This isequivalent to an average annual growth rate of 9.5 percent over the same period. In the future,electricity production is projected to increase to 716,694 GWh in the Base Case and 823,523GWh in the High Case or at average annual rates of 7.1 percent and 7.7 percent, respectively.
As regards, fuel inputs to power generation, coal will continue to form the bulk of the supply.While natural gas will also figure prominently for both the Reference and High Growthscenarios. Oil will remain low and will decrease in view of its price volatility. Supply fromother fuels is likewise expected to grow.
In view of the increasing utilization natural gas which could be used in highly efficienttechnologies for power generation, thermal efficiency of Indonesia is expected to increase from33.3 percent in 2005 to 43.4 percent in the Reference scenario and 43.7 percent in the HighGrowth scenario.

39
Table 11 - Electricity Production in Indonesia, in GWh
2005 2010Reference
2010High
2020Reference
2020High
2030Reference
2030High
Thermal 112,796 151,877 153,535 314,645 331,290 629,299 736,771
Hydro PP 10,812 16,936 16,936 21,085 21,085 24,264 24,264
Geothermal PP 6,604 16,118 16,118 27,724 27,724 27,724 27,724
Nuclear 0 0 0 14,413 14,274 31,998 31,354
Others 0 179 179 1,786 1,786 3,410 3,410
Total 130,213 185,110 186,768 379,655 396,158 716,694 823,523
Table 12 - Fuel Inputs to Power Generation in Indonesia, in KTOE
2005 2010Reference
2010High
2020Reference
2020High
2030Reference
2030High
Coal 15,783 18,594 18,364 42,453 43,504 84,792 97,528
Oil 9,775 8,448 8,368 6,494 6,442 6,616 6,498
Natural Gas 3,541 6,458 6,914 15,536 17,393 33,406 41,000
ThermalEfficiency (%) 33.3 39.0 39.2 42.0 42.3 43.4 43.7
2.4. CO2 Emissions
Corresponding to the increasing primary energy consumption, Indonesia’s CO2 emission fromfuel combustion will increase at an annual rate of 5.0 percent in the Reference scenario and 5.7percent in the High scenario from 2005 to 2030. Consequently, CO2 emission per unit of energyconsumption will increase by 1.2 percent annually in the Reference scenario and 1.3 percent inthe High scenario. Indonesia’s policy of developing alternative sources of energy wouldcontribute to the deceleration of CO2 emission growth from 2005 to 2030. The figure belowshows the projected CO2 emission in Indonesia in the two scenarios.
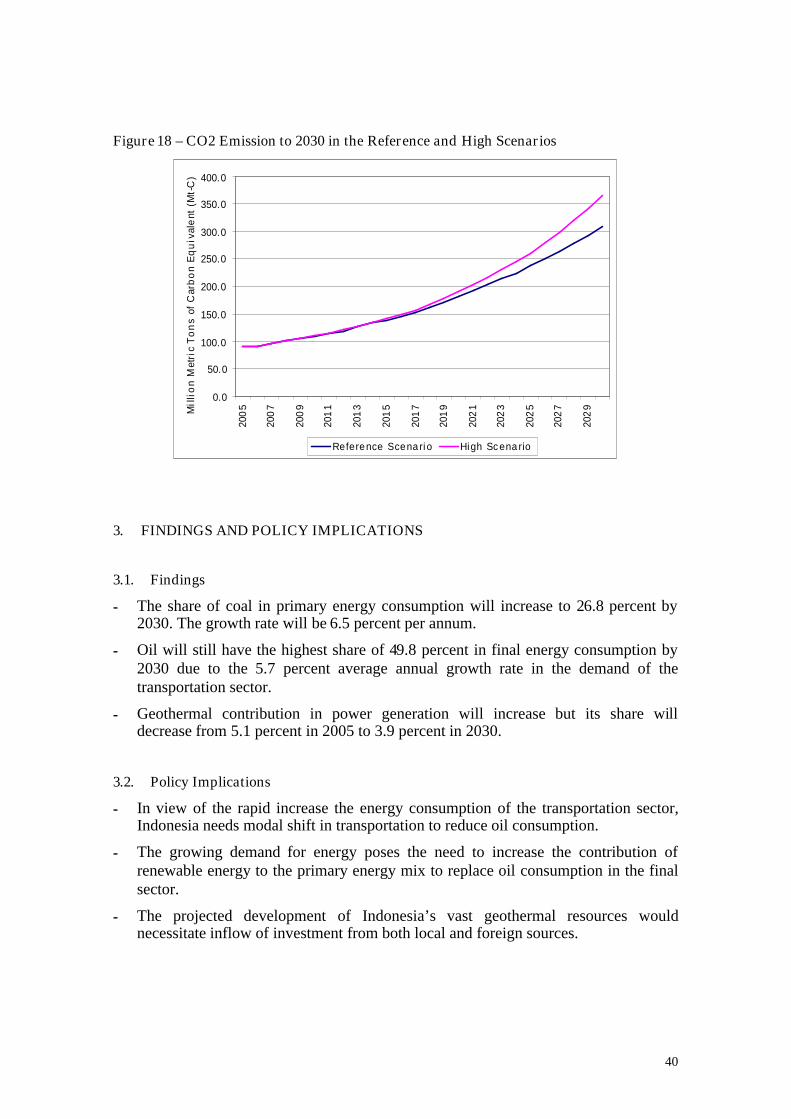
40
Figure 18 – CO2 Emission to 2030 in the Reference and High Scenarios
0.0
50.0
100.0
150.0
200.0
250.0
300.0
350.0
400.0
200
5
200
7
200
9
201
1
201
3
201
5
201
7
201
9
202
1
202
3
202
5
202
7
202
9Mil
lio
nM
etri
cT
on
sof
Car
bo
nE
qu
ival
ent
(Mt-
C)
Reference Scenario High Scena rio
3. FINDINGS AND POLICY IMPLICATIONS
3.1. Findings
- The share of coal in primary energy consumption will increase to 26.8 percent by2030. The growth rate will be 6.5 percent per annum.
- Oil will still have the highest share of 49.8 percent in final energy consumption by2030 due to the 5.7 percent average annual growth rate in the demand of thetransportation sector.
- Geothermal contribution in power generation will increase but its share willdecrease from 5.1 percent in 2005 to 3.9 percent in 2030.
3.2. Policy Implications
- In view of the rapid increase the energy consumption of the transportation sector,Indonesia needs modal shift in transportation to reduce oil consumption.
- The growing demand for energy poses the need to increase the contribution ofrenewable energy to the primary energy mix to replace oil consumption in the finalsector.
- The projected development of Indonesia’s vast geothermal resources wouldnecessitate inflow of investment from both local and foreign sources.

41
LAO PDR
1. BACKGROUND
Lao People’s Democratic Republic (Lao PDR) has a total land area of 236,800 squarekilometers inhabited by 5.6 million people (2005). It is located in the Southeast Asia sharingborders with five countries namely: China in the North, Vietnam in the East, Cambodia in theSouth, Thailand and Myanmar in the West. Its land area is about 70 percent covered bymountains. Laos consists of 16 provinces and the capital city is Vientiane. In year 2005, theGross Domestic Product (GDP) was about US$ 2.4 billion at 2000 constant prices translated toa 400 US$ per capita. The GDP is mainly contributed by four sectors namely agriculture,industry, services and import duties. Agriculture sector has a 42.2 percent share of the totalGDP while industry, services and import duties have 31.5 percent, 25.4 percent and 0.4 percentrespectively.
2. ENERGY DEMAND AND CO2 EMISSION OUTLOOK
2.1. Final Energy Consumption
Total final energy consumption of Lao PDR was around 1,150 KTOE in 1990 and reached1,798 KTOE in 2005 growing at an average annual growth rate of 3.0 percent. The industrysector was the fastest growing consumer at 7.6 percent per annum followed by the transportsector at 4.0 percent. The consumption of the other sectors such as commercial, residential andagricultural grew by an average annual rate of 2.5 percent from 1990 to 2005. It has aggregateddemand volume of 1,329 KTOE in 2005, equivalent to 73.9 percent of the overall final energyconsumption.
By energy type, biomass, which is mostly firewood, formed the bulk of final energy consumedat 1,322 KTOE in 2005. This is followed by oil at 360 KTOE, electricity at 87 KTOE and coalat 30 KTOE.
2.1.1. Reference Scenario
Using the GDP annual growth assumption of 5.3 percent and 0.9 percent annual growth inpopulation, final energy consumption in Lao PDR is projected to grow at an annual growth rateof 3.2 percent from 2005 to 2030. Energy demand in the transport sector will grow at 5.4percent annually. The industrial sector performance will reflect a 7.4 percent annual growth ratethroughout the planning period. For the other sectors (commercial, residential and agricultural),the aggregated annual growth rate will be 1.5 percent.
Among the types of energy, coal will grow the fastest at 10.6 percent per annum in relation tothe projected increase in cement production. Its share in the total energy consumption willincrease from 1.6 percent in 2005 to 9.3 percent in 2030. Electricity comes next with an annualgrowth rate of 7.3 percent with its share increasing from 4.8 percent in 2005 to 12.8 percent in2030. Oil products consumption will grow at an annual rate of 5.5 percent in relation to theprojected growth rate of the number of vehicles in the country. Its share in the total final energyconsumption will grow from 20.0 percent in 2005 to 34.8 percent in 2030. Meanwhile, biomassconsumption will have a slower growth of 1.0 percent as the population shifts from biomass toconventional fuels like LPG.

42
Figure 19 – Final Energy Consumption in Lao PDR by Sector
0
1,000
2,000
3,000
4,000
5,000
6,000kt
oe
Others 915 1,329 1,673 1,718 1,922 2,126
Trans po rt 195 353 853 1,028 1,327 2,134
Indus try 39 117 367 393 697 877
1990 20052020
Reference2020 High
2030Reference
2030 High
Figure 20 – Final Energy Consumption by Energy Type in Lao PDR
0
1,000
2,000
3,000
4,000
5,000
6,000
kto
e
Others 915 1,322 1,549 1,549 1,696 1,696
Heat 0 0 0 0 0 0
Electricity 14 87 292 344 507 763
Natural gas 0 0 0 0 0 0
Oil 221 360 876 1,054 1,375 2,199
Coa l 0 30 176 192 368 479
1990 20052020
Reference2020 High
2030Reference
2030 High
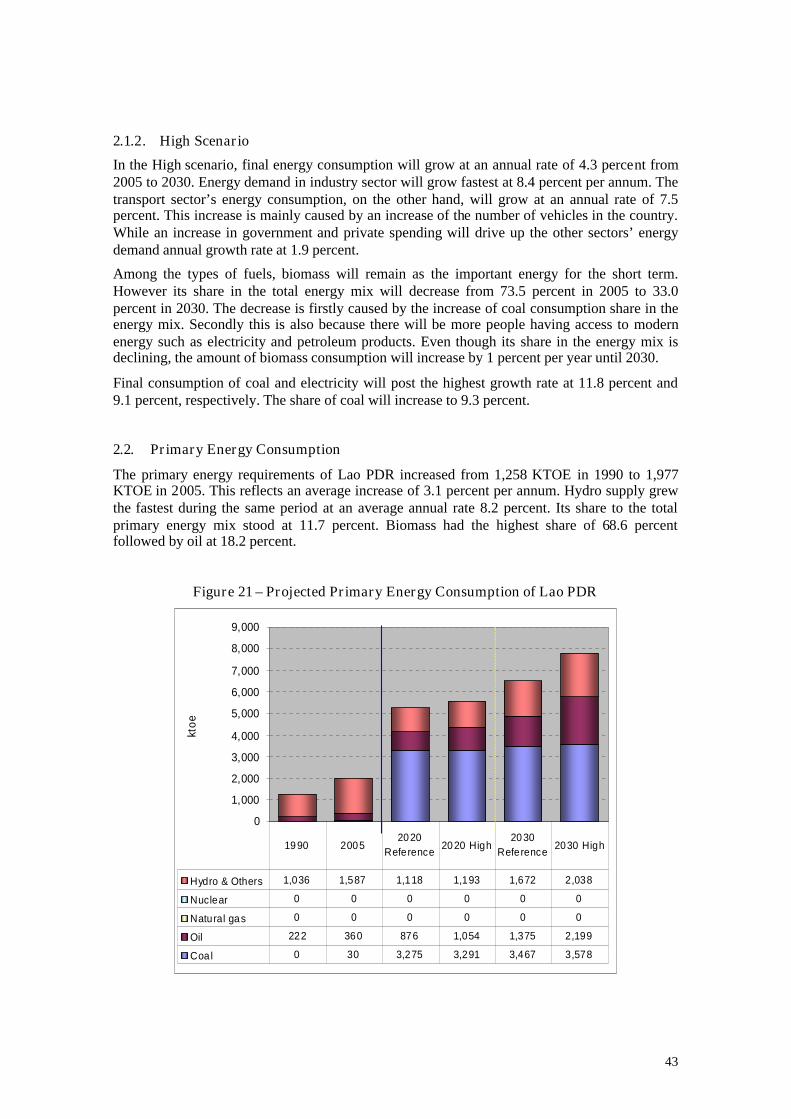
43
2.1.2. High Scenario
In the High scenario, final energy consumption will grow at an annual rate of 4.3 percent from2005 to 2030. Energy demand in industry sector will grow fastest at 8.4 percent per annum. Thetransport sector’s energy consumption, on the other hand, will grow at an annual rate of 7.5percent. This increase is mainly caused by an increase of the number of vehicles in the country.While an increase in government and private spending will drive up the other sectors’ energydemand annual growth rate at 1.9 percent.
Among the types of fuels, biomass will remain as the important energy for the short term.However its share in the total energy mix will decrease from 73.5 percent in 2005 to 33.0percent in 2030. The decrease is firstly caused by the increase of coal consumption share in theenergy mix. Secondly this is also because there will be more people having access to modernenergy such as electricity and petroleum products. Even though its share in the energy mix isdeclining, the amount of biomass consumption will increase by 1 percent per year until 2030.
Final consumption of coal and electricity will post the highest growth rate at 11.8 percent and9.1 percent, respectively. The share of coal will increase to 9.3 percent.
2.2. Primary Energy Consumption
The primary energy requirements of Lao PDR increased from 1,258 KTOE in 1990 to 1,977KTOE in 2005. This reflects an average increase of 3.1 percent per annum. Hydro supply grewthe fastest during the same period at an average annual rate 8.2 percent. Its share to the totalprimary energy mix stood at 11.7 percent. Biomass had the highest share of 68.6 percentfollowed by oil at 18.2 percent.
Figure 21 – Projected Primary Energy Consumption of Lao PDR
0
1,000
2,000
3,000
4,000
5,000
6,000
7,000
8,000
9,000
ktoe
Hydro & Others 1,036 1,587 1,118 1,193 1,672 2,038
Nuclear 0 0 0 0 0 0
Natural gas 0 0 0 0 0 0
Oil 222 360 876 1,054 1,375 2,199
Coa l 0 30 3,275 3,291 3,467 3,578
1990 20052020
Reference2020 High
2030Reference
2030 High

44
2.2.1. Reference Scenario
The country’s primary requirements will grow at an annual rate of 4.9 percent. Among theenergy sources, coal will have the highest annual growth rate at 21.0 percent per annum from2005 to 2030 due to the development of the Hongsa Thermal plant with an installed capacity of1,800 MW that will run on indigenously produced lignite coal. This coal power plant will bebuilt for the sole purpose of exporting electricity to neighboring Thailand. In view of this, coalwill comprise 53.2 percent of the total energy requirements in 2030.
Hydro will have the second fastest growth rate of 11.0 percent from 2005 to 2030. From 232KTOE in 2005, it will increase to 3,134 KTOE in 2030. A huge chunk of electricity generationis also earmarked for export.
Oil supply which will remain 100 percent imported will grow at a slower rate of 5.5 percent. Itsshare will slightly increase from 18.2 percent in 2005 to 21.1 percent in 2030.
2.2.2. High Scenario
Hydro in the High scenario will have the same growth as in the Base Case over the planningperiod. Coal will grow at a higher rate of 21.1 percent annual growth rate in view of the morerapid increase in the requirements of the industrial sector. This will be followed by oil at 7.5percent while other energy will grow at an annual rate of 2.2 percent.
2.3. Power Generation
Electricity production increased at an average annual rate of 8.2 percent from 821 GWh in 1990to 2,693 GWh in 2005. All of this generation came from hydroelectric power plants and almost97 percent was exported.
From 2005-2030, electricity generation will grow at an average annual rate of 12.3 percent inthe two scenarios as Lao produces more electricity for export. As mentioned earlier, a coalpower plant with an installed generating capacity of 1,800 MW would be commissioned in 2012with the output earmarked for export.
Table 13 – Projected Electricity Production in Lao PDR, in GWh
By Type 1990 20052030
Reference2030High
Hydro 821 2,693 36,446 36,446
Thermal 0 0 12,614 12,614
Total 821 2,693 49,060 49,060
Coal will be the sole fossil fuel input for electricity generation. Domestically produced lignitewill be the source of the supply of this fuel.

45
Table 14 – Projected Fuel Inputs to Power Generation in the Lao PDR, in KTOE
By Type 1990 20052030
Reference2030High
Coal - - 3,099 3,099
Thermal Efficiency (%) - - 35.0 35.0
2.4. CO2 Emissions
CO2 emissions related to energy use in Lao PDR in 2005 were 330 thousand tons of Carbonequivalents (kt-C). This is equivalent to 0.17 t-C per TOE of primary energy consumed, thelowest among the ASEAN countries.
For the forecast period 2006-2030, emission will increase at rapid rate of 11.5 percent perannum in the Reference scenario and 12.2 percent in the High Growth scenario. A sudden jumpin CO2 emission is expected in 2012 when the Hongsa coal power plant starts to operate. Itshould be noted that the electricity output of this power plant would be exported.
Figure 22 – Projected CO2 emission in Lao PDR
0
1000
2000
3000
4000
5000
6000
7000
200
5
200
7
200
9
201
1
201
3
201
5
201
7
201
9
202
1
202
3
202
5
202
7
202
9
Th
ou
san
dM
etri
cT
ons
of
Car
bo
nE
qui
vale
nt
(kt-
C)
High Scena rio Reference Scenario

46
3. FINDINGS AND POLICY IMPLICATIONS
3.1. Findings
- Lao PDR will continue to be an electricity exporter with around 90 percent of theelectricity generation will be exported by 2030.
- The share of biomass consumption will be decreasing due to the increase of coalconsumption but the amount will still be increasing.
- The other sector (residential, commercial and agriculture) still has the biggest share infinal energy consumption.
3.2. Policy Implications
- In order to continue to be an electricity exporter, Lao PDR needs investment to developits vast hydropower potential.
- As the country aims to tap its coal resources for electricity generation that is alsogeared for export, it needs clean coal technology for power generation to mitigate theimpact of coal use to the environment and climate change.

47
MALAYSIA
1. BACKGROUND
Malaysia’s 330,242 square kilometers of territory consist of Peninsular Malaysia and the Sabahand Sarawak States on the island of Borneo. The country has a tropical, humid climate withtemperatures averaging 86oF (30oC). The population increased with an annual average growthrate of 2.4 percent from 17.8 million in 1990 to 25.3 million in 2005. In the future, populationgrowth will be lower than it has been in the past 15 years due to more Malaysians pursuinghigher education and career advancement leading to delayed marriages as well as havingsmaller families7.
Malaysia’s GDP grew at an average of 6.2 percent per annum from 1990 to 2005. Afterexperiencing a sluggish growth in 2001, the economy recovered and continued its strong growthmomentum. In 1990, the GDP was 45.5 billions of 2000 US$ and in 2005 it increased to 112.5billions. Growth was driven by robust domestic demand despite a weaker external environmentwhich led to moderation in export growth. Private consumption and investment activitiesexpanded strongly during 2005. Strong investment in the manufacturing, services, construction,and oil and gas industries, combined with positive business sentiment, supported expansion inprivate investment. The GDP per capita grew at a rate of 3.8 percent per annum, from 2.5thousands of 2000 US$ per person in 1990 to 4.4 thousands of 2000 US$ per person in 2005.
Malaysia is well endowed with conventional energy sources such as oil, gas and coal, as well asrenewable energy such as hydro, biomass and solar energy. Malaysia is a net energy exporter.Crude oil, LNG and petroleum products contributed 12.8 percent of the economy’s exportearnings in 2005 or RM8 68.5 billion.
2. ENERGY DEMAND AND CO2 EMISSION OUTLOOK
2.1. Final Energy Consumption
The total final energy consumption of Malaysia grew at an average annual growth rate of 6.4percent, from about 14,534 KTOE in 1990 to 36,642 KTOE in 2005. The total final energyconsumption in the transport sector, which consumed the largest portion of energy in 2005,grew at an average rate of 7.1 percent per annum. The industrial sector energy consumptiongrew at an average rate of 6.1 percent per annum. Other sector consumption which includesresidential, commercial and agriculture sectors grew at an average rate of 5.4 percent per annum.
Final consumption of natural gas grew the fastest during the same period with an average annualgrowth rate of 10.6 percent followed by electricity consumption at 9.8 percent. Coalconsumption also had a rapid growth rate of 7.0 percent during the same period. Consumptionof biomass grew at a slow rate of 0.2 percent.
7 Ninth Malaysia Plan, Economic Planning Unit (EPU)8 RM – Malaysian Ringgit (Malaysia’s national currency)

48
2.1.1. Reference Scenario
Using the socio-economic assumptions as stated earlier, the final energy consumption inMalaysia is projected to grow at an annual growth rate of 4.4 percent from 2005 to 2030 in theReference scenario. In this period, the industrial sector final energy consumption is expected toincrease at the fastest rate of 4.7 percent per annum while the transport sector energyconsumption is projected to increase at an average annual growth rate of 4.1 percent. Thecombined commercial and residential sectors final energy consumption is expected to increaseat an average annual growth rate of 4.3 percent by the end of the planning period, 2030 (see Fig.2). The relatively high growth in the combined commercial and domestic sectors would be dueto the increase in per capita income.
Figure 23 – Projected Final Energy Consumption by Sector in MTOE
0
20
40
60
80
100
120
140
Mto
e
Others 2.9 6.4 12.0 13.4 18.3 22.4
Trans po rt 5.5 15 .3 29 .5 33.4 42 .1 52 .5
Indus try 6.1 14.9 31.1 34.9 47.0 57.5
1990 20052020
Reference2020 High
2030Reference
2030 High
Electricity, which is one of the main forms of energy consumed in Malaysia, will grow at 5.3percent per annum from 2005 until 2030 in view of the higher proportion consumed by thecommercial/domestic sectors. The share of electricity consumption to total energy consumptionis expected to increase from 18.9 percent in 2005 to 23.2 percent by 2030. Final consumptionof natural gas will grow at a faster average rate of 5.7 percent per annum and the share ofnatural gas will increase from 13.5 percent in 2005 to 18.4 percent in 2030. The share of oil willbe expected to drop from 60.8 percent in 2005 to 53.7 percent in 2030. The average annualgrowth rate of final consumption of oil from 2005 until 2030 will be at 3.9 percent (see Fig 24).Coal consumption will increase by 5.5 percent per annum on the average.
2.1.2. High Scenario
For the High scenario, the total final energy consumption is expected to grow at a faster annualrate of 5.3 percent to the year 2030 from 2005 driven by the industrial sector, which will growby 5.5 per annum. The transport sector energy consumption, on the other hand, is expected to
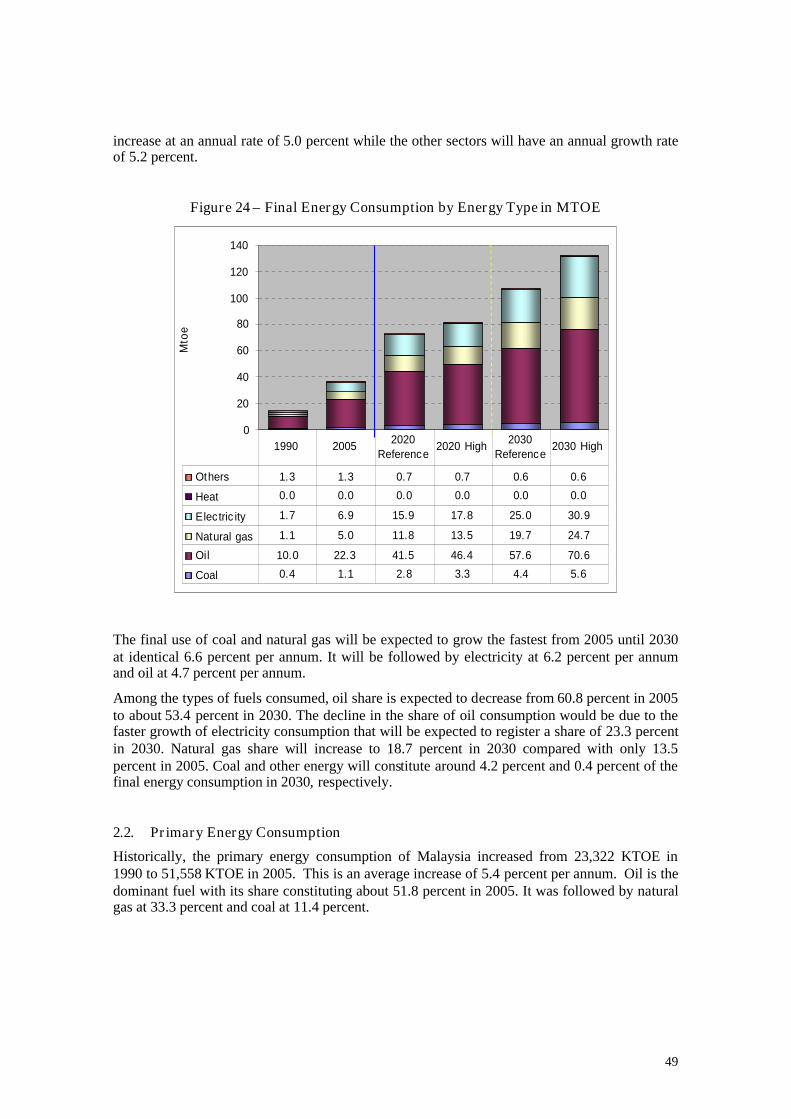
49
increase at an annual rate of 5.0 percent while the other sectors will have an annual growth rateof 5.2 percent.
Figure 24 – Final Energy Consumption by Energy Type in MTOE
0
20
40
60
80
100
120
140
Mto
e
Others 1.3 1.3 0.7 0.7 0.6 0.6
Heat 0.0 0.0 0.0 0.0 0.0 0.0
Electric ity 1.7 6.9 15.9 17.8 25.0 30.9
Natural gas 1.1 5.0 11.8 13.5 19.7 24.7
Oil 10.0 22.3 41.5 46.4 57.6 70.6
Coal 0.4 1.1 2.8 3.3 4.4 5.6
1990 2005 2020Reference
2020 High 2030Reference
2030 High
The final use of coal and natural gas will be expected to grow the fastest from 2005 until 2030at identical 6.6 percent per annum. It will be followed by electricity at 6.2 percent per annumand oil at 4.7 percent per annum.
Among the types of fuels consumed, oil share is expected to decrease from 60.8 percent in 2005to about 53.4 percent in 2030. The decline in the share of oil consumption would be due to thefaster growth of electricity consumption that will be expected to register a share of 23.3 percentin 2030. Natural gas share will increase to 18.7 percent in 2030 compared with only 13.5percent in 2005. Coal and other energy will constitute around 4.2 percent and 0.4 percent of thefinal energy consumption in 2030, respectively.
2.2. Primary Energy Consumption
Historically, the primary energy consumption of Malaysia increased from 23,322 KTOE in1990 to 51,558 KTOE in 2005. This is an average increase of 5.4 percent per annum. Oil is thedominant fuel with its share constituting about 51.8 percent in 2005. It was followed by naturalgas at 33.3 percent and coal at 11.4 percent.

50
2.2.1. Reference Scenario
Malaysia’s primary energy consumption is expected to grow at an annual rate of 4.5 percentfrom 2005 until 2030. Coal is expected to increase at an annual growth rate of 7.5 percent perannum, with its share to the total primary energy requirement mix increasing from 11.4 percentin 2005 to 23.2 percent by 2030. The increase in primary supply of coal over the next 25 yearsis largely due to the use of coal for power generation.
Natural gas that was consumed mostly by the thermal stations, industry and for non-energypurposes will be expected to grow at 4.0 percent per annum from 2005 until 2030. However, theshare of natural gas in primary supply mix will be expected to be reduced from 33.3 percent in2005 to 29.9 percent in 2030 due to increase in the share of coal. The primary supply of hydrowill be expected to grow at 4.7 percent per annum from 2005 until 2030.
Primary energy consumption of oil is expected to increase at an average annual rate of 4.0percent from 2005 to 2030, in view of the increasing consumption of the transport sector. Theother form of energy, which is mostly biomass, is expected to decrease at an annual rate of 3.2percent over the simulation period.
Figure 25 – Primary Energy Consumption in MTOE
020
4060
80
100120
140
160
180200
Mto
e
Others 2.1 1.3 0.7 0.7 0.6 0.6
Hydro 0.3 0.5 1.6 1.6 1.6 1.6
Nuc lear 0.0 0.0 0.0 0.0 0.0 0.0
Natural gas 6.8 17.2 29.6 33.4 46.2 57.1
Oil 13.0 26.7 51.2 56.1 70.5 83.5
Coal 1.0 5.9 21.3 24.2 35.9 45.3
1990 20052020
Reference2020 High
2030Reference
2030 High
2.2.2. High Scenario
In the High scenario, the projected primary energy consumption will increase at a higher rate of5.3 percent per annum from 2005 until 2030. Coal and natural gas is expected to increase at afaster rate of 8.5 percent and 4.9 percent respectively. These increases will be driven by therapid growth in consumption in power generation. Oil is expected to have an annual incrementat 4.7 percent. Hydro is expected to have same growth with the Reference scenario by 4.7

51
percent per annum. Other energy is expected to have a negative growth rate of 3.3 percent perannum.
2.3. Power Generation
Electricity production increased from 23,016 GWh in 1990 to 87,306 GWh in 2005. This isequivalent to an average annual growth rate of 9.3 percent over this period. Over the period of2005 to 2030, electricity production is expected to increase to 314,984 GWh in the Referencescenario with an annual growth rate of 5.3 percent and 389,734 GWh in the High scenarioposting an annual growth rate of 6.2 percent.
Table 15 - Electricity Production to 2030, in GWh
By Type 1990 2005 2030(Reference)
2030(High)
Coal 2,825 23,134 154,686 194,913
Thermal (oil) 11,138 2,489 3,107 3,068
Natural Gas 5,064 55,899 139,025 173,587
Hydro 3,989 5,784 18,166 18,166
Total 23,016 87,306 314,984 389,734
With regard to the fuel inputs to power generation, by 2030, coal is projected to be the main fuelconsumed for power generation for both in the Reference and High scenarios. Coal as input forelectricity generation will increase at an annual rate of 7.9 percent in the Reference scenario and8.9 percent in the High scenario. Consumption of oil will remain low in view of its pricevolatility and low efficiency of oil-based power plant technologies. From 2005 until 2030,natural gas input in power stations will be expected to increase by 3.1 percent per annum in theReference scenario and 4.0 per annum in the High Growth scenario.
Table 16 - Fuel Inputs to Power generation, in KTOE
By Type 1990 2005 2030(Reference)
2030(High)
Coal 622 4,714 31,518 39,714
Oil 2,994 575 718 709
Natural Gas 1,361 12,199 26,486 32,397
Overall ThermalEfficiency (%) 32.9 40.1 43.5 43.9
In view of the assumption that future thermal power plants will use new and more efficienttechnologies, thermal efficiency in Malaysia will increase from 40.1 percent in 2005 to 43.5percent in 2030 in the Reference scenario and 43.9 percent in the High scenario.
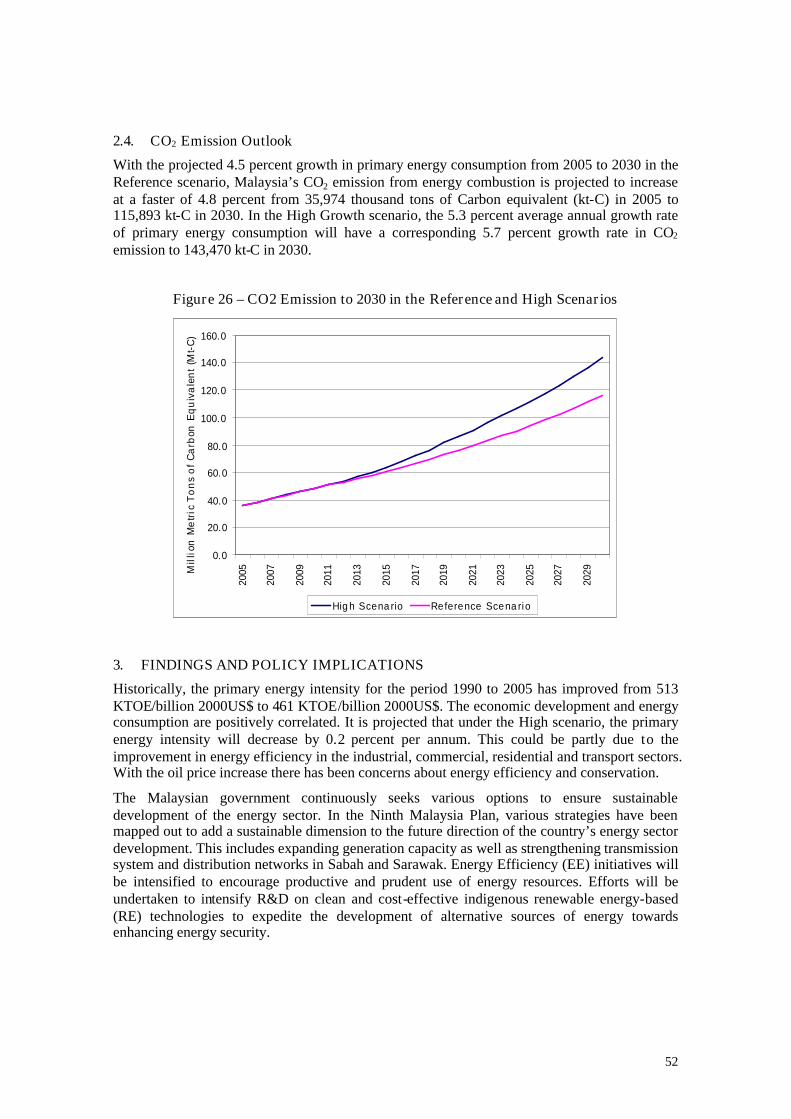
52
2.4. CO2 Emission Outlook
With the projected 4.5 percent growth in primary energy consumption from 2005 to 2030 in theReference scenario, Malaysia’s CO2 emission from energy combustion is projected to increaseat a faster of 4.8 percent from 35,974 thousand tons of Carbon equivalent (kt-C) in 2005 to115,893 kt-C in 2030. In the High Growth scenario, the 5.3 percent average annual growth rateof primary energy consumption will have a corresponding 5.7 percent growth rate in CO2
emission to 143,470 kt-C in 2030.
Figure 26 – CO2 Emission to 2030 in the Reference and High Scenarios
0.0
20.0
40.0
60.0
80.0
100.0
120.0
140.0
160.0
2005
2007
2009
2011
2013
2015
2017
2019
2021
2023
2025
2027
2029M
illi
onM
etr
icT
on
so
fC
arb
onE
qu
iva
len
t(M
t-C
)
High Scena rio Reference Scena rio
3. FINDINGS AND POLICY IMPLICATIONS
Historically, the primary energy intensity for the period 1990 to 2005 has improved from 513KTOE/billion 2000US$ to 461 KTOE/billion 2000US$. The economic development and energyconsumption are positively correlated. It is projected that under the High scenario, the primaryenergy intensity will decrease by 0.2 percent per annum. This could be partly due to theimprovement in energy efficiency in the industrial, commercial, residential and transport sectors.With the oil price increase there has been concerns about energy efficiency and conservation.
The Malaysian government continuously seeks various options to ensure sustainabledevelopment of the energy sector. In the Ninth Malaysia Plan, various strategies have beenmapped out to add a sustainable dimension to the future direction of the country’s energy sectordevelopment. This includes expanding generation capacity as well as strengthening transmissionsystem and distribution networks in Sabah and Sarawak. Energy Efficiency (EE) initiatives willbe intensified to encourage productive and prudent use of energy resources. Efforts will beundertaken to intensify R&D on clean and cost-effective indigenous renewable energy-based(RE) technologies to expedite the development of alternative sources of energy towardsenhancing energy security.

53
MYANMAR
1. BACKGROUND
Myanmar has a total land area of 676.6 thousand square kilometers inhabited by 50.5 millionpeople in 2005. It is rich in energy resources exporting natural gas and coal to neighboringcountries. The country’s economy kept its dynamic pace with Gross Domestic Product (GDP)growing by 5.3 percent in 2005. The industry sector managed a 3.5 growth due mainly to thestable output of the manufacturing and construction sectors. The 2005 population was estimatedat 50.5 million persons while GDP per capita was 260 USD9/person.
2. ENERGY DEMAND AND CO2 EMISSION OUTLOOK
2.1. Final Energy Consumption
Total final energy consumption of Myanmar was around 9,404 KTOE in 1990 and increased to12,798 KTOE in 2005 growing at an average annual growth rate of 2.1 percent. The industrysector was the fastest growing consumer at 8.9 percent per annum followed by thetransportation sector at 7.5 percent. On the other hand, the consumption of the other sectorssuch as commercial, residential and agricultural sectors has grown slowly by an average annualrate of 0.9 percent from 1990 to 2005. It has aggregated to 9,728 KTOE in 2005 but isequivalent to a 76 percent of the overall final energy consumption.
Figure 27 – Projected Final Energy Consumption by Sector in KTOE
0
5,000
10,000
15,000
20,000
25,000
30,000
35,000
ktoe
Others 8,468 9,728 11,424 11 ,514 12,461 12,851
Trans po rt 451 1,337 2,343 4,513 3,280 10,611
Indus try 485 1,733 2,398 3,925 3,510 9,763
1990 20052020
Reference2020 High
2030Reference
2030 High
9 2000 constant USD as calculated from exchange rate estimates of IMF for Myanmar.
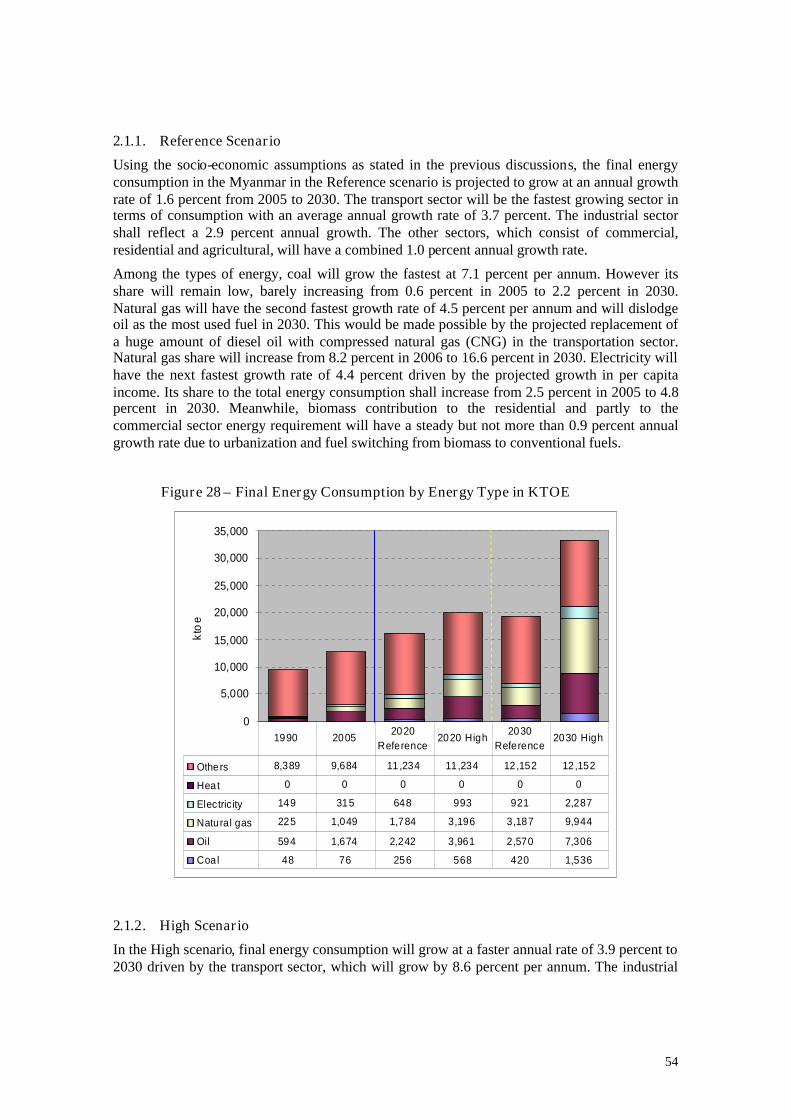
54
2.1.1. Reference Scenario
Using the socio-economic assumptions as stated in the previous discussions, the final energyconsumption in the Myanmar in the Reference scenario is projected to grow at an annual growthrate of 1.6 percent from 2005 to 2030. The transport sector will be the fastest growing sector interms of consumption with an average annual growth rate of 3.7 percent. The industrial sectorshall reflect a 2.9 percent annual growth. The other sectors, which consist of commercial,residential and agricultural, will have a combined 1.0 percent annual growth rate.
Among the types of energy, coal will grow the fastest at 7.1 percent per annum. However itsshare will remain low, barely increasing from 0.6 percent in 2005 to 2.2 percent in 2030.Natural gas will have the second fastest growth rate of 4.5 percent per annum and will dislodgeoil as the most used fuel in 2030. This would be made possible by the projected replacement ofa huge amount of diesel oil with compressed natural gas (CNG) in the transportation sector.Natural gas share will increase from 8.2 percent in 2006 to 16.6 percent in 2030. Electricity willhave the next fastest growth rate of 4.4 percent driven by the projected growth in per capitaincome. Its share to the total energy consumption shall increase from 2.5 percent in 2005 to 4.8percent in 2030. Meanwhile, biomass contribution to the residential and partly to thecommercial sector energy requirement will have a steady but not more than 0.9 percent annualgrowth rate due to urbanization and fuel switching from biomass to conventional fuels.
Figure 28 – Final Energy Consumption by Energy Type in KTOE
0
5,000
10,000
15,000
20,000
25,000
30,000
35,000
kto
e
Others 8,389 9,684 11 ,234 11,234 12,152 12,152
Heat 0 0 0 0 0 0
Electricity 149 315 648 993 921 2,287
Natural gas 225 1,049 1,784 3,196 3,187 9,944
Oil 594 1,674 2,242 3,961 2,570 7,306
Coal 48 76 256 568 420 1,536
1990 20052020
Reference2020 High
2030Reference
2030 High
2.1.2. High Scenario
In the High scenario, final energy consumption will grow at a faster annual rate of 3.9 percent to2030 driven by the transport sector, which will grow by 8.6 percent per annum. The industrial

55
sector energy consumption will grow at an annual rate of 7.2 percent while the Residential andCommercial sector consumption will grow at an annual rate of 1.1 percent.
Among the types of fuels, coal will have the fastest growth rate of 12.8 percent but its share tothe total will remain low and will reach only 4.6 percent in 2030. Natural gas will have thesecond fastest growth rate of 9.4 percent per annum due to its projected use as alternative fuel inthe transportation sector. Electricity will have the next fastest growth rate of 8.3 percent perannum and will increase its share from 2.5 percent in 2005 to 6.9 percent in 2030. Oil will growat 6.1 percent per annum and its share to the total will increase from 13.1 percent in 2005 to22.0 percent in 2030.
Non-power use of the natural gas will have its significant impact in the share to the finalconsumption through the aggressive government programs in the establishment of infrastructurerelated to the natural gas pipelines in the urban areas to fuel residential, commercial andtransport sector. The introduction of the CNG (Compress Natural Gas) bus for public transportstarted since 1986.
2.2. Primary Energy Consumption
Historically, the primary energy consumption of Myanmar increased from 10,683 KTOE in1990 to 13,811 KTOE in 2005. This is an average increase of 1.7 percent per annum. Oil grewthe fastest during the same period at an average annual growth rate 6.8 percent followed byhydro at 6.3 percent. Oil share to the total primary energy mix was 14.3 percent second only tobiomass which had a 70.1 percent share. Natural gas had a 13.2 percent share of the total.
Figure 29 – Primary Energy Requirements in KTOE
0
5,000
10,000
15,000
20,000
25,000
30,000
35,000
40,000
ktoe
Others 9,021 9,684 10,699 10,321 11,070 9,245
Hydro 103 258 1,328 2,271 2,324 6,391
Nuclear 0 0 0 0 0 0
Natural gas 760 1,825 2,598 4,010 4,001 10,758
Oil 736 1,969 2,539 4,258 2,867 7,603
Coa l 63 76 256 568 420 1,536
1990 20052020
Reference2020 High
2030Reference
2030 High
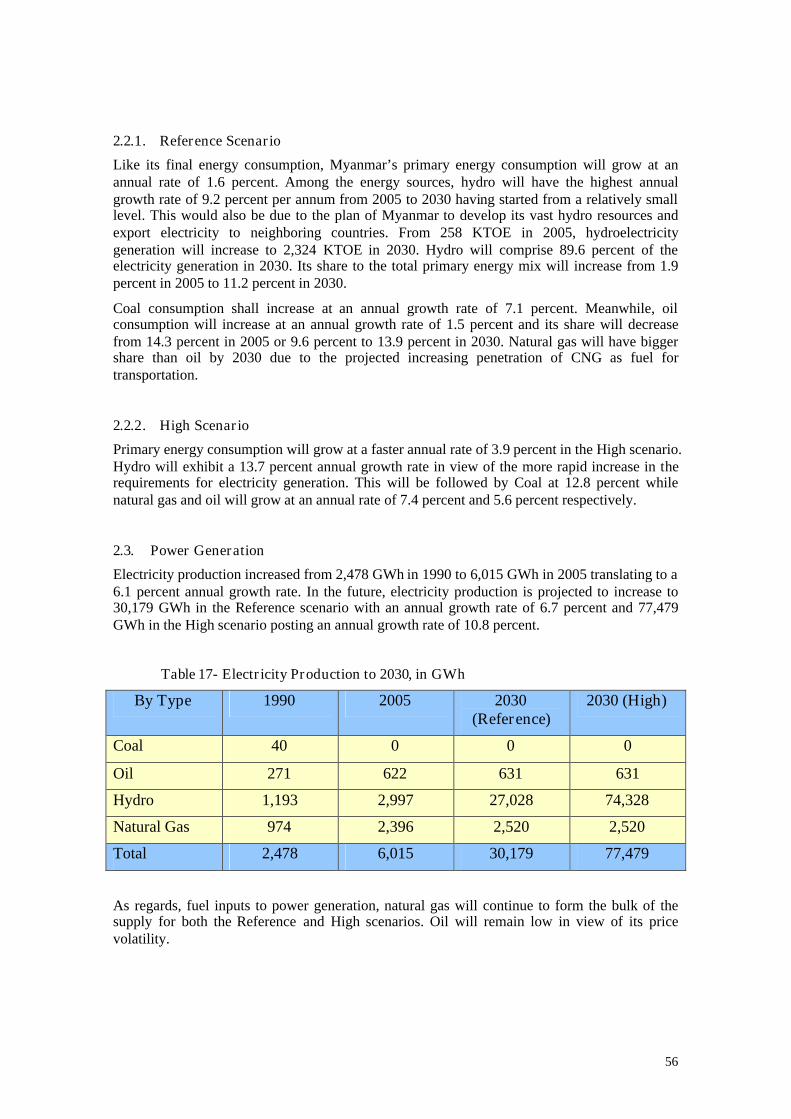
56
2.2.1. Reference Scenario
Like its final energy consumption, Myanmar’s primary energy consumption will grow at anannual rate of 1.6 percent. Among the energy sources, hydro will have the highest annualgrowth rate of 9.2 percent per annum from 2005 to 2030 having started from a relatively smalllevel. This would also be due to the plan of Myanmar to develop its vast hydro resources andexport electricity to neighboring countries. From 258 KTOE in 2005, hydroelectricitygeneration will increase to 2,324 KTOE in 2030. Hydro will comprise 89.6 percent of theelectricity generation in 2030. Its share to the total primary energy mix will increase from 1.9percent in 2005 to 11.2 percent in 2030.
Coal consumption shall increase at an annual growth rate of 7.1 percent. Meanwhile, oilconsumption will increase at an annual growth rate of 1.5 percent and its share will decreasefrom 14.3 percent in 2005 or 9.6 percent to 13.9 percent in 2030. Natural gas will have biggershare than oil by 2030 due to the projected increasing penetration of CNG as fuel fortransportation.
2.2.2. High Scenario
Primary energy consumption will grow at a faster annual rate of 3.9 percent in the High scenario.Hydro will exhibit a 13.7 percent annual growth rate in view of the more rapid increase in therequirements for electricity generation. This will be followed by Coal at 12.8 percent whilenatural gas and oil will grow at an annual rate of 7.4 percent and 5.6 percent respectively.
2.3. Power Generation
Electricity production increased from 2,478 GWh in 1990 to 6,015 GWh in 2005 translating to a6.1 percent annual growth rate. In the future, electricity production is projected to increase to30,179 GWh in the Reference scenario with an annual growth rate of 6.7 percent and 77,479GWh in the High scenario posting an annual growth rate of 10.8 percent.
Table 17- Electricity Production to 2030, in GWh
By Type 1990 2005 2030(Reference)
2030 (High)
Coal 40 0 0 0
Oil 271 622 631 631
Hydro 1,193 2,997 27,028 74,328
Natural Gas 974 2,396 2,520 2,520
Total 2,478 6,015 30,179 77,479
As regards, fuel inputs to power generation, natural gas will continue to form the bulk of thesupply for both the Reference and High scenarios. Oil will remain low in view of its pricevolatility.

57
Table 18 - Fuel Inputs to Power Generation, in KTOE
By Type 1990 2005 2030 (Reference) 2030 (High)
Coal 12 0 0 0
Oil 64 149 151 151
Natural Gas 434 736 774 774
2.4. CO2 Emission Outlook
The projected 1.6 percent growth in primary energy consumption would result to acorresponding 2.5 percent increase in CO2 emission in the Reference scenario. From 2,870thousand tons of Carbon equivalent (kt-C) in 2005, CO2 emission will increase to 5,376 Kt-C in2030.
In the High scenario, CO2 emission will increase at a faster annual rate of 6.8 percent in view ofthe higher primary energy consumption in this scenario. CO2 emission in 2030 is projected toamount to 14,838 kt-C.
Figure 30 – CO2 Emissions to 2030
0
2000
4000
6000
8000
10000
12000
14000
16000
2005
2007
2009
2011
2013
2015
2017
2019
2021
2023
2025
2027
2029
Tho
usa
nd
Met
ric
To
nso
fC
arb
on
Eq
uiv
alen
t(k
t-C
)
High Scena rio Reference Scena rio

58
3. POLICY IMPLICATIONS
Hydropower will play a major role in future power generation. In this regard, there is aneed to develop the existing hydropower potential which would require massiveinvestments.
Demand in transportation will be increasing; use of alternative fuel such as NGV would benecessary.
The country needs more investment for development of energy resource potentialespecially oil and gas to be able to met its future requirements.

59
PHILIPPINES
1. HISTORICAL DEMAND
The Philippines’ total primary energy consumption exhibited an annual growth rate of 3.0percent from 26,158 KTOE in 1990 to 40,580 KTOE in 2005. Although oil accounted for thebiggest share in the primary energy consumption mix – 45.9 percent (1990) and 37.4 percent(2005) – it only grew an annual growth rate of 1.6 percent. Such may be attributed to thereduction of power generation from oil-based power plants (diesel and fuel oil) starting 2000due to retirement of aging oil-fired power plants. Meanwhile, coal and geothermal demonstratedannual growth rates of 10.3 percent and 4.0 percent, respectively which replaced most of the oil-based electricity generation.
Final energy consumption grew at a faster average annual growth rate of 3.7 percent from15,230 KTOE in 1990 to 26,419 KTOE in 2005. The transport sector, the fastest and largestconsuming sector, posted a 9.1 percent average annual growth rate reaching a total energyconsumption of 9,795 KTOE in 2005 from 2,655 KTOE in 1990. Petroleum products comprisedthe bulk of the final energy consumed with 47.8 percent share in 1990 increasing to 51.4 percentin 2005. On the other hand, the industrial sector’s final energy consumption constituted around32.5 percent of the total energy consumption with an annual growth rate of 5.0 percent for thesame period. The aggregate energy consumption of residential and commercial sectorsdecreased at an annual growth rate of 0.3 percent while agriculture remained the least energyintensive sector registering an annual growth rate of 1.4 percent and accounting for only 1.1percent share of the total energy consumption in 2005.
The country’s total power generation reached 56,551 GWh in 2005 from 25,245 GWh in 1990demonstrating 5.5 percent average annual growth rate. In 1990, oil-based power plantsdominated the power generation mix with 46.7 percent share. However, share of oil-basedpower plants gradually reduced to only 10.9 percent in 2005 translating to a negative annualgrowth rate of 4.3 percent, which is attributed to the retirement of aging oil-based power plantswhich were replaced by coal and natural gas-fired electricity generating facilities. Natural gasincreased its contribution in the generation mix starting early 2000 with the start of commercialproduction of Malampaya natural gas field in offshore of Palawan Island. With this, three (3)natural gas-fired power plants were commissioned during the period 2001-2002 with combinedcapacity of 2,700 MW. In 2005, natural gas contributed 29.8 percent to the generation mixequivalent to 16,861 GWh of electricity generated. Meanwhile, power generation from coal-fired power plants ranked second in 2005 with 27.0 percent share to the generation mix frommerely 7.7 percent in 1990. Coal-based power plants generated around 15,257 GWh ofelectricity in 2005 from 1,934 GWh in 1990 registering an annual growth rate of 14.8 percent.
Contribution of geothermal energy in the power generation mix stood at 17.5 percent in 2005with an annual growth rate of 4.0 percent from the 1990 level. On the other hand, generationfrom hydro accounted for a 14.8 percent share in 2005 demonstrating a modest annual growthrate of 2.2 percent for the same period.
In terms of fuel input, coal was the primary fuel used for power generation with a total usage of4,524 KTOE in 2005 from just 466 KTOE in 1990. Natural gas utilization for electricitygeneration reached 2,685 KTOE while use of oil stood at 1,320 KTOE. In 2005, thermalefficiency was recorded at 38.6 percent.

60
2. ENERGY DEMAND AND CO2 EMISSION OUTLOOK
Using the basic assumptions described in the main report, the final energy demand wasprojected with the corresponding primary energy consumption. The CO2 emissions from fossilenergy combustion were also calculated. The results are described below.
2.1. Primary Energy Consumption
2.1.1. Reference Scenario
The country’s primary energy requirements will exhibit an annual growth rate of 3.9 percentfrom 40,580 KTOE in 2005 to 105,726 KTOE in 2030. Among the primary energy sources, coalconsumption is seen to have the highest growth rate at 6.9 percent per annum reaching 29,826KTOE in 2030. Its share to the total primary energy mix will more than double from 14.0percent in 2005 to 28.2 percent in 2030. Being the cheapest fuel, coal will remain as one of theprimary fuels, specifically for power generation. Around 93.0 percent of the coal supply will beused for electricity generation.
Natural gas is expected to grow at an annual growth rate of 5.5 percent for the entire planningperiod. Having certain level of reserves of the energy resource, particularly from theMalampaya gas field, natural gas is expected to increase its contribution in the primary energymix contributing 10,247 KTOE in 2030. Natural gas share in the total primary energyrequirements will increase to 9.7 percent in 2030 from 6.6 percent in 2005, while its share in thepower generation will be at 27.2 percent of the total requirements by the end of the period.
Due to the growing energy demand in the transport sector, oil will grow by an average of 3.4annually until 2030. Its share to overall primary energy mix will remain over 30.0 percent forthe entire planning period. In terms of volume, oil is still the dominant fuel, which will post35,234 KTOE in 2030.
For renewable energy sources, geothermal will grow by 1.8 percent annually, 1.6 percent forhydropower, and 1.8 percent for other sources particularly biomass. The country still haspotential geothermal reserves of about 2,379 MW that can be harnessed to meet the domesticpower requirements.
2.1.2. High Scenario
In the High scenario, total primary energy consumption will grow at an average annual growthrate of 5.2 percent to reach 145,225 KTOE in 2030 from 40,580 KTOE in 2005. Like in theReference scenario, coal will still register the fastest growth in the High scenario at 8.8 percentover the entire period. It will contribute around 47,039 KTOE in 2030, which will be usedprimarily for power generation.
Natural gas will exhibit the second highest growth rate at 7.6 percent. Natural gas resource willboost its significant share in the total primary energy mix to contribute 16,623 KTOE in 2030.The primary consumption level at the end of the planning period will bring natural gas as thethird leading primary fuel in terms of contribution dislodging geothermal energy.
Oil will grow at 4.9 percent, up by 1.5 percentage points from the Reference scenario growthrate. Similarly, oil still is the leading fuel by volume throughout the period contributing 50,587KTOE in 2030. Around 70.0 percent of the total oil requirements will be used mostly by thetransport sector.

61
Meanwhile, geothermal, hydro and other renewable energy resources will grow at 1.8 percentand 1.6 percent annual rates in both scenarios. Geothermal will register the third largest sharewithin 2006 to 2020 in the primary energy mix. The greater utilization of geothermal isprimarily due to the government’s goal to become the world’s largest geothermal energyproducer. Hydropower will have the lowest contribution among the energy sources contributingonly 1,076 KTOE in 2030. Other non-commercial fuels, such as biomass resources, willcontinue to play an important role in the country’s primary energy mix. Biomass resources aremostly used in the rural areas that have abundant supply, specifically in the residential sector.Some industries that produce biomass waste are expected to utilize such energy for own theirenergy requirements.
Figure 31 - Primary Energy Consumption in MTOE
0
20
40
60
80
100
120
140
160
Mto
e
Others 7.6 7.8 11.0 11.3 12.2 13.0
Geothermal 4.7 8.5 13.2 13.2 13.2 13.2
Hydro 0.5 0.7 1.0 1.0 1.1 1.1
Nuclear 0.0 0.0 0.0 0.0 3.9 3.8
Natural gas 0.0 2.7 6.1 7.5 10.2 16.6
Oil 12.0 15.2 25.2 29.9 35.2 50.6
Coal 1.3 5.7 18.7 24.7 29.8 47.0
1990 20052020
Reference2020 High
2030Reference
2030 High
2.2. Final Energy Consumption
2.2.1. Reference Scenario
Following the socio-economic assumptions as presented in the previous discussion, final energyconsumption in the Philippines will grow at an annual growth rate of 3.7 percent from 2005 to2030. With increasing per capita income as well as private and public spending, combinedresidential and commercial sectors’ energy consumption will be expected to post an annualgrowth rate of 4.3 percent. Total energy consumption of the sectors will reach 23,254 KTOE in2030 accounting for about 35.5 percent share of the country’s total energy demand.
On the other hand, energy demand of the transport sector – the largest consuming sector – isforecasted to increase by 3.8 percent annually registering 37.9 percent share to the final energyrequirements in 2030. The industrial sector performance will reflect a 2.9 percent annual growthrate. Being the least energy-intensive sector, the agriculture sector is expected to register a

62
modest annual growth rate of 1.4 percent for the entire period using up less than 1.0 percent ofthe country’s total energy consumption.
Figure 32 - Final Energy Demand by Sector in MTOE
0
10
20
30
40
50
60
70
80
90
100
Mto
e
Others 8.4 8.0 15.4 17.6 23.3 31.3
Transport 2.7 9.8 17.9 21.9 24.9 37.0
Industry 4.1 8.6 13.6 14.8 17.4 21.6
1990 2005 2020Reference
2020 High 2030Reference
2030 High
Among the energy sources, electricity will have the fastest growth rate at 5.9 percent per annum,which may be attributed to increasing economic activities and per capita income, as well asgrowing population. Its share in the total final energy consumption will increase from 14.7percent in 2005 to 24.8 percent in 2030. On the other hand, oil will demonstrate the secondhighest annual growth rate at 3.9 percent and will remain as the largely consumed fuelparticularly for the transport sector. Its share in the total final energy consumption will continueto be over 50.0 percent over the planning period.
Coal consumption will grow at an annual growth rate of 2.5 percent due to the projected growthof industrial production, particularly the cement and related-industries. However, the share ofcoal to the total energy consumption is seen to decrease over the period from 4.4 percent in2005 to 3.2 percent in 2030. Such decrease may be attributed to more efficient technologiesbeing utilized by cement and other related-industries. Meanwhile, biomass consumption is seento register the lowest annual growth rate at 1.8 percent due to expected fuel switching frombiomass to conventional fuels – specifically by the residential sector – as an effect ofurbanization. Its share to the total final energy consumption will decrease from 29.5 percent in2005 to 18.7 in 2030
2.2.2. High Scenario
The country’s final energy consumption in the High scenario is estimated to increase at anannual growth rate of 5.0 percent over the planning horizon. Combined energy consumption ofthe residential and commercial sectors will also display the fastest growth rate among thesectors at 5.6 percent per annum for the same reason stated in the Reference scenario.
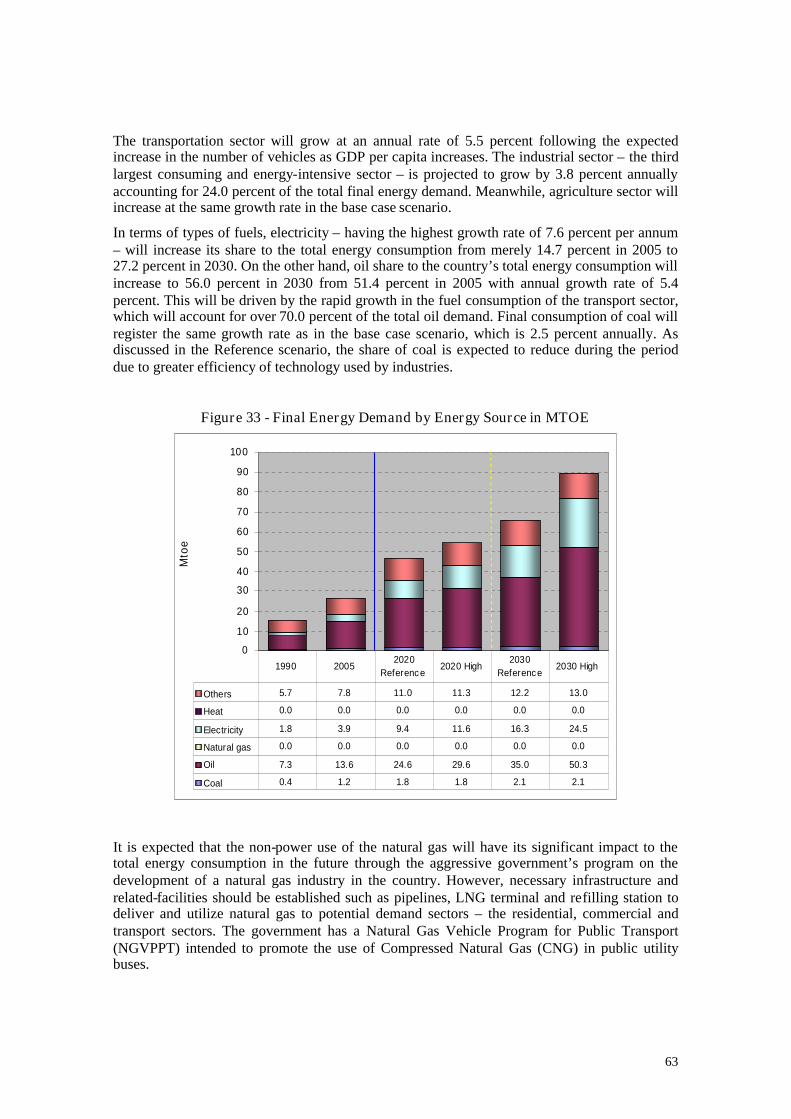
63
The transportation sector will grow at an annual rate of 5.5 percent following the expectedincrease in the number of vehicles as GDP per capita increases. The industrial sector – the thirdlargest consuming and energy-intensive sector – is projected to grow by 3.8 percent annuallyaccounting for 24.0 percent of the total final energy demand. Meanwhile, agriculture sector willincrease at the same growth rate in the base case scenario.
In terms of types of fuels, electricity – having the highest growth rate of 7.6 percent per annum– will increase its share to the total energy consumption from merely 14.7 percent in 2005 to27.2 percent in 2030. On the other hand, oil share to the country’s total energy consumption willincrease to 56.0 percent in 2030 from 51.4 percent in 2005 with annual growth rate of 5.4percent. This will be driven by the rapid growth in the fuel consumption of the transport sector,which will account for over 70.0 percent of the total oil demand. Final consumption of coal willregister the same growth rate as in the base case scenario, which is 2.5 percent annually. Asdiscussed in the Reference scenario, the share of coal is expected to reduce during the perioddue to greater efficiency of technology used by industries.
Figure 33 - Final Energy Demand by Energy Source in MTOE
0
10
20
30
40
50
60
70
80
90
100
Mto
e
Others 5.7 7.8 11.0 11.3 12.2 13.0
Heat 0.0 0.0 0.0 0.0 0.0 0.0
Electricity 1.8 3.9 9.4 11.6 16.3 24.5
Natural gas 0.0 0.0 0.0 0.0 0.0 0.0
Oil 7.3 13.6 24.6 29.6 35.0 50.3
Coal 0.4 1.2 1.8 1.8 2.1 2.1
1990 20052020
Reference2020 High
2030Reference
2030 High
It is expected that the non-power use of the natural gas will have its significant impact to thetotal energy consumption in the future through the aggressive government’s program on thedevelopment of a natural gas industry in the country. However, necessary infrastructure andrelated-facilities should be established such as pipelines, LNG terminal and refilling station todeliver and utilize natural gas to potential demand sectors – the residential, commercial andtransport sectors. The government has a Natural Gas Vehicle Program for Public Transport(NGVPPT) intended to promote the use of Compressed Natural Gas (CNG) in public utilitybuses.
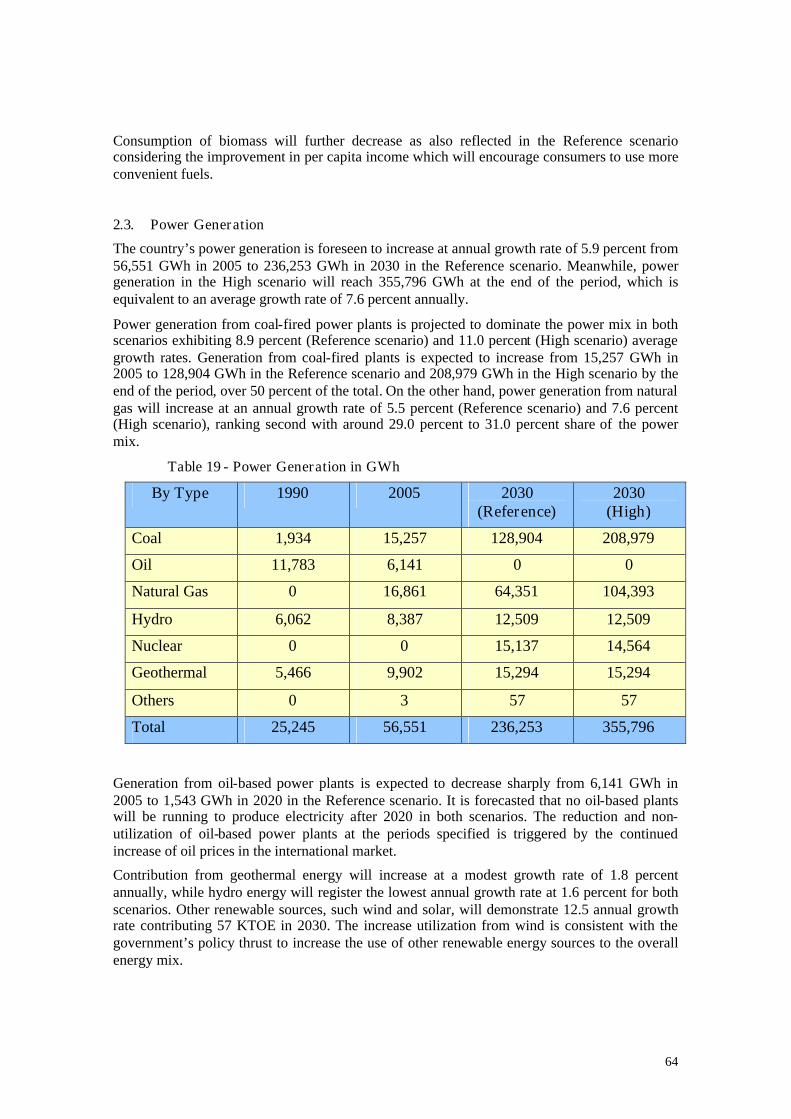
64
Consumption of biomass will further decrease as also reflected in the Reference scenarioconsidering the improvement in per capita income which will encourage consumers to use moreconvenient fuels.
2.3. Power Generation
The country’s power generation is foreseen to increase at annual growth rate of 5.9 percent from56,551 GWh in 2005 to 236,253 GWh in 2030 in the Reference scenario. Meanwhile, powergeneration in the High scenario will reach 355,796 GWh at the end of the period, which isequivalent to an average growth rate of 7.6 percent annually.
Power generation from coal-fired power plants is projected to dominate the power mix in bothscenarios exhibiting 8.9 percent (Reference scenario) and 11.0 percent (High scenario) averagegrowth rates. Generation from coal-fired plants is expected to increase from 15,257 GWh in2005 to 128,904 GWh in the Reference scenario and 208,979 GWh in the High scenario by theend of the period, over 50 percent of the total. On the other hand, power generation from naturalgas will increase at an annual growth rate of 5.5 percent (Reference scenario) and 7.6 percent(High scenario), ranking second with around 29.0 percent to 31.0 percent share of the powermix.
Table 19 - Power Generation in GWh
By Type 1990 2005 2030(Reference)
2030(High)
Coal 1,934 15,257 128,904 208,979
Oil 11,783 6,141 0 0
Natural Gas 0 16,861 64,351 104,393
Hydro 6,062 8,387 12,509 12,509
Nuclear 0 0 15,137 14,564
Geothermal 5,466 9,902 15,294 15,294
Others 0 3 57 57
Total 25,245 56,551 236,253 355,796
Generation from oil-based power plants is expected to decrease sharply from 6,141 GWh in2005 to 1,543 GWh in 2020 in the Reference scenario. It is forecasted that no oil-based plantswill be running to produce electricity after 2020 in both scenarios. The reduction and non-utilization of oil-based power plants at the periods specified is triggered by the continuedincrease of oil prices in the international market.
Contribution from geothermal energy will increase at a modest growth rate of 1.8 percentannually, while hydro energy will register the lowest annual growth rate at 1.6 percent for bothscenarios. Other renewable sources, such wind and solar, will demonstrate 12.5 annual growthrate contributing 57 KTOE in 2030. The increase utilization from wind is consistent with thegovernment’s policy thrust to increase the use of other renewable energy sources to the overallenergy mix.
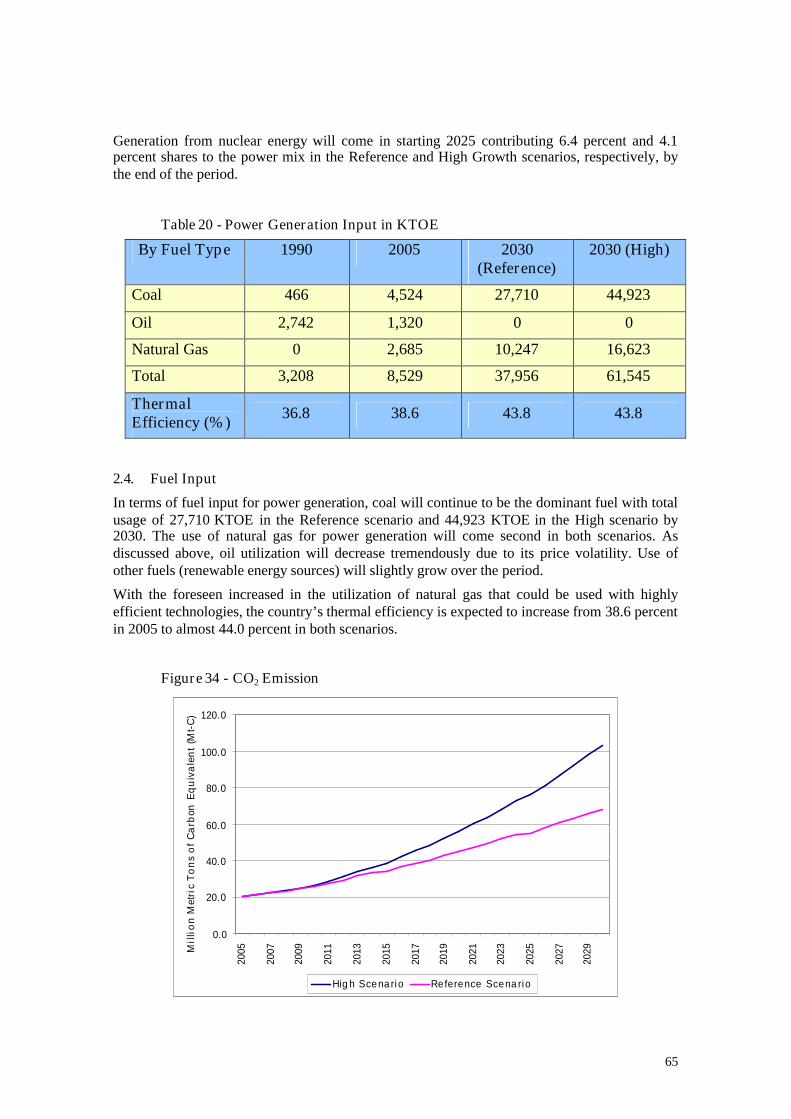
65
Generation from nuclear energy will come in starting 2025 contributing 6.4 percent and 4.1percent shares to the power mix in the Reference and High Growth scenarios, respectively, bythe end of the period.
Table 20 - Power Generation Input in KTOE
By Fuel Type 1990 2005 2030(Reference)
2030 (High)
Coal 466 4,524 27,710 44,923
Oil 2,742 1,320 0 0
Natural Gas 0 2,685 10,247 16,623
Total 3,208 8,529 37,956 61,545
ThermalEfficiency (%) 36.8 38.6 43.8 43.8
2.4. Fuel Input
In terms of fuel input for power generation, coal will continue to be the dominant fuel with totalusage of 27,710 KTOE in the Reference scenario and 44,923 KTOE in the High scenario by2030. The use of natural gas for power generation will come second in both scenarios. Asdiscussed above, oil utilization will decrease tremendously due to its price volatility. Use ofother fuels (renewable energy sources) will slightly grow over the period.
With the foreseen increased in the utilization of natural gas that could be used with highlyefficient technologies, the country’s thermal efficiency is expected to increase from 38.6 percentin 2005 to almost 44.0 percent in both scenarios.
Figure 34 - CO2 Emission
0.0
20.0
40.0
60.0
80.0
100.0
120.0
2005
2007
2009
2011
2013
2015
2017
2019
2021
2023
2025
2027
2029M
illi
on
Met
ric
To
ns
of
Ca
rbon
Eq
uiv
ale
nt
(Mt-
C)
High Scenario Reference Scena rio

66
2.5. CO2 Emissions
CO2 emissions per unit of primary energy consumption will grow at an annual average growthrate of 1.0 percent in the Reference scenario and 1.4 percent in the High Growth scenario. From0.50 tons of Carbon/TOE in 2005, CO2 emission is forecasted to gradually escalate to 0.64 and0.71 tons of Carbon/TOE in the Reference and High scenarios, respectively, by 2030 due tohigher requirements for fossil fuels. However, the increase in CO2 emission per unit of primaryenergy consumption will be modest with intensified utilization of natural gas – a cleaner fuelcompared with other fossil fuels. In terms of quantity, CO2 will grow by 4.9 percent (Referencescenario) and 6.7 percent (High scenario) over the 25-year period
3. KEY FINDINGS AND POLICY IMPLICATIONS
3.1. Key Findings
The following key findings were derived from the results:
Coal share in the supply mix is expected to increase from 14.0 percent in 2005 to 28.2percent (Reference scenario) and 32.4 percent (High scenario) in 2030, while renewableenergy sources, such as geothermal, hydro and biomass, shall decrease from 42.0 percent to25.0 percent (Reference scenario) and 18.7 percent (High scenario) for the same period.
Final energy demand shall increase at average annual growth rates of 3.7 percent (Referencescenario) and 5.0 percent (High scenario) with residential/commercial sector demonstratingthe highest annual growth rates of 4.3 percent (Reference scenario) and 5.6 percent (Highscenario). Share of the non-energy intensive sectors shall have an increasing share in thefinal energy demand.
The transport sector’s final energy demand shall register an average annual growth rate of3.8 percent (Reference scenario) and 5.4 percent (High scenario) and shall account for about37.9 percent (Reference scenario) and 41.1 percent (High scenario) shares to the total finalenergy demand. Meanwhile, the industry sector shall post 2.9 percent (Reference scenario)and 3.8 percent (High scenario) annual growth rates.
For power generation, coal shall be expected to increase its share from 27.0 percent in 2005to 54.6 percent (Reference scenario) and 58.7 percent (High scenario) in 2030. Natural gasshall exhibit annual growth rates of 5.5 percent (Reference scenario) and 7.6 percent (Highscenario) and shall contribute about 30.0 percent to the total generation mix.
Increased utilization of fossil fuels, specifically coal, shall increase CO2 emission at annualgrowth rates of 4.9 percent (Reference scenario) and 6.7 percent (High scenario).
3.2. Policy Implications
From these findings, the following policy implications were drawn:
There is a need to intensify the promotion of clean energy sources such as renewable energy,alternative fuels and nuclear energy.
The Philippines has still available geothermal reserves of about 2,379 MW, while there arevast hydro and wind potentials to be developed. Biomass and solar energy should likewisebe harnessed to increase the contribution of renewable energy to the supply mix. To
67
encourage more private sector investment in the development of renewable energy, it isimportant that the government should pursue the passage of the Renewable Energy Bill toprovide greater incentives and create an investment-friendly climate for renewable energy.
The government needs to accelerate its alternative fuels programs such as biofuel, CNG andother available technology (e.g., hybrid). Essential in advancing said programs is theavailability of infrastructure and other related-facilities like production and refineryfacilities for bio-fuel feedstock, receiving terminals, and distribution facility.
Feasibility and technical studies should be undertaken to determine the nuclear option forthe Philippines. Information, Education and Communication (IEC) campaign must also becarried out to determine public acceptance on nuclear energy.
There is a need to strengthen efforts on energy efficiency and conservation program toaddress the growing sectoral demand. It is therefore necessary to work on the passage of theEnergy Efficiency and Conservation Bill to institutionalize such program to all sectors,specifically for residential and commercial sectors.
There is a need for a policy to promote the use of clean coal technology to reduce CO2
emission and other atmospheric pollutants from coal-fired power plants.
There is also a need to increase the use of indigenous energy sources such as low-grade coalto reduce dependence on imported energy. The Philippine Energy Contracting Round(PECR) should be continuously implemented to promote exploration and development foroil and gas, coal and other indigenous energy sources. A clear program on the utilization oflocal coal must be formulated and introduced.

68

69
SINGAPORE
1. BACKGROUND
Singapore is an island city-state located in South-East Asia. It has a total land area of 699.4square kilometers and a population of 4.3 million in 2005. The population increased from about3.05 million in 1990, which is an annual average growth rate of 2.4 percent. It is expected thatin the future, the population growth will be lower than it has been in the past 15 years.
Although Singapore is small in terms of land area and population, its economy has seen rapidgrowth making the country one of the most industrialized and urbanized in South-East Asia.For the period 1990 to 2005 Singapore’s GDP grew at an average rate of 6.3 percent per annum.In 1990, the GDP was 44.7 billions of 2000 US$ and in 2005 it increased to 112.8 billions. TheGDP per capita grew at a rate of 3.9 percent per annum, from 14.7 thousands USD/person in1990 to 26.0 thousands USD/person in 2005. For the period 2005-2030, it is expected that asSingapore’s economy matures, the GDP will grow at a slower rate when compared to the period1990-2005.
Singapore has no indigenous energy resources. However, Singapore is a major oil- refiningcentre for the South-East Asia region and is a major exporter of petroleum products. Singaporeimports natural gas from Malaysia and Indonesia for power generation. By 2012 Singapore willhave a LNG terminal with the initial capacity of 3 million tonnes per annum servingSingapore’s rising demands for energy.
2. ENERGY DEMAND AND CO2 EMISSION OUTLOOK
2.1. Final Energy Consumption
The total final energy consumption of Singapore grew at an average annual growth rate of 5.7percent, from about 6,839 KTOE in 1990 to 15,616 KTOE in 2005. The total final energyconsumption in the industrial sector, which consumed the largest portion of energy, grew at anaverage rate of 6.9 percent per annum. Energy consumption in domestic sector, althoughconsuming only about 5.9 percent to total energy consumption in 2005, grew at an averageannual rate of 5.5 percent from 1990 to 2005. The commercial sector energy consumption grewat an average rate of 7.1 percent per annum. The total energy consumption in the transportsector saw an average annual rate of 3.8 percent for the period from 1990 to 2005.
2.1.1. Reference Scenario
Using the socio-economic assumptions as stated in the previous discussion, the final energyconsumption in the Singapore is projected to grow at an annual growth rate of 2.7 percent from2005 to 2030 in the Reference scenario. For the simulation period, the industrial sector finalenergy consumption is expected to increase at an average annual growth rate of 2.2 percentwhile the transport sector energy consumption is projected to increase at an average annualgrowth rate of 3.1 percent. The combined commercial and residential sectors final energyconsumption is expected to increase at an average annual growth rate of 3.4 percent by the endof the planning period, 2030 (see Fig. 35). The relatively high growth in the combined

70
commercial and domestic sectors could probably be due to the relatively high increase in percapita income.
Figure 35– Projected Final Energy Consumption by Sector
0
5,000
10,000
15,000
20,000
25,000
30,000
35,000
40,000
ktoe
Others 666 2,010 3,307 3,750 4,656 5,814
Trans po rt 3,258 5,714 9,276 10,734 12,344 15,544
Indus try 2,915 7,892 10,335 10,617 13,691 14,426
1990 20052020
Re ference2020 High
2030Re ference
2030 High
Figure 36– Final Energy Consumption by Energy Type
0
5,000
10,000
15,000
20,000
25,000
30,000
35,000
40,000
ktoe
Others 0 0 0 0 0 0
Hea t 0 0 0 0 0 0
Electric ity 1,082 2,786 4,845 5,571 7,040 8,932
Natural gas 0 0 0 0 0 0
Oil 5,757 12,830 18,072 19,531 23,652 26,851
Coa l 0 0 0 0 0 0
1990 20052020
Reference2020 High
2030Reference
2030 High
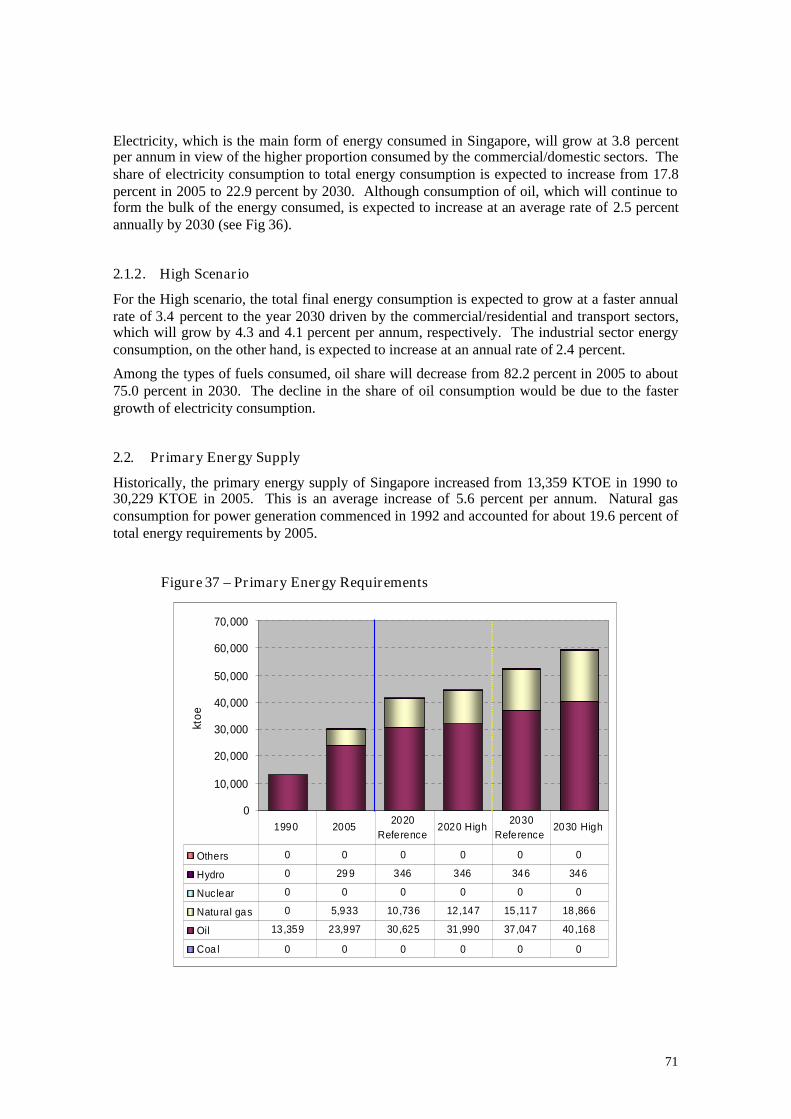
71
Electricity, which is the main form of energy consumed in Singapore, will grow at 3.8 percentper annum in view of the higher proportion consumed by the commercial/domestic sectors. Theshare of electricity consumption to total energy consumption is expected to increase from 17.8percent in 2005 to 22.9 percent by 2030. Although consumption of oil, which will continue toform the bulk of the energy consumed, is expected to increase at an average rate of 2.5 percentannually by 2030 (see Fig 36).
2.1.2. High Scenario
For the High scenario, the total final energy consumption is expected to grow at a faster annualrate of 3.4 percent to the year 2030 driven by the commercial/residential and transport sectors,which will grow by 4.3 and 4.1 percent per annum, respectively. The industrial sector energyconsumption, on the other hand, is expected to increase at an annual rate of 2.4 percent.
Among the types of fuels consumed, oil share will decrease from 82.2 percent in 2005 to about75.0 percent in 2030. The decline in the share of oil consumption would be due to the fastergrowth of electricity consumption.
2.2. Primary Energy Supply
Historically, the primary energy supply of Singapore increased from 13,359 KTOE in 1990 to30,229 KTOE in 2005. This is an average increase of 5.6 percent per annum. Natural gasconsumption for power generation commenced in 1992 and accounted for about 19.6 percent oftotal energy requirements by 2005.
Figure 37 – Primary Energy Requirements
0
10,000
20,000
30,000
40,000
50,000
60,000
70,000
ktoe
Others 0 0 0 0 0 0
Hydro 0 29 9 346 346 346 346
Nuclear 0 0 0 0 0 0
Natural gas 0 5,933 10,736 12,147 15,117 18 ,866
Oil 13,359 23,997 30,625 31,990 37,047 40,168
Coa l 0 0 0 0 0 0
1990 20052020
Reference2020 High
2030Reference
2030 High

72
2.2.1. Reference Scenario
Singapore’s primary energy consumption is expected to grow at an annual rate of 2.2 percent.Consumption of natural gas is expected to increase at an annual growth rate of 3.8 percent perannum from 2005 to 2030, with its share to the total primary energy consumption mixincreasing from 19.6 percent in 2005 to 28.8 percent by 2030. The increase in consumption ofnatural gas over the next 25 years is largely due to the use of natural gas as fuel in the powergeneration sector.
It is also expected that natural gas will be consumed in the industrial, commercial andresidential sectors with the development of natural gas pipeline infrastructure within the island.The high demand for natural gas will be possible with the completion of the LNG terminal by2012 at an initial capacity of 3 million tonnes per annum (mtpa). This capacity is expected toincrease to about 6 mtpa by 2018.
Consumption of oil is expected to increase at an average annual rate of 1.8 percent by 2030, inview of the increasing consumption of the transport sector. The other form of energy, which ismunicipal solid waste (mostly used in incineration plants) is expected to increase at a growthrate of 0.6 percent over the simulation period.
2.2.2. High Scenario
Natural gas in the High scenario is expected to increase at a faster rate, 4.7 percent, comparedwith the Reference scenario, 3.8 percent, by the end of the planning period, 2030. Natural gas isexpected to be used mostly for power generation. Oil is also expected to increase at a fastergrowth rate, at 2.1 percent when compared with the Reference scenario.
2.3. Power Generation
Electricity production increased from 15,714 GWh in 1990 to 38,213 GWh in 2005. This isequivalent to an average annual growth rate of 6.1 percent over this period. Based on thesimulation assumptions over the period 2005-2030, electricity production is expected toincrease to 93,301 GWh in the Reference with an annual growth rate of 3.6 percent and117,500 GWh in the High scenario posting an annual growth rate of 4.6 percent.
Table 21 - Electricity Production to 2030, in GWh
By Type 1990 2005 2030(Reference)
2030 (High)
Thermal (oil) 15,714 8,637 7,689 7,334
Natural Gas 0 28,430 84,283 108,836
MSW 0 1,146 1,330 1,330
Total 15,714 38,213 93,301 117,500
With regard to the fuel inputs to power generation, natural gas consumption will continue toform the bulk of the fuel consumed for power generation for both the Reference and Highscenarios. Consumption of oil will remain low and will not increase in view of its pricevolatility. Supply from other fuels such as alternative resources is likewise not expected to grow

73
substantially.
Table 22 - Fuel Inputs to Power generation, in KTOE
By Type 1990 2005 2030(Reference)
2030(High)
Oil 4,414 1,904 1,695 1,617
Gas 0.00 5,933 15,117 18,866
Overall ThermalEfficiency (%)
30.6 39.4 47.0 48.8
In view of the increasing utilization of natural gas, which will be used in new and more efficienttechnologies such as CCGTs, cogeneration and trigeneration for power generation, overallthermal efficiency of Singapore is expected to increase from 39.4 percent in 2005 to 47.0percent in 2030 in the Reference scenario and 48.8 percent in the High scenario.
Figure 38 – CO2 Emission to 2030 in the Reference and High Growth Scenarios
0.0
5.0
10.0
15.0
20.0
25.0
30.0
35.0
200
5
200
7
200
9
201
1
201
3
201
5
201
7
201
9
202
1
202
3
202
5
202
7
202
9Mil
lion
Met
ric
To
nso
fC
arb
on
Eq
uiva
len
t(M
t-C
)
High Scena rio Reference Scena rio
2.4. CO2 Emissions
With the projected 2.2 percent growth in primary energy consumption from 2005 to 2030,Singapore’s CO2 emission from energy combustion is projected to increase at a faster rate of 2.6percent from 13,280 thousand tons of Carbon equivalent (kt-C) in 2005 to 25,217 kt-C in 2030.This is due to the assumption that Singapore will continue to be a major oil refining andpetroleum products exporting country. The process of oil refining also consumes fuels that emitCO2 to the atmosphere.

74
In the High scenario, the 2.7 percent average annual growth rate of primary energy consumptionwill have a corresponding 3.3 percent growth rate in CO2 emission to 30,170 kt-C in 2030.
3. FINDINGS AND POLICY IMPLICATIONS
Historically, the energy intensity for the period 1990 to 2005 has improved by 10.4 percent from299 TOE/million USD to 268 TOE/million USD. This is in part due to the one-offimprovement in fuel mix, where natural gas replaced fuel oil as the dominant feedstock forpower generation. Going forward, the trend of energy intensity in Singapore over the period2005 to 2030 is expected to be between 155 TOE/million USD (High scenario) and 176TOE/million USD (Reference scenario). Improvements to energy efficiency will remain one ofthe cornerstones of Singapore’s energy policy. Diversification of fuels as well as diversificationof sources of fuels will be emphasized to improve energy security. Singapore thus remains astrong supporter of transparent and open international energy markets. Lastly, commitment toresearch & development, financing and test bedding new energy technologies including cleanand renewable energy will help increase policy options in the future. We believe that solutionsto the many energy challenges faced by Singapore and the region will be resolved with thedevelopment and application of new technologies.
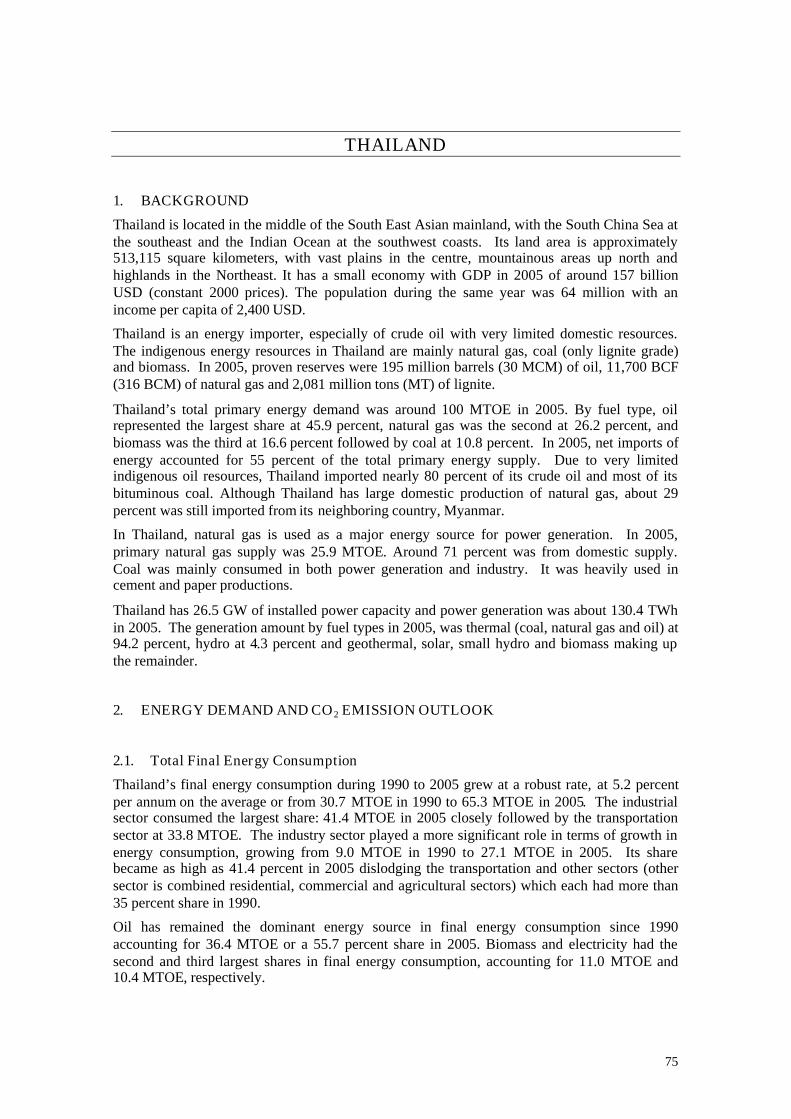
75
THAILAND
1. BACKGROUND
Thailand is located in the middle of the South East Asian mainland, with the South China Sea atthe southeast and the Indian Ocean at the southwest coasts. Its land area is approximately513,115 square kilometers, with vast plains in the centre, mountainous areas up north andhighlands in the Northeast. It has a small economy with GDP in 2005 of around 157 billionUSD (constant 2000 prices). The population during the same year was 64 million with anincome per capita of 2,400 USD.
Thailand is an energy importer, especially of crude oil with very limited domestic resources.The indigenous energy resources in Thailand are mainly natural gas, coal (only lignite grade)and biomass. In 2005, proven reserves were 195 million barrels (30 MCM) of oil, 11,700 BCF(316 BCM) of natural gas and 2,081 million tons (MT) of lignite.
Thailand’s total primary energy demand was around 100 MTOE in 2005. By fuel type, oilrepresented the largest share at 45.9 percent, natural gas was the second at 26.2 percent, andbiomass was the third at 16.6 percent followed by coal at 10.8 percent. In 2005, net imports ofenergy accounted for 55 percent of the total primary energy supply. Due to very limitedindigenous oil resources, Thailand imported nearly 80 percent of its crude oil and most of itsbituminous coal. Although Thailand has large domestic production of natural gas, about 29percent was still imported from its neighboring country, Myanmar.
In Thailand, natural gas is used as a major energy source for power generation. In 2005,primary natural gas supply was 25.9 MTOE. Around 71 percent was from domestic supply.Coal was mainly consumed in both power generation and industry. It was heavily used incement and paper productions.
Thailand has 26.5 GW of installed power capacity and power generation was about 130.4 TWhin 2005. The generation amount by fuel types in 2005, was thermal (coal, natural gas and oil) at94.2 percent, hydro at 4.3 percent and geothermal, solar, small hydro and biomass making upthe remainder.
2. ENERGY DEMAND AND CO2 EMISSION OUTLOOK
2.1. Total Final Energy Consumption
Thailand’s final energy consumption during 1990 to 2005 grew at a robust rate, at 5.2 percentper annum on the average or from 30.7 MTOE in 1990 to 65.3 MTOE in 2005. The industrialsector consumed the largest share: 41.4 MTOE in 2005 closely followed by the transportationsector at 33.8 MTOE. The industry sector played a more significant role in terms of growth inenergy consumption, growing from 9.0 MTOE in 1990 to 27.1 MTOE in 2005. Its sharebecame as high as 41.4 percent in 2005 dislodging the transportation and other sectors (othersector is combined residential, commercial and agricultural sectors) which each had more than35 percent share in 1990.
Oil has remained the dominant energy source in final energy consumption since 1990accounting for 36.4 MTOE or a 55.7 percent share in 2005. Biomass and electricity had thesecond and third largest shares in final energy consumption, accounting for 11.0 MTOE and10.4 MTOE, respectively.

76
2.1.1. Reference Scenario
Given the assumptions discussed in the main part of this report, final energy consumption isprojected to grow at the moderate rate of around 4.0 percent per annum during the period 2005-2030. The transportation and industry sectors are projected to remain to have the largest sharesin final energy consumption of 43.0 percent and 35.0 percent, respectively in 2030. By fueltype in this projection, oil is projected to remain the largest in the next 25 years until 2030.However, its growth rate is projected to decline from 5.3 percent per annum during 1990-2005to 4.0 percent per annum during 2005-2030 lower than the growth rates of natural gas,electricity and coal which will grow at annual rates of 6.4 percent, 4.8 percent and 4.7 percent,respectively. The shares of natural gas, electricity and coal in final energy consumption areprojected to increase from 2005 levels of 2.8 percent, 15.9 percent and 8.8 percent to 2030levels of 5.1 percent, 19.4 percent and 10.5 percent, respectively.
Figure 39 – Final Energy Consumption by Sector to 2030
0
50
100
150
200
250
Mto
e
Others 10.8 16.2 28.8 30.5 38.2 42.0
Transport 10.9 22.1 46.0 53.2 74.5 91.2
Indus try 9.0 27.1 41.9 46.0 60.6 70.7
1990 20052020
Reference2020 High
2030Reference
2030 High
2.1.2. High Scenario
In the High scenario, final energy consumption is projected to grow at 4.7 percent per annumwith the assumed GDP growth rate of 5.7 percent per annum. From 65.3 MTOE in 2005, finalenergy consumption is projected to increase to 203.9 MTOE in 2030. Like in the Referencescenario, the highest growth will be in the demand of the transportation sector which willincrease at an annual rate of 5.8 percent. The industrial and other sectors will grow at identicalaverage annual rates of 3.9 percent.

77
Figure 40 – Final Energy Consumption by Fuel Type to 2030
0
50
100
150
200
250M
toe
Others 9.2 11.0 16.1 15.6 15.9 14.7
Heat 0.0 0.0 0.0 0.0 0.0 0.0
Electric ity 3.3 10.4 21.0 24.4 33.7 42.0
Natural gas 0.2 1.9 6.6 6.6 8.8 8.8
Oil 16.7 36.4 62.0 70.2 96.7 115.6
Coal 1.3 5.7 11.0 12.9 18.1 22.7
1990 2005 2020Reference
2020 High 2030Reference
2030 High
2.2. Primary Energy Demand
Primary energy demand grew at a very fast rate at an average of 5.6 percent per annum from43.9 MTOE in 1990 to 98.9 MTOE in 2005 due to fast economic development during 1990-1996. This growth rate was achieved even though there was a severe economic crisis between1997 and 1998 and a slow recovery during 1999-2005. In 2005, major sources of primaryenergy were oil, natural gas and coal with shares of 45.9 percent, 26.2 percent and 10.8 percentrespectively. Oil remained the largest source during 1990-2005 with its share remainingconstant at over 45 percent. Natural gas, which is mainly consumed in the power generationsector, became an important source of energy with its share increasing from 11.6 percent in1990 to 26.2 percent in 2005. Hydropower remained constant at around 0.4 to 0.5 MTOE from1990 to 2005.
2.2.1. Reference Scenario
In the Reference scenario, primary energy demand is projected to grow moderately at about 3.8percent per annum in the next 25 year period from 2005 to 2030, reaching about 251.6 MTOEin 2030. The highest yearly growth rate will occur in coal, 5.9 percent on average to reach 44.4MTOE in 2030. Oil consumption will increase from 45.4 MTOE in 2005 to 117.2 MTOE in2030 or at an annual rate of 3.9 percent. Natural gas is predicted to grow at about 3.7 percent onaverage per year, compared to growth rate of 11.5 percent per year between 1990 and 2005.

78
2.2.2. High Scenario
In the High scenario, primary energy demand would have a faster rate of growth than in theReference scenario at 4.4 percent per annum (compared with 3.8 percent in the Reference case)to reach 291.6 MTOE in 2030 resulting from higher GDP growth assumption.
Coal consumption will have the fastest growth rate of 6.8 percent from 10.6 MTOE in 2005 to55.4 MTOE in 2030 brought about by the consumption of this fuel for electricity generation.Natural gas is projected to increase from 25.9 MTOE in 2005 to 77.3 MTOE in 2030, which is4.5 percent growth rate per year on average. Oil is also projected to increase from 45.4 MTOEin 2005 to 136.1 MTOE in 2030, which is also an annual increase on average of about 4.5percent.
Figure 41 – Primary Energy Consumption by Energy to 2030
0
50
100
150
200
250
300
350
Mto
e
Others 14.7 16.4 25.9 25.1 24.4 22.3
Hydro 0.4 0.5 0.5 0.5 0.5 0.5
Nuclear 0.0 0.0 0.0 0.0 0.0 0.0
Natural gas 5.1 25.9 44.8 50.0 65.1 77.3
Oil 19.8 45.4 76.4 84.5 117.2 136.1
Coal 3.8 10.6 26.4 30.8 44.4 55.4
1990 2005 2020Reference
2020 High 2030Reference
2030 High
2.3. CO2 Emissions from Energy Consumption
CO2 emissions from energy consumption are projected to increase by 4.6 percent per year onaverage from 57.3 metric tons of Carbon equivalent (Mt-C) in 2005 to 177.0 Mt-C in 2030 inthe Reference scenario. This growth is higher than the projected 3.8 percent growth rate of thetotal primary energy consumption due to the foreseen continuous consumption of coal forelectricity generation.
In the High scenario, the average annual change in CO2 emissions from 2005 to 2030 isprojected to be about 5.4 percent. Like in the Reference scenario, this growth rate is also higherthan the growth rate of total primary energy consumption of 4.4 percent due to the same reason,the faster growth of coal consumption relative to the other forms of energy.
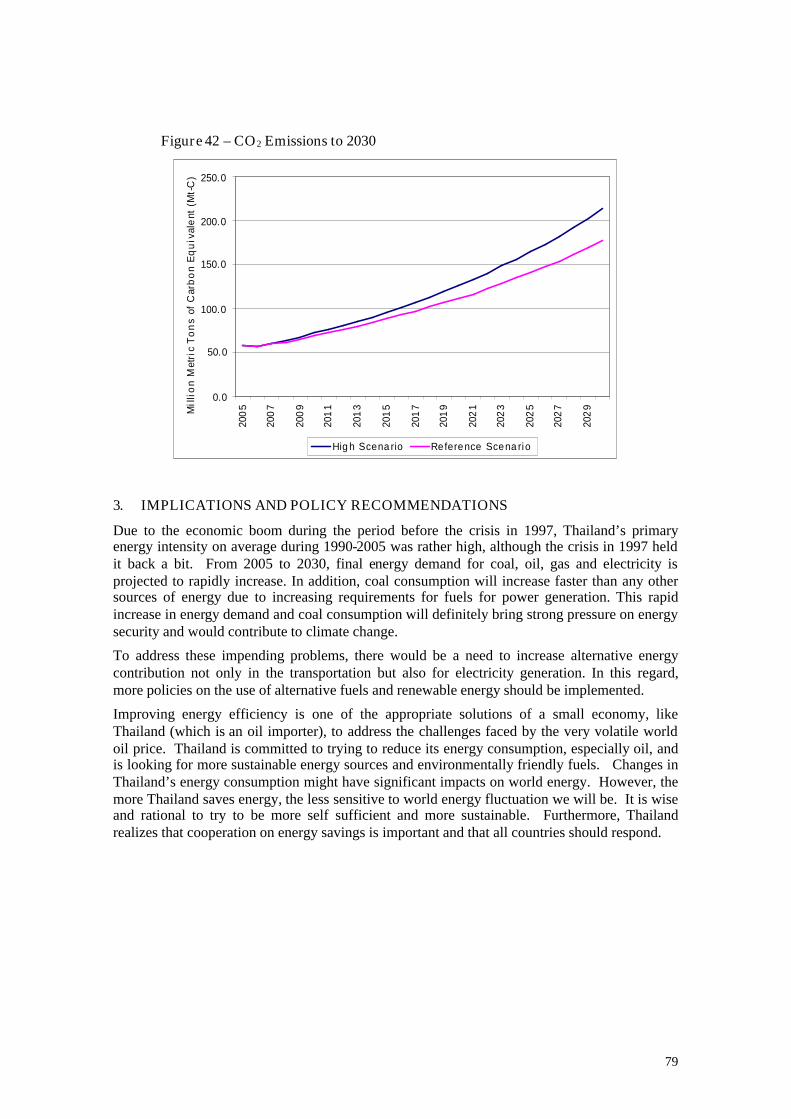
79
Figure 42 – CO2 Emissions to 2030
0.0
50.0
100.0
150.0
200.0
250.0
200
5
200
7
200
9
201
1
201
3
201
5
201
7
201
9
202
1
202
3
202
5
202
7
202
9Mil
lio
nM
etri
cT
on
sof
Car
bo
nE
qu
ival
ent
(Mt-
C)
High Scena rio Reference Scena rio
3. IMPLICATIONS AND POLICY RECOMMENDATIONS
Due to the economic boom during the period before the crisis in 1997, Thailand’s primaryenergy intensity on average during 1990-2005 was rather high, although the crisis in 1997 heldit back a bit. From 2005 to 2030, final energy demand for coal, oil, gas and electricity isprojected to rapidly increase. In addition, coal consumption will increase faster than any othersources of energy due to increasing requirements for fuels for power generation. This rapidincrease in energy demand and coal consumption will definitely bring strong pressure on energysecurity and would contribute to climate change.
To address these impending problems, there would be a need to increase alternative energycontribution not only in the transportation but also for electricity generation. In this regard,more policies on the use of alternative fuels and renewable energy should be implemented.
Improving energy efficiency is one of the appropriate solutions of a small economy, likeThailand (which is an oil importer), to address the challenges faced by the very volatile worldoil price. Thailand is committed to trying to reduce its energy consumption, especially oil, andis looking for more sustainable energy sources and environmentally friendly fuels. Changes inThailand’s energy consumption might have significant impacts on world energy. However, themore Thailand saves energy, the less sensitive to world energy fluctuation we will be. It is wiseand rational to try to be more self sufficient and more sustainable. Furthermore, Thailandrealizes that cooperation on energy savings is important and that all countries should respond.

80

81
VIET NAM
1. BACKGROUND
Viet Nam is a developing country in Southeast Asia. It has common borders with the People’sRepublic of China in the north and Laos and Cambodia in the west. The eastern and southernborder is a 3,300-km long coastline, along the Gulf of Tokin, the South China Sea and the Gulfof Thailand. The total land area is about 330 thousand square kilometers, 50 percent of whichare in productive use.
Gross Domestic Product (GDP) grew at an average annual rate of 7.6 percent for the period1990-2005 and achieved a growth of 8.4 percent in 2005. During the period of 1990-2005, themanufacturing and mining sector recorded the highest growth rate of 11.7 percent amongdemand sectors followed by the transportation and communication sector at 9.2 percent,commerce and trade sector at 8.4 percent, service and others sector at 6.8 percent. Theagriculture and forestry industry sector recorded the lowest growth rate at 2.76 percent.
The population of Viet Nam in the year 2005 was 83.1 million, while GDP per capita wasaround 540 USD/person (constant 2000 prices)
2. ENERGY DEMAND AND CO2 EMISSION OUTLOOK
2.1. Final Energy Consumption
The total final energy consumption of Viet Nam was around 23,117 KTOE in 1990 andincreased to 44,346 KTOE in 2005 growing at an average annual growth rate of 4.4 percent.The industry sector was the fastest growing consumer at 11.8 percent per annum followed bythe transport sector at 11.3 percent. The consumption of the other sectors which includecommercial, residential and agricultural sectors has an average annual growth rate of 2.3 percentfrom 1990 to 2005.
2.1.1. Reference Scenario
Using the basic assumptions stated in the main part of this report, final energy consumption inViet Nam in the reference case is projected to grow at an annual growth rate of 5.0 percent from2005 to 2030. The energy consumption of the industrial sector will grow the fastest with anaverage annual growth rate of 7.9 percent, followed by the transport sector at 7.2 percent growthrate. The other sectors, which consist of commercial, residential and agriculture, will have acombined 2.3 percent annual growth rate.
Among the types of energy, natural gas will grow the fastest at 12.9 percent per annum from2005 to 2030 followed by electricity at 8.4 percent. Electricity share to the total energyconsumption shall increase from 8.9 percent in 2005 to 19.3 percent in 2030. Coal consumptionwill grow at an annual growth rate of 7.4 percent and increasing its share from 13.5 percent in2005 to 23.8 percent in 2030. Oil consumption will grow at an annual rate of 7.1 percent and itsshare to the total final energy consumption will grow from 26.1 percent in 2005 to 42.2 percentin 2030. Meanwhile, biomass contribution to the residential and partly to the commercial sectorenergy requirement will have a steady negative 0.5 percent growth rate due to urbanization andfuel switching from biomass to conventional fuels.

82
Figure 43 – Projected Final Energy Consumption by Sector in MTOE
0
50
100
150
200
250M
toe
Others 20.0 28.1 38.0 41.6 49.6 63.4
Trans po rt 1.4 7.0 21 .2 26.5 39 .8 59 .6
Indus try 1.7 9.2 33.3 41.8 62.4 95.0
1990 20052020
Reference2020 High
2030Reference
2030 High
Figure 44 – Final Energy Consumption by Energy Type in MTOE
0
50
100
150
200
250
Mto
e
Others 18.9 22.7 22.3 22.3 20.2 20.2
Heat 0.0 0.0 0.0 0.0 0.0 0.0
Electric ity 0.5 3.9 14.9 18.8 29.3 45.4
Natural gas 0.0 0.1 1.0 1.2 2.1 3.0
Oil 2.4 11.6 34.5 43.1 64.1 95.9
Coal 1.3 6.0 19.9 24.5 36.1 53.5
1990 20052020
Reference2020 High
2030Reference
2030 High

83
2.1.2. High Scenario
In the High scenario, final energy consumption will grow at a faster annual rate of 6.6 percent to2030 driven by the industry sector, which will grow by 9.8 percent per annum. The transportsector energy consumption and the other sector will grow at an annual rate of 8.9 percent and3.3 percent, respectively.
Among the types of fuels, oil share will increase from 26.1 percent in 2005 to 44.0 percent in2030. This is driven by the rapid growth in the fuel consumption of the transport sector, whichwill be responsible for more than 60 percent of the total oil demand.
Final consumption of electricity shall post the highest growth rate at 10.3 percent and its sharewill increase from 8.9 percent in 2005 to 20.8 percent in 2030. Coal is projected to grow at 9.1percent per annum and its share will increase from 13.5 percent in 2005 to 24.5 percent in 2030.Consumption of biomass will be the same as the consumption in the Reference scenario.
2.2. Primary Energy Supply
Historically, the primary energy supply of Viet Nam increased from 24.3 MTOE in 1990 to 50.0MTOE in 2005. This is an average increase of 4.9 percent per annum. Natural gas supply grewthe fastest during the period at an average annual growth rate 63.8 although its value in 1990was low at only 3 KTOE.
Figure 45 – Primary Energy Requirements
0
50
100
150
200
250
300
Mto
e
Others 18.9 22.7 24.5 24.5 22.5 22.5
Hydro 0.5 1.8 7.4 7.5 7.6 7.6
Nuc lear 0.0 0.0 3.6 3.7 7.3 7.3
Natural gas 0.0 4.9 8.2 12.1 23.0 36.9
Oil 2.7 12.4 36.9 45.6 66.7 98.7
Coal 2.2 8.1 25.2 35.9 59.8 104.6
1990 20052020
Reference2020 High
2030Reference
2030 High
2.2.1. Reference Scenario
Viet Nam’s primary energy requirements will grow at an annual rate of 5.4 percent from 2005to 2030. Among the energy sources, coal will have the highest annual growth rate of 8.3 percent
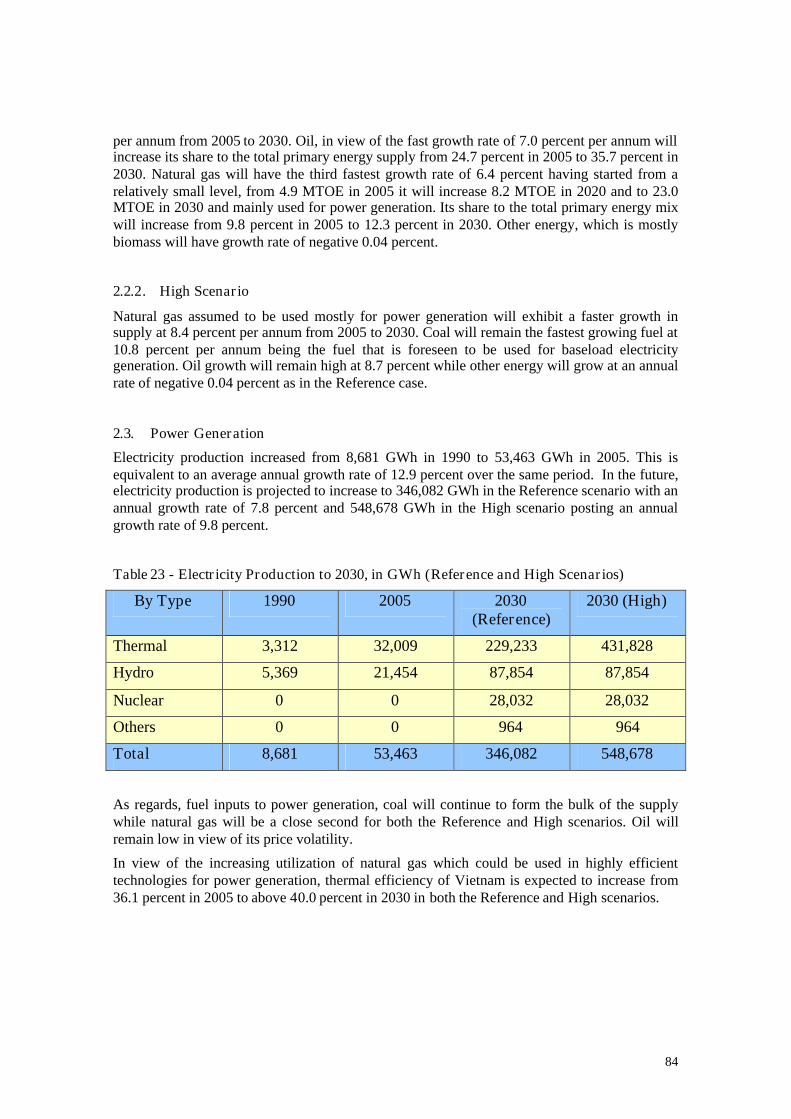
84
per annum from 2005 to 2030. Oil, in view of the fast growth rate of 7.0 percent per annum willincrease its share to the total primary energy supply from 24.7 percent in 2005 to 35.7 percent in2030. Natural gas will have the third fastest growth rate of 6.4 percent having started from arelatively small level, from 4.9 MTOE in 2005 it will increase 8.2 MTOE in 2020 and to 23.0MTOE in 2030 and mainly used for power generation. Its share to the total primary energy mixwill increase from 9.8 percent in 2005 to 12.3 percent in 2030. Other energy, which is mostlybiomass will have growth rate of negative 0.04 percent.
2.2.2. High Scenario
Natural gas assumed to be used mostly for power generation will exhibit a faster growth insupply at 8.4 percent per annum from 2005 to 2030. Coal will remain the fastest growing fuel at10.8 percent per annum being the fuel that is foreseen to be used for baseload electricitygeneration. Oil growth will remain high at 8.7 percent while other energy will grow at an annualrate of negative 0.04 percent as in the Reference case.
2.3. Power Generation
Electricity production increased from 8,681 GWh in 1990 to 53,463 GWh in 2005. This isequivalent to an average annual growth rate of 12.9 percent over the same period. In the future,electricity production is projected to increase to 346,082 GWh in the Reference scenario with anannual growth rate of 7.8 percent and 548,678 GWh in the High scenario posting an annualgrowth rate of 9.8 percent.
Table 23 - Electricity Production to 2030, in GWh (Reference and High Scenarios)
By Type 1990 2005 2030(Reference)
2030 (High)
Thermal 3,312 32,009 229,233 431,828
Hydro 5,369 21,454 87,854 87,854
Nuclear 0 0 28,032 28,032
Others 0 0 964 964
Total 8,681 53,463 346,082 548,678
As regards, fuel inputs to power generation, coal will continue to form the bulk of the supplywhile natural gas will be a close second for both the Reference and High scenarios. Oil willremain low in view of its price volatility.
In view of the increasing utilization of natural gas which could be used in highly efficienttechnologies for power generation, thermal efficiency of Vietnam is expected to increase from36.1 percent in 2005 to above 40.0 percent in 2030 in both the Reference and High scenarios.

85
Table 24 - Fuel Inputs to Power generation in KTOE (Reference and High Scenarios)
By Type 1990 2005 2030 (Reference) 2030 (High)
Coal 888 2,132 26,624 56,911
Oil 382 679 1,239 1,789
Gas 3 4,813 21,015 33,798
Thermal Efficiency 22.4% 36.1% 40.7% 40.4%
2.4. CO2 Emission Outlook
In view of the increasing energy consumption, CO2 emission is also projected to increase at anaverage annual rate of 7.4 percent and 9.6 percent in the Reference and High scenarios,respectively. These growth rates are faster than energy demand growth. This is due to theprojected rapid growth in electricity demand which will be supplied mostly by coal- and naturalgas-based electricity generation. The improvement in thermal efficiency of electricitygeneration will not be enough to offset the increasing share of carbon-emitting fuels. The rapidgrowth in oil consumption especially in the transportation sector is also responsible for the rapidgrowth in CO2 emission.
Figure 46 - CO2 emission in the Reference and High Scenarios to 2030
0.0
50.0
100.0
150.0
200.0
250.0
2005
2007
2009
2011
2013
2015
2017
2019
2021
2023
2025
2027
2029M
illi
onM
etri
cT
on
so
fC
arb
on
Eq
uiv
ale
nt
(Mt-
C)
High Scena rio Reference Scena rio

86
3. FINDINGS AND POLICY IMPLICATIONS
3.1. Findings
• Energy demand in the industry sector in both scenarios will be increasing with thehighest annual growth rate of 7.9 percent in the Reference scenario and 9.8 percent inthe High Growth scenario.
• Energy demand in residential sector is increasing with the lowest annual growth rate of1.8 percent in the Reference scenario and 2.7 percent in High Growth scenario.
• Coal will remain as the major energy input for power generation increasing annually ata growth rate of 10.1 percent in the Reference and 13.5 percent in the High Growthscenario; this is a major source of CO2 emission.
• The elasticity factor between energy demand and GDP in both scenarios is smaller than1; this shows large potential for energy savings.
• CO2 emissions per unit of GDP and per unit of primary energy consumption (t-C/toe)would be increasing.
3.2. Policy Implications
From findings above, there are some solutions proposed for saving energy and also reduction ofCO2 emission in Viet Nam which include:
• Fuel switching from existing boilers in both industry sector and power generation fromcoal to natural gas.
• Replacement of existing electric motors with highly efficient motors.
• Replacement of incandescent light bulbs by energy-efficient compact fluorescent lamps.
• Replacement of existing refrigerators and air conditioners by energy-efficient models.
• Efficiency improvement of existing coal cooking stoves.
• Promotion of renewable energy technology dissemination such as solar heating, biogascooking and wind power generation.

The 2nd ASEAN Energy Outlook
87
Annex 2: Final Energy Demand Equations

The 2nd ASEAN Energy Outlook
88

The 2nd ASEAN Energy Outlook
89
BRUNEI DARUSSALAM
IndustryINEL10 = 1.55217 + .0012951* GDP -12.2156* RPOIL + 0.85911*INEL(-1)INGD = 4.6171 + .0021430* GDP + 0.57334*INGD(-1)INNP = 1.5543 + .4895E-3* GDP - 2.3445* RPOIL+ 0.50908*INNP(-1)INOK = 1.0433 + .2693E-4* GDP - 0.45254* RPOIL + 0.50914*INOK(-1)
Figure 47 – Projected Final Energy Consumption in Industry
NaphthaKeroseneElectricityDieselBitumen
Demand Results: Energy demand final units
Scenario: BAU
Years2005 2007 2009 2011 2013 2015 2017 2019 2021 2023 2025 2027 2029
Th
ou
san
dT
on
ne
so
fO
ilE
qui
vale
nts
140
130
120
110
100
90
80
70
60
50
40
30
20
10
0
TransportationICKJ -16.5946 + 0.011036* GDP - 51.7894* RPOIL + 0.80779*ICJK(-1)RDMG = 57.1681 + 0.023371*GDP - 0.7350E-3* RPOIL + 0.27160*RDMG(-1)RDGD = 1.2492 + 0.0093004*GDP + 0.56680*RDGD(-1)
10 INEL means consumption of electricity (EL) in the industrial sector (IN). GDP is GrossDomestic Product and RPOIL is the real price of oil in local currency. INEL(-1) means theprevious year’s electricity consumption in the industrial sector. A complete listing ofvariable names is shown in Annex 2.
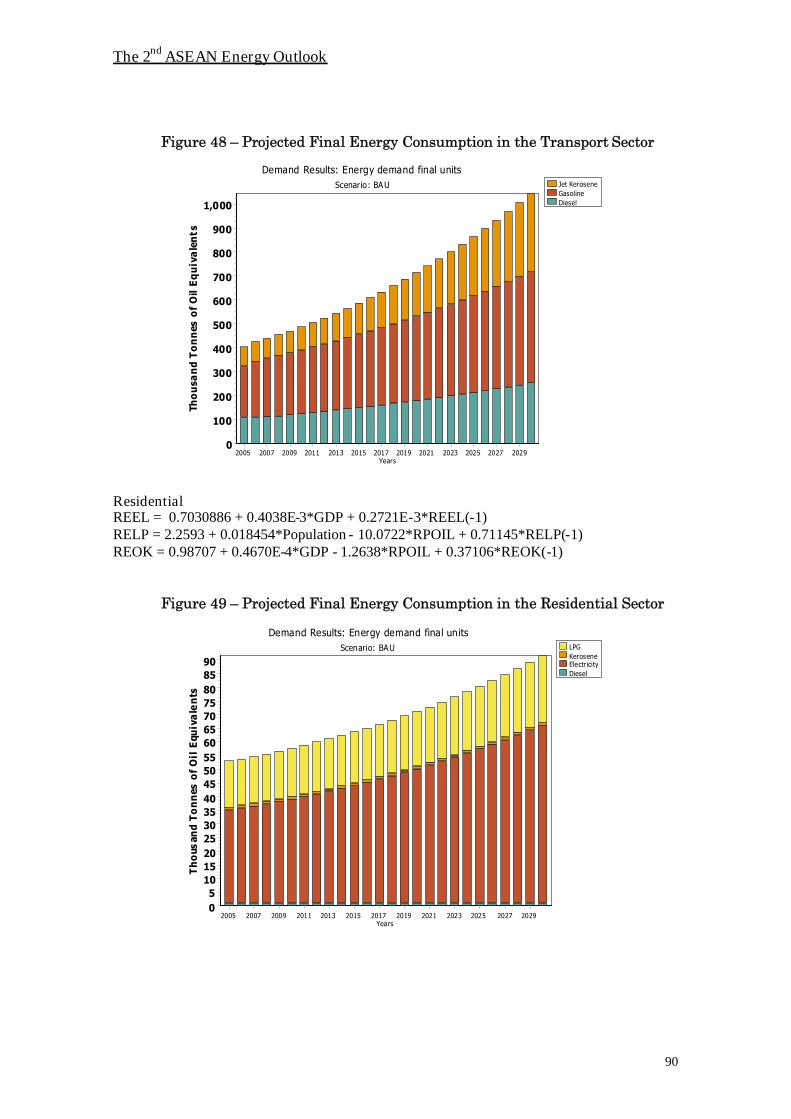
The 2nd ASEAN Energy Outlook
90
Figure 48 – Projected Final Energy Consumption in the Transport Sector
Jet KeroseneGasolineDiesel
Demand Results: Energy demand final unitsScenario: BAU
Years2005 2007 2009 2011 2013 2015 2017 2019 2021 2023 2025 2027 2029
Tho
usa
nd
To
nn
eso
fO
ilE
qu
iva
len
ts1,000
900
800
700
600
500
400
300
200
100
0
ResidentialREEL = 0.7030886 + 0.4038E-3*GDP + 0.2721E-3*REEL(-1)RELP = 2.2593 + 0.018454*Population - 10.0722*RPOIL + 0.71145*RELP(-1)REOK = 0.98707 + 0.4670E-4*GDP - 1.2638*RPOIL + 0.37106*REOK(-1)
Figure 49 – Projected Final Energy Consumption in the Residential Sector
LPGKeroseneElectricityDiesel
Demand Results: Energy demand final unitsScenario: BAU
Years2005 2007 2009 2011 2013 2015 2017 2019 2021 2023 2025 2027 2029
Th
ous
and
To
nn
eso
fO
ilE
quiv
ale
nts
908580757065605550454035302520151050

The 2nd ASEAN Energy Outlook
91
CommercialCSEL = -45.0790 + 0.032155*GDP + 0.35586*CSEL(-1)
Figure 50 – Projected Final Energy Consumption in the Commercial Sector
Electricity
Demand Results: Energy demand final units
Scenario: BAU
Years2005 2007 2009 2011 2013 2015 2017 2019 2021 2023 2025 2027 2029
Th
ou
sand
To
nne
so
fO
ilE
qu
ival
ents
500
450
400
350
300
250
200
150
100
50
0

The 2nd ASEAN Energy Outlook
92
CAMBODIA
IndustryINEL = Exp(-16.30613 +1.1910*Ln(INGDP))11
INPP = 11.4111 + 0.5086E-5*INGDP
Figure 51 – Projected Final Energy Consumption in the Industrial Sector
Residual Fuel OilElectricityDiesel
Demand Results: Energy demand final units
Scenario: BAU
Years2005 2007 2009 2011 2013 2015 2017 2019 2021 2023 2025 2027 2029
Th
ou
sand
To
nne
so
fO
ilE
qu
ival
ents
220
200
180
160
140
120
100
80
60
40
20
0
Commercial SectorCSEL = -17.2275+0.024378* GDPC - 0.0025812*RPOIL + 0.30890*CSEL(-1)
Residential SectorREEL = Exp(-3.80047 + 0.78312*Ln(GDPC) + 0.45400*Ln(REEL(-1)))REPP = -8.2129 + 0.058992*GDPC + 0.84060*REPP(-1)RECB = Growth(1.2%, 2010, 1.7%)12
Transportation SectorRDPP = 51.51 + 0.1326E-4*GDP + 0.19821*RDPP(-1)ICJK = Growth(5.3%)13
AgricultureAGPP = 19.0788 +0.1983E-5*GDP + 0.41135*AGPP(-1)
11 Exp indicates exponential function; Ln means the natural logarithm12 Growth(x%, yyyy, n) indicates that the variable grows at an average annual rate of x%until the year yyyy and n% afterwards.13 Growth(x%) indicates that the variable grows at an average annual rate of x% until theend of the projection period

The 2nd ASEAN Energy Outlook
93
Figure 52 – Projected Final Energy Consumption in the Commercial Sector
Electricity
Demand Results: Energy demand final units
Scenario: BAU
Years2005 2007 2009 2011 2013 2015 2017 2019 2021 2023 2025 2027 2029
Th
ou
sand
To
nne
so
fO
ilE
qu
ival
ents
908580757065605550454035302520151050
Figure 53 – Projected Final Energy Consumption in the Residential Sector
LPGKeroseneElectricityDieselBiomass
Demand Results: Energy demand final unitsScenario: BAU
Years2005 2007 2009 2011 2013 2015 2017 2019 2021 2023 2025 2027 2029
Tho
usa
nd
To
nn
eso
fO
ilE
qu
iva
len
ts
6,000
5,500
5,000
4,500
4,000
3,500
3,000
2,500
2,000
1,500
1,000
500
0
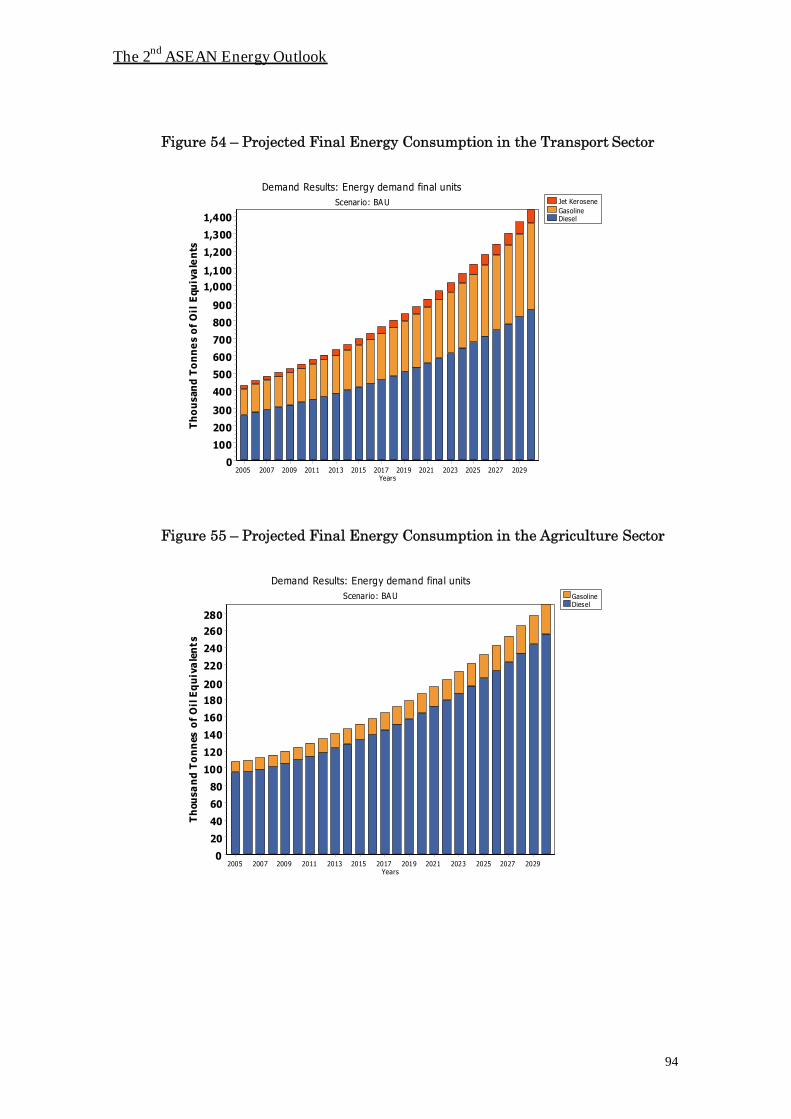
The 2nd ASEAN Energy Outlook
94
Figure 54 – Projected Final Energy Consumption in the Transport Sector
Jet KeroseneGasolineDiesel
Demand Results: Energy demand final unitsScenario: BAU
Years2005 2007 2009 2011 2013 2015 2017 2019 2021 2023 2025 2027 2029
Th
ou
san
dT
on
ne
so
fO
ilE
quiv
ale
nts
1,400
1,300
1,200
1,100
1,000
900
800
700
600
500
400
300
200
100
0
Figure 55 – Projected Final Energy Consumption in the Agriculture Sector
GasolineDiesel
Demand Results: Energy demand final unitsScenario: BAU
Years2005 2007 2009 2011 2013 2015 2017 2019 2021 2023 2025 2027 2029
Th
ousa
nd
To
nn
eso
fO
ilE
qu
iva
len
ts
280
260
240
220
200
180
160
140
120
100
80
60
40
20
0

The 2nd ASEAN Energy Outlook
95
INDONESIA
IndustryINHC = GrowthAs(INGDP)14
INGD = 361.5071 + 0.1691E-5*INGDP + 0.74283*INGD(-1)INHF = GrowthAs(INGDP)INLP = Growth(10%)INOK = Growth(1%)INEL = -132.9538 + .1225E-5*INGDP + 0.82494*INEL(-1) -.0066915* RPOILINCB = Growth(1%)
Figure 56 – Projected Final Energy Consumption in the Industrial Sector
Natural GasDieselResidual Fuel OilLPGElectricityKeroseneCoal BituminousBiomass
Demand Results: Energy demand final unitsScenario: High GDP Scenario, Fuel: A ll Fuels
Years2005 2007 2009 2011 2013 2015 2017 2019 2021 2023 2025 2027 2029
Th
ou
san
dT
onn
es
of
Oil
Eq
uiv
ale
nts
140,000
130,000
120,000
110,000
100,000
90,000
80,000
70,000
60,000
50,000
40,000
30,000
20,000
10,000
0
TransportationICKJ = Exp(-5.6685 + 0.39987*Ln(GDP) - 0.039432*Ln(RPOIL) + .61689*Ln(ICKJ(-1)))DAKJ = 137.4382 + 0.2073e-6*GDP - 0.080157* RPOIL + 0.601562*DAKJ(-1)DAAV = Growth(5%)RDMG = -125.9101 + 0.7088E-6* GDP + 0.97125*RDMG(-1)RDGD = 19.0254 + 0.1665E-5*GDP - 0.036372*RPOIL + 0.73557*RDGD(-1)RDNG = Growth(10%)RDLU = GrowthAs(TNCAR15)IVPP = Growth(3%)
14 GrowthAs(nnnn) indicates that the variable grows at the same rate as variable nnnn; thevariable nnnn could be an independent variable or another fuel15 TNCAR = Total number of carhold

The 2nd ASEAN Energy Outlook
96
Figure 57 – Projected Final Energy Consumption in the Transport Sector
Residual Fuel OilNatural GasLubricantsJet KeroseneGasolineDieselBioethanolBiodieselAvgas
Demand Results: Energy demand final unitsScenario: High GDP Scenario
Years2005 2007 2009 2011 2013 2015 2017 2019 2021 2023 2025 2027 2029
Th
ou
san
dTo
nn
es
of
Oil
Eq
uiv
ale
nts
120,000
110,000
100,000
90,000
80,000
70,000
60,000
50,000
40,000
30,000
20,000
10,000
0
CommercialCSEL = -20.2925 + 0.5102E-7*GDP + 1.0622*CSEL(-1)CSNG = 11.2626 + 0.8737E-8*GDP + 0.092557*CSNG(-1)CSGD = 19.7919 + 0.1436E-7*GDP - 0.012582*RPOIL + 1.0045*CSGD(-1)CSOK = 0.492473118*CSPPCSCB = Growth(1%)
Figure 58 – Projected Final Energy Consumption in the Commercial Sector
Natural GasKeroseneElectricityDieselBiomass
Demand Results: Energy demand final un itsScenario: High GDP Scenario
Years2005 2007 2009 2011 2013 2015 2017 2019 2021 2023 2025 2027 2029
Th
ou
san
dT
onn
es
of
Oil
Eq
uiv
ale
nts
22,000
20,000
18,000
16,000
14,000
12,000
10,000
8,000
6,000
4,000
2,000
0

The 2nd ASEAN Energy Outlook
97
ResidentialREEL = -68.7541 + 0.4797e-6* CP - 0.0091297*RPOIL + 0.94088*REEL(-1)RENG = Growth(7%)RELP = Interp(2007,978.6, 2008,2442, 2009,4689, 2010,5455.7, 2011,6223, 2012,6820, 0.03)16
REOK = Interp(2006,8637, 2007,8539, 2012,1106)
Figure 59 – Projected Final Energy Consumption in the Residential Sector
Natural GasLPGKeroseneElectricityBiooilBiomass
Demand Results: Energy demand final un its
Scenario: High GDP Scenario
Years2005 2007 2009 2011 2013 2015 2017 2019 2021 2023 2025 2027 2029
Th
ou
san
dT
onn
es
of
Oil
Eq
uiv
ale
nts
65,000
60,000
55,000
50,000
45,000
40,000
35,000
30,000
25,000
20,000
15,000
10,000
5,000
0
AgricultureAGGD = Growthas(AGGDP)AGHF = Growthas(AGGDP)
16 Interp(yyyy,xx.x) indicates an interpolation function with a value xx.x in year yyyy; therecould be multiple yyyy and xx.x.

The 2nd ASEAN Energy Outlook
98
Figure 60 – Projected Final Energy Consumption in the Agriculture Sector
Residual Fuel OilDiesel
Demand Results: Energy demand final unitsScenario: High GDP Scenario
Years2005 2007 2009 2011 2013 2015 2017 2019 2021 2023 2025 2027 2029
Th
ou
san
dTo
nn
es
of
Oil
Eq
uiv
ale
nts
11,000
10,000
9,000
8,000
7,000
6,000
5,000
4,000
3,000
2,000
1,000
0
Non-energy UseN5NP = GrowthAs(INGDP,0.5)17
N5NG = GrowthAs(INGDP,0.5)N5BT = GrowthAs(TNCAR)N5OK = GrowthAs(INGDP,0.05)
Figure 61 – Projected Final Consumption for Non-Energy Use
Natural GasNaphthaKeroseneBitumen
Demand Results: Energy demand final un itsScenario: High GDP Scenario
Years2005 2007 2009 2011 2013 2015 2017 2019 2021 2023 2025 2027 2029
Tho
usa
nd
To
nn
esof
Oil
Eq
uiv
alen
ts
24,000
22,000
20,000
18,000
16,000
14,000
12,000
10,000
8,000
6,000
4,000
2,000
0
17 GrowthAs(vvvv,x.x) indicate that the variable grows at the same rate as vvvv*x.x; x.x isthe elasticity which means that as vvvv grows by 1% the variable grows at 1%*x.x.

The 2nd ASEAN Energy Outlook
99
LAO PDR
Industry
INEL = -1.7690 + 0.3143E-4*INGDP + 0.48193*INEL(-1)INHC = -14.0068 + 0.1001E-3*INGDP + 0.033432*INHC(-1)INHF = 1.3734 - 0.0074694* RPOIL + 0.4890E-5*INGDP + 0.63393*INHF(-1)INLP = 0.061194 + 0.5391E-6*INGDP - 0.2513E-3*RPOIL + 0.47731*INLP(-1)INCB = Growth(1%)
Figure 62 – Projected Final Energy Consumption in the Industrial Sector
Solid FuelsOil ProductsElectricityBiomass
Demand Results: Energy demand final unitsScenario: BAU
Years2005 2007 2009 2011 2013 2015 2017 2019 2021 2023 2025 2027 2029
Th
ous
and
To
nn
eso
fO
ilE
qu
iva
lent
s
650
600
550
500
450
400
350
300
250
200
150
100
50
0
TransportICKJ = 12.3684 + 0.5152E-5*GDP + 0.47480*INKJ(-1)DAKJ = -7.8573 + 0.1125E-4*GDP + 0.87015*DAKJ(-1)RDPP = 18.1018 + 0.1444E-3*GDP + 0.12177*RDPP(-1)
ResidentialREEL = -9.3037 + 0.2151E-4*GDP + 0.51237*REEL(-1)RELP = GrowthAs(GDP)RECH = GrowthAs(UPOP)RECB = GrowthAs(RPOP)
CommercialCSEL = -4.5878 + 0.042048*GDPC + 0.72271*CSEL(-1)CSLP = 0.28185 + 0.2482E-3*GDPC - 0.3757E-3*RPOIL + 0.77017*CSLP(-1)CSCH = GrowthAs(UPOP)CSCB = GrowthAs(RPOP)

The 2nd ASEAN Energy Outlook
100
Figure 63 – Projected Final Energy Consumption in the Transport Sector
Jet KeroseneGasolineDiesel
Demand Results: Energy demand final unitsScenario: BAU
Years2005 2007 2009 2011 2013 2015 2017 2019 2021 2023 2025 2027 2029
Th
ou
san
dTo
nn
es
of
Oil
Eq
uiv
ale
nts
1,300
1,200
1,100
1,000
900
800
700
600
500
400
300
200
100
0
Figure 64 – Projected Final Energy Consumption in the Residential Sector
LPGElectricityCharcoalBiomass
Demand Results: Energy demand final unitsScenario: BAU
Years2005 2007 2009 2011 2013 2015 2017 2019 2021 2023 2025 2027 2029
Th
ousa
nd
To
nn
eso
fO
ilE
qu
ival
ents
1,7001,6001,5001,4001,3001,2001,1001,000
900800700600500400300200100
0

The 2nd ASEAN Energy Outlook
101
Figure 65 – Projected Final Energy Consumption in the Commercial Sector
LPGElectricityCharcoalBiomass
Demand Results: Energy demand final unitsScenario: BAU
Years2005 2007 2009 2011 2013 2015 2017 2019 2021 2023 2025 2027 2029
Th
ous
and
To
nn
eso
fO
ilE
qu
iva
lent
s160
150
140130
120110
100
9080
7060
50
40
3020
10
0
AgricultureAGEL = 1.1992 + 0.2658E-6*GDP + 0.49920*AGELAGGD = -0.38317 + 0.7300E-6*GDP + 0.14193*AGGD
Figure 66 – Projected Final Energy Consumption in the Agriculture Sector
Oil ProductsElectricity
Demand Results: Energy demand final unitsScenario: BAU
Years2005 2007 2009 2011 2013 2015 2017 2019 2021 2023 2025 2027 2029
Th
ou
san
dT
on
nes
of
Oil
Equ
iva
lent
s
9.0
8.0
7.0
6.0
5.0
4.0
3.0
2.0
1.0
0.0

The 2nd ASEAN Energy Outlook
102
MALAYSIA
IndustryINHC = -31.3304 + 9.7527*MGGDP + 0.43554*INHCINEL = Exp(0.96091 +0.25366*Ln(MGGDP) + 0.75138*Ln(INEL(-1)))INNG = 533.0905 + 82.5912*MGGDP + 0.53089*INNG(-1) * Gas ShareINGD = Exp(1.7905 + 0.12158*Ln(MGGDP) + 0.72211*Ln(INGD(-1)))INHF = 159.7316 + 5.2934*MGGDP + 0.68064*INHF(-1)INMG = Interp(2030,0)INLP = -8.7291 + 0.89074*CSGDP + 0.72621*INLP(-1)INOK = Interp(2030,20)INCB = 6.5120 + 0.06772*GDP + 0.77905*INCB(-1)
Figure 67 – Projected Final Energy Consumption in the Industrial Sector
Residual Fuel OilNatural GasLPGKeroseneGasolineElectricityDieselCoal Sub bituminousBiomass
Demand Results: Energy demand final units
Scenario: BAU
Years2005 2007 2009 2011 2013 2015 2017 2019 2021 2023 2025 2027 2029
Tho
usa
nd
To
nn
esof
Oil
Eq
uiv
alen
ts
45,000
40,000
35,000
30,000
25,000
20,000
15,000
10,000
5,000
0
TransportTSKJ = -105.5669 + 4.2044*GDP + 0.5492*TSKJ(-1)RDMG = -443.329 + 174921.5*GDPC + 0.86865*RDMG(-1)RDGD -22.8741 + 14.5576*INGDP + 0.6987*RDGD(-1)RDNG = 1.5% of Total final consumption of natural gas
Residential and CommercialRCEL = -81.0453 + 6.6334*CSGDP + 0.84345*RCEL(-1)RCLP = -69.4365 + 6.2162*CSGDP + 0.49364*RCLP(-1)RCOK = Interp(2030,0)RCHF = -19.7799 + 0.75196*CSGDP + 0.78986*RCHF(-1)RCNG = -46.7811 + 6.2694*CSGDP + 0.49795*RCNG - RCLPRCCB = GrowthAs(\RCLG,-1)

The 2nd ASEAN Energy Outlook
103
Figure 68 – Projected Final Energy Consumption in the Transport Sector
Residual Fuel OilNatural GasJet KeroseneGasolineElectricityDieselBiomassAvgas
Demand Results: Energy demand final unitsScenario: BAU
Years2005 2007 2009 2011 2013 2015 2017 2019 2021 2023 2025 2027 2029
Th
ou
san
dT
onn
es
of
Oil
Equ
iva
len
ts40,000
35,000
30,000
25,000
20,000
15,000
10,000
5,000
0
Figure 69 – Projected Final Energy Consumption in theResidential/Commercial Sector
Residual Fuel OilNatural GasLPGKeroseneElectricityBiomass
Demand Results: Energy demand final unitsScenario: BAU
Years2005 2007 2009 2011 2013 2015 2017 2019 2021 2023 2025 2027 2029
Th
ou
san
dT
on
nes
of
Oil
Equ
iva
lent
s
18,00017,00016,00015,00014,00013,00012,00011,00010,000
9,0008,0007,0006,0005,0004,0003,0002,0001,000
0

The 2nd ASEAN Energy Outlook
104
MYANMAR
IndustryINEL = 9.3534 + 0.4188E-3*GDP + 0.51168*INEL(-1)INHC = -52.3429 + 0.8191E-3*GDP + 0.066240*INHC(-1_INNG = -18.6753 + 0.9464E-3*GDP + 0.79287*INNG(-1)INPP = Exp(1.2607 + 0.16009*Ln(GDP) + 0.39460*Ln(INPP(-1)))INCB = No growth
Figure 70 – Projected Final Energy Consumption in the Industrial Sector
Residual Fuel OilPetroleum CokeNatural GasLPGElectricityDieselCoal UnspecifiedBiomass
Demand Results: Energy demand final unitsScenario: BAU
Years2005 2007 2009 2011 2013 2015 2017 2019 2021 2023 2025 2027 2029
Tho
usa
nd
To
nn
esof
Oil
Eq
uiv
alen
ts
3,4003,2003,0002,8002,6002,4002,2002,0001,8001,6001,4001,2001,000
800600400200
0
TransportationTSKJ = 24.9828 + 0.9589E-4*GDP - 2.8189*RPOIL + 0.42019*TSKJ(-1)RDLP = No growthRDMG = 113.6848 + 0.8988E-3*GDP - 55.3094 + 0.37892*RDMG(-1)RDGD = 297.5620 + 255.5089*GDPC - 58.3752*RPOIL + 0.044693*RDGC (50% to be
displaced by natural gas in 2030)RDNG = to gradually displace diesel from 2006 to 50% of diesel in 2030 from 0 in 2006INPP = Interp(2030,50)

The 2nd ASEAN Energy Outlook
105
Figure 71 – Projected Final Energy Consumption in the Transport Sector
Residual Fuel OilNatural GasLPGJet KeroseneGasolineDiesel
Demand Results: Energy demand final unitsScenario: BAU
Years2005 2007 2009 2011 2013 2015 2017 2019 2021 2023 2025 2027 2029
Th
ous
and
To
nn
eso
fO
ilE
qu
iva
lent
s3,200
3,0002,800
2,6002,400
2,2002,0001,800
1,6001,400
1,2001,000
800600
400200
0
ResidentialREEL = -44.7361 + 0.6482E-4*GDP + 0.0015186*Population + 0.71083*REEL(-1)RELP = GrowthAs(POPU)18
REOK = GrowthAs(\POPR)REGD = No growthRECB = GrowthAs(\POPR)
Figure 72 – Projected Final Energy Consumption in the Residential Sector
LPGKeroseneElectricityDieselBiomass
Demand Results: Energy demand final unitsScenario: BAU
Years2005 2007 2009 2011 2013 2015 2017 2019 2021 2023 2025 2027 2029
Th
ou
san
dT
on
nes
of
Oil
Equ
iva
len
ts
12,000
11,000
10,000
9,000
8,000
7,000
6,000
5,000
4,000
3,000
2,000
1,000
0
18 POPU mean urban population while POPR means rural population

The 2nd ASEAN Energy Outlook
106
CommercialCSEL = -13.9800 + 0.3055E-4*GDP + 0.4379E-3*Population + 0.85155*CSEL(-1)
Figure 73 – Projected Final Energy Consumption in the Commercial Sector
Electricity
Demand Results: Energy demand final unitsScenario: BAU
Years2005 2007 2009 2011 2013 2015 2017 2019 2021 2023 2025 2027 2029
Th
ousa
nd
To
nn
eso
fO
ilE
qu
ival
ents
170160150140130120110100
9080706050403020100
AgricultureAGHF = GrowthAs(\GDP)
Figure 74 – Projected Final Energy Consumption in the Agriculture Sector
Residual Fuel Oil
Demand Results: Energy demand final unitsScenario: BAU
Years2005 2007 2009 2011 2013 2015 2017 2019 2021 2023 2025 2027 2029
Th
ousa
nd
To
nn
eso
fO
ilE
qu
ival
ents
3.603.403.203.002.802.602.402.202.001.801.601.401.201.000.800.600.400.200.00
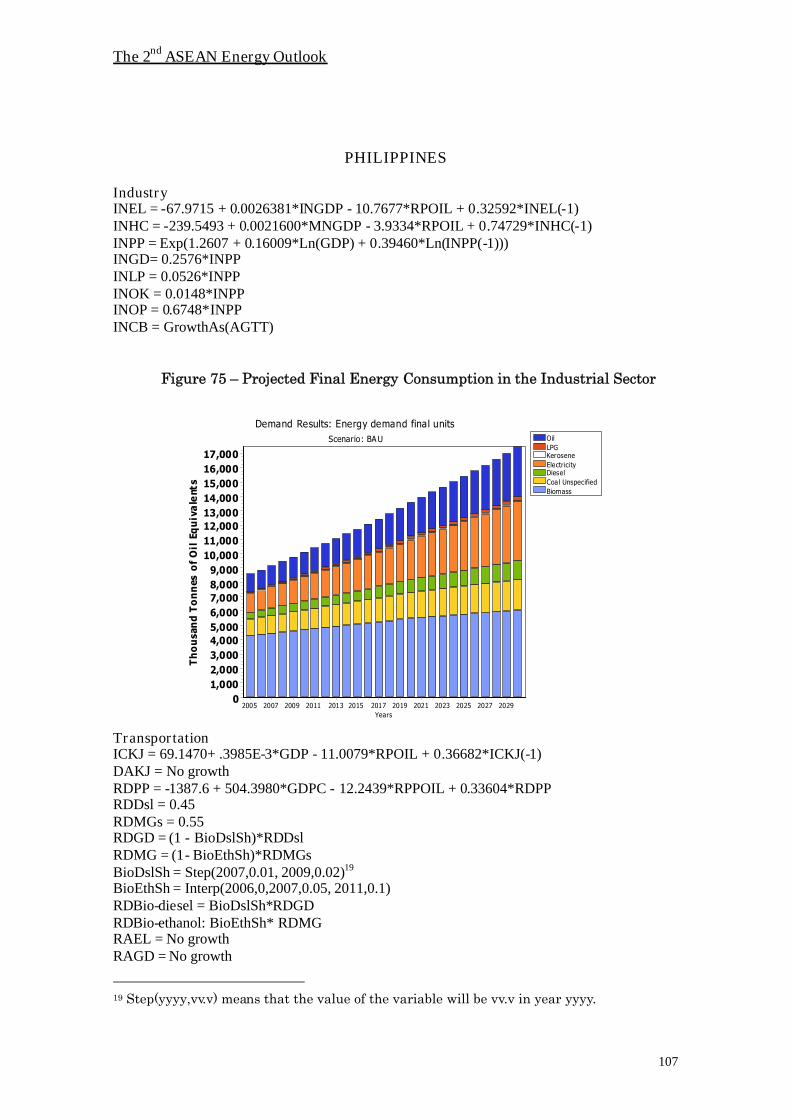
The 2nd ASEAN Energy Outlook
107
PHILIPPINES
IndustryINEL = -67.9715 + 0.0026381*INGDP - 10.7677*RPOIL + 0.32592*INEL(-1)INHC = -239.5493 + 0.0021600*MNGDP - 3.9334*RPOIL + 0.74729*INHC(-1)INPP = Exp(1.2607 + 0.16009*Ln(GDP) + 0.39460*Ln(INPP(-1)))INGD= 0.2576*INPPINLP = 0.0526*INPPINOK = 0.0148*INPPINOP = 0.6748*INPPINCB = GrowthAs(AGTT)
Figure 75 – Projected Final Energy Consumption in the Industrial Sector
OilLPGKeroseneElectricityDieselCoal UnspecifiedBiomass
Demand Results: Energy demand final unitsScenario: BAU
Years2005 2007 2009 2011 2013 2015 2017 2019 2021 2023 2025 2027 2029
Th
ou
san
dT
on
nes
of
Oil
Equ
iva
lent
s
17,00016,00015,00014,00013,00012,00011,00010,000
9,0008,0007,0006,0005,0004,0003,0002,0001,000
0
TransportationICKJ = 69.1470+ .3985E-3*GDP - 11.0079*RPOIL + 0.36682*ICKJ(-1)DAKJ = No growthRDPP = -1387.6 + 504.3980*GDPC - 12.2439*RPPOIL + 0.33604*RDPPRDDsl = 0.45RDMGs = 0.55RDGD = (1 - BioDslSh)*RDDslRDMG = (1- BioEthSh)*RDMGsBioDslSh = Step(2007,0.01, 2009,0.02)19
BioEthSh = Interp(2006,0,2007,0.05, 2011,0.1)RDBio-diesel = BioDslSh*RDGDRDBio-ethanol: BioEthSh* RDMGRAEL = No growthRAGD = No growth
19 Step(yyyy,vv.v) means that the value of the variable will be vv.v in year yyyy.

The 2nd ASEAN Energy Outlook
108
Figure 76 – Projected Final Energy Consumption in the Transport Sector
OilLPGJet KeroseneGasolineElectricityDieselCNGBioEthanolBioDiesel
Demand Results: Energy demand final unitsScenario: BAU
Years2005 2007 2009 2011 2013 2015 2017 2019 2021 2023 2025 2027 2029
Th
ou
san
dTo
nn
es
of
Oil
Eq
uiv
ale
nts
24,000
22,000
20,000
18,000
16,000
14,000
12,000
10,000
8,000
6,000
4,000
2,000
0
ResidentialREEL = -161.4180 + 22.0676*GDPC - 14.8172*RPOIL + 0.98512*REELREPP = No growthRELP = -56.3016 + 0.0004163*GDP - 6.4540*RPPOIL + 0.62352*RELP(-1)REOK = 0.31*REPPRECB = -163.4534 + 6.2284*UPOP + 14.1236*RPOIL + 0.94036*RECB(-1)
Figure 77 – Projected Final Energy Consumption in the Residential Sector
LPGKeroseneElectricityBiomass
Demand Results: Energy demand final unitsScenario: BAU
Years2005 2007 2009 2011 2013 2015 2017 2019 2021 2023 2025 2027 2029
Th
ousa
nd
To
nn
eso
fO
ilE
qu
ival
ents
14,000
13,000
12,000
11,000
10,000
9,000
8,000
7,000
6,000
5,000
4,000
3,000
2,000
1,000
0

The 2nd ASEAN Energy Outlook
109
CommercialCSEL = -551.7363 + 68.8290*GDPC - 38.2134*RPOIL + 0.79489*CSEL(-1)CSPP = -174.7024 + 0.030888*POPU - 190.8091*RPOIL +67.8254 + 0.51018*CSPP(-1)
Figure 78 – Projected Final Energy Consumption in the Commercial Sector
OilLPGKeroseneGasolineElectricityDiesel
Demand Results: Energy demand final units
Scenario: BAU
Years2005 2007 2009 2011 2013 2015 2017 2019 2021 2023 2025 2027 2029
Th
ou
san
dT
onn
es
of
Oil
Eq
uiv
ale
nts
7,500
7,000
6,5006,000
5,500
5,000
4,500
4,0003,500
3,000
2,500
2,000
1,500
1,000500
0
AgricultureAGTT = GrowthAs(POPU)
Figure 79 – Projected Final Energy Consumption in the Agriculture Sector
OilKeroseneGasolineElectricityDiesel
Demand Results: Energy demand final unitsScenario: BAU
Years2005 2007 2009 2011 2013 2015 2017 2019 2021 2023 2025 2027 2029
Th
ou
san
dT
on
ne
so
fO
ilE
qui
vale
nts
400
350
300
250
200
150
100
50
0

The 2nd ASEAN Energy Outlook
110
SINGAPORE
IndustryINEL = 14.1713+ 0.0056176*INGDP - 44.3210*RPOIL + 0.72032*INEL(-1)INNP = 5400+0.35396*CHGDP - 2667.7*RPOILINOK = No growthINBT = No growthINOP = No growth
Figure 80 – Projected Final Energy Consumption in the Industrial Sector
OilNaphthaKeroseneElectricityBitumen
Demand Results: Energy demand final unitsScenario: BAU
Years2005 2007 2009 2011 2013 2015 2017 2019 2021 2023 2025 2027 2029
Th
ousa
nd
To
nn
eso
fO
ilE
qu
iva
lent
s
13,000
12,000
11,000
10,000
9,000
8,000
7,000
6,000
5,000
4,000
3,000
2,000
1,000
0
Figure 81 – Projected Final Energy Consumption in the Transport Sector
LubricantsJet KeroseneGasolineElectricityDiesel
Demand Results: Energy demand final unitsScenario: BAU
Years2005 2007 2009 2011 2013 2015 2017 2019 2021 2023 2025 2027 2029
Th
ou
san
dTo
nn
es
of
Oil
Eq
uiv
ale
nts
12,000
11,000
10,000
9,000
8,000
7,000
6,000
5,000
4,000
3,000
2,000
1,000
0

The 2nd ASEAN Energy Outlook
111
TransportICKJ = -339.4998 + 67.9452*GDPC - 24.3200*RPOIL + 0.20212*ICKJ(-1)RDPP = Exp(1.6844 + 0.29435*Ln(GDPC) + 0.63986*Ln(RDPP(-1)))RAEL = Step(2015,40, 2020,60)
Figure 82 – Projected Final Energy Consumption in the Residential Sector
LPGElectricity
Demand Results: Energy demand final unitsScenario: BAU
Years2005 2007 2009 2011 2013 2015 2017 2019 2021 2023 2025 2027 2029
Th
ou
san
dT
on
nes
of
Oil
Equ
iva
lent
s
1,600
1,5001,4001,300
1,2001,1001,000
900
800700600500
400300200100
0
Residential/CommercialREEL = -9.0410 + 2.1623*GDPC - 20.5012*RPOIL + 0.89780*REEL(-1)RELP = Growth(0.5%)CSEL = -4.3693+ 0.0022765*GDP - 24.1543*RPOIL + 0.64628*CSEL(-1)
Figure 83 – Projected Final Energy Consumption in the Commercial Sector
LPGElectricity
Demand Results: Energy demand final unitsScenario: BAU
Years2005 2007 2009 2011 2013 2015 2017 2019 2021 2023 2025 2027 2029
Th
ousa
nd
To
nn
eso
fO
ilE
qu
ival
ents
2,800
2,600
2,400
2,200
2,000
1,800
1,600
1,400
1,200
1,000
800
600
400
200
0

The 2nd ASEAN Energy Outlook
112
THAILAND
Industry
Chemical and PetrochemicalCXEL = -48.46283 + 0.251E-3*MNGDP + 0.59671*CXEL(-1)CXPP = -120.9553 + 0.3048E-3*MNGDP + 0.40790*CXPP(-1)CXCB = Growth(2%)
Food and TobaccoFTHC = -15.8315 + 0.6064E-4*MNGDP + 0.58887*FTHC(-1)FTLB = 34.1927 + 0.8593E-4*MNGDP - 6.9778*RPOILFTEL = 8.8551 + 0.662E-3*FTGDP + 0.8361*FTEL(-1)FTPP = 41.9133 + 0.5311E-3*MNGDP - 14.9941*RPOILFTCB = Growth(2%)
MachineryMCEL = -150.01322 + 0.2338E-3*MNGDP + 0.769978*MCELMCPP = -21.7794 + 0.9088E-4*MNGDP - 5.9894*RPOIL + 0.53834*MCPP(-1)
Non-Metallic MineralsNMHC = -227.3461 + 0.6357E-3*INGDP + 0.69538*NMHC(-1)NMLB = 212.5466 + 0.7114E-3*INGDP - 53.0586*RPOIL + 0.33615*NMLB(-1)NMEL = -82.8005 + 0.337E-3*INGDP + 0.145675*NMEL(-1)NMPP = 235.4176 -17.0228*RPOIL + 0.73227*NMPP(-1)NMCB = Growth(2%)
Textile and LeatherTLEL = 70.4821493 + 0.217399E-3*MNGDP - 1.31071*RPOIL + 0.386955*TLEL(-1)TLPP = 201.8648 + 0.0028901*TLGDP - 22.6882*RPOIL + 0.43570*TLPP(-1)
Non-specificsN3HC = Growth(1%)N3LB = Growth(1%)N3NG = Growth(3%)N3EL = Growth(3.5%)N3PP = Growth(2%)
OthersOTEL = Growth(1.5%)OTGD = Growth(1%)OTMG = No growthOTHF = Growth(1%)OTLP = Growth(.05%)OTCB = Growth(0.05%)
N5TT = No growth
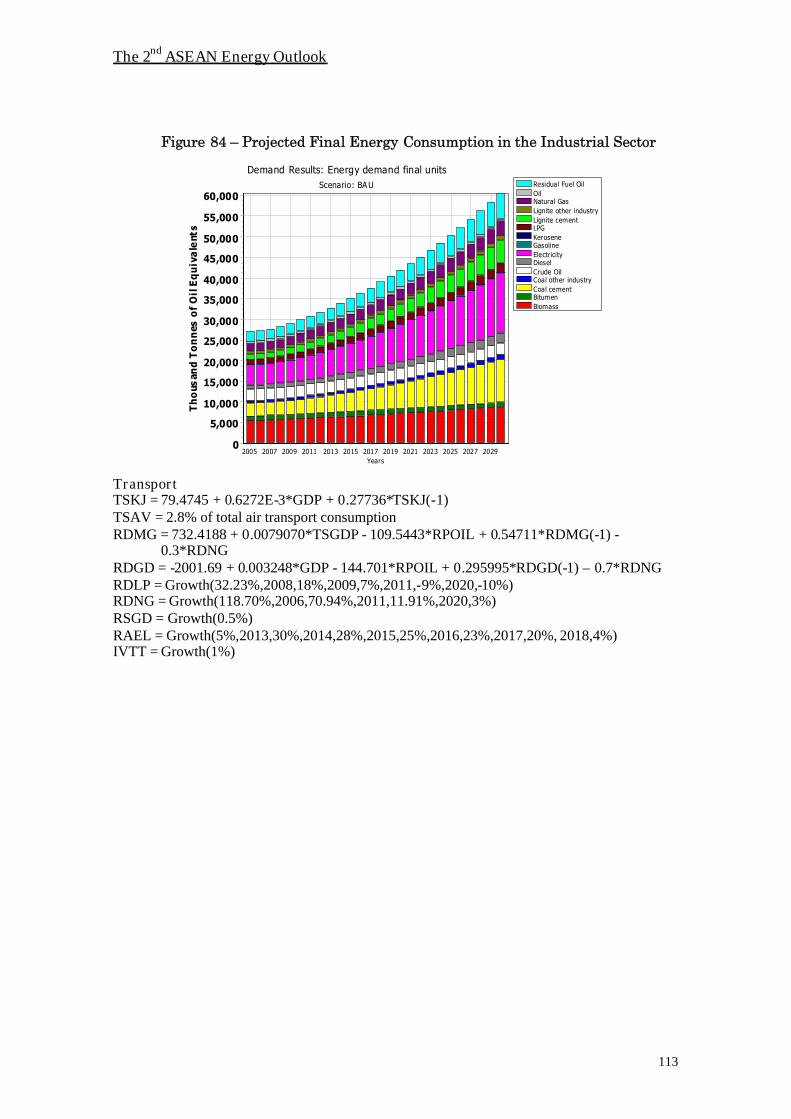
The 2nd ASEAN Energy Outlook
113
Figure 84 – Projected Final Energy Consumption in the Industrial Sector
Residual Fuel OilOilNatural GasLignite other industryLignite cementLPGKeroseneGasolineElectricityDieselCrude OilCoal other industryCoal cementBitumenBiomass
Demand Results: Energy demand final unitsScenario: BAU
Years2005 2007 2009 2011 2013 2015 2017 2019 2021 2023 2025 2027 2029
Th
ous
and
To
nn
eso
fO
ilE
qu
iva
lent
s60,000
55,000
50,000
45,000
40,000
35,000
30,000
25,000
20,000
15,000
10,000
5,000
0
TransportTSKJ = 79.4745 + 0.6272E-3*GDP + 0.27736*TSKJ(-1)TSAV = 2.8% of total air transport consumptionRDMG = 732.4188 + 0.0079070*TSGDP - 109.5443*RPOIL + 0.54711*RDMG(-1) -
0.3*RDNGRDGD = -2001.69 + 0.003248*GDP - 144.701*RPOIL + 0.295995*RDGD(-1) – 0.7*RDNGRDLP = Growth(32.23%,2008,18%,2009,7%,2011,-9%,2020,-10%)RDNG = Growth(118.70%,2006,70.94%,2011,11.91%,2020,3%)RSGD = Growth(0.5%)RAEL = Growth(5%,2013,30%,2014,28%,2015,25%,2016,23%,2017,20%, 2018,4%)IVTT = Growth(1%)
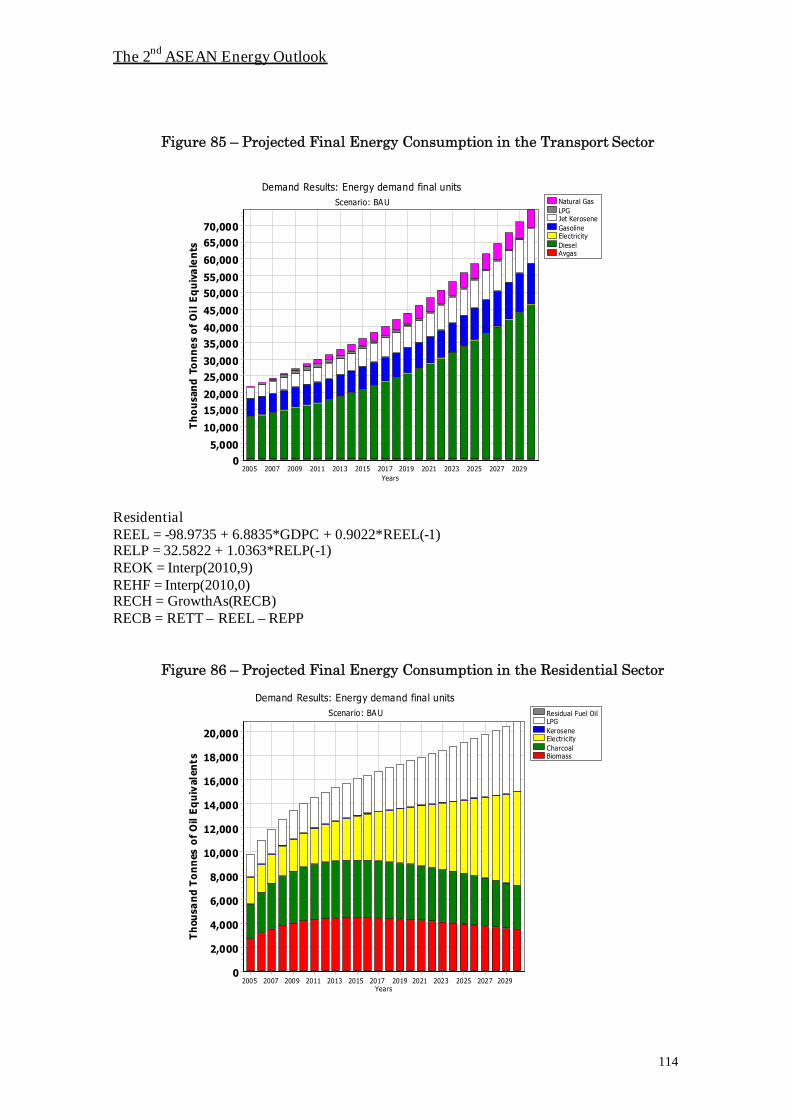
The 2nd ASEAN Energy Outlook
114
Figure 85 – Projected Final Energy Consumption in the Transport Sector
Natural GasLPGJet KeroseneGasolineElectricityDieselAvgas
Demand Results: Energy demand final unitsScenario: BAU
Years2005 2007 2009 2011 2013 2015 2017 2019 2021 2023 2025 2027 2029
Th
ou
san
dTo
nn
es
of
Oil
Eq
uiv
ale
nts
70,000
65,000
60,000
55,000
50,000
45,000
40,000
35,000
30,000
25,000
20,000
15,000
10,000
5,000
0
ResidentialREEL = -98.9735 + 6.8835*GDPC + 0.9022*REEL(-1)RELP = 32.5822 + 1.0363*RELP(-1)REOK = Interp(2010,9)REHF = Interp(2010,0)RECH = GrowthAs(RECB)RECB = RETT – REEL – REPP
Figure 86 – Projected Final Energy Consumption in the Residential Sector
Residual Fuel OilLPGKeroseneElectricityCharcoalBiomass
Demand Results: Energy demand final unitsScenario: BAU
Years2005 2007 2009 2011 2013 2015 2017 2019 2021 2023 2025 2027 2029
Th
ousa
nd
To
nn
eso
fO
ilE
qu
ival
ents
20,000
18,000
16,000
14,000
12,000
10,000
8,000
6,000
4,000
2,000
0

The 2nd ASEAN Energy Outlook
115
CommercialCSEL = -1303.1316+73.4021*GDPC
Figure 87 – Projected Final Energy Consumption in the Commercial Sector
Electricity
Demand Results: Energy demand final unitsScenario: BAU
Years2005 2007 2009 2011 2013 2015 2017 2019 2021 2023 2025 2027 2029
Th
ousa
nd
To
nn
eso
fO
ilE
qu
ival
ents
11,000
10,000
9,000
8,000
7,000
6,000
5,000
4,000
3,000
2,000
1,000
0
AgricultureAGEL = -3.080314715 + 0.28E-5*GDP + 0.65882863*AGEL(-1)AGPP = -735.095 + 0.0042052*AGGDP + 0.69804*AGPP(-1) -309.2891
Figure 88 – Projected Final Energy Consumption in the Commercial Sector
Residual Fuel OilLPGGasolineElectricityDiesel
Demand Results: Energy demand final unitsScenario: BAU
Years2005 2007 2009 2011 2013 2015 2017 2019 2021 2023 2025 2027 2029
Th
ousa
nd
To
nn
eso
fO
ilE
qu
ival
ents
6,000
5,500
5,000
4,500
4,000
3,500
3,000
2,500
2,000
1,500
1,000
500
0

The 2nd ASEAN Energy Outlook
116
VIETNAM
IndustryINHC = 66.0909 + 0.00001411*INGDP - 0.0003238*RPOIL + 0.58669*INHC(-1)INEL = GrowthAs(INGDP,1.2)INGD = -36.6871 + 0.000002832*INGDP + 0.67485*INGD(-1)INLP = -51.6000 + 0.000001233*INGDP + 0.20375*INLP(-1)INOK = GrowthAs(INGDP)INHF = GrowthAs(INGDP)INNG = -19.2909 + 0.0000004909*INGDP + 0.84048*INNG(-1)
Figure 89 – Projected Final Energy Consumption in the Industrial Sector
Solid FuelsOil ProductsNatural GasElectricity
Demand Results: Energy demand final unitsScenario: BAU
Years2005 2007 2009 2011 2013 2015 2017 2019 2021 2023 2025 2027 2029
Th
ous
and
To
nn
eso
fO
ilE
qu
iva
lent
s
60,000
55,000
50,000
45,000
40,000
35,000
30,000
25,000
20,000
15,000
10,000
5,000
0
TransportationICKJ = -60.4284 + 0.0000004308*GDP + 0.63881*ICKJ(-1)DAKJ = GrowthAs(ICKJ)
ResidentialREHC = -44.1513 + 0.000001686*GDP + 0.40691*REHC(-1)REEL = -104.4047 + 0.000001156*GDP + 0.88501*REEL(-1)RELP = -43.4411 + 0.0000003240*GDP + 0.85951*RELP(-1)REGD = GrowthAs(GDP)REOK = GrowthAs(GDP)RECB = GrowthAs(POPR)
CommercialCSHC = GrowthAs(GDP)CSEL = GrowthAs(GDP)CSLP = -52.1422 + 0.0000003983*GDP + 0.50657*CSLP(-1)CSGD = GrowthAs(GDP)CSOK = GrowthAs(GDP)

The 2nd ASEAN Energy Outlook
117
CSHF = GrowthAs(GDP)
Figure 90 – Projected Final Energy Consumption in the Transport Sector
Residual Fuel OilJet KeroseneGasolineDieselBioEthanol
Demand Results: Energy demand final units
Scenario: BAU
Years2005 2007 2009 2011 2013 2015 2017 2019 2021 2023 2025 2027 2029
Tho
usa
nd
To
nn
esof
Oil
Eq
uiv
alen
ts
35,000
30,000
25,000
20,000
15,000
10,000
5,000
0
Figure 91 – Projected Final Energy Consumption in the Residential Sector
LPGKeroseneElectricityDieselCoal AnthraciteBiomass
Demand Results: Energy demand final un itsScenario: BAU
Years2005 2007 2009 2011 2013 2015 2017 2019 2021 2023 2025 2027 2029
Th
ou
san
dT
onn
es
of
Oil
Eq
uiv
ale
nts
40,000
35,000
30,000
25,000
20,000
15,000
10,000
5,000
0

The 2nd ASEAN Energy Outlook
118
Figure 92 – Projected Final Energy Consumption in the Commercial Sector
Residual Fuel OilLPGKeroseneElectricityDieselCoal Anthracite
Demand Results: Energy demand final unitsScenario: BAU
Years2005 2007 2009 2011 2013 2015 2017 2019 2021 2023 2025 2027 2029
Th
ous
and
To
nn
eso
fO
ilE
qu
iva
lent
s7,500
7,000
6,500
6,000
5,500
5,000
4,500
4,000
3,500
3,000
2,500
2,000
1,500
1,000
500
0
AgricultureAGHC = GrowthAs(GDP)AGEL = GrowthAs(AGGDP,1.4)AGGD = GrowthAs(AGGDP)AGHF = GrowthAs(GDP)
Figure 93 – Projected Final Energy Consumption in the Commercial Sector
Residual Fuel OilElectricityDieselCoal Anthracite
Demand Results: Energy demand final unitsScenario: BAU
Years2005 2007 2009 2011 2013 2015 2017 2019 2021 2023 2025 2027 2029
Th
ou
san
dT
on
nes
of
Oil
Equ
iva
len
ts
1,000
900
800
700
600
500
400
300
200
100
0

The 2nd ASEAN Energy Outlook
119
Annex 3 – Naming Convention for Sectors, Energy and Key Variables

The 2nd ASEAN Energy Outlook
120

The 2nd ASEAN Energy Outlook
121
Annex 3 – Naming Convention
Sectors and Energy
Sector Abbreviation Energy AbbreviationTotal Final Consumption FC Hard Coal HCIndustry IN Lignite/Brown Coal/Sub-
Bituminous Coal LBIron and Steel IS Combustible Renewables
and Waste CBChemical and Petrochemical CX Charcoal CHNon-Ferrous Metals NF Natural Gas NGNon-Metallic Minerals NM Crude Oil CRTransport Equipment TE Total Petroleum PPMachinery MC Refinery Gas RG
Mining and Quarrying MQLiquefied PetroleumGases(LPG) LP
Food and Tobacco FT Motor Gasoline MGPaper, Pulp and Printing PP Aviation Gasoline AVWood and Wood Products WP Gasoline type jet Fuel GJConstruction CT Kerosene type Jet Fuel KJTextile and Leather TL Other Kerosene OKTotal Transport Sector TS Gas/Diesel Oil GDInternational Civil Aviation IC Heavy Fuel Oil HFDomestic Air Transport DA Naphtha NPRoad RD Lubricants LURail RA Bitumen BTPipeline Transport PT Petroleum PCInternal Navigation IV Other Petroleum Products OPNon-specified Transport N4 Nuclear NUTotal Other Sectors OS Hydro HDAgriculture AG Geothermal GTCommercial and PublicServices CS Electricity ELResidential RE Heat HTNon-specified Other N5 Total Energy TT
From the tables above, the names of variables referring to consumption of a certain kindof energy by a certain sector can also be derived. For example, the consumption of theIndustrial sector (IN) of Hard Coal (HC) is INHC. Consumption of Electricity (EL) isINEL and Total Petroleum (PP) is INPP, etc.
Key variables shown in the table below can also be combined with the sectors listed inthe tables above. The sectoral gross domestic product (GDP) of Industry (IN) is INGDP,sectoral gross domestic product of Iron and Steel industry (IS) is ISGDP, etc. The GDPof the Commercial and Public Services sector (CS) is CSGDP.

The 2nd ASEAN Energy Outlook
122
Key Variables
Variable Abbreviation Variable AbbreviationGross Domestic Product GDP Population POPGDP of Industry INDGP Urban Population POPUGDP per Capita GDPC Rural Population POPRGDP Deflator PGDP Number of Households NHOUPrivate Consumption CP Price of Oil of Crude Oil POILExchange Rate EXR Domestic Price of Oil DPOILConsumer Price Index CPI Real Price of Crude Oil RPOIL
The 2nd ASEAN Energy Outlook
123
Annex 4 – Results Summary Tables

The 2nd ASEAN Energy Outlook
124
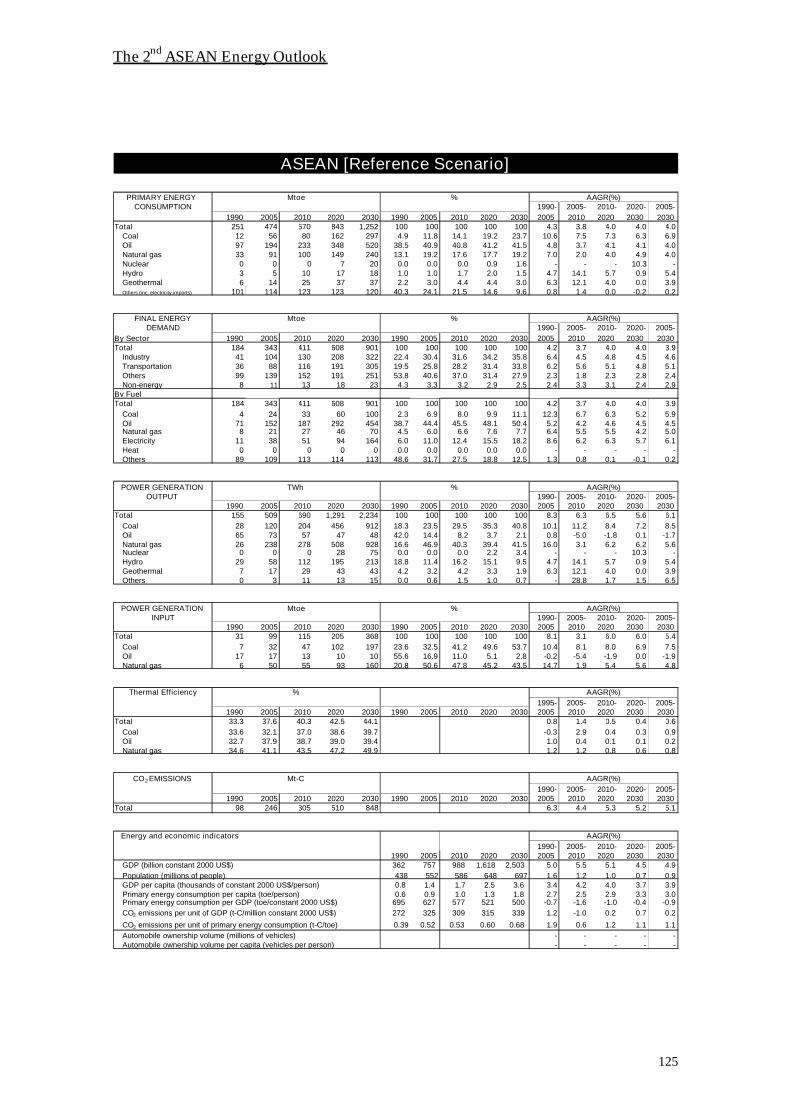
The 2nd ASEAN Energy Outlook
125
1990- 2005- 2010- 2020- 2005-1990 2005 2010 2020 2030 1990 2005 2010 2020 2030 2005 2010 2020 2030 2030
Total 251 474 570 843 1,252 100 100 100 100 100 4.3 3.8 4.0 4.0 4.0Coal 12 56 80 162 297 4.9 11.8 14.1 19.2 23.7 10.6 7.5 7.3 6.3 6.9Oil 97 194 233 348 520 38.5 40.9 40.8 41.2 41.5 4.8 3.7 4.1 4.1 4.0Natural gas 33 91 100 149 240 13.1 19.2 17.6 17.7 19.2 7.0 2.0 4.0 4.9 4.0Nuclear 0 0 0 7 20 0.0 0.0 0.0 0.9 1.6 - - - 10.3 -Hydro 3 5 10 17 18 1.0 1.0 1.7 2.0 1.5 4.7 14.1 5.7 0.9 5.4Geothermal 6 14 25 37 37 2.2 3.0 4.4 4.4 3.0 6.3 12.1 4.0 0.0 3.9Others (inc. electricity imports) 101 114 123 123 120 40.3 24.1 21.5 14.6 9.6 0.8 1.4 0.0 -0.2 0.2
1990- 2005- 2010- 2020- 2005-By Sector 1990 2005 2010 2020 2030 1990 2005 2010 2020 2030 2005 2010 2020 2030 2030Total 184 343 411 608 901 100 100 100 100 100 4.2 3.7 4.0 4.0 3.9
Industry 41 104 130 208 322 22.4 30.4 31.6 34.2 35.8 6.4 4.5 4.8 4.5 4.6Transportation 36 88 116 191 305 19.5 25.8 28.2 31.4 33.8 6.2 5.6 5.1 4.8 5.1
99 139 152 191 251 53.8 40.6 37.0 31.4 27.9 2.3 1.8 2.3 2.8 2.4Non-energy 8 11 13 18 23 4.3 3.3 3.2 2.9 2.5 2.4 3.3 3.1 2.4 2.9
By FuelTotal 184 343 411 608 901 100 100 100 100 100 4.2 3.7 4.0 4.0 3.9
Coal 4 24 33 60 100 2.3 6.9 8.0 9.9 11.1 12.3 6.7 6.3 5.2 5.9Oil 71 152 187 292 454 38.7 44.4 45.5 48.1 50.4 5.2 4.2 4.6 4.5 4.5Natural gas 8 21 27 46 70 4.5 6.0 6.6 7.6 7.7 6.4 5.5 5.5 4.2 5.0Electricity 11 38 51 94 164 6.0 11.0 12.4 15.5 18.2 8.6 6.2 6.3 5.7 6.1Heat 0 0 0 0 0 0.0 0.0 0.0 0.0 0.0 - - - - -Others 89 109 113 114 113 48.6 31.7 27.5 18.8 12.5 1.3 0.8 0.1 -0.1 0.2
1990- 2005- 2010- 2020- 2005-1990 2005 2010 2020 2030 1990 2005 2010 2020 2030 2005 2010 2020 2030 2030
Total 155 509 690 1,291 2,234 100 100 100 100 100 8.3 6.3 6.5 5.6 6.1Coal 28 120 204 456 912 18.3 23.5 29.5 35.3 40.8 10.1 11.2 8.4 7.2 8.5Oil 65 73 57 47 48 42.0 14.4 8.2 3.7 2.1 0.8 -5.0 -1.8 0.1 -1.7Natural gas 26 238 278 508 928 16.6 46.9 40.3 39.4 41.5 16.0 3.1 6.2 6.2 5.6Nuclear 0 0 0 28 75 0.0 0.0 0.0 2.2 3.4 - - - 10.3 -Hydro 29 58 112 195 213 18.8 11.4 16.2 15.1 9.5 4.7 14.1 5.7 0.9 5.4Geothermal 7 17 29 43 43 4.2 3.2 4.2 3.3 1.9 6.3 12.1 4.0 0.0 3.9Others 0 3 11 13 15 0.0 0.6 1.5 1.0 0.7 - 28.8 1.7 1.5 6.5
1990- 2005- 2010- 2020- 2005-1990 2005 2010 2020 2030 1990 2005 2010 2020 2030 2005 2010 2020 2030 2030
Total 31 99 115 205 368 100 100 100 100 100 8.1 3.1 6.0 6.0 5.4Coal 7 32 47 102 197 23.6 32.5 41.2 49.6 53.7 10.4 8.1 8.0 6.9 7.5Oil 17 17 13 10 10 55.6 16.9 11.0 5.1 2.8 -0.2 -5.4 -1.9 0.0 -1.9Natural gas 6 50 55 93 160 20.8 50.6 47.8 45.2 43.5 14.7 1.9 5.4 5.6 4.8
1995- 2005- 2010- 2020- 2005-1990 2005 2010 2020 2030 1990 2005 2010 2020 2030 2005 2010 2020 2030 2030
Total 33.3 37.6 40.3 42.5 44.1 0.8 1.4 0.5 0.4 0.6Coal 33.6 32.1 37.0 38.6 39.7 -0.3 2.9 0.4 0.3 0.9Oil 32.7 37.9 38.7 39.0 39.4 1.0 0.4 0.1 0.1 0.2Natural gas 34.6 41.1 43.5 47.2 49.9 1.2 1.2 0.8 0.6 0.8
1990- 2005- 2010- 2020- 2005-1990 2005 2010 2020 2030 1990 2005 2010 2020 2030 2005 2010 2020 2030 2030
Total 98 246 305 510 848 6.3 4.4 5.3 5.2 5.1
Energy and economic indicators1990- 2005- 2010- 2020- 2005-
1990 2005 2010 2020 2030 2005 2010 2020 2030 2030GDP (billion constant 2000 US$) 362 757 988 1,618 2,503 5.0 5.5 5.1 4.5 4.9Population (millions of people) 438 552 586 648 697 1.6 1.2 1.0 0.7 0.9GDP per capita (thousands of constant 2000 US$/person) 0.8 1.4 1.7 2.5 3.6 3.4 4.2 4.0 3.7 3.9Primary energy consumption per capita (toe/person) 0.6 0.9 1.0 1.3 1.8 2.7 2.5 2.9 3.3 3.0Primary energy consumption per GDP (toe/constant 2000 US$) 695 627 577 521 500 -0.7 -1.6 -1.0 -0.4 -0.9CO2 emissions per unit of GDP (t-C/million constant 2000 US$) 272 325 309 315 339 1.2 -1.0 0.2 0.7 0.2
CO2 emissions per unit of primary energy consumption (t-C/toe) 0.39 0.52 0.53 0.60 0.68 1.9 0.6 1.2 1.1 1.1Automobile ownership volume (millions of vehicles) - - - - -
- - - - -
AAGR(%)
AAGR(%)
Automobile ownership volume per capita (vehicles per person)
CO2 EMISSIONS Mt-C
AAGR(%)INPUT
Thermal Efficiency % AAGR(%)
OUTPUT
POWER GENERATION Mtoe %
POWER GENERATION TWh % AAGR(%)
% AAGR(%)DEMAND
Others
CONSUMPTION
FINAL ENERGY Mtoe
ASEAN [Reference Scenario]
PRIMARY ENERGY Mtoe % AAGR(%)

The 2nd ASEAN Energy Outlook
126
1990- 2005- 2010- 2020- 2005-1990 2005 2010 2020 2030 1990 2005 2010 2020 2030 2005 2010 2020 2030 2030
Total 251 474 579 926 1,548 100 100 100 100 100 4.3 4.1 4.8 5.3 4.8Coal 12 56 82 189 405 4.9 11.8 14.1 20.5 26.2 10.6 8.0 8.7 7.9 8.3Oil 97 194 237 383 639 38.5 40.9 40.9 41.3 41.3 4.8 4.1 4.9 5.3 4.9Natural gas 33 91 103 169 307 13.1 19.2 17.8 18.3 19.8 7.0 2.5 5.1 6.1 5.0Nuclear 0 0 0 7 19 0.0 0.0 0.0 0.8 1.2 - - - 10.1 -Hydro 3 5 10 18 22 1.0 1.0 1.7 1.9 1.5 4.7 14.2 6.3 2.3 6.2Geothermal 6 14 25 37 37 2.2 3.0 4.3 4.0 2.4 6.3 12.1 4.0 0.0 3.9Others (inc. electricity imports) 101 114 123 122 117 40.3 24.1 21.1 13.2 7.6 0.8 1.4 0.0 -0.4 0.1
1990- 2005- 2010- 2020- 2005-By Sector 1990 2005 2010 2020 2030 1990 2005 2010 2020 2030 2005 2010 2020 2030 2030Total 184 343 418 670 1,123 100 100 100 100 100 4.2 4.0 4.8 5.3 4.9
Industry 41 104 132 231 412 22.4 30.4 31.6 34.5 36.7 6.4 4.9 5.8 5.9 5.7Transportation 36 88 119 218 394 19.5 25.8 28.5 32.6 35.1 6.2 6.1 6.2 6.1 6.2
99 139 153 202 291 53.8 40.6 36.7 30.1 25.9 2.3 1.9 2.8 3.7 3.0Non-energy 8 11 13 18 26 4.3 3.3 3.2 2.8 2.3 2.4 3.5 3.3 3.3 3.3
By FuelTotal 184 343 418 670 1,123 100 100 100 100 100 4.2 4.0 4.8 5.3 4.9
Coal 4 24 34 69 136 2.3 6.9 8.2 10.4 12.1 12.3 7.5 7.4 6.9 7.2Oil 71 152 191 328 573 38.7 44.4 45.8 48.9 51.1 5.2 4.7 5.5 5.7 5.4Natural gas 8 21 27 50 87 4.5 6.0 6.5 7.5 7.8 6.4 5.7 6.4 5.6 5.9Electricity 11 38 52 108 214 6.0 11.0 12.5 16.2 19.1 8.6 6.8 7.5 7.1 7.2Heat 0 0 0 0 0 0.0 0.0 0.0 0.0 0.0 - - - - -Others 89 109 113 114 112 48.6 31.7 27.0 17.0 10.0 1.3 0.8 0.1 -0.2 0.1
1990- 2005- 2010- 2020- 2005-1990 2005 2010 2020 2030 1990 2005 2010 2020 2030 2005 2010 2020 2030 2030
Total 155 509 709 1,481 2,923 100 100 100 100 100 8.3 6.9 7.6 7.0 7.2Coal 28 120 206 538 1,251 18.3 23.5 29.1 36.4 42.8 10.1 11.5 10.1 8.8 9.8Oil 65 73 58 46 47 42.0 14.4 8.1 3.1 1.6 0.8 -4.7 -2.2 0.2 -1.8Natural gas 26 238 293 605 1,232 16.6 46.9 41.3 40.9 42.1 16.0 4.2 7.5 7.4 6.8Nuclear 0 0 0 28 74 0.0 0.0 0.0 1.9 2.5 - - - 10.1 -Hydro 29 58 113 208 262 18.8 11.4 15.9 14.0 8.9 4.7 14.2 6.3 2.3 6.2Geothermal 7 17 29 43 43 4.2 3.2 4.1 2.9 1.5 6.3 12.1 4.0 0.0 3.9Others 0 3 11 13 15 0.0 0.6 1.5 0.9 0.5 - 28.8 1.7 1.5 6.5
1990- 2005- 2010- 2020- 2005-1990 2005 2010 2020 2030 1990 2005 2010 2020 2030 2005 2010 2020 2030 2030
Total 31 99 118 239 490 100 100 100 100 100 8.1 3.7 7.3 7.4 6.6Coal 7 32 48 120 270 23.6 32.5 40.5 50.3 55.1 10.4 8.4 9.6 8.4 8.9Oil 17 17 13 10 10 55.6 16.9 10.9 4.3 2.1 -0.2 -5.0 -2.3 0.1 -1.9Natural gas 6 50 57 108 209 20.8 50.6 48.6 45.5 42.8 14.7 2.8 6.6 6.8 5.9
1995- 2005- 2010- 2020- 2005-1990 2005 2010 2020 2030 1990 2005 2010 2020 2030 2005 2010 2020 2030 2030
Total 33.3 37.6 40.5 42.9 44.4 0.8 1.5 0.6 0.4 0.7Coal 33.6 32.1 37.0 38.6 39.9 -0.3 2.9 0.4 0.3 0.9Oil 32.7 37.9 38.5 38.7 39.3 1.0 0.3 0.0 0.2 0.1Natural gas 34.6 41.1 43.9 48.0 50.6 1.2 1.3 0.9 0.5 0.8
1990- 2005- 2010- 2020- 2005-1990 2005 2010 2020 2030 1990 2005 2010 2020 2030 2005 2010 2020 2030 2030
Total 98 246 312 582 1,107 6.3 4.9 6.4 6.6 6.2
Energy and economic indicators1990- 2005- 2010- 2020- 2005-
1990 2005 2010 2020 2030 2005 2010 2020 2030 2030GDP (billion constant 2000 US$) 362 757 1,023 1,900 3,422 5.0 6.2 6.4 6.1 6.2Population (millions of people) 438 552 586 648 697 1.6 1.2 1.0 0.7 0.9GDP per capita (thousands of constant 2000 US$/person) 0.8 1.4 1.7 2.9 4.9 3.4 4.9 5.3 5.3 5.2Primary energy consumption per capita (toe/person) 0.6 0.9 1.0 1.4 2.2 2.7 2.8 3.8 4.5 3.9Primary energy consumption per GDP (toe/constant 2000 US$) 695 627 566 487 452 -0.7 -2.0 -1.5 -0.7 -1.3CO2 emissions per unit of GDP (t-C/million constant 2000 US$) 272 325 305 306 323 1.2 -1.3 0.0 0.5 0.0CO2 emissions per unit of primary energy consumption (t-C/toe) 0.39 0.52 0.54 0.63 0.72 1.9 0.8 1.5 1.3 1.3Automobile ownership volume (millions of vehicles) - - - - -
- - - - -
ASEAN [High Growth Scenario]
PRIMARY ENERGY Mtoe % AAGR(%)CONSUMPTION
FINAL ENERGY Mtoe % AAGR(%)DEMAND
Others
POWER GENERATION TWh % AAGR(%)OUTPUT
POWER GENERATION Mtoe % AAGR(%)INPUT
Thermal Efficiency % AAGR(%)
CO2 EMISSIONS Mt-C AAGR(%)
AAGR(%)
Automobile ownership volume per capita (vehicles per person)

The 2nd ASEAN Energy Outlook
127
1990- 2005- 2010- 2020- 2005-1990 2005 2010 2020 2030 1990 2005 2010 2020 2030 2005 2010 2020 2030 2030
Total 1,798 2,435 2,618 3,258 4,165 100 100 100 100 100 2.0 1.5 2.2 2.5 2.2Coal 0 0 0 0 0 0.0 0.0 0.0 0.0 0.0 - - - - -Oil 122 595 710 1,050 1,590 6.8 24.4 27.1 32.2 38.2 11.1 3.6 4.0 4.2 4.0Natural gas 1,676 1,840 1,908 2,208 2,575 93.2 75.6 72.9 67.8 61.8 0.6 0.7 1.5 1.5 1.4Nuclear 0 0 0 0 0 0.0 0.0 0.0 0.0 0.0 - - - - -Hydro 0 0 0 0 0 0.0 0.0 0.0 0.0 0.0 - - - - -Geothermal 0 0 0 0 0 0.0 0.0 0.0 0.0 0.0 - - - - -Others (inc. electricity imports) 0 0 0 0 0 0.0 0.0 0.0 0.0 0.0 - - - - -
1990- 2005- 2010- 2020- 2005-By Sector 1990 2005 2010 2020 2030 1990 2005 2010 2020 2030 2005 2010 2020 2030 2030Total 387 719 850 1,244 1,805 100 100 100 100 100 4.2 3.4 3.9 3.8 3.8
Industry 60 79 83 105 141 15.5 11.0 9.8 8.4 7.8 1.9 1.0 2.4 3.0 2.3Transportation 226 404 487 714 1,044 58.4 56.2 57.3 57.4 57.8 3.9 3.8 3.9 3.9 3.9
101 236 280 425 620 26.1 32.8 32.9 34.2 34.3 5.8 3.5 4.3 3.8 3.9Non-energy 0.0 0.0 0.0 0.0 0.0 - - - - -
By FuelTotal 387 719 850 1,244 1,805 100 100 100 100 100 4.2 3.4 3.9 3.8 3.8
Coal 0.0 0.0 0.0 0.0 0.0 - - - - -Oil 300 485 572 816 1,172 77.5 67.5 67.3 65.6 64.9 3.3 3.4 3.6 3.7 3.6Natural gas 0.0 0.0 0.0 0.0 0.0 - - - - -Electricity 87 234 278 428 633 22.5 32.5 32.7 34.4 35.1 6.8 3.5 4.4 4.0 4.1Heat 0.0 0.0 0.0 0.0 0.0 - - - - -Others 0.0 0.0 0.0 0.0 0.0 - - - - -
1990- 2005- 2010- 2020- 2005-1990 2005 2010 2020 2030 1990 2005 2010 2020 2030 2005 2010 2020 2030 2030
Total 1,172 2,907 3,449 5,310 7,867 100 100 100 100 100 6.2 3.5 4.4 4.0 4.1Coal 0.0 0.0 0.0 0.0 0.0 - - - - -Oil 11 17 10 15 22 0.9 0.6 0.3 0.3 0.3 2.9 -10.1 4.1 3.9 1.0Natural gas 1,161 2,890 3,439 5,295 7,845 99.1 99.4 99.7 99.7 99.7 6.3 3.5 4.4 4.0 4.1Nuclear 0.0 0.0 0.0 0.0 0.0 - - - - -Hydro 0.0 0.0 0.0 0.0 0.0 - - - - -Geothermal 0.0 0.0 0.0 0.0 0.0 - - - - -Others 0.0 0.0 0.0 0.0 0.0 - - - - -
1990- 2005- 2010- 2020- 2005-1990 2005 2010 2020 2030 1990 2005 2010 2020 2030 2005 2010 2020 2030 2030
Total 462 980 1,044 1,336 1,691 100 100 100 100 100 5.1 1.3 2.5 2.4 2.2Coal 0.0 0.0 0.0 0.0 0.0 - - - - -Oil 3 4 2 4 5 0.6 0.4 0.2 0.3 0.3 1.9 -12.9 7.2 2.3 0.9Natural gas 459 976 1,042 1,332 1,686 99.4 99.6 99.8 99.7 99.7 5.2 1.3 2.5 2.4 2.2
1995- 2005- 2010- 2020- 2005-1990 2005 2010 2020 2030 1990 2005 2010 2020 2030 2005 2010 2020 2030 2030
Total 21.8 25.5 28.4 34.2 40.0 1.0 2.2 1.9 1.6 1.8Coal - - - - -Oil 31.5 36.6 43.0 32.3 37.8 1.0 3.3 -2.8 1.6 0.1Natural gas 21.8 25.5 28.4 34.2 40.0 1.1 2.2 1.9 1.6 1.8
1990- 2005- 2010- 2020- 2005-1990 2005 2010 2020 2030 1990 2005 2010 2020 2030 2005 2010 2020 2030 2030
Total 914 1,392 1,518 1,947 2,552 100 100 100 100 2.8 1.7 2.5 2.7 2.5
Energy and economic indicators1990- 2005- 2010- 2020- 2005-
1990 2005 2010 2020 2030 2005 2010 2020 2030 2030GDP (billion constant 2000 US$) 4.8 6.7 8.2 11.8 16.7 2.2 4.2 3.8 3.5 3.8Population (millions of people) 0.3 0.4 0.4 0.5 0.6 2.5 2.1 1.7 1.3 1.6GDP per capita (thousands of constant 2000 US$/person) 18.5 17.8 19.7 24.1 29.9 -0.3 2.0 2.0 2.2 2.1Primary energy consumption per capita (toe/person) 6.92 6.51 6.31 6.64 7.46 -0.4 -0.6 0.5 1.2 0.5Primary energy consumption per GDP (toe/constant 2000 US$) 374 366 321 275 249 -0.1 -2.6 -1.5 -1.0 -1.5CO2 emissions per unit of GDP (t-C/million constant 2000 US$) 190 209 186 165 153 0.6 -2.3 -1.2 -0.7 -1.3CO2 emissions per unit of primary energy consumption (t-C/toe) 0.5 0.57 0.58 0.60 0.61 0.8 0.3 0.3 0.3 0.3Automobile ownership volume (millions of vehicles) - - - - -
- - - - -
BRUNEI DARUSSALAM [Reference Scenario]
PRIMARY ENERGY ktoe % AAGR(%)CONSUMPTION
FINAL ENERGY ktoe % AAGR(%)DEMAND
Others
POWER GENERATION GWh % AAGR(%)OUTPUT
POWER GENERATION ktoe % AAGR(%)INPUT
Thermal Efficiency % AAGR(%)
CO2 EMISSIONS kt-C % AAGR(%)
AAGR(%)
Automobile ownership volume per capita (vehicles per person)

The 2nd ASEAN Energy Outlook
128
1990- 2005- 2010- 2020- 2005-1990 2005 2010 2020 2030 1990 2005 2010 2020 2030 2005 2010 2020 2030 2030
Total 1,798 2,435 2,697 3,680 5,182 100 100 100 100 100 2.0 2.1 3.2 3.5 3.1Coal 0.0 0.0 0.0 0.0 0.0 - - - - -Oil 122 595 735 1,238 2,093 6.8 24.4 27.3 33.6 40.4 11.1 4.3 5.4 5.4 5.2Natural gas 1,676 1,840 1,962 2,442 3,089 93.2 75.6 72.7 66.4 59.6 0.6 1.3 2.2 2.4 2.1Nuclear 0.0 0.0 0.0 0.0 0.0 - - - - -Hydro 0.0 0.0 0.0 0.0 0.0 - - - - -Geothermal 0.0 0.0 0.0 0.0 0.0 - - - - -Others (inc. electricity imports) 0.0 0.0 0.0 0.0 0.0 - - - - -
1990- 2005- 2010- 2020- 2005-By Sector 1990 2005 2010 2020 2030 1990 2005 2010 2020 2030 2005 2010 2020 2030 2030Total 387 719 886 1,440 2,317 100 100 100 100 100 4.2 4.3 5.0 4.9 4.8
Industry 60 79 86 119 179 15.5 11.0 9.7 8.3 7.7 1.9 1.7 3.3 4.2 3.3Transportation 226 404 507 830 1,351 58.4 56.2 57.2 57.6 58.3 3.9 4.6 5.1 5.0 4.9
101 236 293 491 787 26.1 32.8 33.1 34.1 34.0 5.8 4.4 5.3 4.8 4.9Non-energy 0.0 0.0 0.0 0.0 0.0 - - - - -
By FuelTotal 387 719 886 1,440 2,317 100 100 100 100 100 4.2 4.3 5.0 4.9 4.8
Coal 0.0 0.0 0.0 0.0 0.0 - - - - -Oil 300 485 594 940 1,497 77.5 67.5 67.0 65.3 64.6 3.3 4.1 4.7 4.8 4.6Natural gas 0.0 0.0 0.0 0.0 0.0 - - - - -Electricity 87 234 292 500 820 22.5 32.5 33.0 34.7 35.4 6.8 4.5 5.5 5.1 5.1Heat 0.0 0.0 0.0 0.0 0.0 - - - - -Others 0.0 0.0 0.0 0.0 0.0 - - - - -
1990- 2005- 2010- 2020- 2005-1990 2005 2010 2020 2030 1990 2005 2010 2020 2030 2005 2010 2020 2030 2030
Total 1,172 2,907 3,621 6,211 10,185 100 100 100 100 100 6.2 4.5 5.5 5.1 5.1Coal 0.0 0.0 0.0 0.0 0.0 - - - - -Oil 11 17 10 18 29 0.9 0.6 0.3 0.3 0.3 2.9 -10.1 6.1 4.9 2.2Natural gas 1,161 2,890 3,611 6,193 10,156 99.1 99.4 99.7 99.7 99.7 6.3 4.6 5.5 5.1 5.2Nuclear 0.0 0.0 0.0 0.0 0.0 - - - - -Hydro 0.0 0.0 0.0 0.0 0.0 - - - - -Geothermal 0.0 0.0 0.0 0.0 0.0 - - - - -Others 0.0 0.0 0.0 0.0 0.0 - - - - -
1990- 2005- 2010- 2020- 2005-1990 2005 2010 2020 2030 1990 2005 2010 2020 2030 2005 2010 2020 2030 2030
Total 462 980 1,096 1,562 2,190 100 100 100 100 100 5.1 2.3 3.6 3.4 3.3Coal 0.0 0.0 0.0 0.0 0.0 - - - - -Oil 3 4 2 4 7 0.6 0.4 0.2 0.3 0.3 1.9 -12.9 7.2 5.8 2.3Natural gas 459 976 1,094 1,558 2,183 99.4 99.6 99.8 99.7 99.7 5.2 2.3 3.6 3.4 3.3
1995- 2005- 2010- 2020- 2005-1990 2005 2010 2020 2030 1990 2005 2010 2020 2030 2005 2010 2020 2030 2030
Total 21.8 25.5 28.4 34.2 40.0 1.0 2.2 1.9 1.6 1.8Coal - - - - -Oil 31.5 36.6 43.0 38.7 35.6 1.0 3.3 -1.0 -0.8 -0.1Natural gas 21.8 25.5 28.4 34.2 40.0 1.1 2.2 1.9 1.6 1.8
1990- 2005- 2010- 2020- 2005-1990 2005 2010 2020 2030 1990 2005 2010 2020 2030 2005 2010 2020 2030 2030
Total 914 1,392 1,570 2,223 3,219 100 100 100 100 2.8 2.4 3.5 3.8 3.4
Energy and economic indicators1990- 2005- 2010- 2020- 2005-
1990 2005 2010 2020 2030 2005 2010 2020 2030 2030GDP (billion constant 2000 US$) 4.8 6.7 8.5 13.7 21.2 2.2 5.1 4.8 4.5 4.8Population (millions of people) 0.26 0.37 0.41 0.49 0.56 2.5 2.1 1.7 1.3 1.6GDP per capita (thousands of constant 2000 US$/person) 18.5 17.8 20.6 27.9 38.0 -0.3 3.0 3.1 3.2 3.1Primary energy consumption per capita (toe/person) 6.92 6.51 6.50 7.50 9.28 -0.4 0.0 1.4 2.2 1.4Primary energy consumption per GDP (toe/constant 2000 US$) 374 366 316 269 244 -0.1 -2.9 -1.6 -1.0 -1.6CO2 emissions per unit of GDP (t-C/million constant 2000 US$) 190 209 184 163 152 0.6 -2.6 -1.2 -0.7 -1.3
CO2 emissions per unit of primary energy consumption (t-C/toe) 0.5 0.57 0.58 0.60 0.62 0.8 0.4 0.4 0.3 0.3Automobile ownership volume (millions of vehicles) - - - - -
- - - - -
AAGR(%)
AAGR(%)
Automobile ownership volume per capita (vehicles per person)
CO2 EMISSIONS kt-C %
AAGR(%)INPUT
Thermal Efficiency % AAGR(%)
OUTPUT
POWER GENERATION ktoe %
POWER GENERATION GWh % AAGR(%)
% AAGR(%)DEMAND
Others
CONSUMPTION
FINAL ENERGY ktoe
BRUNEI DARUSSALAM [High Growth Scenario]
PRIMARY ENERGY ktoe % AAGR(%)

The 2nd ASEAN Energy Outlook
129
1995- 2005- 2010- 2020- 2005-1995 2005 2010 2020 2030 1995 2005 2010 2020 2030 2005 2010 2020 2030 2030
Total 3,385 4,812 5,024 6,536 8,759 100 100 100 100 100 3.6 0.9 2.7 3.0 2.4Coal 0 0 112 333 0.0 0.0 0.0 1.7 3.8 - - - 11.5 -Oil 484 1,272 1,229 1,924 2,997 14.3 26.4 24.5 29.4 34.2 10.1 -0.7 4.6 4.5 3.5Natural gas 0 0 33 97 0.0 0.0 0.0 0.5 1.1 - - - 11.5 -Nuclear 0 0 0 0 0.0 0.0 0.0 0.0 0.0 - - - - -Hydro 0 4 41 24 74 0.0 0.1 0.8 0.4 0.8 - 61.1 -5.1 11.7 12.6Geothermal 0 0 0 0 0.0 0.0 0.0 0.0 0.0 - - - - -Others (inc. electricity imports) 2,901 3,536 3,753 4,442 5,258 85.7 73.5 74.7 68.0 60.0 2.0 1.2 1.7 1.7 1.6
1995- 2005- 2010- 2020- 2005-By Sector 1995 2005 2010 2020 2030 1995 2005 2010 2020 2030 2005 2010 2020 2030 2030Total 3,278 4,530 5,071 6,527 8,535 100 100 100 100 100 3.3 2.3 2.6 2.7 2.6
Industry 3 51 74 133 236 0.1 1.1 1.5 2.0 2.8 32.8 7.7 6.1 5.9 6.3Transportation 284 429 553 883 1,436 8.7 9.5 10.9 13.5 16.8 4.2 5.2 4.8 5.0 5.0
2,991 4,050 4,444 5,511 6,862 91.2 89.4 87.6 84.4 80.4 3.1 1.9 2.2 2.2 2.1Non-energy 0.0 0.0 0.0 0.0 0.0 - - - - -
By FuelTotal 3,279 4,530 5,071 6,527 8,535 100 100 100 100 100 3.3 2.3 2.6 2.7 2.6
Coal 0 0 0 0 0.0 0.0 0.0 0.0 0.0 - - - - -Oil 369 930 1,226 1,924 2,997 11.3 20.5 24.2 29.5 35.1 9.7 5.7 4.6 4.5 4.8Natural gas 0 0 0 0 0.0 0.0 0.0 0.0 0.0 - - - - -Electricity 9 64 91 161 279 0.3 1.4 1.8 2.5 3.3 21.7 7.3 5.9 5.7 6.1Heat 0 0 0 0 0.0 0.0 0.0 0.0 0.0 - - - - -Others 2,901 3,536 3,753 4,442 5,258 88.5 78.1 74.0 68.1 61.6 2.0 1.2 1.7 1.7 1.6
1995- 2005- 2010- 2020- 2005-1995 2005 2010 2020 2030 1995 2005 2010 2020 2030 2005 2010 2020 2030 2030
Total 198 879 484 953 2,845 100 100 100 100 100 16.1 -11.2 7.0 11.6 4.8Coal 0 0 484 1,434 0.0 0.0 0.0 50.8 50.4 - - - 11.5 -Oil 198 835 7 0 0 100.0 95.0 1.5 0.0 0.0 15.5 -61.2 -100.0 - -100.0Natural gas 0 0 186 551 0.0 0.0 0.0 19.5 19.4 - - - 11.5 -Nuclear 0 0 0 0 0.0 0.0 0.0 0.0 0.0 - - - - -Hydro 44 477 283 860 0.0 5.0 98.5 29.7 30.2 - 61.1 -5.1 11.7 12.6Geothermal 0 0 0 0 0.0 0.0 0.0 0.0 0.0 - - - - -Others 0 0 0 0 0.0 0.0 0.0 0.0 0.0 - - - - -
1995- 2005- 2010- 2020- 2005-1995 2005 2010 2020 2030 1995 2005 2010 2020 2030 2005 2010 2020 2030 2030
Total 116 342 3 145 430 100 100 100 100 100 11.4 -61.2 47.3 11.5 0.9Coal 0 0 112 333 0.0 0.0 0.0 77.5 77.5 - - - 11.5 -Oil 116 342 3 0 0 100.0 100.0 100.0 0.0 0.0 11.4 -61.2 -100.0 - -100.0Natural gas 0 0 33 97 0.0 0.0 0.0 22.5 22.5 - - - 11.5 -
1995- 2005- 2010- 2020- 2005-1995 2005 2010 2020 2030 1995 2005 2010 2020 2030 2005 2010 2020 2030 2030
Total 14.7 21.0 21.0 39.7 39.7 3.6 0.0 6.6 0.0 2.6Coal 37.0 37.0 - - - 0.0 -Oil 14.7 21.0 21.0 3.6 0.0 -100.0 - -100.0Natural gas 49.0 49.0 - - - 0.0 -
1995- 2005- 2010- 2020- 2005-1995 2005 2010 2020 2030 1995 2005 2010 2020 2030 2005 2010 2020 2030 2030
Total 385 1,037 980 1,680 2,827 100 100 100 100 10.4 -1.1 5.5 5.3 4.1
Energy and economic indicators1995- 2005- 2010- 2020- 2005-
1995 2005 2010 2020 2030 2005 2010 2020 2030 2030GDP (billion constant 2000 US$) 2.6 5.7 7.4 12.4 20.7 8.3 5.3 5.3 5.3 5.3Population (millions of people) 11.4 14.1 14.9 16.4 17.8 2.2 1.1 1.0 0.8 0.9GDP per capita (thousands of constant 2000 US$/person) 0.23 0.41 0.50 0.75 1.17 6.0 4.2 4.3 4.5 4.3Primary energy consumption per capita (toe/person) 0.30 0.34 0.34 0.40 0.49 1.4 -0.2 1.6 2.2 1.5Primary energy consumption per GDP (toe/constant 2000 US$) 1,317 844 681 528 423 -4.4 -4.2 -2.5 -2.2 -2.7CO2 emissions per unit of GDP (t-C/million constant 2000 US$) 150 182 133 136 136 2.0 -6.1 0.2 0.0 -1.1
CO2 emissions per unit of primary energy consumption (t-C/toe) 0.11 0.22 0.20 0.26 0.32 6.6 -2.0 2.8 2.3 1.6Automobile ownership volume (millions of vehicles) - - - - -
- - - - -
CAMBODIA [Reference Scenario]
PRIMARY ENERGY ktoe % AAGR(%)CONSUMPTION
FINAL ENERGY ktoe % AAGR(%)DEMAND
Others
POWER GENERATION GWh % AAGR(%)OUTPUT
POWER GENERATION ktoe % AAGR(%)INPUT
Thermal Efficiency % AAGR(%)
CO2 EMISSIONS kt-C % AAGR(%)
AAGR(%)
Automobile ownership volume per capita (vehicles per person)

The 2nd ASEAN Energy Outlook
130
1995- 2005- 2010- 2020- 2005-1995 2005 2010 2020 2030 1995 2005 2010 2020 2030 2005 2010 2020 2030 2030
Total 3,385 4,812 5,325 7,622 11,280 100 100 100 100 100 3.6 2.0 3.7 4.0 3.5Coal 0 0 298 747 0.0 0.0 0.0 3.9 6.6 - - - 9.6 -Oil 484 1,272 1,497 2,727 4,881 14.3 26.4 28.1 35.8 43.3 10.1 3.3 6.2 6.0 5.5Natural gas 0 0 86 217 0.0 0.0 0.0 1.1 1.9 - - - 9.6 -Nuclear 0 0 0 0 0.0 0.0 0.0 0.0 0.0 - - - - -Hydro 0 4 75 69 176 0.0 0.1 1.4 0.9 1.6 - 81.7 -0.8 9.9 16.6Geothermal 0 0 0 0 0.0 0.0 0.0 0.0 0.0 - - - - -Others (inc. electricity imports) 2,901 3,536 3,753 4,442 5,258 85.7 73.5 70.5 58.3 46.6 2.0 1.2 1.7 1.7 1.6
1995- 2005- 2010- 2020- 2005-By Sector 1995 2005 2010 2020 2030 1995 2005 2010 2020 2030 2005 2010 2020 2030 2030Total 3,278 4,530 5,323 7,448 10,702 100 100 100 100 100 3.3 3.3 3.4 3.7 3.5
Industry 3 51 92 204 415 0.1 1.1 1.7 2.7 3.9 32.8 12.6 8.2 7.4 8.7Transportation 284 429 670 1,255 2,333 8.7 9.5 12.6 16.9 21.8 4.2 9.3 6.5 6.4 7.0
2,991 4,050 4,561 5,990 7,954 91.2 89.4 85.7 80.4 74.3 3.1 2.4 2.8 2.9 2.7Non-energy 0.0 0.0 0.0 0.0 0.0 - - - - -
By FuelTotal 3,279 4,530 5,323 7,448 10,702 100 100 100 100 100 3.3 3.3 3.4 3.7 3.5
Coal 0 0 0 0 0 0.0 0.0 0.0 0.0 0.0 - - - - -Oil 369 930 1,444 2,727 4,881 11.3 20.5 27.1 36.6 45.6 9.7 9.2 6.6 6.0 6.9Natural gas 0 0 0 0 0 0.0 0.0 0.0 0.0 0.0 - - - - -Electricity 9 64 126 279 562 0.3 1.4 2.4 3.7 5.3 21.7 14.6 8.3 7.3 9.1Heat 0 0 0 0 0 0.0 0.0 0.0 0.0 0.0 - - - - -Others 2,901 3,536 3,753 4,442 5,258 88.5 78.1 70.5 59.6 49.1 2.0 1.2 1.7 1.7 1.6
1995- 2005- 2010- 2020- 2005-1995 2005 2010 2020 2030 1995 2005 2010 2020 2030 2005 2010 2020 2030 2030
Total 198 879 1,000 2,574 6,502 100 100 100 100 100 16.1 2.6 9.9 9.7 8.3Coal 0 0 1,282 3,214 0.0 0.0 0.0 49.8 49.4 - - - 9.6 -Oil 198 835 129 0 0 100.0 95.0 13.0 0.0 0.0 15.5 -31.1 -100.0 - -100.0Natural gas 0 0 493 1,236 0.0 0.0 0.0 19.1 19.0 - - - 9.6 -Nuclear 0 0 0 0 0.0 0.0 0.0 0.0 0.0 - - - - -Hydro 44 870 799 2,052 0.0 5.0 87.0 31.1 31.6 - 81.6 -0.8 9.9 16.6Geothermal 0 0 0 0 0.0 0.0 0.0 0.0 0.0 - - - - -Others 0 0 0 0 0.0 0.0 0.0 0.0 0.0 - - - - -
1995- 2005- 2010- 2020- 2005-1995 2005 2010 2020 2030 1995 2005 2010 2020 2030 2005 2010 2020 2030 2030
Total 116 342 53 384 964 100 100 100 100 100 11.4 -31.1 21.9 9.6 4.2Coal 0 0 298 747 0.0 0.0 0.0 77.5 77.5 - - - 9.6 -Oil 116 342 53 0 0 100.0 100.0 100.0 0.0 0.0 11.4 -31.1 -100.0 - -100.0Natural gas 0 0 86 217 0.0 0.0 0.0 22.5 22.5 - - - 9.6 -
1995- 2005- 2010- 2020- 2005-1995 2005 2010 2020 2030 1995 2005 2010 2020 2030 2005 2010 2020 2030 2030
Total 14.7 21.0 21.0 39.7 39.7 3.6 0.0 6.6 0.0 2.6Coal 37.0 37.0 - - - 0.0 -Oil 14.7 21.0 21.0 3.6 0.0 -100.0 - -100.0Natural gas 49.0 49.0 - - - 0.0 -
1995- 2005- 2010- 2020- 2005-1995 2005 2010 2020 2030 1995 2005 2010 2020 2030 2005 2010 2020 2030 2030
Total 385 1,037 1,198 2,561 4,869 100 100 100 100 10.4 2.9 7.9 6.6 6.4
Energy and economic indicators1995- 2005- 2010- 2020- 2005-
1995 2005 2010 2020 2030 2005 2010 2020 2030 2030GDP (billion constant 2000 US$) 2.6 5.7 9.3 18.4 35.2 8.3 10.4 7.0 6.7 7.6Population (millions of people) 11.4 14.1 14.9 16.4 17.8 2.2 1.1 1.0 0.8 0.9GDP per capita (thousands of constant 2000 US$/person) 0.2 0.4 0.6 1.1 2.0 6.0 9.2 5.9 5.9 6.5Primary energy consumption per capita (toe/person) 0.30 0.34 0.36 0.46 0.63 1.4 0.9 2.6 3.2 2.5Primary energy consumption per GDP (toe/constant 2000 US$) 1,317 844 570 414 321 -4.4 -7.6 -3.1 -2.5 -3.8CO2 emissions per unit of GDP (t-C/million constant 2000 US$) 150 182 128 139 138 2.0 -6.8 0.8 -0.1 -1.1
CO2 emissions per unit of primary energy consumption (t-C/toe) 0.1 0.22 0.23 0.34 0.43 6.6 0.9 4.1 2.5 2.8Automobile ownership volume (millions of vehicles) - - - - -
- - - - -
AAGR(%)
AAGR(%)
Automobile ownership volume per capita (vehicles per person)
CO2 EMISSIONS kt-C %
AAGR(%)INPUT
Thermal Efficiency % AAGR(%)
OUTPUT
POWER GENERATION ktoe %
POWER GENERATION GWh % AAGR(%)
% AAGR(%)DEMAND
Others
CONSUMPTION
FINAL ENERGY ktoe
CAMBODIA [High Growth Scenario]
PRIMARY ENERGY ktoe % AAGR(%)

The 2nd ASEAN Energy Outlook
131
1990- 2005- 2010- 2020- 2005-1990 2005 2010 2020 2030 1990 2005 2010 2020 2030 2005 2010 2020 2030 2030
Total 103,196 180,089 210,663 309,255 460,323 100 100 100 100 100 3.8 3.2 3.9 4.1 3.8Coal 3,945 25,381 31,916 66,824 123,157 3.8 14.1 15.2 21.6 26.8 13.2 4.7 7.7 6.3 6.5Oil 34,226 66,276 78,682 120,763 183,953 33.2 36.8 37.3 39.0 40.0 4.5 3.5 4.4 4.3 4.2Natural gas 18,502 30,624 34,979 44,785 73,629 17.9 17.0 16.6 14.5 16.0 3.4 2.7 2.5 5.1 3.6Nuclear 0 0 3,756 8,338 0.0 0.0 0.0 1.2 1.8 - - - 8.3 -Hydro 579 930 1,456 1,813 2,086 0.6 0.5 0.7 0.6 0.5 3.2 9.4 2.2 1.4 3.3Geothermal 942 5,677 13,871 23,904 24,043 0.9 3.2 6.6 7.7 5.2 12.7 19.6 5.6 0.1 5.9Others (inc. electricity imports) 45,002 51,201 49,759 47,410 45,117 43.6 28.4 23.6 15.3 9.8 0.9 -0.6 -0.5 -0.5 -0.5
1990- 2005- 2010- 2020- 2005-By Sector 1990 2005 2010 2020 2030 1990 2005 2010 2020 2030 2005 2010 2020 2030 2030Total 79,167 134,741 155,852 228,999 338,485 100 100 100 100 100 3.6 3.0 3.9 4.0 3.8
Industry 16,678 34,374 44,163 74,675 116,381 21.1 25.5 28.3 32.6 34.4 4.9 5.1 5.4 4.5 5.0Transportation 11,041 26,055 34,756 62,224 103,901 13.9 19.3 22.3 27.2 30.7 5.9 5.9 6.0 5.3 5.7
43,601 63,079 63,720 74,207 95,524 55.1 46.8 40.9 32.4 28.2 2.5 0.2 1.5 2.6 1.7Non-energy 7,847 11,233 13,213 17,893 22,680 9.9 8.3 8.5 7.8 6.7 2.4 3.3 3.1 2.4 2.9
By FuelTotal 79,167 134,741 155,852 228,999 338,485 100 100 100 100 100 3.6 3.0 3.9 4.0 3.8
Coal 638 9,598 13,322 24,371 38,366 0.8 7.1 8.5 10.6 11.3 19.8 6.8 6.2 4.6 5.7Oil 27,565 52,022 63,585 105,731 168,721 34.8 38.6 40.8 46.2 49.8 4.3 4.1 5.2 4.8 4.8Natural gas 6,642 12,715 16,101 24,922 35,892 8.4 9.4 10.3 10.9 10.6 4.4 4.8 4.5 3.7 4.2Electricity 2,330 9,205 13,086 26,839 50,665 2.9 6.8 8.4 11.7 15.0 9.6 7.3 7.4 6.6 7.1Heat 0 0 0 0 0.0 0.0 0.0 0.0 0.0 - - - - -Others 41,992 51,201 49,758 47,137 44,843 53.0 38.0 31.9 20.6 13.2 1.3 -0.6 -0.5 -0.5 -0.5
1990- 2005- 2010- 2020- 2005-1990 2005 2010 2020 2030 1990 2005 2010 2020 2030 2005 2010 2020 2030 2030
Total 33,336 130,213 185,110 379,654 716,694 100 100 100 100 100 9.5 7.3 7.4 6.6 7.1Coal 10,514 51,774 78,901 190,392 386,571 31.5 39.8 42.6 50.1 53.9 11.2 8.8 9.2 7.3 8.4Oil 14,241 44,227 38,928 31,049 32,700 42.7 34.0 21.0 8.2 4.6 7.8 -2.5 -2.2 0.5 -1.2Natural gas 752 16,796 34,048 93,204 210,028 2.3 12.9 18.4 24.5 29.3 23.0 15.2 10.6 8.5 10.6Nuclear 0 0 14,413 31,998 0.0 0.0 0.0 3.8 4.5 - - - 8.3 -Hydro 6,733 10,812 16,936 21,085 24,264 20.2 8.3 9.1 5.6 3.4 3.2 9.4 2.2 1.4 3.3Geothermal 1,096 6,604 16,118 27,724 27,724 3.3 5.1 8.7 7.3 3.9 12.7 19.5 5.6 0.0 5.9Others 0 179 1,786 3,410 0.0 0.0 0.1 0.5 0.5 - - 25.9 6.7 -
1990- 2005- 2010- 2020- 2005-1990 2005 2010 2020 2030 1990 2005 2010 2020 2030 2005 2010 2020 2030 2030
Total 6,858 29,099 33,500 64,483 124,814 100 100 100 100 100 10.1 2.9 6.8 6.8 6.0Coal 2,720 15,783 18,594 42,453 84,792 39.7 54.2 55.5 65.8 67.9 12.4 3.3 8.6 7.2 7.0Oil 3,819 9,775 8,448 6,494 6,616 55.7 33.6 25.2 10.1 5.3 6.5 -2.9 -2.6 0.2 -1.5Natural gas 319 3,541 6,458 15,536 33,406 4.7 12.2 19.3 24.1 26.8 17.4 12.8 9.2 8.0 9.4
1995- 2005- 2010- 2020- 2005-1990 2005 2010 2020 2030 1990 2005 2010 2020 2030 2005 2010 2020 2030 2030
Total 32.0 33.3 39.0 42.0 43.4 0.3 3.2 0.7 0.3 1.1Coal 33.2 28.2 36.5 38.6 39.2 -1.1 5.3 0.6 0.2 1.3Oil 32.1 38.9 39.6 41.1 42.5 1.3 0.4 0.4 0.3 0.4Natural gas 20.3 40.8 45.3 51.6 54.1 4.8 2.1 1.3 0.5 1.1
1990- 2005- 2010- 2020- 2005-1990 2005 2010 2020 2030 1990 2005 2010 2020 2030 2005 2010 2020 2030 2030
Total 38,618 90,626 108,713 182,249 308,571 100 100 100 100 5.9 3.7 5.3 5.4 5.0
Energy and economic indicators1990- 2005- 2010- 2020- 2005-
1990 2005 2010 2020 2030 2005 2010 2020 2030 2030GDP (billion constant 2000 US$) 109 208 278 498 774 4.4 6.0 6.0 4.5 5.4Population (millions of people) 178 221 234 256 272 1.4 1.2 0.9 0.6 0.8GDP per capita (thousands of constant 2000 US$/person) 0.6 0.9 1.2 1.9 2.8 2.9 4.7 5.1 3.9 4.5Primary energy consumption per capita (toe/person) 0.6 0.8 0.9 1.2 1.7 2.3 2.0 3.0 3.4 3.0Primary energy consumption per GDP (toe/constant 2000 US$) 945 866 757 621 595 -0.6 -2.7 -2.0 -0.4 -1.5CO2 emissions per unit of GDP (t-C/million constant 2000 US$) 354 436 391 366 399 1.4 -2.2 -0.7 0.9 -0.4CO2 emissions per unit of primary energy consumption (t-C/toe) 0.37 0.50 0.52 0.59 0.67 2.0 0.5 1.3 1.3 1.2Automobile ownership volume (millions of vehicles) - - - - -
- - - - -
INDONESIA [Reference Scenario]
PRIMARY ENERGY ktoe % AAGR(%)CONSUMPTION
FINAL ENERGY ktoe % AAGR(%)DEMAND
Others
POWER GENERATION GWh % AAGR(%)OUTPUT
POWER GENERATION ktoe % AAGR(%)INPUT
Thermal Efficiency % AAGR(%)
CO2 EMISSIONS kt-C % AAGR(%)
AAGR(%)
Automobile ownership volume per capita (vehicles per person)

The 2nd ASEAN Energy Outlook
132
1990- 2005- 2010- 2020- 2005-1990 2005 2010 2020 2030 1990 2005 2010 2020 2030 2005 2010 2020 2030 2030
Total 103,196 180,089 211,888 319,440 526,089 100 100 100 100 100 3.8 3.3 4.2 5.1 4.4Coal 3,945 25,381 32,000 69,670 147,214 3.8 14.1 15.1 21.8 28.0 13.2 4.7 8.1 7.8 7.3Oil 34,226 66,276 79,222 125,374 213,256 33.2 36.8 37.4 39.2 40.5 4.5 3.6 4.7 5.5 4.8Natural gas 18,502 30,624 35,580 47,551 86,203 17.9 17.0 16.8 14.9 16.4 3.4 3.0 2.9 6.1 4.2Nuclear 0 0 3,719 8,170 0.0 0.0 0.0 1.2 1.6 - - - 8.2 -Hydro 579 930 1,456 1,813 2,086 0.6 0.5 0.7 0.6 0.4 3.2 9.4 2.2 1.4 3.3Geothermal 942 5,677 13,871 23,904 24,043 0.9 3.2 6.5 7.5 4.6 12.7 19.6 5.6 0.1 5.9Others (inc. electricity imports) 45,002 51,201 49,759 47,410 45,117 43.6 28.4 23.5 14.8 8.6 0.9 -0.6 -0.5 -0.5 -0.5
1990- 2005- 2010- 2020- 2005-By Sector 1990 2005 2010 2020 2030 1990 2005 2010 2020 2030 2005 2010 2020 2030 2030Total 79,167 134,741 157,048 237,531 391,759 100 100 100 100 100 3.6 3.1 4.2 5.1 4.4
Industry 16,678 34,374 44,748 78,661 141,376 21.1 25.5 28.5 33.1 36.1 4.9 5.4 5.8 6.0 5.8Transportation 11,041 26,055 35,085 65,080 122,232 13.9 19.3 22.3 27.4 31.2 5.9 6.1 6.4 6.5 6.4
43,601 63,079 63,858 75,294 102,585 55.1 46.8 40.7 31.7 26.2 2.5 0.2 1.7 3.1 2.0Non-energy 7,847 11,233 13,358 18,496 25,566 9.9 8.3 8.5 7.8 6.5 2.4 3.5 3.3 3.3 3.3
By FuelTotal 79,167 134,741 157,048 237,532 391,759 100 100 100 100 100 3.6 3.1 4.2 5.1 4.4
Coal 638 9,598 13,635 26,166 49,686 0.8 7.1 8.7 11.0 12.7 19.8 7.3 6.7 6.6 6.8Oil 27,565 52,022 64,205 110,393 198,142 34.8 38.6 40.9 46.5 50.6 4.3 4.3 5.6 6.0 5.5Natural gas 6,642 12,715 16,246 25,830 40,872 8.4 9.4 10.3 10.9 10.4 4.4 5.0 4.7 4.7 4.8Electricity 2,330 9,205 13,203 28,005 58,217 2.9 6.8 8.4 11.8 14.9 9.6 7.5 7.8 7.6 7.7Heat 0.0 0.0 0.0 0.0 0.0 - - - - -Others 41,992 51,201 49,758 47,137 44,843 53.0 38.0 31.7 19.8 11.4 1.3 -0.6 -0.5 -0.5 -0.5
1990- 2005- 2010- 2020- 2005-1990 2005 2010 2020 2030 1990 2005 2010 2020 2030 2005 2010 2020 2030 2030
Total 33,336 130,213 186,768 396,158 823,523 100 100 100 100 100 9.5 7.5 7.8 7.6 7.7Coal 10,514 51,774 77,926 195,350 445,977 31.5 39.8 41.7 49.3 54.2 11.2 8.5 9.6 8.6 9.0Oil 14,241 44,227 38,555 30,797 32,115 42.7 34.0 20.6 7.8 3.9 7.8 -2.7 -2.2 0.4 -1.3Natural gas 752 16,796 37,054 105,143 258,679 2.3 12.9 19.8 26.5 31.4 23.0 17.1 11.0 9.4 11.6Nuclear 0 0 14,274 31,354 0.0 0.0 0.0 3.6 3.8 - - - 8.2 -Hydro 6,733 10,812 16,936 21,085 24,264 20.2 8.3 9.1 5.3 2.9 3.2 9.4 2.2 1.4 3.3Geothermal 1,096 6,604 16,118 27,724 27,724 3.3 5.1 8.6 7.0 3.4 12.7 19.5 5.6 0.0 5.9Others 0 179 1,786 3,410 0.0 0.0 0.1 0.5 0.4 - - 25.9 6.7 -
1990- 2005- 2010- 2020- 2005-1990 2005 2010 2020 2030 1990 2005 2010 2020 2030 2005 2010 2020 2030 2030
Total 6,858 29,099 33,646 67,338 145,026 100 100 100 100 100 10.1 2.9 7.2 8.0 6.6Coal 2,720 15,783 18,364 43,504 97,528 39.7 54.2 54.6 64.6 67.2 12.4 3.1 9.0 8.4 7.6Oil 3,819 9,775 8,368 6,442 6,498 55.7 33.6 24.9 9.6 4.5 6.5 -3.1 -2.6 0.1 -1.6Natural gas 319 3,541 6,914 17,393 41,000 4.7 12.2 20.5 25.8 28.3 17.4 14.3 9.7 9.0 10.3
1995- 2005- 2010- 2020- 2005-1990 2005 2010 2020 2030 1990 2005 2010 2020 2030 2005 2010 2020 2030 2030
Total 32.0 33.3 39.2 42.3 43.7 0.3 3.3 0.8 0.3 1.1Coal 33.2 28.2 36.5 38.6 39.3 -1.1 5.3 0.6 0.2 1.3Oil 32.1 38.9 39.6 41.1 42.5 1.3 0.4 0.4 0.3 0.4Natural gas 20.3 40.8 46.1 52.0 54.3 4.8 2.5 1.2 0.4 1.1
1990- 2005- 2010- 2020- 2005-1990 2005 2010 2020 2030 1990 2005 2010 2020 2030 2005 2010 2020 2030 2030
Total 38,618 90,626 109,538 190,463 364,567 100 100 100 100 5.9 3.9 5.7 6.7 5.7
Energy and economic indicators1990- 2005- 2010- 2020- 2005-
1990 2005 2010 2020 2030 2005 2010 2020 2030 2030GDP (billion constant 2000 US$) 109 208 285 535 1,003 4.4 6.5 6.5 6.5 6.5Population (millions of people) 178 221 234 256 272 1.4 1.2 0.9 0.6 0.8GDP per capita (thousands of constant 2000 US$/person) 0.6 0.9 1.2 2.1 3.7 2.9 5.2 5.6 5.9 5.6Primary energy consumption per capita (toe/person) 0.6 0.8 0.9 1.2 1.9 2.3 2.1 3.3 4.5 3.5Primary energy consumption per GDP (toe/constant 2000 US$) 945 866 744 598 524 -0.6 -3.0 -2.2 -1.3 -2.0CO2 emissions per unit of GDP (t-C/million constant 2000 US$) 354 436 385 356 363 1.4 -2.5 -0.8 0.2 -0.7CO2 emissions per unit of primary energy consumption (t-C/toe) 0.4 0.50 0.52 0.60 0.69 2.0 0.5 1.4 1.5 1.3Automobile ownership volume (millions of vehicles) - - - - -
- - - - -
AAGR(%)
AAGR(%)
Automobile ownership volume per capita (vehicles per person)
CO2 EMISSIONS kt-C %
AAGR(%)INPUT
Thermal Efficiency % AAGR(%)
OUTPUT
POWER GENERATION ktoe %
POWER GENERATION GWh % AAGR(%)
% AAGR(%)DEMAND
Others
CONSUMPTION
FINAL ENERGY ktoe
INDONESIA [High Growth Scenario]
PRIMARY ENERGY ktoe % AAGR(%)

The 2nd ASEAN Energy Outlook
133
1990- 2005- 2010- 2020- 2005-1990 2005 2010 2020 2030 1990 2005 2010 2020 2030 2005 2010 2020 2030 2030
Total 1,258 1,977 2,337 5,270 6,514 100 100 100 100 100 3.1 3.4 8.5 2.1 4.9Coal 0 30 64 3,275 3,467 0.0 1.5 2.8 62.1 53.2 - 16.8 48.1 0.6 21.0Oil 222 360 504 876 1,375 17.7 18.2 21.6 16.6 21.1 3.3 7.0 5.7 4.6 5.5Natural gas 0.0 0.0 0.0 0.0 0.0 - - - - -Nuclear 0.0 0.0 0.0 0.0 0.0 - - - - -Hydro 71 232 931 3,134 3,134 5.6 11.7 39.8 59.5 48.1 8.2 32.1 12.9 0.0 11.0Geothermal 0.0 0.0 0.0 0.0 0.0 - - - - -Others (inc. electricity imports) 965 1,355 838 -2,015 -1,462 76.7 68.6 35.8 -38.2 -22.4 2.3 -9.2 - -3.2 -200.3
1990- 2005- 2010- 2020- 2005-By Sector 1990 2005 2010 2020 2030 1990 2005 2010 2020 2030 2005 2010 2020 2030 2030Total 1,150 1,798 2,108 2,893 3,946 100 100 100 100 100 3.0 3.2 3.2 3.2 3.2
Industry 39 117 176 367 697 3.4 6.5 8.3 12.7 17.7 7.6 8.5 7.7 6.6 7.4Transportation 195 353 494 853 1,327 17.0 19.6 23.4 29.5 33.6 4.0 7.0 5.6 4.5 5.4
915 1,329 1,439 1,673 1,922 79.6 73.9 68.2 57.8 48.7 2.5 1.6 1.5 1.4 1.5Non-energy 0.0 0.0 0.0 0.0 0.0 - - - - -
By FuelTotal 1,150 1,798 2,108 2,893 3,946 100 100 100 100 100 3.0 3.2 3.2 3.2 3.2
Coal 0 30 64 176 368 0.0 1.6 3.1 6.1 9.3 - 16.8 10.6 7.7 10.6Oil 221 360 504 876 1,375 19.2 20.0 23.9 30.3 34.8 3.3 7.0 5.7 4.6 5.5Natural gas 0.0 0.0 0.0 0.0 0.0 - - - - -Electricity 14 87 143 292 507 1.2 4.8 6.8 10.1 12.8 12.9 10.4 7.4 5.7 7.3Heat 0.0 0.0 0.0 0.0 0.0 - - - - -Others 915 1,322 1,397 1,549 1,696 79.6 73.5 66.3 53.5 43.0 2.5 1.1 1.0 0.9 1.0
1990- 2005- 2010- 2020- 2005-1990 2005 2010 2020 2030 1990 2005 2010 2020 2030 2005 2010 2020 2030 2030
Total 821 2,693 10,825 49,060 49,060 100 100 100 100 100 8.2 32.1 16.3 0.0 12.3Coal 0 0 12,614 12,614 0.0 0.0 0.0 25.7 25.7 - - - 0.0 -Oil 0.0 0.0 0.0 0.0 0.0 - - - - -Natural gas 0.0 0.0 0.0 0.0 0.0 - - - - -Nuclear 0.0 0.0 0.0 0.0 0.0 - - - - -Hydro 821 2,693 10,825 36,446 36,446 100.0 100.0 100.0 74.3 74.3 8.2 32.1 12.9 0.0 11.0Geothermal 0.0 0.0 0.0 0.0 0.0 - - - - -Others 0.0 0.0 0.0 0.0 0.0 - - - - -
1990- 2005- 2010- 2020- 2005-1990 2005 2010 2020 2030 1990 2005 2010 2020 2030 2005 2010 2020 2030 2030
Total 0 0 0 3,099 3,099 100 100 - - - 0.0 -Coal 3,099 3,099 100.0 100.0 - - - 0.0 -Oil 0.0 0.0 - - - - -Natural gas 0.0 0.0 - - - - -
1995- 2005- 2010- 2020- 2005-1990 2005 2010 2020 2030 1990 2005 2010 2020 2030 2005 2010 2020 2030 2030
Total 35.0 35.0 - - - 0.0 -Coal 35.0 35.0 - - - 0.0 -Oil - - - - -Natural gas - - - - -
1990- 2005- 2010- 2020- 2005-1990 2005 2010 2020 2030 1990 2005 2010 2020 2030 2005 2010 2020 2030 2030
Total 182 330 488 4,426 5,053 100 100 100 100 4.1 8.1 24.7 1.3 11.5
Energy and economic indicators1990- 2005- 2010- 2020- 2005-
1990 2005 2010 2020 2030 2005 2010 2020 2030 2030GDP (billion constant 2000 US$) 0.9 2.4 3.4 5.6 8.6 6.3 7.4 5.3 4.3 5.3Population (millions of people) 4.1 5.9 6.3 6.9 7.5 2.4 1.1 1.0 0.8 0.9GDP per capita (thousands of constant 2000 US$/person) 0.23 0.40 0.54 0.82 1.15 3.8 6.2 4.3 3.5 4.3Primary energy consumption per capita (toe/person) 0.30 0.33 0.37 0.76 0.87 0.6 2.3 7.4 1.3 3.9Primary energy consumption per GDP (toe/constant 2000 US$) 1,339 841 697 935 759 -3.1 -3.7 3.0 -2.1 -0.4CO2 emissions per unit of GDP (t-C/million constant 2000 US$) 193 140 145 785 589 -2.1 0.7 18.4 -2.8 5.9
CO2 emissions per unit of primary energy consumption (t-C/toe) 0.14 0.17 0.21 0.84 0.78 1.0 4.6 14.9 -0.8 6.3Automobile ownership volume (millions of vehicles) - - - - -
- - - - -
LAO PDR [Reference Scenario]
PRIMARY ENERGY ktoe % AAGR(%)CONSUMPTION
FINAL ENERGY ktoe % AAGR(%)DEMAND
Others
POWER GENERATION GWh % AAGR(%)OUTPUT
POWER GENERATION ktoe % AAGR(%)INPUT
Thermal Efficiency % AAGR(%)
CO2 EMISSIONS kt-C % AAGR(%)
AAGR(%)
Automobile ownership volume per capita (vehicles per person)

The 2nd ASEAN Energy Outlook
134
1990- 2005- 2010- 2020- 2005-1990 2005 2010 2020 2030 1990 2005 2010 2020 2030 2005 2010 2020 2030 2030
Total 1,258 1,977 2,337 5,538 7,815 100 100 100 100 100 3.1 3.4 9.0 3.5 5.7Coal 0 30 64 3,291 3,578 0.0 1.5 2.8 59.4 45.8 - 16.8 48.2 0.8 21.1Oil 222 360 504 1,054 2,199 17.7 18.2 21.6 19.0 28.1 3.3 7.0 7.7 7.6 7.5Natural gas 0.0 0.0 0.0 0.0 0.0 - - - - -Nuclear 0.0 0.0 0.0 0.0 0.0 - - - - -Hydro 71 232 931 3,134 3,134 5.6 11.7 39.8 56.6 40.1 8.2 32.1 12.9 0.0 11.0Geothermal 0.0 0.0 0.0 0.0 0.0 - - - - -Others (inc. electricity imports) 965 1,355 838 -1,941 -1,096 76.7 68.6 35.8 -35.0 -14.0 2.3 -9.2 - -5.6 -199.2
1990- 2005- 2010- 2020- 2005-By Sector 1990 2005 2010 2020 2030 1990 2005 2010 2020 2030 2005 2010 2020 2030 2030Total 1,150 1,798 2,108 3,139 5,137 100 100 100 100 100 3.0 3.2 4.1 5.0 4.3
Industry 39 117 176 393 877 3.4 6.5 8.3 12.5 17.1 7.6 8.5 8.4 8.4 8.4Transportation 195 353 494 1,028 2,134 17.0 19.6 23.4 32.7 41.5 4.0 7.0 7.6 7.6 7.5
915 1,329 1,439 1,718 2,126 79.6 73.9 68.2 54.7 41.4 2.5 1.6 1.8 2.2 1.9Non-energy 0.0 0.0 0.0 0.0 0.0 - - - - -
By FuelTotal 1,150 1,798 2,108 3,139 5,137 100 100 100 100 100 3.0 3.2 4.1 5.0 4.3
Coal 0 30 64 192 479 0.0 1.6 3.1 6.1 9.3 - 16.8 11.6 9.5 11.8Oil 221 360 504 1,054 2,199 19.2 20.0 23.9 33.6 42.8 3.3 7.0 7.7 7.6 7.5Natural gas 0.0 0.0 0.0 0.0 0.0 - - - - -Electricity 14 87 143 344 763 1.2 4.8 6.8 11.0 14.9 12.9 10.4 9.2 8.3 9.1Heat 0.0 0.0 0.0 0.0 0.0 - - - - -Others 915 1,322 1,397 1,549 1,696 79.6 73.5 66.3 49.3 33.0 2.5 1.1 1.0 0.9 1.0
1990- 2005- 2010- 2020- 2005-1990 2005 2010 2020 2030 1990 2005 2010 2020 2030 2005 2010 2020 2030 2030
Total 821 2,693 10,825 49,060 49,060 100 100 100 100 100 8.2 32.1 16.3 0.0 12.3Coal 0 0 12,614 12,614 0.0 0.0 0.0 25.7 25.7 - - - 0.0 -Oil 0.0 0.0 0.0 0.0 0.0 - - - - -Natural gas 0.0 0.0 0.0 0.0 0.0 - - - - -Nuclear 0.0 0.0 0.0 0.0 0.0 - - - - -Hydro 821 2,693 10,825 36,446 36,446 100.0 100.0 100.0 74.3 74.3 8.2 32.1 12.9 0.0 11.0Geothermal 0.0 0.0 0.0 0.0 0.0 - - - - -Others 0.0 0.0 0.0 0.0 0.0 - - - - -
1990- 2005- 2010- 2020- 2005-1990 2005 2010 2020 2030 1990 2005 2010 2020 2030 2005 2010 2020 2030 2030
Total 0 0 0 3,099 3,099 100 100 - - - 0.0 -Coal 0 0 3,099 3,099 100.0 100.0 - - - 0.0 -Oil 0.0 0.0 - - - - -Natural gas 0.0 0.0 - - - - -
1995- 2005- 2010- 2020- 2005-1990 2005 2010 2020 2030 1990 2005 2010 2020 2030 2005 2010 2020 2030 2030
Total 35.0 35.0 - - - 0.0 -Coal 35.0 35.0 - - - 0.0 -Oil - - - - -Natural gas - - - - -
1990- 2005- 2010- 2020- 2005-1990 2005 2010 2020 2030 1990 2005 2010 2020 2030 2005 2010 2020 2030 2030
Total 182 330 488 4,591 5,856 100 100 100 100 4.1 8.1 25.1 2.5 12.2
Energy and economic indicators1990- 2005- 2010- 2020- 2005-
1990 2005 2010 2020 2030 2005 2010 2020 2030 2030GDP (billion constant 2000 US$) 0.9 2.4 3.4 6.9 14.3 6.3 7.4 7.5 7.5 7.5Population (millions of people) 4.1 5.9 6.3 6.9 7.5 2.4 1.1 1.0 0.8 0.9GDP per capita (thousands of constant 2000 US$/person) 0.2 0.4 0.5 1.0 1.9 3.8 6.2 6.5 6.6 6.5Primary energy consumption per capita (toe/person) 0.30 0.33 0.37 0.80 1.04 0.6 2.3 7.9 2.7 4.7Primary energy consumption per GDP (toe/constant 2000 US$) 1,339 841 697 798 547 -3.1 -3.7 1.4 -3.7 -1.7CO2 emissions per unit of GDP (t-C/million constant 2000 US$) 193 140 145 662 410 -2.1 0.7 16.4 -4.7 4.4
CO2 emissions per unit of primary energy consumption (t-C/toe) 0.14 0.17 0.21 0.83 0.75 1.0 4.6 14.8 -1.0 6.2Automobile ownership volume (millions of vehicles) - - - - -
- - - - -
AAGR(%)
AAGR(%)
Automobile ownership volume per capita (vehicles per person)
CO2 EMISSIONS kt-C %
AAGR(%)INPUT
Thermal Efficiency % AAGR(%)
OUTPUT
POWER GENERATION ktoe %
POWER GENERATION GWh % AAGR(%)
% AAGR(%)DEMAND
Others
CONSUMPTION
FINAL ENERGY ktoe
LAO PDR [High Growth Scenario]
PRIMARY ENERGY ktoe % AAGR(%)

The 2nd ASEAN Energy Outlook
135
1990- 2005- 2010- 2020- 2005-1990 2005 2010 2020 2030 1990 2005 2010 2020 2030 2005 2010 2020 2030 2030
Total 23,322 51,558 67,673 104,459 154,823 100 100 100 100 100 5.4 5.6 4.4 4.0 4.5Coal 1,038 5,860 11,866 21,347 35,937 4.5 11.4 17.5 20.4 23.2 12.2 15.2 6.0 5.3 7.5Oil 13,023 26,712 35,195 51,220 70,496 55.8 51.8 52.0 49.0 45.5 4.9 5.7 3.8 3.2 4.0Natural gas 6,799 17,156 18,664 29,621 46,235 29.2 33.3 27.6 28.4 29.9 6.4 1.7 4.7 4.6 4.0Nuclear 0 0 0 0 0.0 0.0 0.0 0.0 0.0 - - - - -Hydro 343 497 967 1,562 1,562 1.5 1.0 1.4 1.5 1.0 2.5 14.2 4.9 0.0 4.7Geothermal 0 0 0 0 0.0 0.0 0.0 0.0 0.0 - - - - -Others (inc. electricity imports) 2,119 1,333 980 709 594 9.1 2.6 1.4 0.7 0.4 -3.0 -6.0 -3.2 -1.8 -3.2
1990- 2005- 2010- 2020- 2005-By Sector 1990 2005 2010 2020 2030 1990 2005 2010 2020 2030 2005 2010 2020 2030 2030Total 14,534 36,642 47,601 72,681 107,332 100 100 100 100 100 6.4 5.4 4.3 4.0 4.4
Industry 6,137 14,942 20,092 31,130 46,989 42.2 40.8 42.2 42.8 43.8 6.1 6.1 4.5 4.2 4.7Transportation 5,500 15,329 19,670 29,530 42,091 37.8 41.8 41.3 40.6 39.2 7.1 5.1 4.1 3.6 4.1
2,897 6,371 7,839 12,022 18,253 19.9 17.4 16.5 16.5 17.0 5.4 4.2 4.4 4.3 4.3Non-energy 0.0 0.0 0.0 0.0 0.0 - - - - -
By FuelTotal 14,534 36,642 47,601 72,681 107,332 100 100 100 100 100 6.4 5.4 4.3 4.0 4.4
Coal 415 1,146 1,745 2,842 4,419 2.9 3.1 3.7 3.9 4.1 7.0 8.8 5.0 4.5 5.5Oil 10,015 22,267 28,675 41,467 57,621 68.9 60.8 60.2 57.1 53.7 5.5 5.2 3.8 3.3 3.9Natural gas 1,093 4,957 6,717 11,773 19,749 7.5 13.5 14.1 16.2 18.4 10.6 6.3 5.8 5.3 5.7Electricity 1,715 6,939 9,484 15,890 24,950 11.8 18.9 19.9 21.9 23.2 9.8 6.4 5.3 4.6 5.3Heat 0 0 0 0 0.0 0.0 0.0 0.0 0.0 - - - - -Others 1,296 1,333 980 709 594 8.9 3.6 2.1 1.0 0.6 0.2 -6.0 -3.2 -1.8 -3.2
1990- 2005- 2010- 2020- 2005-1990 2005 2010 2020 2030 1990 2005 2010 2020 2030 2005 2010 2020 2030 2030
Total 23,016 87,306 119,475 200,448 314,984 100 100 100 100 100 9.3 6.5 5.3 4.6 5.3Coal 2,825 23,134 49,675 90,818 154,686 12.3 26.5 41.6 45.3 49.1 15.0 16.5 6.2 5.5 7.9Oil 11,138 2,489 2,855 3,221 3,107 48.4 2.9 2.4 1.6 1.0 -9.5 2.8 1.2 -0.4 0.9Natural gas 5,064 55,899 55,700 88,243 139,025 22.0 64.0 46.6 44.0 44.1 17.4 -0.1 4.7 4.7 3.7Nuclear 0 0 0 0 0.0 0.0 0.0 0.0 0.0 - - - - -Hydro 3,989 5,784 11,245 18,166 18,166 17.3 6.6 9.4 9.1 5.8 2.5 14.2 4.9 0.0 4.7Geothermal 0 0 0 0 0.0 0.0 0.0 0.0 0.0 - - - - -Others 0 0 0 0 0.0 0.0 0.0 0.0 0.0 - - - - -
1990- 2005- 2010- 2020- 2005-1990 2005 2010 2020 2030 1990 2005 2010 2020 2030 2005 2010 2020 2030 2030
Total 4,977 17,488 22,729 37,096 58,722 100 100 100 100 100 8.7 5.4 5.0 4.7 5.0Coal 622 4,714 10,122 18,505 31,518 12.5 27.0 44.5 49.9 53.7 14.5 16.5 6.2 5.5 7.9Oil 2,994 575 660 745 718 60.2 3.3 2.9 2.0 1.2 -10.4 2.8 1.2 -0.4 0.9Natural gas 1,361 12,199 11,947 17,847 26,486 27.3 69.8 52.6 48.1 45.1 15.7 -0.4 4.1 4.0 3.1
1990- 2005- 2010- 2020- 2005-1990 2005 2010 2020 2030 1990 2005 2010 2020 2030 2005 2010 2020 2030 2030
Total 32.9 40.1 41.0 42.3 43.5 1.3 0.4 0.3 0.3 0.3Coal 39.1 42.2 42.2 42.2 42.2 0.5 0.0 0.0 0.0 0.0Oil 32.0 37.2 37.2 37.2 37.2 1.0 0.0 0.0 0.0 0.0Natural gas 32.0 39.4 40.1 42.5 45.1 1.4 0.3 0.6 0.6 0.5
1990- 2005- 2010- 2020- 2005-1990 2005 2010 2020 2030 1990 2005 2010 2020 2030 2005 2010 2020 2030 2030
Total 13,364 35,974 48,705 76,407 115,893 100 100 100 100 6.8 6.2 4.6 4.3 4.8
Energy and economic indicators1990- 2005- 2010- 2020- 2005-
1990 2005 2010 2020 2030 2005 2010 2020 2030 2030GDP (billion constant 2000 US$) 45 112 145 224 338 6.2 5.4 4.4 4.2 4.5Population (millions of people) 18.1 25.7 27.6 31.7 35.0 2.4 1.5 1.4 1.0 1.3GDP per capita (thousands of constant 2000 US$/person) 2.5 4.4 5.3 7.1 9.6 3.7 3.9 3.0 3.2 3.2Primary energy consumption per capita (toe/person) 1.3 2.0 2.5 3.3 4.4 3.0 4.1 3.0 3.0 3.2Primary energy consumption per GDP (toe/constant 2000 US$) 513 461 465 467 459 -0.7 0.2 0.0 -0.2 0.0CO2 emissions per unit of GDP (t-C/million constant 2000 US$) 294 322 335 341 343 0.6 0.8 0.2 0.1 0.3
CO2 emissions per unit of primary energy consumption (t-C/toe) 0.57 0.70 0.72 0.73 0.75 1.3 0.6 0.2 0.2 0.3Automobile ownership volume (millions of vehicles) - - - - -
- - - - -
MALAYSIA [Reference Scenario]
PRIMARY ENERGY ktoe % AAGR(%)CONSUMPTION
FINAL ENERGY ktoe % AAGR(%)DEMAND
Others
POWER GENERATION GWh % AAGR(%)OUTPUT
POWER GENERATION ktoe % AAGR(%)INPUT
Thermal Efficiency % AAGR(%)
CO2 EMISSIONS kt-C % AAGR(%)
AAGR(%)
Automobile ownership volume per capita (vehicles per person)
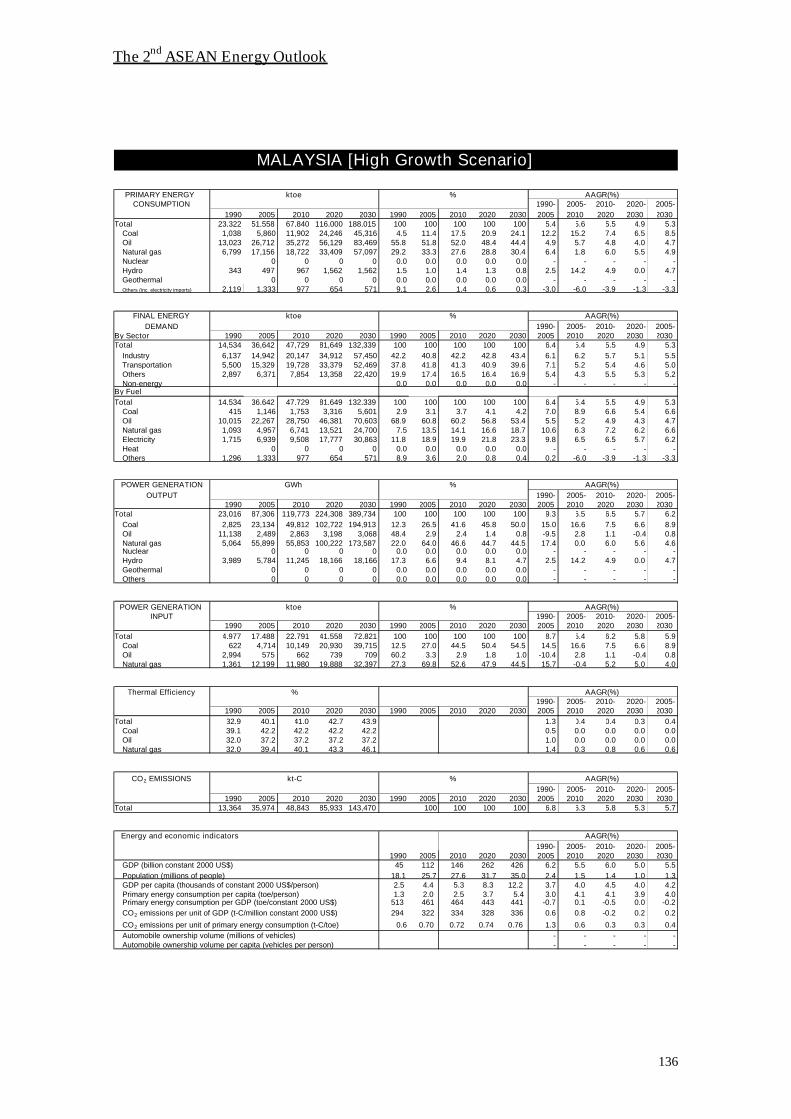
The 2nd ASEAN Energy Outlook
136
1990- 2005- 2010- 2020- 2005-1990 2005 2010 2020 2030 1990 2005 2010 2020 2030 2005 2010 2020 2030 2030
Total 23,322 51,558 67,840 116,000 188,015 100 100 100 100 100 5.4 5.6 5.5 4.9 5.3Coal 1,038 5,860 11,902 24,246 45,316 4.5 11.4 17.5 20.9 24.1 12.2 15.2 7.4 6.5 8.5Oil 13,023 26,712 35,272 56,129 83,469 55.8 51.8 52.0 48.4 44.4 4.9 5.7 4.8 4.0 4.7Natural gas 6,799 17,156 18,722 33,409 57,097 29.2 33.3 27.6 28.8 30.4 6.4 1.8 6.0 5.5 4.9Nuclear 0 0 0 0 0.0 0.0 0.0 0.0 0.0 - - - - -Hydro 343 497 967 1,562 1,562 1.5 1.0 1.4 1.3 0.8 2.5 14.2 4.9 0.0 4.7Geothermal 0 0 0 0 0.0 0.0 0.0 0.0 0.0 - - - - -Others (inc. electricity imports) 2,119 1,333 977 654 571 9.1 2.6 1.4 0.6 0.3 -3.0 -6.0 -3.9 -1.3 -3.3
1990- 2005- 2010- 2020- 2005-By Sector 1990 2005 2010 2020 2030 1990 2005 2010 2020 2030 2005 2010 2020 2030 2030Total 14,534 36,642 47,729 81,649 132,339 100 100 100 100 100 6.4 5.4 5.5 4.9 5.3
Industry 6,137 14,942 20,147 34,912 57,450 42.2 40.8 42.2 42.8 43.4 6.1 6.2 5.7 5.1 5.5Transportation 5,500 15,329 19,728 33,379 52,469 37.8 41.8 41.3 40.9 39.6 7.1 5.2 5.4 4.6 5.0
2,897 6,371 7,854 13,358 22,420 19.9 17.4 16.5 16.4 16.9 5.4 4.3 5.5 5.3 5.2Non-energy 0.0 0.0 0.0 0.0 0.0 - - - - -
By FuelTotal 14,534 36,642 47,729 81,649 132,339 100 100 100 100 100 6.4 5.4 5.5 4.9 5.3
Coal 415 1,146 1,753 3,316 5,601 2.9 3.1 3.7 4.1 4.2 7.0 8.9 6.6 5.4 6.6Oil 10,015 22,267 28,750 46,381 70,603 68.9 60.8 60.2 56.8 53.4 5.5 5.2 4.9 4.3 4.7Natural gas 1,093 4,957 6,741 13,521 24,700 7.5 13.5 14.1 16.6 18.7 10.6 6.3 7.2 6.2 6.6Electricity 1,715 6,939 9,508 17,777 30,863 11.8 18.9 19.9 21.8 23.3 9.8 6.5 6.5 5.7 6.2Heat 0 0 0 0 0.0 0.0 0.0 0.0 0.0 - - - - -Others 1,296 1,333 977 654 571 8.9 3.6 2.0 0.8 0.4 0.2 -6.0 -3.9 -1.3 -3.3
1990- 2005- 2010- 2020- 2005-1990 2005 2010 2020 2030 1990 2005 2010 2020 2030 2005 2010 2020 2030 2030
Total 23,016 87,306 119,773 224,308 389,734 100 100 100 100 100 9.3 6.5 6.5 5.7 6.2Coal 2,825 23,134 49,812 102,722 194,913 12.3 26.5 41.6 45.8 50.0 15.0 16.6 7.5 6.6 8.9Oil 11,138 2,489 2,863 3,198 3,068 48.4 2.9 2.4 1.4 0.8 -9.5 2.8 1.1 -0.4 0.8Natural gas 5,064 55,899 55,853 100,222 173,587 22.0 64.0 46.6 44.7 44.5 17.4 0.0 6.0 5.6 4.6Nuclear 0 0 0 0 0.0 0.0 0.0 0.0 0.0 - - - - -Hydro 3,989 5,784 11,245 18,166 18,166 17.3 6.6 9.4 8.1 4.7 2.5 14.2 4.9 0.0 4.7Geothermal 0 0 0 0 0.0 0.0 0.0 0.0 0.0 - - - - -Others 0 0 0 0 0.0 0.0 0.0 0.0 0.0 - - - - -
1990- 2005- 2010- 2020- 2005-1990 2005 2010 2020 2030 1990 2005 2010 2020 2030 2005 2010 2020 2030 2030
Total 4,977 17,488 22,791 41,558 72,821 100 100 100 100 100 8.7 5.4 6.2 5.8 5.9Coal 622 4,714 10,149 20,930 39,715 12.5 27.0 44.5 50.4 54.5 14.5 16.6 7.5 6.6 8.9Oil 2,994 575 662 739 709 60.2 3.3 2.9 1.8 1.0 -10.4 2.8 1.1 -0.4 0.8Natural gas 1,361 12,199 11,980 19,888 32,397 27.3 69.8 52.6 47.9 44.5 15.7 -0.4 5.2 5.0 4.0
1990- 2005- 2010- 2020- 2005-1990 2005 2010 2020 2030 1990 2005 2010 2020 2030 2005 2010 2020 2030 2030
Total 32.9 40.1 41.0 42.7 43.9 1.3 0.4 0.4 0.3 0.4Coal 39.1 42.2 42.2 42.2 42.2 0.5 0.0 0.0 0.0 0.0Oil 32.0 37.2 37.2 37.2 37.2 1.0 0.0 0.0 0.0 0.0Natural gas 32.0 39.4 40.1 43.3 46.1 1.4 0.3 0.8 0.6 0.6
1990- 2005- 2010- 2020- 2005-1990 2005 2010 2020 2030 1990 2005 2010 2020 2030 2005 2010 2020 2030 2030
Total 13,364 35,974 48,843 85,933 143,470 100 100 100 100 6.8 6.3 5.8 5.3 5.7
Energy and economic indicators1990- 2005- 2010- 2020- 2005-
1990 2005 2010 2020 2030 2005 2010 2020 2030 2030GDP (billion constant 2000 US$) 45 112 146 262 426 6.2 5.5 6.0 5.0 5.5Population (millions of people) 18.1 25.7 27.6 31.7 35.0 2.4 1.5 1.4 1.0 1.3GDP per capita (thousands of constant 2000 US$/person) 2.5 4.4 5.3 8.3 12.2 3.7 4.0 4.5 4.0 4.2Primary energy consumption per capita (toe/person) 1.3 2.0 2.5 3.7 5.4 3.0 4.1 4.1 3.9 4.0Primary energy consumption per GDP (toe/constant 2000 US$) 513 461 464 443 441 -0.7 0.1 -0.5 0.0 -0.2CO2 emissions per unit of GDP (t-C/million constant 2000 US$) 294 322 334 328 336 0.6 0.8 -0.2 0.2 0.2
CO2 emissions per unit of primary energy consumption (t-C/toe) 0.6 0.70 0.72 0.74 0.76 1.3 0.6 0.3 0.3 0.4Automobile ownership volume (millions of vehicles) - - - - -
- - - - -
AAGR(%)
AAGR(%)
Automobile ownership volume per capita (vehicles per person)
CO2 EMISSIONS kt-C %
AAGR(%)INPUT
Thermal Efficiency % AAGR(%)
OUTPUT
POWER GENERATION ktoe %
POWER GENERATION GWh % AAGR(%)
% AAGR(%)DEMAND
Others
CONSUMPTION
FINAL ENERGY ktoe
MALAYSIA [High Growth Scenario]
PRIMARY ENERGY ktoe % AAGR(%)

The 2nd ASEAN Energy Outlook
137
1990- 2005- 2010- 2020- 2005-1990 2005 2010 2020 2030 1990 2005 2010 2020 2030 2005 2010 2020 2030 2030
Total 10,683 13,811 14,871 17,421 20,682 100 100 100 100 100 1.7 1.5 1.6 1.7 1.6Coal 63 76 130 256 420 0.6 0.6 0.9 1.5 2.0 1.3 11.4 7.0 5.1 7.1Oil 736 1,969 2,117 2,539 2,867 6.9 14.3 14.2 14.6 13.9 6.8 1.5 1.8 1.2 1.5Natural gas 760 1,825 1,793 2,598 4,001 7.1 13.2 12.1 14.9 19.3 6.0 -0.3 3.8 4.4 3.2Nuclear 0 0 0 0 0.0 0.0 0.0 0.0 0.0 - - - - -Hydro 103 258 671 1,328 2,324 1.0 1.9 4.5 7.6 11.2 6.3 21.1 7.1 5.8 9.2Geothermal 0 0 0 0 0.0 0.0 0.0 0.0 0.0 - - - - -Others (inc. electricity imports) 9,021 9,684 10,159 10,699 11,070 84.4 70.1 68.3 61.4 53.5 0.5 1.0 0.5 0.3 0.5
1990- 2005- 2010- 2020- 2005-By Sector 1990 2005 2010 2020 2030 1990 2005 2010 2020 2030 2005 2010 2020 2030 2030Total 9,404 12,798 13,755 16,165 19,251 100 100 100 100 100 2.1 1.5 1.6 1.8 1.6
Industry 485 1,733 1,694 2,398 3,510 5.2 13.5 12.3 14.8 18.2 8.9 -0.5 3.5 3.9 2.9Transportation 451 1,337 1,575 2,343 3,280 4.8 10.4 11.5 14.5 17.0 7.5 3.3 4.1 3.4 3.7
8,468 9,728 10,486 11,424 12,461 90.0 76.0 76.2 70.7 64.7 0.9 1.5 0.9 0.9 1.0Non-energy 0.0 0.0 0.0 0.0 0.0 - - - - -
By FuelTotal 9,405 12,798 13,755 16,165 19,251 100 100 100 100 100 2.1 1.5 1.6 1.8 1.6
Coal 48 76 130 256 420 0.5 0.6 0.9 1.6 2.2 3.1 11.4 7.0 5.1 7.1Oil 594 1,674 1,820 2,242 2,570 6.3 13.1 13.2 13.9 13.3 7.2 1.7 2.1 1.4 1.7Natural gas 225 1,049 979 1,784 3,187 2.4 8.2 7.1 11.0 16.6 10.8 -1.4 6.2 6.0 4.5Electricity 149 315 430 648 921 1.6 2.5 3.1 4.0 4.8 5.1 6.4 4.2 3.6 4.4Heat 0 0 0 0 0.0 0.0 0.0 0.0 0.0 - - - - -Others 8,389 9,684 10,395 11,234 12,152 89.2 75.7 75.6 69.5 63.1 1.0 1.4 0.8 0.8 0.9
1990- 2005- 2010- 2020- 2005-1990 2005 2010 2020 2030 1990 2005 2010 2020 2030 2005 2010 2020 2030 2030
Total 2,478 6,015 10,950 18,599 30,179 100 100 100 100 100 6.1 12.7 5.4 5.0 6.7Coal 40 0 0 0 0 1.6 0.0 0.0 0.0 0.0 -100.0 - - - -Oil 271 622 631 631 631 10.9 10.3 5.8 3.4 2.1 5.7 0.3 0.0 0.0 0.1Natural gas 974 2,396 2,520 2,520 2,520 39.3 39.8 23.0 13.5 8.3 6.2 1.0 0.0 0.0 0.2Nuclear 0 0 0 0 0.0 0.0 0.0 0.0 0.0 - - - - -Hydro 1,193 2,997 7,799 15,448 27,028 48.1 49.8 71.2 83.1 89.6 6.3 21.1 7.1 5.8 9.2Geothermal 0 0 0 0 0.0 0.0 0.0 0.0 0.0 - - - - -Others 0 0 0 0 0.0 0.0 0.0 0.0 0.0 - - - - -
1990- 2005- 2010- 2020- 2005-1990 2005 2010 2020 2030 1990 2005 2010 2020 2030 2005 2010 2020 2030 2030
Total 510 884 924 924 924 100 100 100 100 100 3.7 0.9 0.0 0.0 0.2Coal 12 0 0 0 0 2.4 0.0 0.0 0.0 0.0 -100.0 - - - -Oil 64 149 151 151 151 12.5 16.8 16.3 16.3 16.3 5.8 0.3 0.0 0.0 0.1Natural gas 434 736 774 774 774 85.1 83.2 83.7 83.7 83.7 3.6 1.0 0.0 0.0 0.2
1995- 2005- 2010- 2020- 2005-1990 2005 2010 2020 2030 1990 2005 2010 2020 2030 2005 2010 2020 2030 2030
Total 21.7 29.3 29.3 29.3 29.3 2.0 0.0 0.0 0.0 0.0Coal 28.7 -100.0 - - - -Oil 36.4 36.0 36.0 36.0 36.0 -0.1 0.0 0.0 0.0 0.0Natural gas 19.3 28.0 28.0 28.0 28.0 2.5 0.0 0.0 0.0 0.0
1990- 2005- 2010- 2020- 2005-1990 2005 2010 2020 2030 1990 2005 2010 2020 2030 2005 2010 2020 2030 2030
Total 1,083 2,870 3,034 4,034 5,376 100 100 100 100 6.7 1.1 2.9 2.9 2.5
Energy and economic indicators1990- 2005- 2010- 2020- 2005-
1990 2005 2010 2020 2030 2005 2010 2020 2030 2030GDP (billion constant 2000 US$) 3.7 13.3 19.1 32.1 48.9 9.0 7.5 5.3 4.3 5.3Population (millions of people) 40.5 50.5 53.4 58.9 63.8 1.5 1.1 1.0 0.8 0.9GDP per capita (thousands of constant 2000 US$/person) 0.09 0.26 0.36 0.54 0.77 7.4 6.3 4.3 3.5 4.4Primary energy consumption per capita (toe/person) 0.26 0.27 0.28 0.30 0.32 0.2 0.4 0.6 0.9 0.7Primary energy consumption per GDP (toe/constant 2000 US$) 2,905 1,036 777 543 423 -6.6 -5.6 -3.5 -2.5 -3.5CO2 emissions per unit of GDP (t-C/million constant 2000 US$) 294 215 158 126 110 -2.1 -5.9 -2.3 -1.3 -2.7
CO2 emissions per unit of primary energy consumption (t-C/toe) 0.10 0.21 0.20 0.23 0.26 4.9 -0.4 1.3 1.2 0.9Automobile ownership volume (millions of vehicles) - - - - -
- - - - -
AAGR(%)
AAGR(%)
Automobile ownership volume per capita (vehicles per person)
CO2 EMISSIONS kt-C %
AAGR(%)INPUT
Thermal Efficiency % AAGR(%)
OUTPUT
POWER GENERATION ktoe %
POWER GENERATION GWh % AAGR(%)
% AAGR(%)DEMAND
Others
CONSUMPTION
FINAL ENERGY ktoe
MYANMAR [Reference Scenario]
PRIMARY ENERGY ktoe % AAGR(%)

The 2nd ASEAN Energy Outlook
138
1990- 2005- 2010- 2020- 2005-1990 2005 2010 2020 2030 1990 2005 2010 2020 2030 2005 2010 2020 2030 2030
Total 10,683 13,811 14,828 21,428 35,534 100 100 100 100 100 1.7 1.4 3.8 5.2 3.9Coal 63 76 127 568 1,536 0.6 0.6 0.9 2.6 4.3 1.3 10.8 16.2 10.5 12.8Oil 736 1,969 2,093 4,258 7,603 6.9 14.3 14.1 19.9 21.4 6.8 1.2 7.4 6.0 5.6Natural gas 760 1,825 1,783 4,010 10,758 7.1 13.2 12.0 18.7 30.3 6.0 -0.5 8.4 10.4 7.4Nuclear 0 0 0 0 0.0 0.0 0.0 0.0 0.0 - - - - -Hydro 103 258 671 2,271 6,391 1.0 1.9 4.5 10.6 18.0 6.3 21.1 13.0 10.9 13.7Geothermal 0 0 0 0 0.0 0.0 0.0 0.0 0.0 - - - - -Others (inc. electricity imports) 9,021 9,684 10,154 10,321 9,245 84.4 70.1 68.5 48.2 26.0 0.5 1.0 0.2 -1.1 -0.2
1990- 2005- 2010- 2020- 2005-By Sector 1990 2005 2010 2020 2030 1990 2005 2010 2020 2030 2005 2010 2020 2030 2030Total 9,404 12,798 13,714 19,951 33,225 100 100 100 100 100 2.1 1.4 3.8 5.2 3.9
Industry 485 1,733 1,679 3,925 9,763 5.2 13.5 12.2 19.7 29.4 8.9 -0.6 8.9 9.5 7.2Transportation 451 1,337 1,550 4,513 10,611 4.8 10.4 11.3 22.6 31.9 7.5 3.0 11.3 8.9 8.6
8,468 9,728 10,485 11,514 12,851 90.0 76.0 76.5 57.7 38.7 0.9 1.5 0.9 1.1 1.1Non-energy 0.0 0.0 0.0 0.0 0.0 - - - - -
By FuelTotal 9,405 12,798 13,714 19,951 33,225 100 100 100 100 100 2.1 1.4 3.8 5.2 3.9
Coal 48 76 127 568 1,536 0.5 0.6 0.9 2.8 4.6 3.1 10.8 16.2 10.5 12.8Oil 594 1,674 1,796 3,961 7,306 6.3 13.1 13.1 19.9 22.0 7.2 1.4 8.2 6.3 6.1Natural gas 225 1,049 969 3,196 9,944 2.4 8.2 7.1 16.0 29.9 10.8 -1.6 12.7 12.0 9.4Electricity 149 315 427 993 2,287 1.6 2.5 3.1 5.0 6.9 5.1 6.3 8.8 8.7 8.3Heat 0 0 0 0 0.0 0.0 0.0 0.0 0.0 - - - - -Others 8,389 9,684 10,395 11,234 12,152 89.2 75.7 75.8 56.3 36.6 1.0 1.4 0.8 0.8 0.9
1990- 2005- 2010- 2020- 2005-1990 2005 2010 2020 2030 1990 2005 2010 2020 2030 2005 2010 2020 2030 2030
Total 2,478 6,015 10,950 29,568 77,479 100 100 100 100 100 6.1 12.7 10.4 10.1 10.8Coal 40 0 0 0 0 1.6 0.0 0.0 0.0 0.0 -100.0 - - - -Oil 271 622 631 631 631 10.9 10.3 5.8 2.1 0.8 5.7 0.3 0.0 0.0 0.1Natural gas 974 2,396 2,520 2,520 2,520 39.3 39.8 23.0 8.5 3.3 6.2 1.0 0.0 0.0 0.2Nuclear 0 0 0 0 0.0 0.0 0.0 0.0 0.0 - - - - -Hydro 1,193 2,997 7,799 26,417 74,328 48.1 49.8 71.2 89.3 95.9 6.3 21.1 13.0 10.9 13.7Geothermal 0 0 0 0 0.0 0.0 0.0 0.0 0.0 - - - - -Others 0 0 0 0 0.0 0.0 0.0 0.0 0.0 - - - - -
1990- 2005- 2010- 2020- 2005-1990 2005 2010 2020 2030 1990 2005 2010 2020 2030 2005 2010 2020 2030 2030
Total 510 884 924 924 924 100 100 100 100 100 3.7 0.9 0.0 0.0 0.2Coal 12 0 0 0 0 2.4 0.0 0.0 0.0 0.0 -100.0 - - - -Oil 64 149 151 151 151 12.5 16.8 16.3 16.3 16.3 5.8 0.3 0.0 0.0 0.1Natural gas 434 736 774 774 774 85.1 83.2 83.7 83.7 83.7 3.6 1.0 0.0 0.0 0.2
1995- 2005- 2010- 2020- 2005-1990 2005 2010 2020 2030 1990 2005 2010 2020 2030 2005 2010 2020 2030 2030
Total 21.7 29.3 29.3 29.3 29.3 2.0 0.0 0.0 0.0 0.0Coal 28.7 -100.0 - - - -Oil 36.4 36.0 36.0 36.0 36.0 -0.1 0.0 0.0 0.0 0.0Natural gas 19.3 28.0 28.0 28.0 28.0 2.5 0.0 0.0 0.0 0.0
1990- 2005- 2010- 2020- 2005-1990 2005 2010 2020 2030 1990 2005 2010 2020 2030 2005 2010 2020 2030 2030
Total 1,083 2,870 3,004 6,709 14,838 100 100 100 100 6.7 0.9 8.4 8.3 6.8
Energy and economic indicators1990- 2005- 2010- 2020- 2005-
1990 2005 2010 2020 2030 2005 2010 2020 2030 2030GDP (billion constant 2000 US$) 4 13 19 64 164 9.0 7.1 13.1 9.8 10.6Population (millions of people) 40.5 50.5 53.4 58.9 63.8 1.5 1.1 1.0 0.8 0.9GDP per capita (thousands of constant 2000 US$/person) 0.09 0.26 0.35 1.09 2.57 7.4 5.9 12.0 8.9 9.5Primary energy consumption per capita (toe/person) 0.26 0.27 0.28 0.36 0.56 0.2 0.3 2.7 4.4 2.9Primary energy consumption per GDP (toe/constant 2000 US$) 2,905 1,036 789 333 217 -6.6 -5.3 -8.3 -4.2 -6.1CO2 emissions per unit of GDP (t-C/million constant 2000 US$) 294 215 160 104 91 -2.1 -5.8 -4.2 -1.4 -3.4
CO2 emissions per unit of primary energy consumption (t-C/toe) 0.10 0.21 0.20 0.31 0.42 4.9 -0.5 4.4 2.9 2.8Automobile ownership volume (millions of vehicles) - - - - -
- - - - -
MYANMAR [High Growth Scenario]
PRIMARY ENERGY ktoe % AAGR(%)CONSUMPTION
FINAL ENERGY ktoe % AAGR(%)DEMAND
Others
POWER GENERATION GWh % AAGR(%)OUTPUT
POWER GENERATION ktoe % AAGR(%)INPUT
Thermal Efficiency % AAGR(%)
CO2 EMISSIONS kt-C % AAGR(%)
AAGR(%)
Automobile ownership volume per capita (vehicles per person)

The 2nd ASEAN Energy Outlook
139
1990- 2005- 2010- 2020- 2005-1990 2005 2010 2020 2030 1990 2005 2010 2020 2030 2005 2010 2020 2030 2030
Total 26,158 40,580 50,786 75,152 105,726 100 100 100 100 100 3.0 4.6 4.0 3.5 3.9Coal 1,297 5,678 8,694 18,695 29,826 5.0 14.0 17.1 24.9 28.2 10.3 8.9 8.0 4.8 6.9Oil 11,999 15,184 17,762 25,192 35,234 45.9 37.4 35.0 33.5 33.3 1.6 3.2 3.6 3.4 3.4Natural gas 2,685 2,972 6,088 10,247 0.0 6.6 5.9 8.1 9.7 - 2.1 7.4 5.3 5.5Nuclear 0 0 0 3,944 0.0 0.0 0.0 0.0 3.7 - - - - -Hydro 521 721 834 976 1,076 2.0 1.8 1.6 1.3 1.0 2.2 3.0 1.6 1.0 1.6Geothermal 4,699 8,514 11,235 13,155 13,155 18.0 21.0 22.1 17.5 12.4 4.0 5.7 1.6 0.0 1.8Others (inc. electricity imports) 7,642 7,798 9,289 11,045 12,244 29.2 19.2 18.3 14.7 11.6 0.1 3.6 1.7 1.0 1.8
1990- 2005- 2010- 2020- 2005-By Sector 1990 2005 2010 2020 2030 1990 2005 2010 2020 2030 2005 2010 2020 2030 2030Total 15,230 26,419 32,203 46,814 65,573 100 100 100 100 100 3.7 4.0 3.8 3.4 3.7
Industry 4,143 8,588 10,107 13,578 17,448 27.2 32.5 31.4 29.0 26.6 5.0 3.3 3.0 2.5 2.9Transportation 2,655 9,795 12,444 17,850 24,871 17.4 37.1 38.6 38.1 37.9 9.1 4.9 3.7 3.4 3.8
8,432 8,036 9,651 15,386 23,254 55.4 30.4 30.0 32.9 35.5 -0.3 3.7 4.8 4.2 4.3Non-energy 0.0 0.0 0.0 0.0 0.0 - - - - -
By FuelTotal 15,230 26,419 32,203 46,814 65,573 100 100 100 100 100 3.7 4.0 3.8 3.4 3.7
Coal 445 1,154 1,391 1,795 2,117 2.9 4.4 4.3 3.8 3.2 6.6 3.8 2.6 1.7 2.5Oil 7,274 13,590 16,544 24,587 34,961 47.8 51.4 51.4 52.5 53.3 4.3 4.0 4.0 3.6 3.9Natural gas 0 0 0 0 0 0.0 0.0 0.0 0.0 0.0 - - - - -Electricity 1,797 3,877 4,979 9,386 16,251 11.8 14.7 15.5 20.0 24.8 5.3 5.1 6.5 5.6 5.9Heat 0 0 0 0 0 0.0 0.0 0.0 0.0 0.0 - - - - -Others 5,714 7,798 9,289 11,045 12,244 37.5 29.5 28.8 23.6 18.7 2.1 3.6 1.7 1.0 1.8
1990- 2005- 2010- 2020- 2005-1990 2005 2010 2020 2030 1990 2005 2010 2020 2030 2005 2010 2020 2030 2030
Total 25,245 56,551 72,379 136,449 236,253 100 100 100 100 100 5.5 5.1 6.5 5.6 5.9Coal 1,934 15,257 26,502 69,972 128,904 7.7 27.0 36.6 51.3 54.6 14.8 11.7 10.2 6.3 8.9Oil 11,783 6,141 4,394 1,543 0 46.7 10.9 6.1 1.1 0.0 -4.3 -6.5 -9.9 -100.0 -100.0Natural gas 16,861 18,665 38,230 64,351 0.0 29.8 25.8 28.0 27.2 - 2.1 7.4 5.3 5.5Nuclear 0 0 0 15,137 0.0 0.0 0.0 0.0 6.4 - - - - -Hydro 6,062 8,387 9,701 11,353 12,509 24.0 14.8 13.4 8.3 5.3 2.2 3.0 1.6 1.0 1.6Geothermal 5,466 9,902 13,060 15,294 15,294 21.7 17.5 18.0 11.2 6.5 4.0 5.7 1.6 0.0 1.8Others 3 57 57 57 0.0 0.0 0.1 0.0 0.0 - 80.2 0.0 0.0 12.5
1990- 2005- 2010- 2020- 2005-1990 2005 2010 2020 2030 1990 2005 2010 2020 2030 2005 2010 2020 2030 2030
Total 3,208 8,529 11,220 23,320 37,956 100 100 100 100 100 6.7 5.6 7.6 5.0 6.2Coal 466 4,524 7,304 16,900 27,710 14.5 53.0 65.1 72.5 73.0 16.4 10.1 8.8 5.1 7.5Oil 2,742 1,320 944 332 0 85.5 15.5 8.4 1.4 0.0 -4.8 -6.5 -9.9 -100.0 -100.0Natural gas 2,685 2,972 6,088 10,247 0.0 31.5 26.5 26.1 27.0 - 2.1 7.4 5.3 5.5
1995- 2005- 2010- 2020- 2005-1990 2005 2010 2020 2030 1990 2005 2010 2020 2030 2005 2010 2020 2030 2030
Total 36.8 38.6 38.0 40.5 43.8 0.3 -0.3 0.6 0.8 0.5Coal 35.7 29.0 31.2 35.6 40.0 -1.4 1.5 1.3 1.2 1.3Oil 37.0 40.0 40.0 40.0 0.5 0.0 0.0 -100.0 -100.0Natural gas 54.0 54.0 54.0 54.0 - 0.0 0.0 0.0 0.0
1990- 2005- 2010- 2020- 2005-1990 2005 2010 2020 2030 1990 2005 2010 2020 2030 2005 2010 2020 2030 2030
Total 9,829 20,369 25,910 44,722 67,552 100 100 100 100 5.0 4.9 5.6 4.2 4.9
Energy and economic indicators1990- 2005- 2010- 2020- 2005-
1990 2005 2010 2020 2030 2005 2010 2020 2030 2030GDP (billion constant 2000 US$) 56 94 123 195 289 3.5 5.5 4.7 4.0 4.6Population (millions of people) 61 83 91 107 118 2.1 1.9 1.6 1.0 1.4GDP per capita (thousands of constant 2000 US$/person) 0.9 1.1 1.4 1.8 2.4 1.4 3.5 3.1 3.0 3.1Primary energy consumption per capita (toe/person) 0.43 0.49 0.56 0.70 0.89 0.9 2.6 2.4 2.4 2.5Primary energy consumption per GDP (toe/constant 2000 US$) 465 430 411 385 366 -0.5 -0.9 -0.7 -0.5 -0.6CO2 emissions per unit of GDP (t-C/million constant 2000 US$) 175 216 210 229 234 1.4 -0.5 0.9 0.2 0.3
CO2 emissions per unit of primary energy consumption (t-C/toe) 0.38 0.50 0.51 0.60 0.64 1.9 0.3 1.6 0.7 1.0
Automobile ownership volume (millions of vehicles) 1.6 5.0 6.6 9.5 13.3 7.9 5.6 3.7 3.4 4.00.03 0.06 0.07 0.09 0.11 5.7 3.6 2.1 2.4 2.5
PHILIPPINES [Reference Scenario]
PRIMARY ENERGY ktoe % AAGR(%)CONSUMPTION
FINAL ENERGY ktoe % AAGR(%)DEMAND
Others
POWER GENERATION GWh % AAGR(%)OUTPUT
POWER GENERATION ktoe % AAGR(%)INPUT
Thermal Efficiency % AAGR(%)
CO2 EMISSIONS kt-C % AAGR(%)
AAGR(%)
Automobile ownership volume per capita (vehicles per person)

The 2nd ASEAN Energy Outlook
140
1990- 2005- 2010- 2020- 2005-1990 2005 2010 2020 2030 1990 2005 2010 2020 2030 2005 2010 2020 2030 2030
Total 26,158 40,580 51,239 87,593 145,225 100 100 100 100 100 3.0 4.8 5.5 5.2 5.2Coal 1,297 5,678 8,754 24,696 47,039 5.0 14.0 17.1 28.2 32.4 10.3 9.0 10.9 6.7 8.8Oil 11,999 15,184 18,121 29,947 50,587 45.9 37.4 35.4 34.2 34.8 1.6 3.6 5.2 5.4 4.9Natural gas 2,685 2,996 7,532 16,623 0.0 6.6 5.8 8.6 11.4 - 2.2 9.7 8.2 7.6Nuclear 0 0 0 3,795 0.0 0.0 0.0 0.0 2.6 - - - - -Hydro 521 721 834 976 1,076 2.0 1.8 1.6 1.1 0.7 2.2 3.0 1.6 1.0 1.6Geothermal 4,699 8,514 11,235 13,155 13,155 18.0 21.0 21.9 15.0 9.1 4.0 5.7 1.6 0.0 1.8Others (inc. electricity imports) 7,642 7,798 9,299 11,286 12,951 29.2 19.2 18.1 12.9 8.9 0.1 3.6 2.0 1.4 2.0
1990- 2005- 2010- 2020- 2005-By Sector 1990 2005 2010 2020 2030 1990 2005 2010 2020 2030 2005 2010 2020 2030 2030Total 15,230 26,419 32,497 54,332 89,855 100 100 100 100 100 3.7 4.2 5.3 5.2 5.0
Industry 4,143 8,588 10,152 14,824 21,581 27.2 32.5 31.2 27.3 24.0 5.0 3.4 3.9 3.8 3.8Transportation 2,655 9,795 12,624 21,935 36,955 17.4 37.1 38.8 40.4 41.1 9.1 5.2 5.7 5.4 5.5
8,432 8,036 9,721 17,573 31,319 55.4 30.4 29.9 32.3 34.9 -0.3 3.9 6.1 5.9 5.6Non-energy 0.0 0.0 0.0 0.0 0.0 - - - - -
By FuelTotal 15,230 26,419 32,497 54,332 89,855 100 100 100 100 100 3.7 4.2 5.3 5.2 5.0
Coal 445 1,154 1,391 1,795 2,117 2.9 4.4 4.3 3.3 2.4 6.6 3.8 2.6 1.7 2.5Oil 7,274 13,590 16,757 29,621 50,313 47.8 51.4 51.6 54.5 56.0 4.3 4.3 5.9 5.4 5.4Natural gas 0 0 0 0 0 0.0 0.0 0.0 0.0 0.0 - - - - -Electricity 1,797 3,877 5,051 11,630 24,474 11.8 14.7 15.5 21.4 27.2 5.3 5.4 8.7 7.7 7.6Heat 0 0 0 0 0 0.0 0.0 0.0 0.0 0.0 - - - - -Others 5,714 7,798 9,299 11,286 12,951 37.5 29.5 28.6 20.8 14.4 2.1 3.6 2.0 1.4 2.0
1990- 2005- 2010- 2020- 2005-1990 2005 2010 2020 2030 1990 2005 2010 2020 2030 2005 2010 2020 2030 2030
Total 25,245 56,551 73,432 169,070 355,796 100 100 100 100 100 5.5 5.4 8.7 7.7 7.6Coal 1,934 15,257 26,720 94,817 208,979 7.7 27.0 36.4 56.1 58.7 14.8 11.9 13.5 8.2 11.0Oil 11,783 6,141 5,075 245 0 46.7 10.9 6.9 0.1 0.0 -4.3 -3.7 -26.1 -100.0 -100.0Natural gas 16,861 18,818 47,304 104,393 0.0 29.8 25.6 28.0 29.3 - 2.2 9.7 8.2 7.6Nuclear 0 0 0 14,564 0.0 0.0 0.0 0.0 4.1 - - - - -Hydro 6,062 8,387 9,701 11,353 12,509 24.0 14.8 13.2 6.7 3.5 2.2 3.0 1.6 1.0 1.6Geothermal 5,466 9,902 13,060 15,294 15,294 21.7 17.5 17.8 9.0 4.3 4.0 5.7 1.6 0.0 1.8Others 3 57 57 57 0.0 0.0 0.1 0.0 0.0 - 80.2 0.0 0.0 12.5
1990- 2005- 2010- 2020- 2005-1990 2005 2010 2020 2030 1990 2005 2010 2020 2030 2005 2010 2020 2030 2030
Total 3,208 8,529 11,451 30,486 61,545 100 100 100 100 100 6.7 6.1 10.3 7.3 8.2Coal 466 4,524 7,364 22,901 44,923 14.5 53.0 64.3 75.1 73.0 16.4 10.2 12.0 7.0 9.6Oil 2,742 1,320 1,091 53 0 85.5 15.5 9.5 0.2 0.0 -4.8 -3.7 -26.1 -100.0 -100.0Natural gas 2,685 2,996 7,532 16,623 0.0 31.5 26.2 24.7 27.0 - 2.2 9.7 8.2 7.6
1995- 2005- 2010- 2020- 2005-1990 2005 2010 2020 2030 1990 2005 2010 2020 2030 2005 2010 2020 2030 2030
Total 36.8 38.6 38.0 40.2 43.8 0.3 -0.3 0.6 0.9 0.5Coal 35.7 29.0 31.2 35.6 40.0 -1.4 1.5 1.3 1.2 1.3Oil 37.0 40.0 40.0 0.5 0.0 -100.0 - -100.0Natural gas 54.0 54.0 54.0 54.0 - 0.0 0.0 0.0 0.0
1990- 2005- 2010- 2020- 2005-1990 2005 2010 2020 2030 1990 2005 2010 2020 2030 2005 2010 2020 2030 2030
Total 9,829 20,369 26,290 55,985 102,714 100 100 100 100 5.0 5.2 7.9 6.3 6.7
Energy and economic indicators1990- 2005- 2010- 2020- 2005-
1990 2005 2010 2020 2030 2005 2010 2020 2030 2030GDP (billion constant 2000 US$) 56 94 125 239 429 3.5 5.8 6.7 6.0 6.2Population (millions of people) 61 83 91 107 118 2.1 1.9 1.6 1.0 1.4GDP per capita (thousands of constant 2000 US$/person) 0.9 1.1 1.4 2.2 3.6 1.4 3.8 5.0 5.0 4.8Primary energy consumption per capita (toe/person) 0.43 0.49 0.56 0.82 1.23 0.9 2.8 3.8 4.1 3.8Primary energy consumption per GDP (toe/constant 2000 US$) 465 430 409 366 339 -0.5 -1.0 -1.1 -0.8 -0.9CO2 emissions per unit of GDP (t-C/million constant 2000 US$) 175 216 210 234 239 1.4 -0.5 1.1 0.2 0.4
CO2 emissions per unit of primary energy consumption (t-C/toe) 0.38 0.50 0.51 0.64 0.71 1.9 0.4 2.2 1.0 1.4
Automobile ownership volume (millions of vehicles) 1.6 5.0 6.6 9.5 13.3 7.9 5.6 3.7 3.4 4.00.03 0.06 0.07 0.09 0.11 5.7 3.6 2.1 2.4 2.5
AAGR(%)
AAGR(%)
Automobile ownership volume per capita (vehicles per person)
CO2 EMISSIONS kt-C %
AAGR(%)INPUT
Thermal Efficiency % AAGR(%)
OUTPUT
POWER GENERATION ktoe %
POWER GENERATION GWh % AAGR(%)
% AAGR(%)DEMAND
Others
CONSUMPTION
FINAL ENERGY ktoe
PHILIPPINES [High Growth Scenario]
PRIMARY ENERGY ktoe % AAGR(%)

The 2nd ASEAN Energy Outlook
141
1990- 2005- 2010- 2020- 2005-1990 2005 2010 2020 2030 1990 2005 2010 2020 2030 2005 2010 2020 2030 2030
Total 13,359 30,229 33,907 41,707 52,510 100 100 100 100 100 5.6 2.3 2.1 2.3 2.2Coal 0 0 0 0 0 0.0 0.0 0.0 0.0 0.0 - - - - -Oil 13,359 23,997 25,998 30,625 37,047 100.0 79.4 76.7 73.4 70.6 4.0 1.6 1.7 1.9 1.8Natural gas 0 5,933 7,563 10,736 15,117 0.0 19.6 22.3 25.7 28.8 - 5.0 3.6 3.5 3.8Nuclear 0 0 0 0 0 0.0 0.0 0.0 0.0 0.0 - - - - -Hydro 0 0 0 0 0 0.0 0.0 0.0 0.0 0.0 - - - - -Geothermal 0 0 0 0 0 0.0 0.0 0.0 0.0 0.0 - - - - -Others (inc. electricity imports) 0 299 346 346 346 0.0 1.0 1.0 0.8 0.7 - 3.0 0.0 0.0 0.6
1990- 2005- 2010- 2020- 2005-By Sector 1990 2005 2010 2020 2030 1990 2005 2010 2020 2030 2005 2010 2020 2030 2030Total 6,839 15,616 17,794 22,917 30,692 100 100 100 100 100 5.7 2.6 2.6 3.0 2.7
Industry 2,915 7,892 8,406 10,335 13,691 42.6 50.5 47.2 45.1 44.6 6.9 1.3 2.1 2.9 2.2Transportation 3,258 5,714 6,998 9,276 12,344 47.6 36.6 39.3 40.5 40.2 3.8 4.1 2.9 2.9 3.1
666 2,010 2,390 3,307 4,656 9.7 12.9 13.4 14.4 15.2 7.6 3.5 3.3 3.5 3.4Non-energy 0.0 0.0 0.0 0.0 0.0 - - - - -
By FuelTotal 6,839 15,616 17,794 22,917 30,692 100 100 100 100 100 5.7 2.6 2.6 3.0 2.7
Coal 0.0 0.0 0.0 0.0 0.0 - - - - -Oil 5,757 12,830 14,445 18,072 23,652 84.2 82.2 81.2 78.9 77.1 5.5 2.4 2.3 2.7 2.5Natural gas 0.0 0.0 0.0 0.0 0.0 - - - - -Electricity 1,082 2,786 3,349 4,845 7,040 15.8 17.8 18.8 21.1 22.9 6.5 3.8 3.8 3.8 3.8Heat 0.0 0.0 0.0 0.0 0.0 - - - - -Others 0.0 0.0 0.0 0.0 0.0 - - - - -
1990- 2005- 2010- 2020- 2005-1990 2005 2010 2020 2030 1990 2005 2010 2020 2030 2005 2010 2020 2030 2030
Total 15,714 38,213 45,566 64,963 93,301 100 100 100 100 100 6.1 3.6 3.6 3.7 3.6Coal 0.0 0.0 0.0 0.0 0.0 - - - - -Oil 15,714 8,637 8,000 8,200 7,689 100.0 22.6 17.6 12.6 8.2 -3.9 -1.5 0.2 -0.6 -0.5Natural gas 28,430 36,237 55,433 84,283 0.0 74.4 79.5 85.3 90.3 - 5.0 4.3 4.3 4.4Nuclear 0.0 0.0 0.0 0.0 0.0 - - - - -Hydro 0.0 0.0 0.0 0.0 0.0 - - - - -Geothermal 0.0 0.0 0.0 0.0 0.0 - - - - -Others 1,146 1,330 1,330 1,330 0.0 3.0 2.9 2.0 1.4 - 3.0 0.0 0.0 0.6
1990- 2005- 2010- 2020- 2005-1990 2005 2010 2020 2030 1990 2005 2010 2020 2030 2005 2010 2020 2030 2030
Total 4,414 7,837 9,326 12,544 16,813 100 100 100 100 100 3.9 3.5 3.0 3.0 3.1Coal 0.0 0.0 0.0 0.0 0.0 - - - - -Oil 4,414 1,904 1,764 1,808 1,695 100.0 24.3 18.9 14.4 10.1 -5.5 -1.5 0.2 -0.6 -0.5Natural gas 5,933 7,563 10,736 15,117 0.0 75.7 81.1 85.6 89.9 - 5.0 3.6 3.5 3.8
1995- 2005- 2010- 2020- 2005-1990 2005 2010 2020 2030 1990 2005 2010 2020 2030 2005 2010 2020 2030 2030
Total 30.6 40.7 40.8 43.6 47.0 1.9 0.1 0.7 0.8 0.6Coal - - - - -Oil 30.6 39.0 39.0 39.0 39.0 1.6 0.0 0.0 0.0 0.0Natural gas 41.2 41.2 44.4 47.9 - 0.0 0.7 0.8 0.6
1990- 2005- 2010- 2020- 2005-1990 2005 2010 2020 2030 1990 2005 2010 2020 2030 2005 2010 2020 2030 2030
Total 7,849 13,280 15,431 19,670 25,217 100 100 100 100 3.6 3.0 2.5 2.5 2.6
Energy and economic indicators1990- 2005- 2010- 2020- 2005-
1990 2005 2010 2020 2030 2005 2010 2020 2030 2030GDP (billion constant 2000 US$) 45 113 142 204 299 6.4 4.7 3.7 3.9 4.0Population (millions of people) 3.0 4.3 4.6 5.0 5.3 2.4 1.2 0.8 0.5 0.8GDP per capita (thousands of constant 2000 US$/person) 14.7 26.0 30.8 40.8 56.6 3.9 3.5 2.8 3.3 3.2Primary energy consumption per capita (toe/person) 4.4 7.0 7.4 8.3 9.9 3.1 1.1 1.3 1.8 1.4Primary energy consumption per GDP (toe/constant 2000 US$) 299 268 239 204 176 -0.7 -2.3 -1.5 -1.5 -1.7CO2 emissions per unit of GDP (t-C/million constant 2000 US$) 176 118 109 96 84 -2.6 -1.6 -1.2 -1.3 -1.3
CO2 emissions per unit of primary energy consumption (t-C/toe) 0.59 0.44 0.46 0.47 0.48 -1.9 0.7 0.4 0.2 0.4Automobile ownership volume (millions of vehicles) - - - - -
- - - - -
AAGR(%)
AAGR(%)
Automobile ownership volume per capita (vehicles per person)
CO2 EMISSIONS kt-C %
AAGR(%)INPUT
Thermal Efficiency % AAGR(%)
OUTPUT
POWER GENERATION ktoe %
POWER GENERATION GWh % AAGR(%)
% AAGR(%)DEMAND
Others
CONSUMPTION
FINAL ENERGY ktoe
SINGAPORE [Reference Scenario]
PRIMARY ENERGY ktoe % AAGR(%)
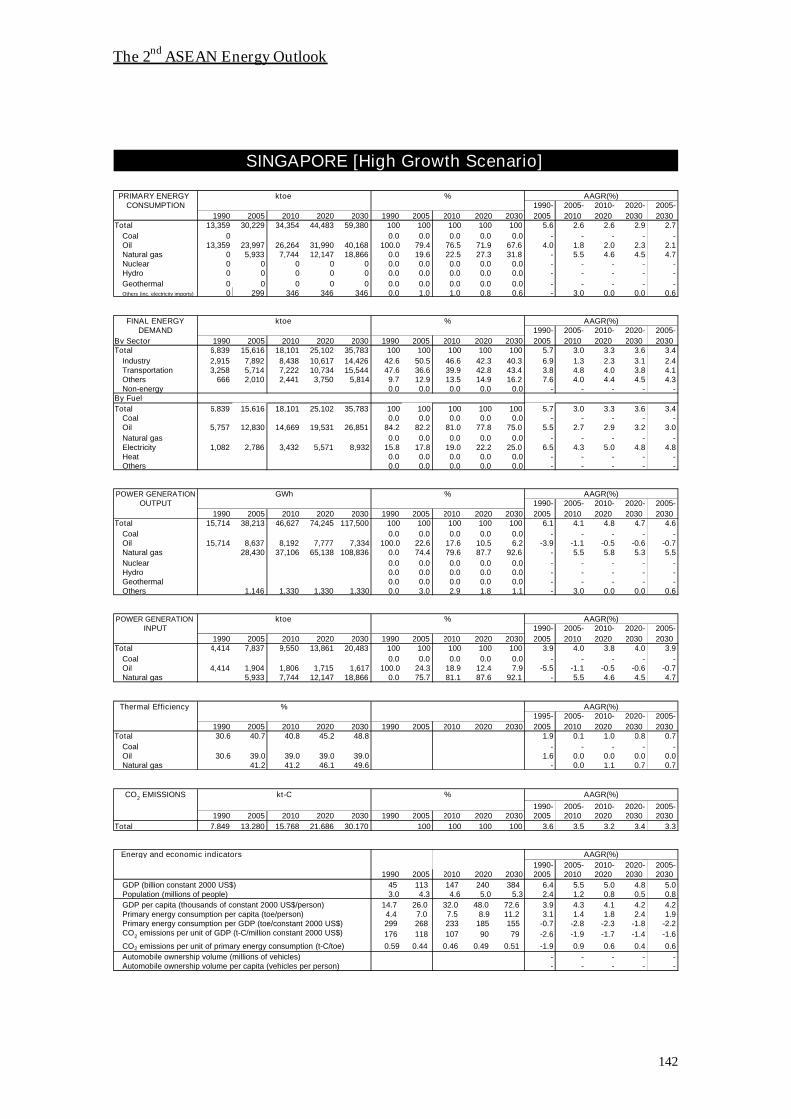
The 2nd ASEAN Energy Outlook
142
1990- 2005- 2010- 2020- 2005-1990 2005 2010 2020 2030 1990 2005 2010 2020 2030 2005 2010 2020 2030 2030
Total 13,359 30,229 34,354 44,483 59,380 100 100 100 100 100 5.6 2.6 2.6 2.9 2.7Coal 0 0.0 0.0 0.0 0.0 0.0 - - - - -Oil 13,359 23,997 26,264 31,990 40,168 100.0 79.4 76.5 71.9 67.6 4.0 1.8 2.0 2.3 2.1Natural gas 0 5,933 7,744 12,147 18,866 0.0 19.6 22.5 27.3 31.8 - 5.5 4.6 4.5 4.7Nuclear 0 0 0 0 0 0.0 0.0 0.0 0.0 0.0 - - - - -Hydro 0 0 0 0 0 0.0 0.0 0.0 0.0 0.0 - - - - -Geothermal 0 0 0 0 0 0.0 0.0 0.0 0.0 0.0 - - - - -Others (inc. electricity imports) 0 299 346 346 346 0.0 1.0 1.0 0.8 0.6 - 3.0 0.0 0.0 0.6
1990- 2005- 2010- 2020- 2005-By Sector 1990 2005 2010 2020 2030 1990 2005 2010 2020 2030 2005 2010 2020 2030 2030Total 6,839 15,616 18,101 25,102 35,783 100 100 100 100 100 5.7 3.0 3.3 3.6 3.4
Industry 2,915 7,892 8,438 10,617 14,426 42.6 50.5 46.6 42.3 40.3 6.9 1.3 2.3 3.1 2.4Transportation 3,258 5,714 7,222 10,734 15,544 47.6 36.6 39.9 42.8 43.4 3.8 4.8 4.0 3.8 4.1
666 2,010 2,441 3,750 5,814 9.7 12.9 13.5 14.9 16.2 7.6 4.0 4.4 4.5 4.3Non-energy 0.0 0.0 0.0 0.0 0.0 - - - - -
By FuelTotal 6,839 15,616 18,101 25,102 35,783 100 100 100 100 100 5.7 3.0 3.3 3.6 3.4
Coal 0.0 0.0 0.0 0.0 0.0 - - - - -Oil 5,757 12,830 14,669 19,531 26,851 84.2 82.2 81.0 77.8 75.0 5.5 2.7 2.9 3.2 3.0Natural gas 0.0 0.0 0.0 0.0 0.0 - - - - -Electricity 1,082 2,786 3,432 5,571 8,932 15.8 17.8 19.0 22.2 25.0 6.5 4.3 5.0 4.8 4.8Heat 0.0 0.0 0.0 0.0 0.0 - - - - -Others 0.0 0.0 0.0 0.0 0.0 - - - - -
1990- 2005- 2010- 2020- 2005-1990 2005 2010 2020 2030 1990 2005 2010 2020 2030 2005 2010 2020 2030 2030
Total 15,714 38,213 46,627 74,245 117,500 100 100 100 100 100 6.1 4.1 4.8 4.7 4.6Coal 0.0 0.0 0.0 0.0 0.0 - - - - -Oil 15,714 8,637 8,192 7,777 7,334 100.0 22.6 17.6 10.5 6.2 -3.9 -1.1 -0.5 -0.6 -0.7Natural gas 28,430 37,106 65,138 108,836 0.0 74.4 79.6 87.7 92.6 - 5.5 5.8 5.3 5.5Nuclear 0.0 0.0 0.0 0.0 0.0 - - - - -Hydro 0.0 0.0 0.0 0.0 0.0 - - - - -Geothermal 0.0 0.0 0.0 0.0 0.0 - - - - -Others 1,146 1,330 1,330 1,330 0.0 3.0 2.9 1.8 1.1 - 3.0 0.0 0.0 0.6
1990- 2005- 2010- 2020- 2005-1990 2005 2010 2020 2030 1990 2005 2010 2020 2030 2005 2010 2020 2030 2030
Total 4,414 7,837 9,550 13,861 20,483 100 100 100 100 100 3.9 4.0 3.8 4.0 3.9Coal 0.0 0.0 0.0 0.0 0.0 - - - - -Oil 4,414 1,904 1,806 1,715 1,617 100.0 24.3 18.9 12.4 7.9 -5.5 -1.1 -0.5 -0.6 -0.7Natural gas 5,933 7,744 12,147 18,866 0.0 75.7 81.1 87.6 92.1 - 5.5 4.6 4.5 4.7
1995- 2005- 2010- 2020- 2005-1990 2005 2010 2020 2030 1990 2005 2010 2020 2030 2005 2010 2020 2030 2030
Total 30.6 40.7 40.8 45.2 48.8 1.9 0.1 1.0 0.8 0.7Coal - - - - -Oil 30.6 39.0 39.0 39.0 39.0 1.6 0.0 0.0 0.0 0.0Natural gas 41.2 41.2 46.1 49.6 - 0.0 1.1 0.7 0.7
1990- 2005- 2010- 2020- 2005-1990 2005 2010 2020 2030 1990 2005 2010 2020 2030 2005 2010 2020 2030 2030
Total 7,849 13,280 15,768 21,686 30,170 100 100 100 100 3.6 3.5 3.2 3.4 3.3
Energy and economic indicators1990- 2005- 2010- 2020- 2005-
1990 2005 2010 2020 2030 2005 2010 2020 2030 2030GDP (billion constant 2000 US$) 45 113 147 240 384 6.4 5.5 5.0 4.8 5.0Population (millions of people) 3.0 4.3 4.6 5.0 5.3 2.4 1.2 0.8 0.5 0.8GDP per capita (thousands of constant 2000 US$/person) 14.7 26.0 32.0 48.0 72.6 3.9 4.3 4.1 4.2 4.2Primary energy consumption per capita (toe/person) 4.4 7.0 7.5 8.9 11.2 3.1 1.4 1.8 2.4 1.9Primary energy consumption per GDP (toe/constant 2000 US$) 299 268 233 185 155 -0.7 -2.8 -2.3 -1.8 -2.2CO2 emissions per unit of GDP (t-C/million constant 2000 US$) 176 118 107 90 79 -2.6 -1.9 -1.7 -1.4 -1.6
CO2 emissions per unit of primary energy consumption (t-C/toe) 0.59 0.44 0.46 0.49 0.51 -1.9 0.9 0.6 0.4 0.6Automobile ownership volume (millions of vehicles) - - - - -
- - - - -
SINGAPORE [High Growth Scenario]
PRIMARY ENERGY ktoe % AAGR(%)CONSUMPTION
FINAL ENERGY ktoe % AAGR(%)DEMAND
Others
POWER GENERATION GWh % AAGR(%)OUTPUT
POWER GENERATION ktoe % AAGR(%)INPUT
Thermal Efficiency % AAGR(%)
CO2 EMISSIONS kt-C % AAGR(%)
AAGR(%)
Automobile ownership volume per capita (vehicles per person)

The 2nd ASEAN Energy Outlook
143
1990- 2005- 2010- 2020- 2005-1990 2005 2010 2020 2030 1990 2005 2010 2020 2030 2005 2010 2020 2030 2030
Total 43,861 98,877 121,014 174,077 251,563 100 100 100 100 100 5.6 4.1 3.7 3.8 3.8Coal 3,817 10,630 15,478 26,368 44,384 8.7 10.8 12.8 15.1 17.6 7.1 7.8 5.5 5.3 5.9Oil 19,823 45,426 52,425 76,433 117,235 45.2 45.9 43.3 43.9 46.6 5.7 2.9 3.8 4.4 3.9Natural gas 5,097 25,929 28,362 44,843 65,052 11.6 26.2 23.4 25.8 25.9 11.5 1.8 4.7 3.8 3.7Nuclear 0 0 0 0 0.0 0.0 0.0 0.0 0.0 - - - - -Hydro 428 488 516 516 516 1.0 0.5 0.4 0.3 0.2 0.9 1.1 0.0 0.0 0.2Geothermal 1 0 0 0 0 0.0 0.0 0.0 0.0 0.0 -100.0 - - - -Others (inc. electricity imports) 14,695 16,404 24,233 25,917 24,376 33.5 16.6 20.0 14.9 9.7 0.7 8.1 0.7 -0.6 1.6
1990- 2005- 2010- 2020- 2005-By Sector 1990 2005 2010 2020 2030 1990 2005 2010 2020 2030 2005 2010 2020 2030 2030Total 30,737 65,328 79,419 116,772 173,298 100 100 100 100 100 5.2 4.0 3.9 4.0 4.0
Industry 9,025 27,061 29,792 41,934 60,585 29.4 41.4 37.5 35.9 35.0 7.6 1.9 3.5 3.7 3.3Transportation 10,916 22,051 28,621 46,049 74,531 35.5 33.8 36.0 39.4 43.0 4.8 5.4 4.9 4.9 5.0
10,796 16,216 21,006 28,789 38,182 35.1 24.8 26.4 24.7 22.0 2.7 5.3 3.2 2.9 3.5Non-energy 0.0 0.0 0.0 0.0 0.0 - - - - -
By FuelTotal 30,738 65,328 79,419 116,772 173,298 100 100 100 100 100 5.2 4.0 3.9 4.0 4.0
Coal 1,308 5,747 6,598 11,036 18,120 4.3 8.8 8.3 9.5 10.5 10.4 2.8 5.3 5.1 4.7Oil 16,736 36,396 42,708 62,050 96,749 54.4 55.7 53.8 53.1 55.8 5.3 3.3 3.8 4.5 4.0Natural gas 242 1,855 2,897 6,630 8,821 0.8 2.8 3.6 5.7 5.1 14.5 9.3 8.6 2.9 6.4Electricity 3,298 10,377 12,659 20,993 33,704 10.7 15.9 15.9 18.0 19.4 7.9 4.1 5.2 4.8 4.8Heat 0 0 0 0 0.0 0.0 0.0 0.0 0.0 - - - - -Others 9,154 10,953 14,556 16,063 15,904 29.8 16.8 18.3 13.8 9.2 1.2 5.9 1.0 -0.1 1.5
1990- 2005- 2010- 2020- 2005-1990 2005 2010 2020 2030 1990 2005 2010 2020 2030 2005 2010 2020 2030 2030
Total 44,177 130,427 161,236 270,265 436,549 100 100 100 100 100 7.5 4.3 5.3 4.9 5.0Coal 11,053 20,615 37,536 67,599 118,475 25.0 15.8 23.3 25.0 27.1 4.2 12.7 6.1 5.8 7.2Oil 10,378 7,817 0 0 0 23.5 6.0 0.0 0.0 0.0 -1.9 -100.0 - - -100.0Natural gas 17,770 94,468 108,808 187,774 303,183 40.2 72.4 67.5 69.5 69.4 11.8 2.9 5.6 4.9 4.8Nuclear 0 0 0 0 0.0 0.0 0.0 0.0 0.0 - - - - -Hydro 4,975 5,671 6,001 6,001 6,001 11.3 4.3 3.7 2.2 1.4 0.9 1.1 0.0 0.0 0.2Geothermal 1 0 0 0 0 0.0 0.0 0.0 0.0 0.0 -100.0 - - - -Others 1,856 8,891 8,891 8,891 0.0 1.4 5.5 3.3 2.0 - 36.8 0.0 0.0 6.5
1990- 2005- 2010- 2020- 2005-1990 2005 2010 2020 2030 1990 2005 2010 2020 2030 2005 2010 2020 2030 2030
Total 8,922 25,683 29,290 48,490 77,440 100 100 100 100 100 7.3 2.7 5.2 4.8 4.5Coal 2,548 4,883 8,880 15,332 26,263 28.6 19.0 30.3 31.6 33.9 4.4 12.7 5.6 5.5 7.0Oil 2,551 1,780 0 0 0 28.6 6.9 0.0 0.0 0.0 -2.4 -100.0 - - -100.0Natural gas 3,823 19,019 20,410 33,158 51,176 42.8 74.1 69.7 68.4 66.1 11.3 1.4 5.0 4.4 4.0
1995- 2005- 2010- 2020- 2005-1990 2005 2010 2020 2030 1990 2005 2010 2020 2030 2005 2010 2020 2030 2030
Total 37.8 41.2 43.0 45.3 46.8 0.6 0.9 0.5 0.3 0.5Coal 37.3 36.3 36.4 37.9 38.8 -0.2 0.0 0.4 0.2 0.3Oil 35.0 37.8 0.5 -100.0 - - -100.0Natural gas 40.0 42.7 45.8 48.7 50.9 0.4 1.4 0.6 0.5 0.7
1990- 2005- 2010- 2020- 2005-1990 2005 2010 2020 2030 1990 2005 2010 2020 2030 2005 2010 2020 2030 2030
Total 21,431 57,317 69,337 111,306 177,011 100 100 100 100 6.8 3.9 4.8 4.7 4.6
Energy and economic indicators1990- 2005- 2010- 2020- 2005-
1990 2005 2010 2020 2030 2005 2010 2020 2030 2030GDP (billion constant 2000 US$) 79 157 199 317 498 4.7 4.8 4.8 4.6 4.7Population (millions of people) 54.6 64.2 66.1 68.8 70.2 1.1 0.6 0.4 0.2 0.4GDP per capita (thousands of constant 2000 US$/person) 1.5 2.4 3.0 4.6 7.1 3.5 4.2 4.4 4.4 4.3Primary energy consumption per capita (toe/person) 0.80 1.54 1.83 2.53 3.58 4.4 3.5 3.3 3.5 3.4Primary energy consumption per GDP (toe/constant 2000 US$) 553 629 609 548 506 0.9 -0.6 -1.0 -0.8 -0.9CO2 emissions per unit of GDP (t-C/million constant 2000 US$) 270 365 349 351 356 2.0 -0.9 0.0 0.1 -0.1
CO2 emissions per unit of primary energy consumption (t-C/toe) 0.49 0.58 0.57 0.64 0.70 1.1 -0.2 1.1 1.0 0.8Automobile ownership volume (millions of vehicles) - - - - -
- - - - -
AAGR(%)
AAGR(%)
Automobile ownership volume per capita (vehicles per person)
CO2 EMISSIONS kt-C %
AAGR(%)INPUT
Thermal Efficiency % AAGR(%)
OUTPUT
POWER GENERATION ktoe %
POWER GENERATION GWh % AAGR(%)
% AAGR(%)DEMAND
Others
CONSUMPTION
FINAL ENERGY ktoe
THAILAND [Reference Scenario]
PRIMARY ENERGY ktoe % AAGR(%)

The 2nd ASEAN Energy Outlook
144
1990- 2005- 2010- 2020- 2005-1990 2005 2010 2020 2030 1990 2005 2010 2020 2030 2005 2010 2020 2030 2030
Total 43,861 98,877 124,455 190,915 291,618 100 100 100 100 100 5.6 4.7 4.4 4.3 4.4Coal 3,817 10,630 15,780 30,754 55,410 8.7 10.8 12.7 16.1 19.0 7.1 8.2 6.9 6.1 6.8Oil 19,823 45,426 54,275 84,540 136,129 45.2 45.9 43.6 44.3 46.7 5.7 3.6 4.5 4.9 4.5Natural gas 5,097 25,929 29,746 49,956 77,288 11.6 26.2 23.9 26.2 26.5 11.5 2.8 5.3 4.5 4.5Nuclear 0 0 0 0 0.0 0.0 0.0 0.0 0.0 - - - - -Hydro 428 488 516 516 516 1.0 0.5 0.4 0.3 0.2 0.9 1.1 0.0 0.0 0.2Geothermal 1 0 0 0 0 0.0 0.0 0.0 0.0 0.0 -100.0 - - - -Others (inc. electricity imports) 14,695 16,404 24,138 25,149 22,275 33.5 16.6 19.4 13.2 7.6 0.7 8.0 0.4 -1.2 1.2
1990- 2005- 2010- 2020- 2005-By Sector 1990 2005 2010 2020 2030 1990 2005 2010 2020 2030 2005 2010 2020 2030 2030Total 30,737 65,328 82,231 129,721 203,893 100 100 100 100 100 5.2 4.7 4.7 4.6 4.7
Industry 9,025 27,061 30,537 46,028 70,689 29.4 41.4 37.1 35.5 34.7 7.6 2.4 4.2 4.4 3.9Transportation 10,916 22,051 30,279 53,212 91,174 35.5 33.8 36.8 41.0 44.7 4.8 6.5 5.8 5.5 5.8
10,796 16,216 21,416 30,481 42,031 35.1 24.8 26.0 23.5 20.6 2.7 5.7 3.6 3.3 3.9Non-energy 0.0 0.0 0.0 0.0 0.0 - - - - -
By FuelTotal 30,738 65,328 82,231 129,721 203,893 100 100 100 100 100 5.2 4.7 4.7 4.6 4.7
Coal 1,308 5,747 6,942 12,910 22,712 4.3 8.8 8.4 10.0 11.1 10.4 3.8 6.4 5.8 5.7Oil 16,736 36,396 44,559 70,156 115,643 54.4 55.7 54.2 54.1 56.7 5.3 4.1 4.6 5.1 4.7Natural gas 242 1,855 2,897 6,630 8,821 0.8 2.8 3.5 5.1 4.3 14.5 9.3 8.6 2.9 6.4Electricity 3,298 10,377 13,330 24,388 41,980 10.7 15.9 16.2 18.8 20.6 7.9 5.1 6.2 5.6 5.7Heat 0 0 0 0 0.0 0.0 0.0 0.0 0.0 - - - - -Others 9,154 10,953 14,503 15,636 14,737 29.8 16.8 17.6 12.1 7.2 1.2 5.8 0.8 -0.6 1.2
1990- 2005- 2010- 2020- 2005-1990 2005 2010 2020 2030 1990 2005 2010 2020 2030 2005 2010 2020 2030 2030
Total 44,177 130,427 170,016 314,677 544,817 100 100 100 100 100 7.5 5.4 6.3 5.6 5.9Coal 11,053 20,615 37,362 79,286 148,416 25.0 15.8 22.0 25.2 27.2 4.2 12.6 7.8 6.5 8.2Oil 10,378 7,817 0 0 0 23.5 6.0 0.0 0.0 0.0 -1.9 -100.0 - - -100.0Natural gas 17,770 94,468 117,762 220,499 381,509 40.2 72.4 69.3 70.1 70.0 11.8 4.5 6.5 5.6 5.7Nuclear 0 0 0 0 0.0 0.0 0.0 0.0 0.0 - - - - -Hydro 4,975 5,671 6,001 6,001 6,001 11.3 4.3 3.5 1.9 1.1 0.9 1.1 0.0 0.0 0.2Geothermal 1 0 0 0 0 0.0 0.0 0.0 0.0 0.0 -100.0 - - - -Others 1,856 8,891 8,891 8,891 0.0 1.4 5.2 2.8 1.6 - 36.8 0.0 0.0 6.5
1990- 2005- 2010- 2020- 2005-1990 2005 2010 2020 2030 1990 2005 2010 2020 2030 2005 2010 2020 2030 2030
Total 8,922 25,683 30,633 56,116 96,109 100 100 100 100 100 7.3 3.6 6.2 5.5 5.4Coal 2,548 4,883 8,839 17,844 32,698 28.6 19.0 28.9 31.8 34.0 4.4 12.6 7.3 6.2 7.9Oil 2,551 1,780 0 0 0 28.6 6.9 0.0 0.0 0.0 -2.4 -100.0 - - -100.0Natural gas 3,823 19,019 21,794 38,272 63,412 42.8 74.1 71.1 68.2 66.0 11.3 2.8 5.8 5.2 4.9
1995- 2005- 2010- 2020- 2005-1990 2005 2010 2020 2030 1990 2005 2010 2020 2030 2005 2010 2020 2030 2030
Total 37.8 41.2 43.6 45.9 47.4 0.6 1.1 0.5 0.3 0.6Coal 37.3 36.3 36.4 38.2 39.0 -0.2 0.0 0.5 0.2 0.3Oil 35.0 37.8 0.5 -100.0 - - -100.0Natural gas 40.0 42.7 46.5 49.5 51.7 0.4 1.7 0.6 0.4 0.8
1990- 2005- 2010- 2020- 2005-1990 2005 2010 2020 2030 1990 2005 2010 2020 2030 2005 2010 2020 2030 2030
Total 21,431 57,317 72,122 126,259 212,949 100 100 100 100 6.8 4.7 5.8 5.4 5.4
Energy and economic indicators1990- 2005- 2010- 2020- 2005-
1990 2005 2010 2020 2030 2005 2010 2020 2030 2030GDP (billion constant 2000 US$) 79 157 212 373 625 4.7 6.2 5.8 5.3 5.7Population (millions of people) 54.6 64.2 66.1 68.8 70.2 1.1 0.6 0.4 0.2 0.4GDP per capita (thousands of constant 2000 US$/person) 1.5 2.4 3.2 5.4 8.9 3.5 5.6 5.4 5.1 5.3Primary energy consumption per capita (toe/person) 0.8 1.5 1.9 2.8 4.2 4.4 4.1 4.0 4.1 4.0Primary energy consumption per GDP (toe/constant 2000 US$) 553 629 586 512 467 0.9 -1.4 -1.3 -0.9 -1.2CO2 emissions per unit of GDP (t-C/million constant 2000 US$) 270 365 340 339 341 2.0 -1.4 0.0 0.1 -0.3
CO2 emissions per unit of primary energy consumption (t-C/toe) 0.49 0.58 0.58 0.66 0.73 1.1 0.0 1.3 1.0 0.9Automobile ownership volume (millions of vehicles) - - - - -
- - - - -
THAILAND [High Growth Scenario]
PRIMARY ENERGY ktoe % AAGR(%)CONSUMPTION
FINAL ENERGY ktoe % AAGR(%)DEMAND
Others
POWER GENERATION GWh % AAGR(%)OUTPUT
POWER GENERATION ktoe % AAGR(%)INPUT
Thermal Efficiency % AAGR(%)
CO2 EMISSIONS kt-C % AAGR(%)
AAGR(%)
Automobile ownership volume per capita (vehicles per person)

The 2nd ASEAN Energy Outlook
145
1990- 2005- 2010- 2020- 2005-1990 2005 2010 2020 2030 1990 2005 2010 2020 2030 2005 2010 2020 2030 2030
Total 24,325 49,983 61,520 105,836 186,884 100 100 100 100 100 4.9 4.2 5.6 5.9 5.4Coal 2,222 8,125 12,023 25,163 59,759 9.1 16.3 19.5 23.8 32.0 9.0 8.2 7.7 9.0 8.3Oil 2,738 12,367 18,027 36,884 66,738 11.3 24.7 29.3 34.9 35.7 10.6 7.8 7.4 6.1 7.0Natural gas 3 4,913 4,019 8,196 23,033 0.0 9.8 6.5 7.7 12.3 63.8 -3.9 7.4 10.9 6.4Nuclear 0 0 0 3,621 7,304 0.0 0.0 0.0 3.4 3.9 - - - 7.3 -Hydro 462 1,845 4,206 7,446 7,554 1.9 3.7 6.8 7.0 4.0 9.7 17.9 5.9 0.1 5.8Geothermal 0 0 0 0 0.0 0.0 0.0 0.0 0.0 - - - - -Others (inc. electricity imports) 18,900 22,734 23,245 24,525 22,496 77.7 45.5 37.8 23.2 12.0 1.2 0.4 0.5 -0.9 -0.04
1990- 2005- 2010- 2020- 2005-By Sector 1990 2005 2010 2020 2030 1990 2005 2010 2020 2030 2005 2010 2020 2030 2030Total 23,117 44,346 56,190 92,583 151,750 100 100 100 100 100 4.4 4.8 5.1 5.1 5.0
Industry 1,746 9,245 15,145 33,348 62,392 7.6 20.8 27.0 36.0 41.1 11.8 10.4 8.2 6.5 7.9Transportation 1,412 7,028 10,397 21,249 39,781 6.1 15.8 18.5 23.0 26.2 11.3 8.1 7.4 6.5 7.2
19,959 28,073 30,648 37,986 49,577 86.3 63.3 54.5 41.0 32.7 2.3 1.8 2.2 2.7 2.3Non-energy 0.0 0.0 0.0 0.0 0.0 - - - - -
By FuelTotal 23,117 44,346 56,190 92,583 151,750 100 100 100 100 100 4.4 4.8 5.1 5.1 5.0
Coal 1,329 5,993 9,604 19,871 36,062 5.7 13.5 17.1 21.5 23.8 10.6 9.9 7.5 6.1 7.4Oil 2,356 11,594 16,937 34,527 64,080 10.2 26.1 30.1 37.3 42.2 11.2 7.9 7.4 6.4 7.1Natural gas 0 100 356 1,024 2,059 0.0 0.2 0.6 1.1 1.4 - 28.9 11.1 7.2 12.9Electricity 532 3,931 6,496 14,860 29,341 2.3 8.9 11.6 16.1 19.3 14.3 10.6 8.6 7.0 8.4Heat 0 0 0 0 0.0 0.0 0.0 0.0 0.0 - - - - -Others 18,900 22,728 22,796 22,300 20,208 81.8 51.3 40.6 24.1 13.3 1.2 0.1 -0.2 -1.0 -0.5
1990- 2005- 2010- 2020- 2005-1990 2005 2010 2020 2030 1990 2005 2010 2020 2030 2005 2010 2020 2030 2030
Total 8,681 53,463 80,032 165,103 346,082 100 100 100 100 100 12.9 8.4 7.5 7.7 7.8Coal 2,001 8,941 10,903 24,111 109,568 23.1 16.7 13.6 14.6 31.7 10.5 4.0 8.3 16.3 10.5Oil 1,305 2,482 1,864 2,694 3,575 15.0 4.6 2.3 1.6 1.0 4.4 -5.6 3.8 2.9 1.5Natural gas 6 20,586 18,155 37,222 116,090 0.1 38.5 22.7 22.5 33.5 72.1 -2.5 7.4 12.0 7.2Nuclear 0 0 13,898 28,032 0.0 0.0 0.0 8.4 8.1 - - - 7.3 -Hydro 5,369 21,454 48,917 86,600 87,854 61.8 40.1 61.1 52.5 25.4 9.7 17.9 5.9 0.1 5.8Geothermal 0 0 0 0 0.0 0.0 0.0 0.0 0.0 - - - - -Others 0 193 578 964 0.0 0.0 0.2 0.4 0.3 - - 11.6 5.2 -
1990- 2005- 2010- 2020- 2005-1990 2005 2010 2020 2030 1990 2005 2010 2020 2030 2005 2010 2020 2030 2030
Total 1,273 7,717 6,718 13,384 45,893 100 100 100 100 100 12.8 -2.7 7.1 13.1 7.4Coal 888 2,132 2,419 5,292 23,697 69.8 27.6 36.0 39.5 51.6 6.0 2.6 8.1 16.2 10.1Oil 382 773 637 921 1,222 30.0 10.0 9.5 6.9 2.7 4.8 -3.8 3.8 2.9 1.8Natural gas 3 4,813 3,662 7,172 20,975 0.2 62.4 54.5 53.6 45.7 63.6 -5.3 7.0 11.3 6.1
1995- 2005- 2010- 2020- 2005-1990 2005 2010 2020 2030 1990 2005 2010 2020 2030 2005 2010 2020 2030 2030
Total 22.4 35.7 39.6 41.1 43.0 3.2 2.1 0.4 0.4 0.7Coal 19.4 36.1 38.8 39.2 39.8 4.2 1.5 0.1 0.1 0.4Oil 29.4 27.6 25.2 25.2 25.2 -0.4 -1.8 0.0 0.0 -0.4Natural gas 17.2 36.8 42.6 44.6 47.6 5.2 3.0 0.5 0.6 1.0
1990- 2005- 2010- 2020- 2005-1990 2005 2010 2020 2030 1990 2005 2010 2020 2030 2005 2010 2020 2030 2030
Total 4,623 22,907 30,926 63,399 137,451 100 100 100 100 11.3 6.2 7.4 8.0 7.4
Energy and economic indicators1990- 2005- 2010- 2020- 2005-
1990 2005 2010 2020 2030 2005 2010 2020 2030 2030GDP (billion constant 2000 US$) 15 45 63 118 211 7.6 7.0 6.5 6.0 6.4Population (millions of people) 66.2 83.1 87.3 96.5 106.6 1.5 1.0 1.0 1.0 1.0GDP per capita (thousands of constant 2000 US$/person) 0.2 0.5 0.7 1.2 2.0 5.9 6.0 5.4 5.0 5.3Primary energy consumption per capita (toe/person) 0.4 0.6 0.7 1.1 1.8 3.3 3.2 4.5 4.8 4.4Primary energy consumption per GDP (toe/constant 2000 US$) 1,620 1,116 980 898 885 -2.4 -2.6 -0.9 -0.1 -0.9CO2 emissions per unit of GDP (t-C/million constant 2000 US$) 308 512 492 538 651 3.4 -0.8 0.9 1.9 1.0
CO2 emissions per unit of primary energy consumption (t-C/toe) 0.2 0.46 0.50 0.60 0.74 6.0 1.9 1.8 2.1 1.9Automobile ownership volume (millions of vehicles) - - - - -
- - - - -
AAGR(%)
AAGR(%)
Automobile ownership volume per capita (vehicles per person)
CO2 EMISSIONS kt-C %
AAGR(%)INPUT
Thermal Efficiency % AAGR(%)
OUTPUT
POWER GENERATION ktoe %
POWER GENERATION GWh % AAGR(%)
% AAGR(%)DEMAND
Others
CONSUMPTION
FINAL ENERGY ktoe
VIETNAM [Reference Scenario]
PRIMARY ENERGY ktoe % AAGR(%)

The 2nd ASEAN Energy Outlook
146
1990- 2005- 2010- 2020- 2005-1990 2005 2010 2020 2030 1990 2005 2010 2020 2030 2005 2010 2020 2030 2030
Total 24,325 49,983 64,351 129,293 277,502 100 100 100 100 100 4.9 5.2 7.2 7.9 7.1Coal 2,222 8,125 13,283 35,904 104,578 9.1 16.3 20.6 27.8 37.7 9.0 10.3 10.5 11.3 10.8Oil 2,738 12,367 19,175 45,622 98,666 11.3 24.7 29.8 35.3 35.6 10.6 9.2 9.1 8.0 8.7Natural gas 3 4,913 4,418 12,081 36,905 0.0 9.8 6.9 9.3 13.3 63.8 -2.1 10.6 11.8 8.4Nuclear 0 0 0 3,652 7,304 0.0 0.0 0.0 2.8 2.6 - - - 7.2 -Hydro 462 1,845 4,229 7,509 7,554 1.9 3.7 6.6 5.8 2.7 9.7 18.1 5.9 0.1 5.8Geothermal 0 0 0 0 0.0 0.0 0.0 0.0 0.0 - - - - -Others (inc. electricity imports) 18,900 22,734 23,245 24,525 22,496 77.7 45.5 36.1 19.0 8.1 1.2 0.4 0.5 -0.9 0.0
1990- 2005- 2010- 2020- 2005-By Sector 1990 2005 2010 2020 2030 1990 2005 2010 2020 2030 2005 2010 2020 2030 2030Total 23,117 44,346 58,273 109,930 217,945 100 100 100 100 100 4.4 5.6 6.6 7.1 6.6
Industry 1,746 9,245 16,117 41,804 95,041 7.6 20.8 27.7 38.0 43.6 11.8 11.8 10.0 8.6 9.8Transportation 1,412 7,028 11,056 26,531 59,550 6.1 15.8 19.0 24.1 27.3 11.3 9.5 9.1 8.4 8.9
19,959 28,073 31,100 41,596 63,354 86.3 63.3 53.4 37.8 29.1 2.3 2.1 3.0 4.3 3.3Non-energy 0.0 0.0 0.0 0.0 0.0 - - - - -
By FuelTotal 23,117 44,346 58,273 109,930 217,945 100 100 100 100 100 4.4 5.6 6.6 7.1 6.6
Coal 1,329 5,993 10,156 24,533 53,484 5.7 13.5 17.4 22.3 24.5 10.6 11.1 9.2 8.1 9.1Oil 2,356 11,594 18,019 43,082 95,916 10.2 26.1 30.9 39.2 44.0 11.2 9.2 9.1 8.3 8.8Natural gas 0 100 376 1,246 2,969 0.0 0.2 0.6 1.1 1.4 - 30.3 12.7 9.1 14.5Electricity 532 3,931 6,925 18,771 45,368 2.3 8.9 11.9 17.1 20.8 14.3 12.0 10.5 9.2 10.3Heat 0 0 0 0 0.0 0.0 0.0 0.0 0.0 - - - - -Others 18,900 22,728 22,796 22,300 20,208 81.8 51.3 39.1 20.3 9.3 1.2 0.1 -0.2 -1.0 -0.5
1990- 2005- 2010- 2020- 2005-1990 2005 2010 2020 2030 1990 2005 2010 2020 2030 2005 2010 2020 2030 2030
Total 8,681 53,463 85,638 215,077 548,678 100 100 100 100 100 12.9 9.9 9.6 9.8 9.8Coal 2,001 8,941 14,160 52,292 236,965 23.1 16.7 16.5 24.3 43.2 10.5 9.6 14.0 16.3 14.0Oil 1,305 2,482 2,057 3,231 3,844 15.0 4.6 2.4 1.5 0.7 4.4 -3.7 4.6 1.8 1.8Natural gas 6 20,586 20,040 57,631 191,019 0.1 38.5 23.4 26.8 34.8 72.1 -0.5 11.1 12.7 9.3Nuclear 0 0 14,016 28,032 0.0 0.0 0.0 6.5 5.1 - - - 7.2 -Hydro 5,369 21,454 49,188 87,328 87,854 61.8 40.1 57.4 40.6 16.0 9.7 18.1 5.9 0.1 5.8Geothermal 0 0 0 0 0.0 0.0 0.0 0.0 0.0 - - - - -Others 0 193 578 964 0.0 0.0 0.2 0.3 0.2 - - 11.6 5.2 -
1990- 2005- 2010- 2020- 2005-1990 2005 2010 2020 2030 1990 2005 2010 2020 2030 2005 2010 2020 2030 2030
Total 1,273 7,717 7,872 23,311 86,343 100 100 100 100 100 12.8 0.4 11.5 14.0 10.1Coal 888 2,132 3,127 11,371 51,093 69.8 27.6 39.7 48.8 59.2 6.0 8.0 13.8 16.2 13.5Oil 382 773 703 1,104 1,313 30.0 10.0 8.9 4.7 1.5 4.8 -1.9 4.6 1.8 2.1Natural gas 3 4,813 4,042 10,836 33,936 0.2 62.4 51.3 46.5 39.3 63.6 -3.4 10.4 12.1 8.1
1995- 2005- 2010- 2020- 2005-1990 2005 2010 2020 2030 1990 2005 2010 2020 2030 2005 2010 2020 2030 2030
Total 22.4 35.7 39.6 41.7 43.0 3.2 2.1 0.5 0.3 0.8Coal 19.4 36.1 38.9 39.5 39.9 4.2 1.5 0.2 0.1 0.4Oil 29.4 27.6 25.2 25.2 25.2 -0.4 -1.8 0.0 0.0 -0.4Natural gas 17.2 36.8 42.6 45.7 48.4 5.2 3.0 0.7 0.6 1.1
1990- 2005- 2010- 2020- 2005-1990 2005 2010 2020 2030 1990 2005 2010 2020 2030 2005 2010 2020 2030 2030
Total 4,623 22,907 33,583 85,471 224,047 100 100 100 100 11.3 8.0 9.8 10.1 9.6
Energy and economic indicators1990- 2005- 2010- 2020- 2005-
1990 2005 2010 2020 2030 2005 2010 2020 2030 2030GDP (billion constant 2000 US$) 15 45 67 148 320 7.6 8.5 8.2 8.0 8.2Population (millions of people) 66.2 83.1 87.3 96.5 106.6 1.5 1.0 1.0 1.0 1.0GDP per capita (thousands of constant 2000 US$/person) 0.2 0.5 0.8 1.5 3.0 5.9 7.4 7.1 6.9 7.1Primary energy consumption per capita (toe/person) 0.4 0.6 0.7 1.3 2.6 3.3 4.2 6.2 6.9 6.0Primary energy consumption per GDP (toe/constant 2000 US$) 1,620 1,116 956 873 868 -2.4 -3.1 -0.9 -0.1 -1.0CO2 emissions per unit of GDP (t-C/million constant 2000 US$) 308 512 499 577 701 3.4 -0.5 1.5 2.0 1.3
CO2 emissions per unit of primary energy consumption (t-C/toe) 0.19 0.46 0.52 0.66 0.81 6.0 2.6 2.4 2.0 2.3Automobile ownership volume (millions of vehicles) - - - - -
- - - - -
VIETNAM [High Growth Scenario]
PRIMARY ENERGY ktoe % AAGR(%)CONSUMPTION
FINAL ENERGY ktoe % AAGR(%)DEMAND
Others
POWER GENERATION GWh % AAGR(%)OUTPUT
POWER GENERATION ktoe % AAGR(%)INPUT
Thermal Efficiency % AAGR(%)
CO2 EMISSIONS kt-C % AAGR(%)
AAGR(%)
Automobile ownership volume per capita (vehicles per person)