the adjustment of china’s industrial structure after 1978
TRANSCRIPT

The Adjustment of China’s
Industrial Structure after 1978
DAI NUO
Master thesis for the master of Environmental and Development
Economics degree
UNIVERSITETET I OSLO
May 2009

2

3
Preface
I would like to thank my supervisor dear professor Olav Bjerkholt sincerely. He has
been providing help to me unselfishly for over one year not only on my thesis but also
in my study and life. I could not finish the thesis without his profound and
professional learning and great patience.
I also want to thank my neighbors, Li XiaoChan and Liu Lina. They helped me a lot
in daily life during this period.
My three years at University of Oslo have taught me a lot not only book learning but
also rich life experiences. I have broadened my horizon with different local conditions
and customs.
Last but not least, I would like to thank my parents with all my heart for not only my
wisdom and life given by them but also their unchangeable love.
DAI NUO
2009-04-14

4
Abstract
China’s aggregate economic activity has increased and the national economy has developed
rapidly since the reform and opening-up policy was carried out after 1978. The GDP growth
rate has kept over 10 percent since 2004. It is really a success taking consideration of the
previous poverty and lagging industry. This active change is mainly due to the upgrading of
the industrial structure.
The first part of this thesis mainly described the gradual changes in China’s industrial
structure. The adjustment after 1978 can be divided into 5 stages. The first stage was from
1978 to 1984. The focus point of adjustment in this period was to develop primary industry
to release the food stress. Among the three main industries, the government gave top priority
to primary industry and light and textile industry and promoted the development of
infrastructure and basic industry. As to the internal structure of primary industry, the
government provided fund and policy support to encourage farmers to engage in forestry,
animal-breeding and fishery.
The second stage was from 1985 to 1992. The main task in this period was to develop non-
agricultural industries. For primary industry, the most important policy was to promote the
development of labor and skill intensive industry and the ratio of crops farming still kept the
downtrend. For secondary industry, the main part of the structure was changed from raw
material industry to processing and assembly industry. The light industry still got the priority
to develop comparing to the heavy industry in this period. For tertiary industry, the
government gave priority to transportation and communication and new industry was highly
valued.
The third stage was from 1993 to 2000. The dominant position of secondary industry was
reestablished and strengthened in this stage. The notable feature of this period was that the
ratio of secondary industry increased rapidly with the strengthening of the construction of
infrastructure industry such as energy, transportation and communication. The government
made policy to proceed with the construction of infrastructure of energy, transport and
communication. Industrial departments such as electricity, steel, machinery, motor,
shipbuilding, chemical, electronics, building materials became the main driving force of

5
national economic development. In the urban areas, the development of business and
catering service industry was preceeded. In the rural areas, policies were made according to
their local circumstances and combined with the industrialization of agriculture and the
construction of small towns. The regional imbalance also got improvement.
The fourth stage was from 2001 to 2005. The tenth five-year plan was carried out in this
period and it was the most important period for the strategic adjustment of economic
structure. The main guide-line was that the fundamental position of primary industry should
be strengthened and the comprehensive development of rural economy should be promoted.
The overall quality and international competitiveness of China’s secondary industry, which
was market-oriented and took enterprises as the main bodies, were improved by the
technological development. The great development of social production capacity was gained
by the stimulation of information to industrialization. The quality and efficiency of
traditional service industries such as commerce, transportation and municipal service were
transformed by the use of modern management methods and service technology.
The fifth stage was from 2006 to now. The eleventh five-year plan was carried out during
this period. The main policies here were to take the development of comprehensive
agricultural production capacity as the primary task, to change the growth mode and to
strengthen its fundamental position. The main requirements of new-style industrialization
were to adjust the production structure, the organizational structure of enterprises and
industrial layout so that the overall technical level and competitiveness could be improved.
The government tried their best to promote the coordinated regional development and reduce
the energy consumption.
The second part of this thesis compared China with India in the aspect of changes in
industrial structure. China and India are neighbors and have many similarities in the aspect of
national basic conditions. They both have a large population and a weak economic
background. They were almost at the same starting line in the process of industrialization and
social and economic modernization. Although China and India adopted similar economic
development strategy at the begining of their national independence, their industrial
structures differed greatly. China followed the traditional path of industrialization that was
following the procedure of primary-secondary-tertiary and took secondary industry especially
manufacturing industry as the core of economic development at the present stage. India’s

6
economic growth pattern was quite different from other countries in Asia especially China. It
mainly relied on domestic market instead of export, on consumption instead of investment,
on tertiary industry instead of secondary industry, on high technology instead of low-skilled
manufacturing. India’s service industry played a very important role in Indian economic
growth.

7
Contents
PREFACE ............................................................................................................................................. 3
ABSTRACT ........................................................................................................................................... 4
CONTENTS .......................................................................................................................................... 7
1. THE EFFECTS UPON THE INDUSTRIAL STRUCTURE OF THE REFORMS AND OPENING-
UP OF CHINA’S ECONOMY ............................................................................................................ 9
1.1 BACKGROUND ......................................................................................................................... 9
1.2 FIRST STAGE: 1978-1984 ...................................................................................................... 10
1.2.1 Changes between three industries ............................................................................... 10
1.2.2 Internal adjustment ..................................................................................................... 12
1.2.3 The reform and opening-up policy .............................................................................. 13
1.3 SECOND STAGE: 1985-1992 .................................................................................................. 14
1.3.1 Changes in primary industry ....................................................................................... 15
1.3.2 Changes in secondary industry ................................................................................... 16
1.3.3 Changes in tertiary industry ....................................................................................... 18
1.4 THIRD STAGE: 1993-2000 ..................................................................................................... 21
1.4.1 Changes in primary industry ....................................................................................... 22
1.4.2 Construction of infrastructure..................................................................................... 23
1.4.3 Changes in secondary industry ................................................................................... 25
1.4.4 Changes in tertiary industry ....................................................................................... 28
1.4.5 Changes in regional economic structure .................................................................... 29
1.5 FOURTH STAGE: 2001-2005 ................................................................................................. 29
1.5.1 Changes in primary industry ....................................................................................... 30

8
1.5.2 Changes in secondary industry .................................................................................. 32
1.5.3 Changes in tertiary industry ....................................................................................... 34
1.5.4 The infrastructure construction .................................................................................. 34
1.5.5 Changes in regional structure .................................................................................... 35
1.6 FIFTH STAGE: SINCE 2006 ................................................................................................... 36
1.6.1 Building a new socialist countryside .......................................................................... 37
1.6.2 Promoting the optimization and upgrading of industrial structure ........................... 38
1.6.3 Rapid growth of tertiary industry ............................................................................... 39
1.6.4 Promoting the coordinated regional development ..................................................... 39
1.6.5 Reduction of energy consumption .............................................................................. 40
1.7 SUMMARY ............................................................................................................................. 40
2. A STRUCTURAL COMPARISON BETWEEN CHINA AND INDIA .............................. 43
2.1 THE COMMON FEATURES OF ECONOMIC DEVELOPMENT .................................................. 43
2.2 DIFFERENT PATH OF INDIA’S STRUCTURAL TRANSFORMATION ........................................ 45
2.2.1 India’s industrial model ............................................................................................. 45
2.2.2 India’s service industry .............................................................................................. 46
2.2.3 India’s primary industry............................................................................................. 49
2.2.4 India’s secondary industry ......................................................................................... 50
2.3 COMPARISON BETWEEN CHINA AND INDIA ........................................................................ 52
2.3.1 Differences in trade structure ..................................................................................... 54
2.3.2 Differences in infrastructure construction ................................................................. 54
2.3.3 Differences in overall economic structure ................................................................. 55
REFERENCE ..................................................................................................................................... 57

9
1. The effects upon the industrial structure of the
reforms and opening-up of China’s economy
China’s aggregate economic activities have increased and national economy has developed
rapidly since the reform and opening-up policy was initiated after 1978. The GDP growth
rate has kept over 10 percent ever since 2004 (from the speech of Xie FuZhan on the Council
press conference, 2008). It is really a success, especially comparing to the economic
dislocation after 3-year natural calamities (would be explained below). This can be mainly
attributable to the fundamental changes which have taken place in China’s industrial
structure. A lot of long standing issues, such as the disharmony of industrial property
relation, imbalance between supply and demand and so on have been solved basically.
1.1 Background
China’s economy was badly destroyed by China's war of resistance against Japan and the war
of liberation. In the face of backward industry and economic blockade, the primary mission
of the New China founded in 1949 was to build up a relatively complete modern industry
system. The policy pursued in that period followed the Soviet pattern of industrialization
with strong emphasis on building up heavy industry and with no emphasis on trade as key to
development. The first five-year plan of large-scale heavy industrial construction was started
from 1953.
The Great Leap Forward started from 1958 caused a serious imbalance in industrial structure.
It was intended to increase the production of steel and to raise agricultural production to
twice 1957 levels. The tedency towards boasting and exaggeration in all aspects especially in
grain yield prevailed. During the Great Leap Forward, farming was organized into communes
and the cultivation of private plots forbidden. This forced collectivisation substantially
reduced the incentives for peasants to work well. Iron and steel production was identified as
a key requirement for economic advancement. Millions of peasants were ordered away from
agricultural work to join the iron and steel production workforce. (Great Chinese Famine,
Wikipedia, 2006) These practises led to devastating destroy to most of national production
goods. The absolute productivity and relative proportion of agriculture declined significantly.

10
Most products even could not meet the basic need of society. The substantial increase in
urban labor force resulted in short supply of housing and life's necessities. The birth rate
declined sharply and the death rate increased due to the starvation. Food was in desperate
shortage, and production fell dramatically. The forest was cut excessively and large areas of
farmland were barren. What was worse, China suffered adverse weather conditions such as
droughts and floods in this period. By the end of the Three Years of Natural Disasters, which
was the direct result of the failed Great Leap Forward campaign, an estimated 20 million
people had died from widespread famine (Cultural Revolution, Wikipedia, 2009).
The Cultural Revolution started in 1966 continued the guidelines of “taking steel as the key
link” (Liu XinMin, 2001). During the Cultural Revolution, much economic activity was
halted, with "revolution", regardless of interpretation, being the primary objective of the
country (Cultural Revolution, Wikipedia, 2009). The proportion of primary, secondary and
tertiary industry in GDP changed from 37.3%, 32.3% and 30.4% in 1965 to 28.2%, 31.6%
and 40.2% in 1975 (Liu XinMin, 2001). The development of primary industry declined
seriously. The development of commercial, catering and services industry was suppressed to
the minimum. The political troubles destroyed the production construction, resulting in huge
material losses directly. The pace of economic growth slowed down and the economic
efficiency declined significantly. People still suffered the lack of food and daily necessities.
1.2 First stage: 1978-1984
China’s economy recovered from the most severe setback and biggest loss made by Great
Leap Forward and Cultural Revolution and full-scale country reform was carried out during
this period. The main feature of changes in this stage was that the primary industry got rapid
growth and the proportion of it in GDP increased quickly. Moreover the reform and opening-
up policy started in this period brought new life into China’s economy.
1.2.1 Changes between three industries
The central guidelines in this period were to improve the serious imbalance of property
relations of the national economy that were the excessive development of heavy industry and
11
the seriously lacking growth of primary industry and to reform the outdated economic
system.
The government gave top priority to primary industry and light and textile industry,
promoted the development of infrastructure and basic industry, compressed the scale and
reduced the growth rate of heavy industry. The government also provided policy support of
the distribution of resources to primary industry which led to an increase in agricultural
productivity. All these methods promoted the development of primary industry and greatly
improved the imbalance between industry and agriculture.
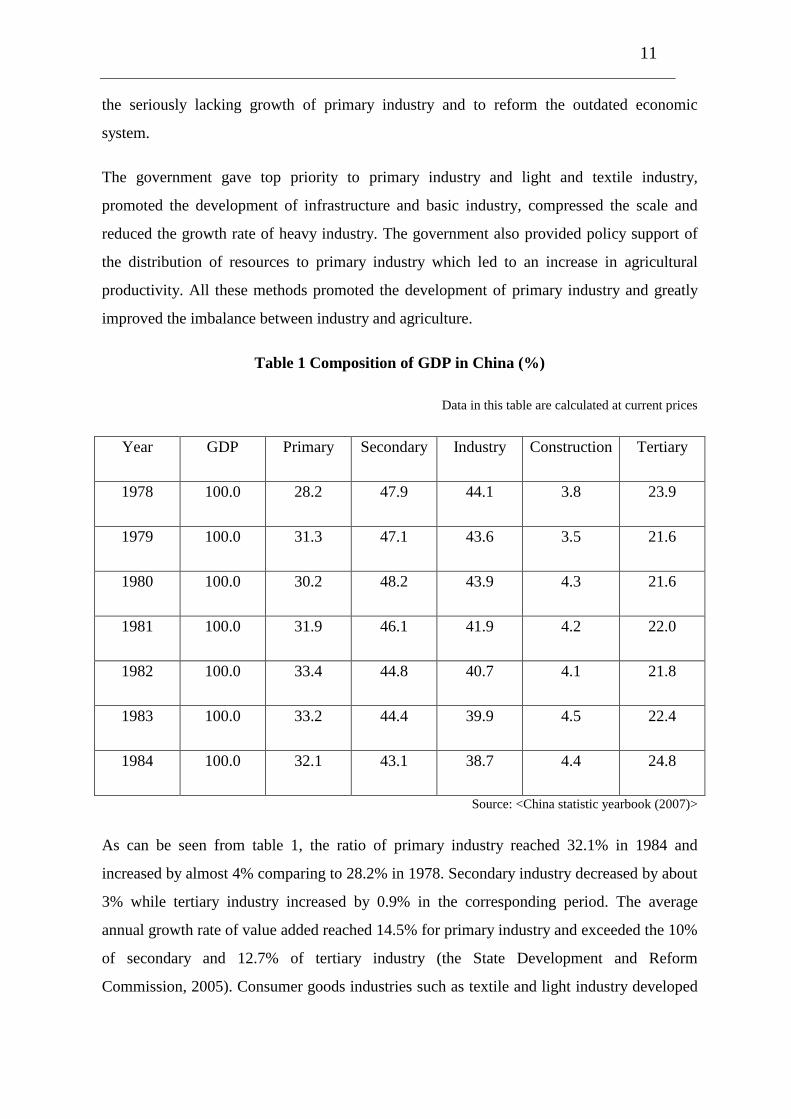
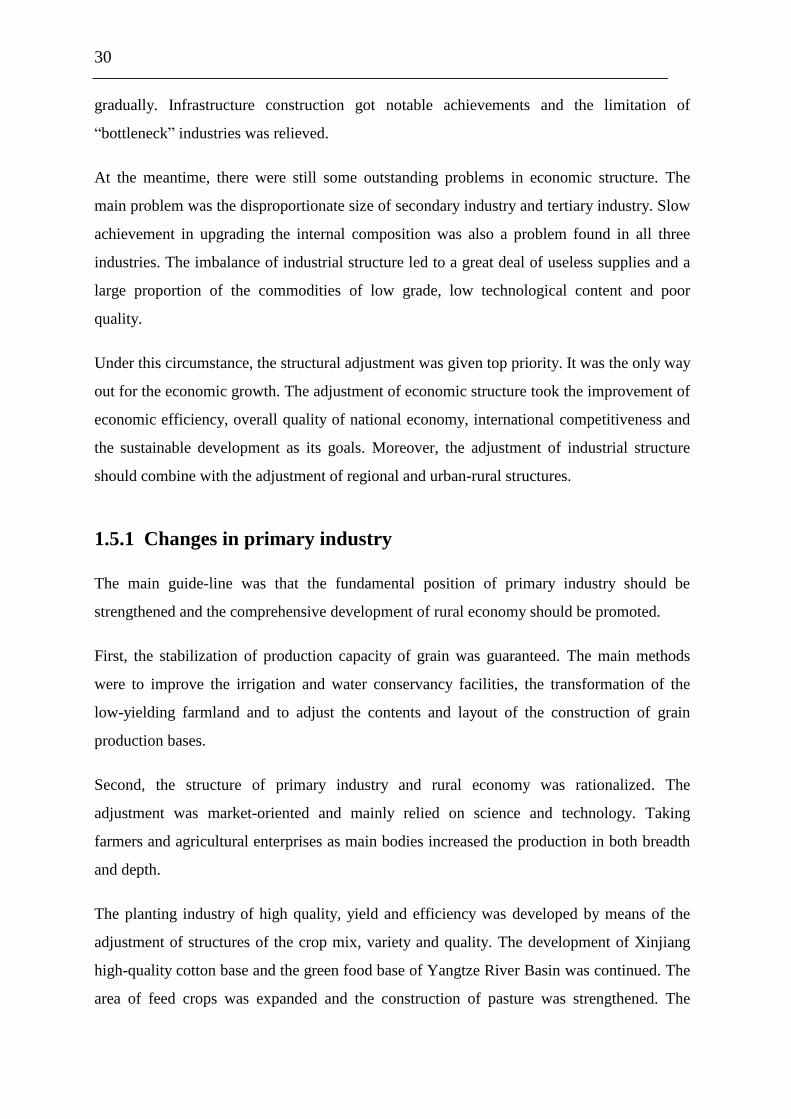
Table 1 Composition of GDP in China (%)
Data in this table are calculated at current prices
Year GDP Primary Secondary Industry Construction Tertiary
1978 100.0 28.2 47.9 44.1 3.8 23.9
1979 100.0 31.3 47.1 43.6 3.5 21.6
1980 100.0 30.2 48.2 43.9 4.3 21.6
1981 100.0 31.9 46.1 41.9 4.2 22.0
1982 100.0 33.4 44.8 40.7 4.1 21.8
1983 100.0 33.2 44.4 39.9 4.5 22.4
1984 100.0 32.1 43.1 38.7 4.4 24.8
Source: <China statistic yearbook (2007)>
As can be seen from table 1, the ratio of primary industry reached 32.1% in 1984 and
increased by almost 4% comparing to 28.2% in 1978. Secondary industry decreased by about
3% while tertiary industry increased by 0.9% in the corresponding period. The average
annual growth rate of value added reached 14.5% for primary industry and exceeded the 10%
of secondary and 12.7% of tertiary industry (the State Development and Reform
Commission, 2005). Consumer goods industries such as textile and light industry developed

12
greatly and the market demand were satisfied during this period. The heavy industry was
under adjustment simultaneously and its ratio decreased a lot.
1.2.2 Internal adjustment
There was also major reforms within agriculture. Before the economic reform crop farming
was always the leader in primary industry and the others developed very slowly because of
the low productivity.
The changes in the internal structure of agriculture became one of the main tasks after 1978.
The government provided funds and policy support to encourage farmers to decrease the
cultivation area of grain crops and increase the area of cash crops and to develop animal
husbandry and fishery actively. The quality of crops varieties was improved. Although the
area of grain crops decreased, the gross grain output increased due to the high growth rate of
yield per mu and high-crops quality. The government also established new law to stop the
excessive cutting and made quota to yearly logging.
0
20
40
60
80
1952 1965 1978 1980 1985
Table 2 The changes of Chinese rural economic structure (%)
mean of crop
farming
mean of
forestry mean of animal husbandry mean of fishery

13
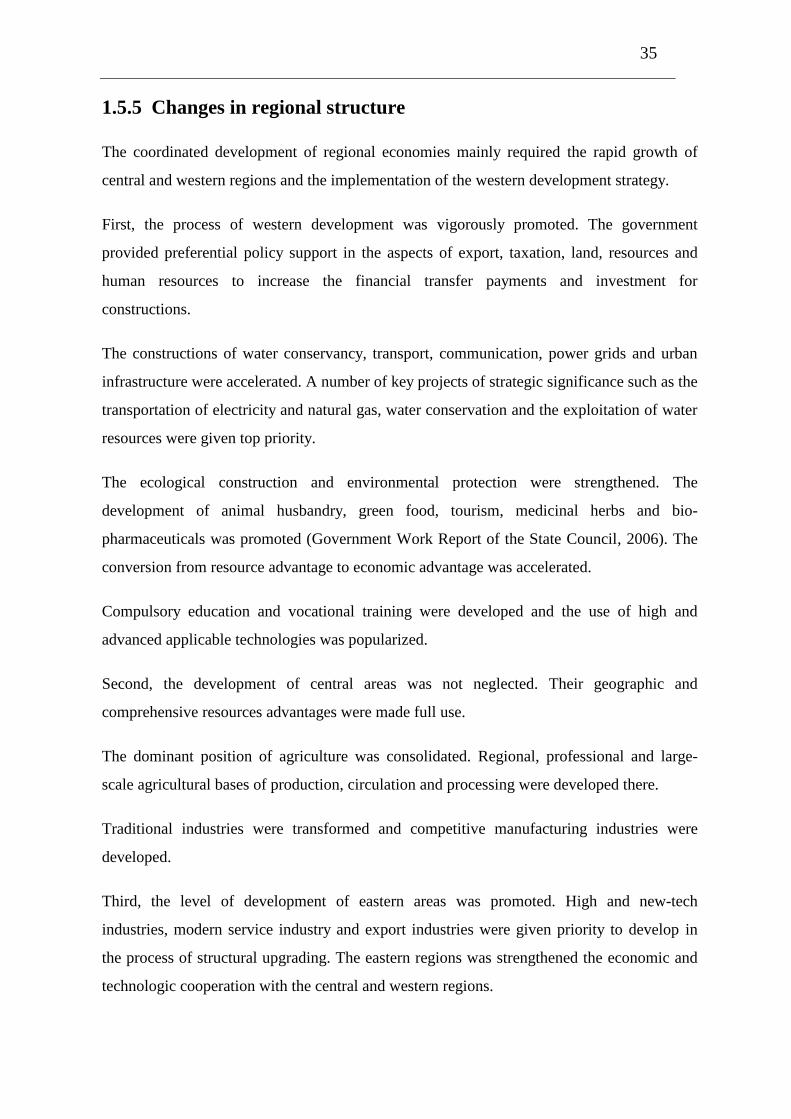
The share of crop farming decreased gradually after 1978 from table 2. The high share of
forestry before 1978 were mainly due to excessive cutting rather than deep processing of
timber and the diversified economy of undergrowth. Such phenomenon was improved
obviously after 1978. Moreover, the share of animal husbandry and fishery increased
progressively.
The changes in agricultural output was the result of the changes in demand and production
structure. Moreover, the relieving of price control on agricultural products was the direct
incentive to drive farmers to change from crop planting to other agricultural industries.
The gross domestic product experienced a great-leap-forward development after the
economic reform. GDP in 1980 was almost twice as much as in 1970 (Government Work
Report of the State Council, 1981). The major role of primary industry in pulling economic
growth was undeniable. However, it was really unusual that the ratio of agriculture increased
so rapidly in the process of industrialization. But it was just to correct the mistake that
primary industry could not get enough development due to the Great Leap Forward and
Cultural Revolution mentioned above. So this situation was compensatory and temporary
and the ratio of agriculture decreased gradually from 1985.
1.2.3 The reform and opening-up policy
The reform and opening-up started in 1978 and referred to the program of economic reforms
called "Socialism with Chinese characteristics". The goal of it was to generate sufficient
surplus value to finance the modernization of the Chinese economy. (Economic reform in the
People's Republic of China, Wikipedia)
The first reform in the late 1970s and early 1980s consisted of opening trade with the outside
world, instituting the household responsibility system in agriculture, by which farmers could
sell their surplus crops on the open market, and the establishment of Town and Village
Enterprises. (Economic reform in the People's Republic of China, Wikipedia) The household
responsibility system in agriculture was that the farmers could keep all their products except
for the quota that should be handed in to the nation. The open market also allowed the free
flow of commodity. All these things mobilized the farmers’ enthusiasm of the production
and improved the people’s standard of living. An open door policy was introduced by which

14
the PRC began to allow international trade and foreign direct investment. These initiatives
immediately increased the standard of living for most of the Chinese population and
generated support for later, more difficult, reforms (Economic reform in the People's
Republic of China, Wikipedia).
The Special Economic Zones were established in ShenZhen, ZhuHai, XiaMen and ShanTou
in 1979. These coastal cities had regional advantages comparing to other inland cities. They
helped to expand foreign trade, attract foreign investment and technology and increase job
opportunities and then drive the development of other inland cities.
1.3 Second stage: 1985-1992
The rapid development of non-agricultural industries was the main result of the adjustment
in this period.
Positive effects were achieved after the adjustment of the first stage. The gross domestic
product in 1985 doubled comparing to that in 1980 (Government Work Report of the State
Council, 1986). Primary and consumer goods industry developed so quickly that people were
provided with adequate food and clothing. However, the main methods in the first stage were
to encourage the concerted development of primary industry and then relieved the stress of
short-comings. The situation of structural imbalance was still serious. Moreover, the
improvement of labor productivity in agriculture released a huge amount of rural labor force.
The contradiction between employment pressure and the insufficient development of tertiary
industry was on the slide (the State Development and Reform Commission, 2005). In view of
this circumstance, the government formulated the seventh five-year plan to proceed with the
improvement of the imbalance and start to pay attention to the upgrading of the industrial
structure.
The reform and opening-up of the late 1980s and early 1990s focused on creating a pricing
system and decreasing the role of the state in resource allocations. This second phase of
reform occurred in the 1980s was aimed at creating market institutions and converting the
economy from an administratively driven command economy to a price driven market
economy. This difficult task of price reform was achieved using the dual-track pricing
system, in which some goods and services were allocated at state controlled prices, while

15
others were allocated at market prices. Over time, the goods allocated at market prices were
increased, until by the early-1990s they included almost all products. In the late 1980s the
Chinese economy was still transitioning steadily, as it moved cautiously away from central
planning and gradually adopted some more of the institutions and mechanisms of a market
economy. (Economic reform in the People's Republic of China, Wikipedia)
1.3.1 Changes in primary industry
In respect of primary industry, its growth would more and more rely on the improvement of
growing environment such as circumstances and soil condition. But this improvement was an
incremental process and this situation would absolutely influence the growth rate of
agriculture. Moreover it was really very abnormal that primary industry occupied such a
heavy proportion in GDP during the process of industrialization. So the central task in this
period was to reduce its share in GDP while keep its gross growth at a steady pace (the State
Development and Reform Commission, 2005).
To promote the development of labor and skill intensive industry was the most important
policy not only in this period but also the subsequentness. Scarce agricultural acreage due to
vast population and limited farmland was China's basic condition and also the starting point
of policy making. In view of this, it was necessary to adjust the relationship between food
supply and trade structure, and promote resources to flow into export-oriented agriculture.
Food pressure was released to a certain extent and great amount of foreign exchange was
gotten by means of exporting labor- and skill-intensive agricultural products such as wheat,
cotton, soybean and so on (reference site: http://www.wenhei.com/docment/1182694).
In consideration of the internal structure of agriculture, the ratio of crop farming still kept the
downtrend. Productions with high price and good economic returns such as fruits, vegetables
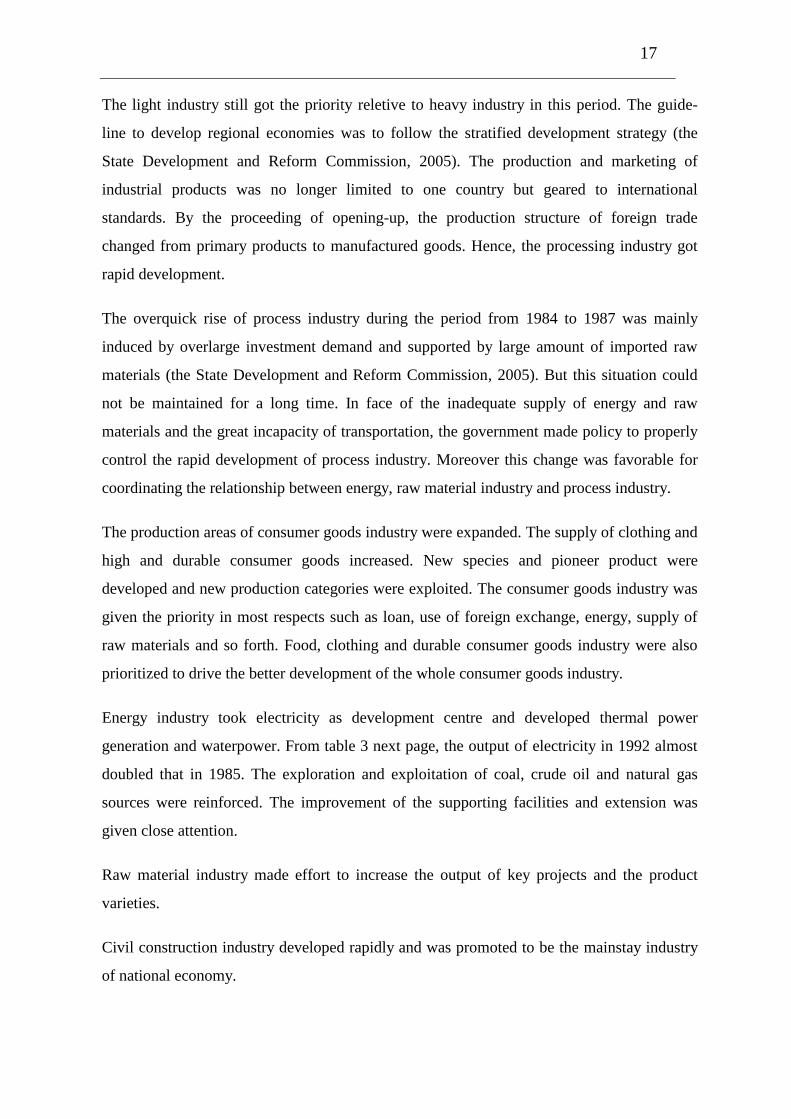
and cotton were extensively cultivated. From table 3, the output of fruits in 1992 doubled
that in 1985. Lots of scientific and technical payoffs, such as fine varieties, plastic mulching
and stylized cultivation, were popularized (Zhou ZhiXiang & Zeng BaoYou, 1995).
The rapid increase of the internal share of husbandry and fishery in primary industry was
closely related to the increase in national income. With the rapid development of national
economy, people’s living standards continued to be improved and the demand for meat and

16
fish expanded significantly. This demand stimulated the development of husbandry and
fishery. At the same time, China’s agricultural products entered national market after
opening-up. The exports of meat and marine products occupied a relatively large proportion
in the export of agricultural products. This was also an important reason for the rapid growth
of husbandry and fishery industries.
Traditional family animal-breeding was changed into commercial husbandry with large
scales gradually. The application of scientific methods such as epidemic prevention and
compound feed obviously increased the amount of productions.
Diversified forestry, not only timber but also undergrowth resources such as potherb,
mushroom and wild animals, was popularized. Afforestation was carried out and the quality
of it was given close attention.
In the aspect of fishery the technique of cultivation and processing of marine, freshwater fish
and shellfish, such as oysters, clams, salmon, and trout were developed (reference site:
http://www.wenhei.com/docment/1182694).
At the end of this stage, the proportion of primary industry in GDP decreased by almost 7%,
from 28.4% in 1985 to 21.8% in 1992. On the contrary, the average annual growth rate of
value added of primary industry achieved about 14.5%. The structural adjustment got some
progress, that was to reduce the share of agriculture in the increase of GDP while keeping its
rapid and rational growth. The reduction in GDP did not mean remaining stagnant. The total
gross output value in 1992 was 908.5 billion RMB, almost triple that of 1985. However, the
basis of primary industry and the capacity to combat natural adversities were still weak and
the peasants’ income increased very slowly. It was really a fundamental structural
contradiction in national economy and would influence every aspects of economic life. (Data
in this paragraph from the National Bureau of Statistics, 2007)
1.3.2 Changes in secondary industry
Inside secondary industry, the main part of structural transformation was from raw material
industry to processing and assembly industry. The processing stage deepened quickly.
17
The light industry still got the priority reletive to heavy industry in this period. The guide-
line to develop regional economies was to follow the stratified development strategy (the
State Development and Reform Commission, 2005). The production and marketing of
industrial products was no longer limited to one country but geared to international
standards. By the proceeding of opening-up, the production structure of foreign trade
changed from primary products to manufactured goods. Hence, the processing industry got
rapid development.
The overquick rise of process industry during the period from 1984 to 1987 was mainly
induced by overlarge investment demand and supported by large amount of imported raw
materials (the State Development and Reform Commission, 2005). But this situation could
not be maintained for a long time. In face of the inadequate supply of energy and raw
materials and the great incapacity of transportation, the government made policy to properly
control the rapid development of process industry. Moreover this change was favorable for
coordinating the relationship between energy, raw material industry and process industry.
The production areas of consumer goods industry were expanded. The supply of clothing and
high and durable consumer goods increased. New species and pioneer product were
developed and new production categories were exploited. The consumer goods industry was
given the priority in most respects such as loan, use of foreign exchange, energy, supply of
raw materials and so forth. Food, clothing and durable consumer goods industry were also
prioritized to drive the better development of the whole consumer goods industry.
Energy industry took electricity as development centre and developed thermal power
generation and waterpower. From table 3 next page, the output of electricity in 1992 almost
doubled that in 1985. The exploration and exploitation of coal, crude oil and natural gas
sources were reinforced. The improvement of the supporting facilities and extension was
given close attention.
Raw material industry made effort to increase the output of key projects and the product
varieties.
Civil construction industry developed rapidly and was promoted to be the mainstay industry
of national economy.
18
The construction of railway, highway, water transport and air transport also developed
quickly. Under this consideration, motor industry was made to be one of the important
mainstay industries.
At the end of this stage, the ratio of secondary industry in GDP increased by 0.5%, from
42.9% in 1985 to 43.4% in 1992. The average annual growth rate of value added was 17% in
1992. But the situation of the similarity of regional structure did not get enough
improvement. The poor economic benefit also could not be completely improved. (Data in
this paragraph from the National Bureau of Statistics, 2007)
Table 3 Per Capita Output of Major Industrial and Agricultural Products (kg)
Year Grain Cotton Fruits Coal(ton) Crude oil Electricity(kwh) Crude steel
1985 360.70 3.94 11.07 0.83 118.83 390.76 44.52
1986 367.00 3.32 12.63 0.84 122.51 421.36 48.93
1987 371.74 3.92 15.39 0.86 123.74 458.75 51.92
1988 357.72 3.77 15.12 0.89 124.41 494.90 53.95
1989 364.32 3.39 16.38 0.94 123.04 522.78 55.05
1990 393.10 3.97 16.51 0.95 121.84 547.22 58.45
1991 378.26 4.93 18.91 0.94 122.52 588.77 61.70
1992 379.97 3.87 20.95 0.96 121.97 647.18 69.47
Source: <China statistic yearbook (2007)>
1.3.3 Changes in tertiary industry
The quantity of employment and total output value of tertiary industry increased to some
extent after 1949. But the process was tortuous. The ratio of tertiary industry in GDP was
28% in 1952 but decreased to 24.8% in 1984. Its quantity of employment was only 16.1% in
the total employment in 1984. The main problems of tertiary industry at that time were the

19
slow increment speed, poor economic benefit and management. (Data in this paragraph from
the National Bureau of Statistics, 2007)
The reasons for these were various. The most important reason was the low labor
productivity and development level of primary and secondary industry since only a gradual
increase of labor productivity could bring more labor force to tertiary industry. Moreover, the
rapid development of primary and secondary industry could promote the process of
socialization of production and consumption level. Second, there was great imbalance
between different regions such as the coastal and the inland cities. Third, internal industrial
imbalance was also very serious. The development was mostly limited to traditional business
such as catering trade and service industry. New-style industries such as insurance, advisory,
advertisement and tourism had barely started.
As for the regional imbalance, the most important method was to take actions that suited
local circumstances. The infrastructure in big cities was improved to relieve traffic
congestion and improve the service facilities. For rural areas, township enterprises were
induced to change their economic and production patterns to achieve the coordinated
development of sideline and tertiary industry. Township tertiary industry such as rural
commerce, transportation, post and telecommunications, catering service and other service
industries was developed actively. (Li JiangFan & Zeng GuoJun, 2003). All regions made
characteristic policy on the basis of their practical situations.
The government gave priority to transportation and communication. The transport structure
was improved. The rational distribution of different mode of transport helped to improve its
efficiency and quality. The focus points of communication were to increase the delivery
value of traditional branch for fixing telephone and enhance the exploitation of modern
communications technology such as communication and broadcast satellites.
The development of education and training started to get attention. Professional classes and
hierarchy were under adjustment. Professional technical training was made chief component
of modern educational system. All these provided tertiary industry with numerous high-
quality specialized talents.
New industry was highly valued during this period. It developed vigorously and affected by
world new technological revolution. In face of the coming of information age, new industries

20
such as information technology, advisory and advertisement would become mainstay
industries in tertiary industry. Hence, the government made great efforts to develop these
industries while improving the lagging situation of traditional tertiary industries.
At the end of this stage, the share of the tertiary industry in GDP increased from 28% to 34%
and hit an all-time high. The average annual growth rate of value added was up to 20%. The
quantity of employment was increased by 34 million. The total employment almost exceeded
that of secondary industry until 1992. From table 4, the ratio of real estate and financial
intermediation experienced a rapid increase of 3.5% and 3.9% respectively during these eight
years although the share of wholesales and retailed trades decreased by 5.3%. All in all, large
amount of labor force transferred into tertiary industry and it got a great development.
However, this rapid growth was also with the characteristics of compensating under-
development and adjusting property relation. (Data in this paragraph from the National
Bureau of Statistics, 2007)
0
10
20
30
1985 1986 1987 1988 1989 1990 1991 1992
Table 4 Composition of Value-added of the Tertiary Industry (%)
Transport, storage and post Wholesales and retailed trades Hotels and catering services Financial intermediation Real
estate

21
1.4 Third stage: 1993-2000
The dominant position of secondary industry was reestablished and strengthened in this
stage. The notable feature of this period was that the ratio of secondary industry increased
rapidly with the strengthening of the construction of infrastructures such as energy,
transportation and communication (the State Development and Reform Commission, 2005).
Macro-control task that inhibited inflation and achieved overall balance was fulfilled
basically after the previous economic reform. And the economic operation showed a good
posture of high growth and low inflation.
However, structural contradiction in economic life especially the contradiction of industrial
structure appeared relatively. First, the basis of agriculture was still weak and peasants’
income increased very slowly. This was a fundamental structural contradiction in national
economy. On the one hand, the situation of increasing output without increasing income was
still widespread with the rising cost of production and low labor productivity. On the other
hand, peasants’ capacity to expand the purchasing power of consumer goods and capital
goods was restricted by the low income. Second, the problem of the underdevelopment of
infrastructure still existed. The infrastructure with regard to water supply, electricity supply,
transport especially the urban and long-distance traffics and telecommunication were far
from perfection. For example, the north and northwest areas suffered severe water shortage.
The transformation task of power grid was on the agenda for the load increase and the
popularity of electric appliances. Third, the quality and benefit level of the processing
industry were quite low and market effective demand was insufficient. Fourth, the
development of tertiary industry was comparatively lagging behind. China was one of the
few countries with quite low proportion of tertiary industry and the ratio of value added of
tertiary industry in GDP was only about 30% at that time (the State Development and
Reform Commission, 2005).
The reasons for these problems were various. For one thing, the comparative shortages of
resources like farmland and water and the serious surplus of labor force were the crux of
contradiction of primary industry. For another, farmers’ low income was the root cause of the
contradiction between high ability of secondary industry to supply and insufficient demand.

22
The reform and opening-up of the late 1990s focused on closing unprofitable enterprises and
dealing with insolvency in the banking system. The transition to a market based system in the
early 1990s created two major problems. First the end of central planning required the
creation of mechanisms to set monetary policy, and a system of banking and capital markets.
Work was done throughout the 1990s to put these systems in place. Another problem
involved that of state owned enterprises. Under a system of fixed prices, the inputs and
output prices of SOE's were fixed, allowing them to use the difference to fund social
services. Once input and output prices were market based, most of the SOE's then became
extremely unprofitable, both because they were responsible for social service provision to
their employees and because they were producing outputs that no one wanted to buy. This
was temporarily resolved by borrowing from the banking system, but this created the
problem of massive non-performing loans. In the late 1990s and early 2000s, this problem
was dealt with by the closing of unprofitable state-owned factories and the development of
social security systems. (Economic reform in the People's Republic of China, Wikipedia)
1.4.1 Changes in primary industry
The focal point of adjusting and upgrading China’s industrial structure was issues concerning
rural economy, agriculture and farmers. The basis of primary industry was weakest
comparing to the other two industries. It was also most risky and lowest comparative
advantage and should be regarded as the primacy of economic works. The fundamental
solution to expand the market for industrial goods was to develop rural economy and
increase the farmers’ income. Moreover, the demand for the construction of infrastructure,
public utilities, business, service trade, culture, health and sports would become the strong
driving force of national economic development with the elimination of the gap between
urban and rural areas. The development of these industries would also promote the
improvement of technology thus produce more national wealth.
The adopted method of the adjustment of primary industry was to develop industrialized
agriculture, which was to form the economic mechanism with the combination and mutual
promotion of production, process and sales. The close combination of agriculture, processing
and circulation would fundamentally change the disadvantage of agriculture. It helped to
promote the process of commercialization, specialization and modernization of agriculture.
23
The government also made it a policy to develop the construction of small towns. It was the
combining site of the economic structural adjustment of urban and rural areas. And its rapid
development was a great help to the process of village urbanization.
The construction of agricultural infrastructure and environment were enhanced. The main
methods were to speed up forestry planting, to conserve the water and soil of the middle and
upper reaches of great rivers and to enhance the watershed management.
The greater and better yields should be developed actively on the basis of keeping steady
increase of production.
At the end of this stage, the ratio of primary industry in GDP decreased by 4.6%, from 19.7%
in 1993 to 15.1% in 2000. Its employment share was almost 50% which was still too high.
(Data in this paragraph from the National Bureau of Statistics, 2007)
1.4.2 Construction of infrastructure
The government made policy to proceed with the construction of infrastructure of energy,
transport and communication. The infrastructure construction of information was also given
special attention from the beginning of 1990s. The development of these infrastructures was
the main basis of the improvement of comprehensive national strength and an important
mark of uptodateness.
The reasons that took the infrastructure construction as the driving force of economic growth
were as follows. For one thing, it had a strong demand-oriented role in the development of
manufacturing and construction industry. For another, its improvement was the essential
condition of the development of a good many of industries. For example, the highway was
the requirement of the development of motor manufacturing and so was the air bus to the
transnational tourism. Even the high and new technology such as electric mechanism, new
material and new energy could be used synthetically in this area.
The constructions of power facilities were to strengthen the improvement of power grids, to
lower grid loss, to improve the security and economical efficiency of grid motion, to
eliminate gradually the small generating sets of high energy consumption and pollution and
to exploit the high-power generating sets.

24
The constructions of transport were to quicken the construction and transformation of
existing railway, to construct a set of new ports and transform several old ports, to develop
the river navigation and coastal and ocean trade and to open up new air routes. To enhance
the construction of post and communication, new technologies such as satellites, optical
cable and cell-type were adopted to construct a communication network that can connect
home and abroad. From table 5, the infrastructure construction in transport and
communication especially in civil aviation and cable lines got great increase.
As to the water conservancy construction, the government tried their best to enhance the
comprehensive control of great rivers and lakes such as Huaihe River and Taihu Lake and to
seize the Yellow River Xiaolangdi hydro-junction and the South-to-North water diversion
project construction.
Table 5 The infrastructure construction of transport and communication (1000km)
Year Length of
railways
Length of
highways
Length of
navigable inland
waterways
Length of civil
aviation routes
Length of long
distance optical
cable lines
1993 58.6 1083.5 110.2 960.8 38.7
1994 59.0 1117.8 102.7 1045.6 73.3
1995 59.7 1157.0 110.6 1129.0 106.9
1996 64.9 1185.8 110.8 1166.5 130.2
1997 66.0 1226.4 109.8 1425.0 150.8
1998 66.4 1278.5 110.3 1505.8 194.1
1999 67.4 1351.7 116.5 1522.2 239.7
2000 68.7 1402.7 119.3 1502.9 286.6
Source: <China statistic yearbook (2007)>
The demands of electricity, haulage vehicle, building materials, steel, petrochemicals and
construction business were induced by the development of the infrastructure construction of

25
energy, transport and communication. And this development reached its best level during the
period of ninth five-year plan that was from 1995 to 2000. Moreover, this development and
the resulting growth of manufacturing such as electrics, mechanism, petrochemicals and
building materials were one of the chief growth poles of China’s economy (Government
work report of the State Council, 2001).
1.4.3 Changes in secondary industry
The economic growth in this period was obviously with the characteristic of taking
secondary industry as the leading industry. The goods structure of foreign trade continued
upgrading. That were changing from rough processing and low value-added products to deep
processing and high value-added products. Hence, industrial departments such as electricity
(basic energy industry), steel, machinery, motor, shipbuilding, chemical, electronics, building
materials and so on became the main driving force of national economic development.
The immanent cause of this situation was that the prominent restriction of long-standing
underdevelopment of energy, transport and communication industries. The improvement of
these “bottleneck” industries after previous development correspondingly drove the growth
of secondary industry (the State Development and Reform Commission, 2005).
The production capacity of the principal industrial products had already been very great. But
generally speaking, a series of problems such as low technical merit, quality, scale merit, less
competitive power and heavy pollution still existed. The root way out was carrying out
technical reform, technological innovation and structural adjustment of business
organizations to adjust and upgrade the product mix of industry segments.
The most impactive aspects to national economic development were as follows: to decrease
the energy, raw materials and water consumption of products by the extensive use of new
skills and crafts, to improve the quality of productions and decrease their costs to make them
more competitive in the international market by means of applying new technology and
expanding economics of scale, to exploit products with advanced international standards
through technique acquisition and innovation.
With the improvement of the level of per capital income, residents’ demand for durable
comsumer goods increased gradually. This demand drove the rapid growth of mechanical
26
and electronics industries. At the same time, the investment in infrastracture construction
also drove the development of basic industry. The trend of heavy industrialization reoccured.
As to energy industry, the guidelines of attaching equal importance to development and
economy were carried out. For coal industry, the methods were to transform the old mines of
eastern part and exploit the resources of middle and western parts. The guide-line for oil
industry was to steady the eastern part and develop the western part while for raw materials
industry was to improve the product quality and increase the varieties.
For the processing industry, the problems of high cost and less competitive power due to
small scale, excessive consumption and large amount of employment were still very serious.
And the direction of adjustment included the following aspects.
First, food, textile, light and pharmaceutical industry developed and produced marketable
industrial consumer goods in view of the diversified consumer demand. The products should
fit in with the different hierarchy of consumptions.
Second, the development of mainstay and market-oriented industries such as mechanical,
electronics, petrochemical, and car-manufacturing industry mainly relied on the formation of
economic scale and the improvement of economic benefit. The capacity of independent
exploitation and innovation was strengthened at the meantime of the introduction of
advanced technology.
Third, the adaptation to the diversified international market promoted the capacity of the
products of electronic, mechanical, light and textile industry to earn foreign exchange
through export. The export strategy for light and textile products was to increase the export
of high-tech and high-quality products and avoid the trade friction in single market. The
electronics and mechanical products also took methods to expand the export of complete
plants.
Fourth, the development of the products of heavy and chemical industry and light and raw
materials industry made a great impression on the adjusting and upgrading of China’s
industrial structure. These products including large scale complete equipments, precision
machinery, synthetic materials, organic chemical materials, pulp and so on were broad-

27
spectrum and in huge request. But the production capacity was insufficient. It was promising
to change this situation by means of the rebuilding and extension of existing enterprises.
Fifth, the production capacity of raw materials industry such as cement, iron and steel was
sufficient at that time. The key problem was that the variety structure was unreasonable. The
guide-line for improving the product structure of raw materials was to focus on decreasing
consumption, improving quality and increasing varieties.
Sixth, the high-tech industries should develop according to the need of market. The first
imperative in this period was to develop a series of products that was urgently needed and
within the production capacity in the areas of electronic information, new materials,
bioengineering, new energy, environmental protection and aerospace.
At the end of this period, the ratio of secondary industry in GDP was 45.9% and the share of
employment was 22.5% in the total employment (China statistic yearbook, 2007). From table
6, the ratio of heavy industry always kept downtrend until 1999. After that, its ratio increase
sharply due to the development of deep processing and high value-added industry. The great
growth of heavy industry in this stage changed the situation that its increase had been always
40
45
50
55
60
1992 1994 1996 1998 2000 year
Light industry Heavy industry
Table 6 The ratio of heavy and light industry in GDP (%)

28
less than that of light industry since the beginning of 1980s. Although most products were
oversupply and their production capacity could not be made full use, the level of per capita
output was still very low. Another outstanding structural contradiction of the national
economy was the imbalance of the current production capacity and the achievable effective
demand. China’s industrial products market had great potential in the long run. So the
insistent task at that time was to make efforts to tap market potential.
1.4.4 Changes in tertiary industry
Tertiary industry was the main channel of employment and the new entrants to labor force
was 6180 thousand persons in 2000. However, the ratio of value added of tertiary industry in
GDP was only about 30% (China statistic yearbook, 2007). The increase of created value
was not quick enough and the raised extent of ratio was not very big.
The underdevelopment of the infrastructure was one reason of the low proportion of tertiary
industry. But the most fundamental reason was the inconsistency between the level of
urbanization and economic development.
The development of tertiary industry was based on the growth of primary and secondary
industry. These industries provided tertiary industry with funds and related industries and the
improvement of their productivity could provided tertiary industry with more employment
and resources. Rational arrangement and structure should be built. And its tasks differed
between urban and rural areas.
In the urban areas, the development of business and catering service industry was preceeded.
The entertainment and body-building industry that could employ the spare time such as
tourism, culture and sports were emphasized. The information service industry that made
good use of modern information technology was exploited effectively. The consulting
service industry was divided into several segments that provided professional knowledge
such as law, technique, financial affairs, investment and so on. Policies were also made to
make sure the standard and sound development of finance, insurance and real estate industry.
In the rural areas, policies were made according to their local circumstances and combined
with the industrialization of agriculture and the construction of small towns. Tertiary industry

29
that met the farmers’ need such as commercial circulation, transport, catering service
industry and so forth was put great emphasis on their sustained and rapid development.
At the end of this stage, the ratio of employment of tertiary industry in total employment was
27.5%. The ratio of it in GDP was up to 39% in 2000 and hit a record high ever since 1978
(China statistic yearbook, 2007).
1.4.5 Changes in regional economic structure
.New change took place during this period. The Special Economic Zones were a good way to
make full use of regional advantages but it also could bring regional development gap. The
eastern and coastal areas proceeded with their development while the western areas kept the
same pace with the countryside development. The speed of the development of central areas
even exceeded the average growth speed of the whole nation (the State Development and
Reform Commission, 2005).
The reason for this situation was that policies were made to promote the rational arrangement
and coordinated development of regional economic structure. All regions took actions
according to their local circumstances under nation-wide unified planning. The constructions
of infrastructure and resources development in central and western areas were given top-
priority. There was also policy support to these areas. This trend was going to continue and
the regional structure would be improved gradually.
1.5 Fourth stage: 2001-2005
The tenth five-year plan was carried out in this period and it was the most important period
for the strategic adjustment of economic structure.
Positive results were achieved after previous structural reforms. The situation of shortage of
major agricultural products completely changed and the supply of them achieved total basic
balance. The high-tech industries such as information industry grew rapidly. The elimination
of backward industries and reduction to production capacity of excess industries got
successful progresses. Tertiary industry continued to develop and its employment increased
30
gradually. Infrastructure construction got notable achievements and the limitation of
“bottleneck” industries was relieved.
At the meantime, there were still some outstanding problems in economic structure. The
main problem was the disproportionate size of secondary industry and tertiary industry. Slow
achievement in upgrading the internal composition was also a problem found in all three
industries. The imbalance of industrial structure led to a great deal of useless supplies and a
large proportion of the commodities of low grade, low technological content and poor
quality.
Under this circumstance, the structural adjustment was given top priority. It was the only way
out for the economic growth. The adjustment of economic structure took the improvement of
economic efficiency, overall quality of national economy, international competitiveness and
the sustainable development as its goals. Moreover, the adjustment of industrial structure
should combine with the adjustment of regional and urban-rural structures.
1.5.1 Changes in primary industry
The main guide-line was that the fundamental position of primary industry should be
strengthened and the comprehensive development of rural economy should be promoted.
First, the stabilization of production capacity of grain was guaranteed. The main methods
were to improve the irrigation and water conservancy facilities, the transformation of the
low-yielding farmland and to adjust the contents and layout of the construction of grain
production bases.
Second, the structure of primary industry and rural economy was rationalized. The
adjustment was market-oriented and mainly relied on science and technology. Taking
farmers and agricultural enterprises as main bodies increased the production in both breadth
and depth.
The planting industry of high quality, yield and efficiency was developed by means of the
adjustment of structures of the crop mix, variety and quality. The development of Xinjiang
high-quality cotton base and the green food base of Yangtze River Basin was continued. The
area of feed crops was expanded and the construction of pasture was strengthened. The

31
development of animal husbandry was accelerated through the improving of animal varieties.
The ecological protection of fishery resources and fishing waster was enhanced and
aquaculture and offshore fishing were developed actively.
The layout of agricultural production area was adjusted and the production pattern of large-
scale and specialization was developed.
The coordination, services and policy support to the export of agricultural productions were
strengthened and the agricultural sectors that could earn more foreign exchange were
developed vigorously.
The introduction and development of the processing technology and equipments of
agricultural products were speeded up. The industries such as marketing, storage, transport
and preservation of products were developed. The level and efficiency of processing were
improved.
The services for agricultural socialization were developed comprehensively by means of
encouraging the innovation of agricultural services organization and cultivating brokers.
The constructions of system of agricultural quality standard, inspection and testing of
products quality and market information were strengthened. The formulation and revision of
agricultural industrial standards and quality standards of important products were speeded
up. Standardized agricultural production bases were created under the guide of international
standards.
The government also supported and guided the structural adjustment, technological progress
and system innovation of township enterprises to achieve their rapid and healthy
development.
Third, industrial management of agriculture was an important way to promote the process of
agricultural modernization. The methods were as follows: to support the processing and
marketing enterprises and scientific research units of agricultural products to guide farmers
to enter the market, to provide the policies of fiscal, taxation and credit to support a series of
leading enterprises to speed up their growth (Government Work Report of the State Council,
2006).

32
Fourth, China’s accession to the WTO in 2001 brought great influence to the agricultural
development. The tariff reduction increased the price competitiveness of the imported
products. The prices got cheaper then decreased farmers’ income. On the other hand, the
elimination of trade barriers was in favor of exporting agricultural products. Hence, the
market- and export- oriented agricultural products such as wheat, cotton, vegetables, high-
quality fruits and flowers were large-scale cultivated. The accession also brought vast
investment to develop rural economy and increase job opportunities.
1.5.2 Changes in secondary industry
The overall quality and international competitiveness of China’s secondary industry, which
was market-oriented and took enterprises as the main bodies, were improved by the
technological development. Industrial reorganization and transformation must follow the
rules of market economy that was, guiding the direction of investment correctly, relying on
the existing foundation and preventing blind expansion of the scale and redundant
construction (the State Development and Reform Commission, 2005). The combination of
advanced technology and applicable technology relied on the combination of the introduction
of new technology and its innovation. The transformation and upgrading of traditional
industries were strengthened and the comparative advantages of labor-intensive industries
got further development. And new comparative advantages were developed by the active
growth of high-tech and new industries. The great development of social production capacity
was gained by the stimulation of information to industrialization.
Moreover, the accession to the WTO brought chanllenges to China’s secondary industry
especially the mechanical industry. China’smechanical industry was low-scale-merit, low
quality, poor level of technology and equipment and unperfect marketing and after-sale
service system. The tariff reduction and the principles of non-discriminatory and fair trade
were in favor of expanding export and attracting foreign investment and new technology. On
the other hand, the tariff reduction and cancellation of non-tariff barriers impacted special
mechanical products such as petrochemical industry severely. They also brought pressures of
foreign competition. Hence, it was necessary to improve productivity, the technological
level, the quality of the products and enhance the ability of substitutes for imported goods.

33
Firstly, the process of its transformation and reorganization and the upgrading of industrial
structure were speeded up by means of increasing variety, improving products quality, saving
energy, preventing pollution and raising labor productivity. The upgrading of products
structure mainly relied on the improvement of the capacity of exploitation and further
processing.
The products of raw materials industry such as plastics, synthetic rubber, synthetic, stainless
steel, cold-rolled plates, alumina, highly efficient chemical fertilizers and pharmaceuticals
were developed actively.
As to light and textile industry, the products of high market demand such as pulp, high-grade
paper, paperboard, new household appliances, differentiated fibers, high-class fabrics, well-
known brand clothing and processing agricultural products got positive development (the
State Development and Reform Commission, 2005).
For the construction industry, methods were as follows: to improve the level of design,
construction and supervision, to rectify and standardize the construction market, to ensure
the quality of projects and to popularize the use of new building materials.
Secondly, the development of high-tech industries was promoted. These industries such as
information technology, biological engineering and new materials were exploited on the
basis of actual situation.
The development of manufacturing industry of information products was accelerated by the
improvement of capacity of self-exploitation and system integration. Software industry also
got positive development and the infrastructure construction of information industries was
strengthened.
Digital and network technology were popularized in the aspects of technology exploitation of
enterprises, marketing, public services and administration to achieve the combination of
industrialization and information.
Thirdly, the organization structure of enterprises was upgraded. The pattern of moderate
concentration within the industry, full competition among enterprises, taking large
enterprises as dominants and coordinated development of medium and small enterprises was
established by the guidance of the principle of specialized division of labor and cooperation

34
and market mechanism and macro-control (Government Work Report of the State Council,
2006).
Fourthly, the structural adjustment to the old industry bases was promoted. The upgrading of
the industrial structure, the organization structure of enterprises and regional distribution
took full use of their advantages of strong foundation and pooling talents. The alternative
industries of cities and mining areas which mainly relied on resources exploitation were
developed according to local conditions.
1.5.3 Changes in tertiary industry
The rapid growth of tertiary industry was an important way to promote the upgrading of
structure and increase employment. The development of modern service industry such as
information, finance, accounting, consulting and legal service promoted the overall level of
service industry. The quality and efficiency of traditional service industries such as
commerce, transportation and municipal service were transformed by the use of modern
management methods and service technology. The content of service was increased. The
industries that were highly needed by citizens such as real estate, community service,
tourism, catering, entertainment and fitness were vigorously developed.
1.5.4 The infrastructure construction
First, water conservancy projects were strengthened. At the meantime of strengthening the
flood control and disaster mitigation the problems of water shortage and pollution were also
given prominent attention. The overall planning of national water conservancy and the
watershed planning of large rivers were formulated and implemented scientifically.
Second, integrated transport system was established.
Third, the energy structure was upgraded by the full use of resource advantages, the
improvement of implement efficiency and the strengthening of environmental protection.
35
1.5.5 Changes in regional structure
The coordinated development of regional economies mainly required the rapid growth of
central and western regions and the implementation of the western development strategy.
First, the process of western development was vigorously promoted. The government
provided preferential policy support in the aspects of export, taxation, land, resources and
human resources to increase the financial transfer payments and investment for
constructions.
The constructions of water conservancy, transport, communication, power grids and urban
infrastructure were accelerated. A number of key projects of strategic significance such as the
transportation of electricity and natural gas, water conservation and the exploitation of water
resources were given top priority.
The ecological construction and environmental protection were strengthened. The
development of animal husbandry, green food, tourism, medicinal herbs and bio-
pharmaceuticals was promoted (Government Work Report of the State Council, 2006). The
conversion from resource advantage to economic advantage was accelerated.
Compulsory education and vocational training were developed and the use of high and
advanced applicable technologies was popularized.
Second, the development of central areas was not neglected. Their geographic and
comprehensive resources advantages were made full use.
The dominant position of agriculture was consolidated. Regional, professional and large-
scale agricultural bases of production, circulation and processing were developed there.
Traditional industries were transformed and competitive manufacturing industries were
developed.
Third, the level of development of eastern areas was promoted. High and new-tech
industries, modern service industry and export industries were given priority to develop in
the process of structural upgrading. The eastern regions was strengthened the economic and
technologic cooperation with the central and western regions.
36
81
0
incre
ase
rate
10
00
01
20
00
14
00
01
60
00
18
00
0
bill
ion
yu
an
2001 2002 2003 2004 2005year...
GDP increaserate
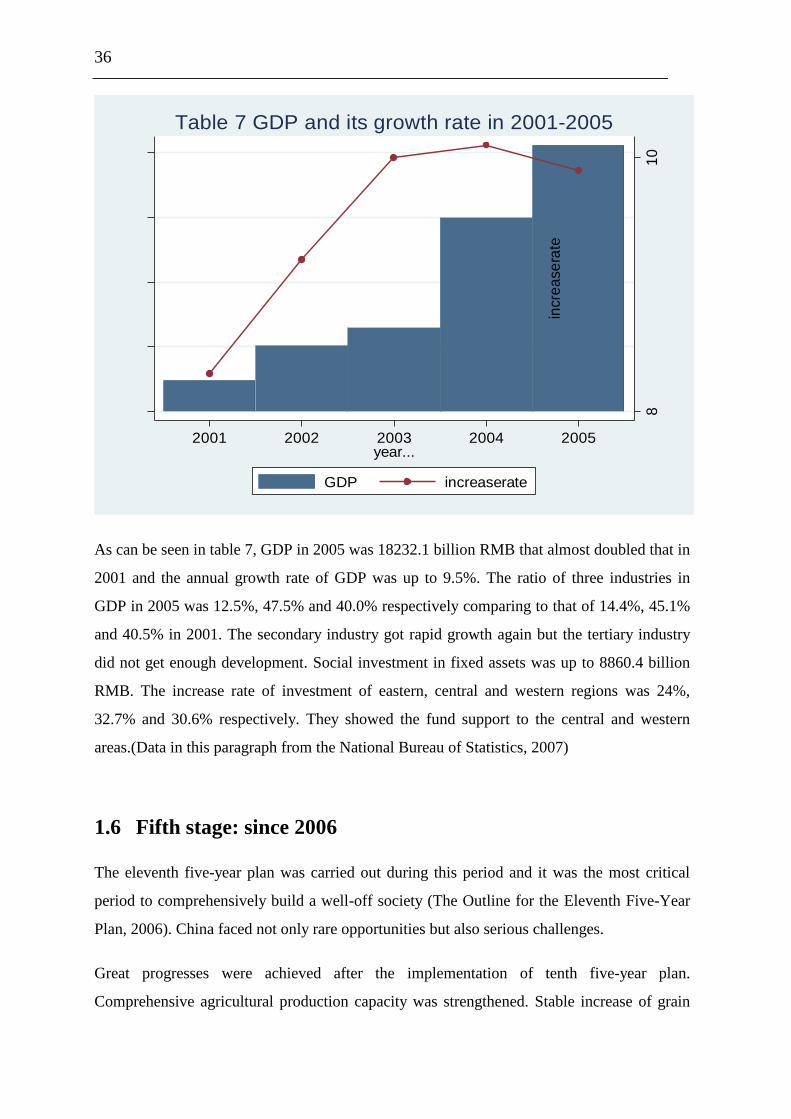
Table 7 GDP and its growth rate in 2001-2005
As can be seen in table 7, GDP in 2005 was 18232.1 billion RMB that almost doubled that in
2001 and the annual growth rate of GDP was up to 9.5%. The ratio of three industries in
GDP in 2005 was 12.5%, 47.5% and 40.0% respectively comparing to that of 14.4%, 45.1%
and 40.5% in 2001. The secondary industry got rapid growth again but the tertiary industry
did not get enough development. Social investment in fixed assets was up to 8860.4 billion
RMB. The increase rate of investment of eastern, central and western regions was 24%,
32.7% and 30.6% respectively. They showed the fund support to the central and western
areas.(Data in this paragraph from the National Bureau of Statistics, 2007)
1.6 Fifth stage: since 2006
The eleventh five-year plan was carried out during this period and it was the most critical
period to comprehensively build a well-off society (The Outline for the Eleventh Five-Year
Plan, 2006). China faced not only rare opportunities but also serious challenges.
Great progresses were achieved after the implementation of tenth five-year plan.
Comprehensive agricultural production capacity was strengthened. Stable increase of grain

37
output and farmers’ income laid foundation for the stable and rapid development of economy
and society. Development planning and industrial policies of energy, important raw materials
and equipment manufacturing industries were formulated and implemented. Backward
production capacities which were of high energy consumption and high pollution were
eliminated.
At the meantime, many difficulties and problems still existed in the economic and social life.
Some long-term accumulated and deep-seated contradictions were not fundamentally solved.
There were also a number of new issues that could not be ignored. The resources such as
farmland, freshwater, energy and important mineral resources were not enough relatively.
The ecological environment was weak and the economic structure was irrational. Some
industries were of over production capacity due to blind expansion. The transformation of
economic growth mode was too slow. The consumption of energy and resources was
excessive and the environmental pollution became worse.
1.6.1 Building a new socialist countryside
The main policies here were to take the development of comprehensive agricultural
production capacity as the primary task, to change the growth mode and to strengthen its
fundamental position.
First, industrial structure of primary industry was upgraded. The proportion of aquaculture
industry was increased at the meantime of the stable growth of the output of grain, cotton and
oil. The development of animal husbandry and dairy industry was accelerated and their scale,
intensive and standardized level were improved. Economic forest and flower industry
developed on the basis of local situations. The intensity of fishing was strictly controlled.
Second, the products structure of primary industry was upgraded. The direction of the
development of agricultural products were high-yield, high-quality, efficient, ecology and
safe. Those were high-quality grain varieties, aquatic products, high-efficiency economic
crops and livestock products.
Third, the regional pattern of primary industry was upgraded. The comprehensive capacity of
grain production of Huanghuaihai plain, middle and lower reaches of the Yangtze River and

38
northeast plains was improved. Industrial zones of economic crops were built in the regions
of suitable climate. Water-saving agriculture was developed in dry areas.
1.6.2 Promoting the optimization and upgrading of industrial
structure
The main requirements of new-style industrialization were to adjust the production structure,
the organizational structure of enterprises and industrial layout so that the overall technical
level and competitiveness could be improved (the State Development and Reform
Commission, 2005).
First, the development of high-tech industries was speeded up. The focus of high-tech
industries was changing from processing and assembly to independent research and
development according to the requirement of industrial concentration, scale development and
the expansion of international cooperation. A number of leading industries with core
competitiveness and multinational high-tech enterprises were guided to establish. The
development of these industries especially the manufacturing industry of electronic
information, bioindustry, aerospace industry and new materials industry was speeded up.
Second, the equipment manufacturing industry was revitalized. The manufacturing and
development of major technological equipments such as UHV equipment, large metallurgical
equipment and CNC machine tools were strengthened. The level of automotive and
shipbuilding industry was also improved.
Third, the optimization of energy industry got top priority to conservation. Moreover, the
coordination of production and consumption structure was a help to build a stable, economic,
clean and safe energy supply system. The exploration of coal was the basis of energy
industry. The main tasks of electricity industry were the construction of large efficient
environmental protection units, power grids and nuclear power plants (State Work Report,
2008). The network of oil and natural gas pipelines were improved gradually. The use of
renewable energy was popularized vigorously.
Fourth, the structure and pattern of raw materials industry were adjusted especially the layout
of metallurgical and chemical industries. The construction and building materials industries

39
upgraded their industrial structure under the principles of the conservation of energy and
resources, the protection of ecological environment and improvement of products quality.
Fifth, the process of information industry was promoted. The transformation of
manufacturing industry relied on information. The information resources were exploited. The
infrastructure construction such as broadband communications network and digital TV
network was improved. Information security was also strengthened.
1.6.3 Rapid growth of tertiary industry
For one thing, the service industry majorly facing producers got vigorous development. The
main tasks were to deepen the specialization, reduce the social transaction costs and improve
the efficiency of resource allocation. The transportation was given top priority to develop.
The growth of modern logistics industry, financial service industry, information service
industry and business service industry was also accelerated and standardized.
For another, the service industry mainly facing consumers continued to develop under the
adaption to the upgrading trend of consumption structure. The development of these
industries such as trade service, real estate, tourism, municipal utility services, community
service and sports industry was also promoted (Government Work Report of the State
Council, 2008). Diversified demand was going to be satisfied by the expansion of supply of
inadequate service products.
1.6.4 Promoting the coordinated regional development
The overall regional development strategy was to adhere to the implementation of western
development strategy, to revitalize the northeast and other old industrial bases, to promote
the growth of central region and to provide policy support to ethnic regions and border areas.
The regional interaction and coordination mechanism were improved to create a rational
regional development pattern.

40
1.6.5 Reduction of energy consumption
The policy orientation of energy conservation and efficient utilization was strengthened.
Structural energy saving could achieve by optimizing the industrial structure especially
reducing the proportion of high-energy-consuming industries. Technological energy saving
could achieve by popularizing energy-saving technologies.
China’s GDP in 2007 was up to 24660 billion RMB and its annual increase rate was 10.6%.
The proportion of three industries in GDP in 2006 was 11.7%, 48.9% and 39.4% relatively.
(China statistic yearbook, 2007)
1.7 Summary
0
20
,00
04
0,0
00
60
,00
08
0,0
00
10
00
00
10
0 m
illio
n y
ua
n
1978 1990 2000 2005 2006
Table 8 The output value of three industries in 1978-2006
mean of primary mean of secondary
mean of tertiary
As can be seen from table 8, the total output value got an outstanding growth comparing
1978 with 2006. Among three industries, the increase of primary industry was the least. The
growth of secondary industry was the biggest. The output value of secondary industry in
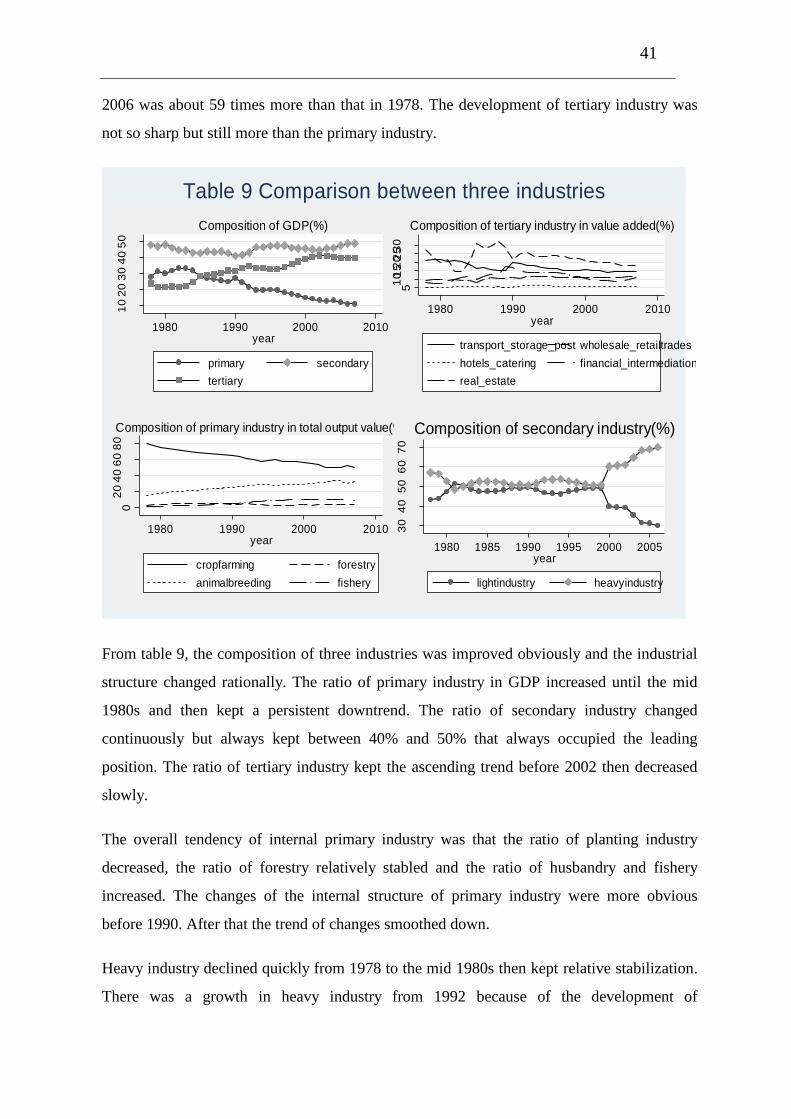
41
2006 was about 59 times more than that in 1978. The development of tertiary industry was
not so sharp but still more than the primary industry. 1
02
03
04
05
0
1980 1990 2000 2010year
primary secondary
tertiary
Composition of GDP(%)
51
0 152
0 253
0
1980 1990 2000 2010year
transport_storage_post wholesale_retailtrades
hotels_catering financial_intermediation
real_estate
Composition of tertiary industry in value added(%)
02
04
06
08
0
1980 1990 2000 2010year
cropfarming forestry
animalbreeding fishery
Composition of primary industry in total output value(%)
30
40
50
60
70
1980 1985 1990 1995 2000 2005year
lightindustry heavyindustry
Composition of secondary industry(%)
Table 9 Comparison between three industries
From table 9, the composition of three industries was improved obviously and the industrial
structure changed rationally. The ratio of primary industry in GDP increased until the mid
1980s and then kept a persistent downtrend. The ratio of secondary industry changed
continuously but always kept between 40% and 50% that always occupied the leading
position. The ratio of tertiary industry kept the ascending trend before 2002 then decreased
slowly.
The overall tendency of internal primary industry was that the ratio of planting industry
decreased, the ratio of forestry relatively stabled and the ratio of husbandry and fishery
increased. The changes of the internal structure of primary industry were more obvious
before 1990. After that the trend of changes smoothed down.
Heavy industry declined quickly from 1978 to the mid 1980s then kept relative stabilization.
There was a growth in heavy industry from 1992 because of the development of
42
manufactural industry and infrastracture construction. From 1999, the heavy industry kept a
rapid ascending trend and the industrial growth showed the heavy-industry-oriented pattern.
The industrial structure started to change from labor and capital intensive industry to skill
intensive industry.
At the begining of the reform and opening-up, the tertiary industry was mainly relied on the
traditional industry such as commercia, catering trade, neighbourhood services, transport and
postal service. After 20 years’ development, the emerging industries such as information,
insurance and real estate also developed quickly. The biggest ratio of tertiary industry was
wholesale and retail trades.

43
2. A structural comparison between China and India
China and India are neighbors and have many similarities in the aspect of national basic
conditions. They both have a large population, a weak economic background. They are
almost at the same starting line in the process of industrialization and social and economic
modernization. But the effects are a bit different, which also result in different industrial
structures and economic patterns.
2.1 The common features of economic development
China and India adopted similar economic development strategy in the days of their national
independence. As can be seen from table 10, the similarities of these two countries at the
starting point are as follows:
Table 10 The economic conditions of China and India in 1952
China India
GNP(million US dollar) 30000 22000
GNP per capita(US dollar) 52 60
Coal per capita(kilo) 96 97
Rice yield(ton/hectare) 2.5 1.3
Data: < China: socialist economy development >, 1983
In the aspect of industrial transformation, they both gave priority to heavy industry in the
initial stage of economic reform. China started to carry out such strategy ever since 1950s
under the impact of Soviet Union. China’s total output value of heavy industry occupied a
proportion of 35.5% in total industrial output value in 1952. And this proportion increased to
56.9% by 1978 (China statistic yearbook, 2007). India emphasized the importance of
developing heavy industry and basic industry ever since the second five-year plan (1956-
1961). The ratio of investment in heavy industry was up to 84% in the total intended

44
investment in secondary industry during this period (Chen JiDong & Chen JiaZe, 2005).
Indian government adjusted the original industrial structure directly through the change of
investment proportion in different industries.
As can be seen from the table 11, in the period of speeding up the establishment of industrial
system, there was an obvious investment support to secondary industry. This investment
support was the need of implementing the strategy of prioritizing heavy industry. Hence, the
main reason for the rapid growth of India’s secondary industry especially heavy industry was
the long-term high investment rate.
01
02
03
04
05
0
1956-61 1961-66 1969-74 1974-79 1980-85
Table 11 India's investment proportions in successive five-year plans(%)
mean of primaryindustry mean of secondaryindustry
mean of tertiaryindustry
The strategy of prioritizing heavy industry was at the cost of distorting the factor prices and
economic efficiency of the whole society. Industry discrimination and price scissors arising
therefore led to the long-term slow growth and even standstill of agricultural development.
The price scissors was an economic phenomenon that the price of agricultural product was
always lower than its value while the price of industrial product was always higher than its
value in the long-term exchange between them (Ba ZhiPeng, 2004). It could transfer fund
from agriculture to industry automatically then promote the process of industrialization in the
45
short run. However, the over extraction of agricultural surplus would inevitably lead to
negative impact to the whole economy in the long term.
2.2 Different path of India’s structural transformation
Although the basic conditions of China and India are quite similar and also have many
common characteristics in economic reform, their industrial structures vary greatly.
2.2.1 India’s industrial model
China follows the traditional path of industrialization that is following the procedure of
primary-secondary-tertiary and takes secondary industry especially manufacturing industry as
the core of economic development at the present stage.
As for India, it’s said it may be the only country that “bypasses the stage of industrialization
but goes directly into the stage of post-industrialization” (Li Ke, 2007). The value added of
primary, secondary and tertiary industry in China occupied the proportion of 15%, 51% and
34% in GDP in 2002, while that of India were 23%, 27% and 51% (Zhao Jianjun, 2006).
China’s secondary industry occupied more than half of the composition of industry and
India’s economic growth was mainly driven by tertiary industry.
India’s economic growth pattern is quite different from other countries in Asia especially
China. It mainly relies on domestic market instead of export, on consumption instead of
investment, on tertiary industry instead of secondary industry, on high technology instead of
low-skilled manufacturing.
Indian industrial model also has the characteristic of “two high and one low” that is the
coexisting of high proportion of agricultural population, highly-developed IT industry and
underdeveloped manufacturing industry. The proportion of agricultural population in total
population was up to 70% in 2006. The composition of three industries in GDP was 24%,
25% and 51% respectively in 2004 (Zhu XiaoGang, 2006). Hence, the highly-developed
skill- and capital-intensive service industry and seriously insufficient development of
manufacturing were the main features of Indian industry.

46
2.2.2 India’s service industry
India’s service industry plays a very important role in Indian economic growth. The high
growth of Indian economy during these 20 years (India started the economic reform in 1980)
to a large extent should be attributed to the rapid development of service industry. The
annual growth rate of tertiary industry was 7.8% since 1990s, which was obviously higher
than 4.5% of agriculture and 6.4% of secondary industry at the meantime. It undoubtedly
becomes the major driving force of economic growth.
The reasons for the formation of this pattern are various. First, India has a large population.
There are great demand for services and strong supply capacity. Second, India’s national
capital was inadequate and could not attract enough foreign investment. Third, India did not
implement the reform and opening-up policy until 1991 when new technology revolution just
started. Forth, the long-term implementation of the elite education brings India with a large
number of IT professionals. Fifth, the underdevelopment of infrastructure prevents the
development of secondary industry.
01
02
03
04
05
0
1980-85 1985-90 1992-97 1997-2002 2002-07
Table 12 India's investment proportions in successive five-year plans(%)
mean of primaryindustry mean of secondaryindustry
mean of tertiaryindustry

47
As can be seen from table 12, the ratio of investment in tertiary industry increased gradually
after the basic formation of industrial system. The rapid growth of tertiary industry could not
be separated from the government’s fund support.
Indian government started to pay attention to technology and service export since 1980s. In
the mid-1980s, Rajah Gandhi government provided policies support such as tax incentives
and tariff concessions to vigorously develop high and new technology, especially computer
technology. “Export of computer software, software development and training policy” was
also introduced during this period (Jiang Yong & Wang Lei, 2005). All of these became the
important turning point of the development of software industry.
Rao government started to carry out the plan of building software technology parks in 1991
and 13 state-level software technology parks were setting up nationwide gradually. More
preferential policies and good facilities and services there did great help to open up
international market. These parks became major bases of developing and exporting of
software industry since then.
India formulated the action projects of Indian information technology to comprehensively
promote Indian information industry in 1998. The main measures included lifting tariffs and
income tax of IT products, allowing and encouraging all kinds of information application and
information services and allowing information users in remote areas to use backbones of
defense communications system (Du Tao & Qi Huan, 2002).
Indian government established the ministry of software industry in 1999. Its policy support
and investment became more extensively. Every state also begun to set up “Indian institute
of information technology” on the basis of 6 nation-level “Indian institute of technology”.
Private and foreign educations were strongly encouraged.
The rapid development of India’s information technology industry especially the software
industry was the most outstanding success of the industrial transformation and the strongest
driving force of economic growth. The total output value of software industry was more than
4 billion US dollars in 1999 and this value increased to 7.68 billion US dollars in 2001. The
annual output value of information technology and related service industries was 28 billion
US dollars in 2004-2005 and the proportion of software and information services in it was
58.6%. Employment in related industries in the same period reached 1.04 million (Du Tao &

48
Qi Huan, 2002). India has been second only to U.S.A. in the global software market and the
software industry has been one of the pillar industries of India’s high-tech products export.
Along with the rapid growth of information industry, the resulting service outsourcing
industry also developed quickly. Indian government extended the preferential policies of
software industry such as tax exemption to other information related service industries.
These outsourcing businesses included data processing, geographic information system
services, human resources management, accounting services, engineering design and so on.
India occupied 65% of world offshore information service and 46% of world outsourcing
industry by the end of 2006 (Zhu XiaoGang, 2006).
Although software industry increased very fast, its output value only occupies 10% of the
total output value of the whole service industry. The biggest industry group was still the
wholesale and retail trade, daily necessities repairing and hotels catering industry. Generally
speaking, India’s private corporations controlled most of the wholesale, retail and
distribution while government controls the financial services system.
Table 13 Growth rate and the composition of Indian service industry (%)
Year
Average growth rate Internal composition of tertiary sectors
1980-89 1990-99 2000-05 1980 1990 2000 2005
Wholesale and
retail 5.9 7.3 12.5 31.5 29.3 28.4 27.5
Hotel and
catering 6.5 9.3 13.3 1.9 1.7 2.1 2.8
Communication 6.1 13.6 12.1 2.7 2.5 4.1 3.4
Banking 11.9 12.7
9.1
5.1 8.4 13.1
10.9
Insurance 10.9 6.7 1.3 2 1.5
Real estate 7.7 5.0
13.8
10.8 11.8 9.3
15.9 Business
services 13.5 19.8 0.5 0.7 2.3

49
Legal services 8.6 5.8 0 0 0
Data: <A Comparative Analysis of Development of Service Industry between China and India>, Wei Zuolei
From table 13, hotel and catering, communication, banking and business services industry
grew faster than the others. The proportions of wholesale and retail, banking and real estate
were bigger than others. The sum of these three was more than half of the whole service
industry in 2000. Traditional wholesale and retail industry still occupied the main part of
service industry. But the development of Indian business services including IT industry was
very striking. The average growth rate was 19.8% in 1990s, which was far higher than the
average growth rate of GDP in the corresponding period. Indian banking industry also
increased quickly. Banking and business services all were skill-intensive service industry.
The rapid growth of these two industries showed there was an enormous impetus of
technology to Indian service industry, which was mainly attributed to the phenomenal
progress of information technology.
2.2.3 India’s primary industry
Indian primary industry plays a comparatively important role in national economic growth.
From table 14, the employment of India’s primary industry still occupied more than half
employment of the whole society. The growth rate of agriculture to a large extent determined
the growth rate of the entire national economy, which was a notable feature of Indian
economic development.
Table 14 India’s employment structure (%)
Year 1983-1984 1987-1988 1993-1994 1999-2000 2001-2002
Primary 63.2 60.1 60.4 56.7 56.0
Secondary 15.6 17.6 15.8 17.6 18.1
Tertiary 21.2 22.3 23.8 25.7 25.9
Data: <A Comparative Analysis of Development of Service Industry between China and India>, Wei Zuolei

50
Indian government started to carry out Green Revolution that depended on agricultural
technology changes to induce the development of agricultural production in 1966. This
Green Revolution eased the long-term tension of food shortage and accelerated the
commercialization of agricultural products.
Government laid great attention on the diversification of agricultural products and improved
the agricultural structure to meet the diverse needs of the market ever since 1980s. It lifted
restrictions on trade in agricultural products and expand the export of high-quality rice,
cotton and jute.
Indian government started to set up Agri Export Zones in 2001. These zones were more than
60 and covered more than 20 states in the whole nation by the end of 2006.
All these methods became a great driving force to the development of primary industry. The
level modernization of agricultural production was promoted to some extent and food
production increased substantially. However, there were also some serious adverse factors.
Inadequate construction of modern infrastructures seriously restricted the development of
agriculture. A large number of poor people and unemployment blocked the increase of
farmer’s income. The income gap between south and north, rural and urban was also a big
constraint. The agricultural reform was incompletely. The reform neither led to the
transferring of agricultural labor force to other departments, nor the significant change of
internal structure of agricultural production. Due to this characteristic, the development of
primary was very slow, the productivity level was not too high and the agricultural structure
could not get improvement for quite a long time.
2.2.4 India’s secondary industry
India strongly developed the heavy industry since the mid-1950s. The increase in demand for
capital goods promoted the development of machinery manufacturing industry. Indian
government continued to increase capital accumulation rate and try to attract foreign
investment to increase the capital supply. A large number of foreign advanced technology
and equipments were introduced and more and more scientific and technological
achievements were transformed to new production productivities. Rao government allowed
private and foreign businesses to engage in all departments of secondary industry except

51
national defense, security, railway, nuclear energy, minerals and pollution-carrying industries
and release the control over monopoly enterprises (Jiang Yong & Wang Lei, 2005).
Indian government made effort to develop secondary industry and the modern
industrialization was established basically. Due to lagging infrastructures, although newly
developing industries such as automobile, pharmaceutical, steel, shipbuilding, textiles, diesel
engines and bicycles begun to take shape, their products of poor quality lacked
competitiveness in the international market.
From table 14, the employment of secondary industry only increased by 2.5%, from 15.6% in
1983-1984 to 18.1% in 2000-2001. It showed that secondary industry could not absorb large
numbers of rural surplus-labor and its development did not have the characteristic of
expansion.
The position of secondary industry in Indian economy was promoted gradually but the share
was not too high. Its share in GDP increased from 14.59% in 1950-1951 to 28.81% in 2000-
2001. This situation to a certain extent showed that India’s secondary industry was still
relatively backward.

52
2.3 Comparison between China and India 0
24
68
10
1980-1990 1990-2000 2000-2003
ChinaGDP IndiaGDP
02
46
1980-1990 1990-2000 2000-2003
Chinaprimary Indiaprimary
05
10
15
1980-1990 1990-2000 2000-2003
Chinasecondary Indiasecondary
05
10
15
1980-1990 1990-2000 2000-2003
Chinatertiary Indiatertiary
Table 15 Comparison of growth rate between China and India (%)
From table 15, the average growth rate of China’s GDP is always higher than India’s GDP
from 1980 to 2003 and almost twice over in 1990s. China’s primary industry increased
rapidly during the first stage of industrial adjustment then this pace slowed down gradually.
India’s primary industry didn’t get fast development until the beginning of 21 century. The
growth rate of China’s secondary industry continuously kept a rather high level, especially in
1990s. India’s secondary industry decreased slowly and started to increase recently. The
average growth rate of China’s secondary industry between 1980 and 2003 was almost twice
as much as that of India’s. China’s tertiary industry grew a lot in 1980s and decreased rapidly
later. The grow rate of china’s secondary industry was almost twice over that of tertiary
industry after 1990. India’s tertiary industry almost kept the same pace with secondary
industry during the corresponding period.

53
05
10
15
1985 1990 1995 2000 2005year
India China
GDP growth (annual %)
10
15
20
25
30
1985 1990 1995 2000 2005year
India China
Agriculture value added (% of GDP)
25
30
35
40
45
50
1985 1990 1995 2000 2005year
India China
Industry value added (% of GDP)
30
35
40
45
50
55
1985 1990 1995 2000 2005year
India China
Services etc. value added (% of GDP)
Table 16 Comparison of industrial composition
From table 16, China’s annual growth rate of GDP was almost always higher than India.
Their composition of value added in GDP shows distinctly their own industrial structure. In
the respect of agriculture, the value of India was always higher than that of China. The gap
between these two expanded gradually after 1990 and reached a climax in 2004. In a modern
industrialized economic society, the situation that primary industry occupied a large
proportion in GDP growth itself indicated backwardness. As for secondary industry, the gap
between these two sets of data was striking. The share of value added of China’s industry
was almost 50%, which was twice over that of India’s. In view of service industry, the
contrary was exactly the case. These graphs present clearly that China’s economic growth
mainly relied on the development of secondary industry while India’s service industry was
the major driving force of the economic growth.
54
2.3.1 Differences in trade structure
In the aspect of trade method, the main method of China is processing trade while the main
method of India is general trade.
In the aspect of trade composition, the share of service trade of India is higher than China.
China is the net importer of service trade while India’s import and export of service trade is
in the balance basically.
India’s industrial structure is helpful to promote the expansion of services export. With the
progressive development of the service industry, India's foreign service trade is also growing.
Taking information technology service for example, the annual growth rate of software and
related service industries was 46% since the mid-1990s. The export amount of software
service was less than 100 million US dollars in the early 1990s while it increased to 12.5
billion US dollars in 2004 (Wen Fude, 2005). India's IT outsourcing industry also started to
develop recently. India now becomes the second largest software exporter and first largest
country that providing software outsourcing services. More and more foreign service work
transferred to India. Cheap brainpower enables India’s service industry to become the most
competitive industry in the world.
2.3.2 Differences in infrastructure construction
The level of infrastructure construction of China is higher than that of India. It has higher
levels of electricity, transportation and communications infrastructure. By 2001, the capacity
of generator installation had reached 338 million kilowatts, ranking second in the world. The
revenue kilometers of railway had been more than 70,000 km, ranking third in the world.
Highway mileage had increased 1.7 million kilometers, ranking fourth in the world.
The condition of India is really lagging. Although the total length of railway is no.2 in the
world, its uptodateness lags far behind. The condition for highway is really poor and severe
damaged.
55
2.3.3 Differences in overall economic structure
The main impetus of India’s economic development is service industry especially
information technology and software industry, which are in the leading position in the
international market. The economic natures of service industry to a certain extent determine
the advantages of such industrial structure. The industrial sequence is tertiary-primary-
secondary.
The employment structures of these two countries in 1980 were quite similar. The ratios of
employment in those of China and India were 74%, 14%, 12% and 70%, 13%, 17%
respectively. However, the composition of GDP was quite different. They were 30%, 49%,
21% and 38%, 26%, 36% respectively (Chen JiDong & Chen JiaZe, 2005). China’s primary
industry occupied 4% more employment than India’s but the output composition was 8%
less. For secondary industry, China’s employment was 1% more and the output composition
was 23% more than that of India. As to tertiary industry, China’s employment was 5% less
and the output ratio was 15% less. On the face of it, India’s primary and tertiary industry
were more developed and China’s secondary industry grew more quickly.
Such kind of industrial structure can reduce the demand for resources and the environmental
pollution. India has a vast territory and rich natural resources, but some important resources
such as oil are inadequate. Comparing with secondary industry of which main part is
manufacturing industry, service industry obviously has relatively small demand for natural
resources especially energy. The vigorous development of service industry can to some
extent reduce the demand of economic growth for natural resources. Along with the increase
of modern industry factories and urban population, industrial and domestic wastes also
increase accordingly. Therefore, the rapid growth of service industry to a certain extent
reduces the environmental pollution. In other words, it protects the ecological environment
needed by economic growth.
On the other hand, its capacity of absorbing labor force is limited. Knowledge-intensive
service industry mainly needs elite talents rather than common populace with low level of
education. A large number of rural surplus labor forces with low level of education and labor
skills can not be absorbed since the underdevelopment of manufacturing industry. Although
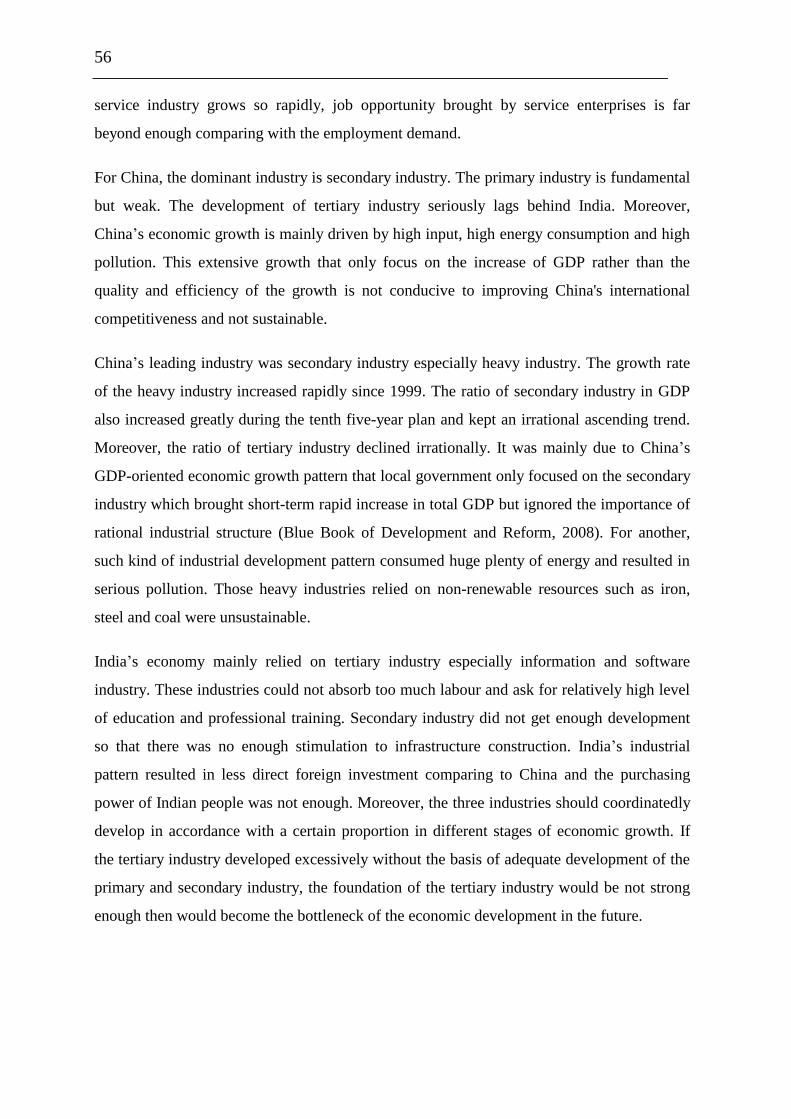
56
service industry grows so rapidly, job opportunity brought by service enterprises is far
beyond enough comparing with the employment demand.
For China, the dominant industry is secondary industry. The primary industry is fundamental
but weak. The development of tertiary industry seriously lags behind India. Moreover,
China’s economic growth is mainly driven by high input, high energy consumption and high
pollution. This extensive growth that only focus on the increase of GDP rather than the
quality and efficiency of the growth is not conducive to improving China's international
competitiveness and not sustainable.
China’s leading industry was secondary industry especially heavy industry. The growth rate
of the heavy industry increased rapidly since 1999. The ratio of secondary industry in GDP
also increased greatly during the tenth five-year plan and kept an irrational ascending trend.
Moreover, the ratio of tertiary industry declined irrationally. It was mainly due to China’s
GDP-oriented economic growth pattern that local government only focused on the secondary
industry which brought short-term rapid increase in total GDP but ignored the importance of
rational industrial structure (Blue Book of Development and Reform, 2008). For another,
such kind of industrial development pattern consumed huge plenty of energy and resulted in
serious pollution. Those heavy industries relied on non-renewable resources such as iron,
steel and coal were unsustainable.
India’s economy mainly relied on tertiary industry especially information and software
industry. These industries could not absorb too much labour and ask for relatively high level
of education and professional training. Secondary industry did not get enough development
so that there was no enough stimulation to infrastructure construction. India’s industrial
pattern resulted in less direct foreign investment comparing to China and the purchasing
power of Indian people was not enough. Moreover, the three industries should coordinatedly
develop in accordance with a certain proportion in different stages of economic growth. If
the tertiary industry developed excessively without the basis of adequate development of the
primary and secondary industry, the foundation of the tertiary industry would be not strong
enough then would become the bottleneck of the economic development in the future.

57
Reference
State Development and Reform Commission (2005). Changes and Adjustment of
China’s Industrial Structure.
http://www.ndrc.gov.cn/fzgh/yjdt/t20050721_37637.htm
Industrial Structure. http://www.china.com.cn/chinese/zhuanti/cyjg/1111883.htm
Government Work Report. http://www.gov.cn/test/2006-02/16/content_200719.htm
Statistic yearbook (2007). http://www.sei.gov.cn/try/hgjj/yearbook/2007/indexCh.htm
The Outline for the Tenth Five-Year Plan. http://www.china.com.cn/ch-15/plan8.htm
Wikipedia. http://zh.wikipedia.org/
Zou DongTao and OuYang RiHui (2008). Blue Book of Development and Reform.
China Social Sciences Academic Press
http://theory.people.com.cn/GB/68294/131889/index.html
Guo Kesha (2001). The Strategic Adjustment of China's Industry Structure in the Next
Five Years. China & World Economy No. 2
Zhou ZhiXiang and Zeng BaoYou (1995). Rural Industrial Economy. Chinese
People's University Press
Li JiangFan and Zeng GuoJun (2003). An Analysis on Upgrading Trends of Tertiary
Industry’ s Internal Structure in China. China Industrial Economy Series 180
Liu XinMin (2001). Analyzing the Adjustment of Industrial Structure and Its Effect in
China. Journal of ShanXi finance and Economics University, vol. 23(4)
Sun ChangQing (2003). On the Route Selection of Our Industry Structure Adjustment.
Economic Survey No.4

58
Yan HongXia and Liu Jie (2003). The Basic Idea of the Adjustment of China’s
Industrial Structure. Economist No.11
Wu HaiFeng (2003). International Experiences of Adjustment of Industrial Structure.
Shan Dong Social Science No.6
Sun JieBao (2003). Problems of Industrial Planning. Commercial research No.14
Peng XiaoChun (2006). Adjustment and Upgrading of China’s Industrial Structure.
Hu Xiang Forum No.3
Liu Xiao Dong (2001). On the Adjustment of the Industrial Structure in China.
Taxation and Economy No.6
Wen FuDe (2003). China and India Can Learn From Each Other in Economic
Development. South-Asia research No.3
Li YunXia (2005). An Analysis of the Advantages of China's and India's Economic
Development. Journal of Hebei University of Economics and Trade vol.26 No.1
Wang Lei (2005). International Comparisons of Adjustment of Industrial Structure.
International ecnomics research No.6
Wen FuDe (2001). Economic Globalization and Economic Development in India.
Contemporary Asia-Pacific No.11
T.S. Papola (2005). Emerging Structure of Indian Economy. Institute for Studies in
Industrial Development
Jiang Yong and Wang Lei (2005). A Comparison of Economic Development between

59
China and India. Journal of ShanXi finance and economics university, vol.27 No.2
Du Tao and Qi Huan (2002). The Development of India’s Software Industry. The
exploration of economic issues, No.12
Zhao JianJun (2006). Comparison and Contrast between Modern China's and India's
Economic Reforms and Analysis of Forming Reasons of Their Economic Development
Patterns. Economics No.3
Chen JiDong and Chen JiaZe (2005). The Comparison of Economic Development
Model and Transition between China and India. South-Asia Analysis No.2
Ba ZhiPeng (2004). An Analysis of Price Scissors of Agriculture and Industrial
Products after the Foundation of New China. Journal of LinYi teachers college,
vol.27 No.2
Li Ke (2007). China and India: A Comparative Analysis on Macroeconomic
Environment. China Economic Review, vol.7 No.10
Zhu XiaoGang (2006). Highlights of the Industrial Structure in India. Scientific
decision-making, No.12