the adsorption of mixed systems on … in mixed surfactant systems. adsorption isotherms were...
TRANSCRIPT

THE ADSORPTION OF MIXED SURFACTANT SYSTEMS ON COLLOIDAL CARBON BLACK
Scott Michael Richardson
A Thesis Submitted to the Department of Chemistry in Conformity with the Requirements for the Degree of Master
of Science.
Queen's University Kingston, Ontario, Canada
July 1997
Copyright O Scott Michael Richardson, 1997

National Library (*I of Canada Bibliothèque nationale du Canada
Acquisitions and Acquisitions et Bibliographie Services services bibliographiques
395 Wellington Street 395. rue Wellington OttawaON KtAON4 OttawaON KtAON4 canada Canada
Your fi& vcrrs relwmcu
Our N m reMIIMQ)
The author has granted a non- L'auteur a accordé une licence non exclusive licence allowing the exclusive permettant à la National Library of Canada to Bibliothèque nationale du Canada de reproduce, loan, distribute or seil reproduire, prêter, distribuer ou copies of this thesis in microfonn, vendre des copies de cette thèse sous paper or electronic formats. la forme de microfiche/fïlm, de
reproduction sur papier ou sur foxmat électronique.
The author retains ownership of the L'auteur conserve la propriété du copyright in this thesis. Neither the droit d'auteur qui protège cette thèse. thesis nor substantial extracts fkom it Ni la thèse ni des extraits substantiels may be printed or othenvise de celle-ci ne doivent être imprimés reproduced without the author's ou autrement reproduits sans son permission. autorisation.

This thesis investigates the behaviour of carbon black as a mode1 hydrophobie
colloid in mixed surfactant systems. Adsorption isotherms were prepared for a series of
nonylphenol polyethylene oxide surfactants of v-g chah length. Additional
isotherms were prepared for sodium dodecyl sulfate and tetradecylaimethylammonium
bromide. Subsequent work was done in order to determine the individual surfactant
concentrations in mixed surfactant systems.
Electrokinetic and acoustophoretic measurements were used to measure the
charge on the carbon black particle surface in the presence and absence of surfactants.
Measurernents were carried out in both single and mixed surfactant systems.
Experimental design was directed at understanding the behaviour of the surfactant
adsorption under changing conditions of pH and temperature.
A preliminary study of the particle size distribution in aggregated carbon black
systems was aIso conducted.

TABLE OF CONTENTS
Page
........................................................................................................................ ABSTRACT i . . TABLE OF CONTENTS .................................................................................................... ri
LIST OF FIGURES .............................................................................................................. v . .
ABBREVIATIONS ........................................................................................................... vri ...
SYMEIOLS ....................................................................................................................... vu1
LIST OF TABLES ............................................................................................................... x
....................................................................................... CHAPTER 1 . NTRODUCTION 1
C HAPTER 2 . BAC KGROUND AND THEORY .............................................................. -5
2.1 . 1 Electrostatic Repulsion ........................................................................ 5
2.1.1 Gouy-Chapman Mode1 of the Electncal interface ............................. 12
2.1 -3 van der Waals Forces Between Colloida1 Particles ........................... 13
............................................................................. 2.1.4 Harnaker Equation 15
............................................................................ 2.1.5 Steric Stabilization 17
.............................................................. 2.1.6 interaction Potential Curves 21
2.1.7 Effect of Added Stabilizers ............................................................... 25
2.2 Surfactants .............................................................................................................. 26
2.2.1 Micelle Definition and Energy Description ...................................... 27
........................................................................ 2.2.2 Nonionic Surfactants -29
2.2.3 Cloud Point Temperature .................................................................. 30
2.2.3 HLB Classification ............................................................................ 31
2.2.5 Applications ..................................................................................... 3 2
............................... .................. 2.3 Adsorption lsotherms for Nonionic Surfactants .... 34
.......................... 1.3.1 Methods for Evaluating Surfactant Concentrations 35
2.3.2 Shape o f Isotherms ............................................................................ 36
2.3.3 S teric Layer Thickness ...................................................................... 39
2.4 Acoustophoresis .................................................................................................... -42
2.1.1 Principles of Operation ..................................................................... 42
2.4.2 Electroacoustics .............. ..... ........................................................ .44
2.4.3 Advantages of Electroacoustics ....................................................... -46
2.4.4 Electrical Nature of the Solid Liquid [nterface ................................. 48
CHAPTER 3 . EXPERlMENTAL ...................................................................................... 49
3.1 Materials ................................................................................................................. 49
......................................................................... 3.1 -1 Nonionic Surfactants 49
................................................................................ 3.1 2 Ionic Surfactants 50
..................................................................................... 3.1 -3 Carbon Black 50
3 2 Adsorption Isotherm Preparation .......................................................................... -52
3 .3.1 Nonionic Surfactant Analysis ............................................................ 53
3 2 . 2 Anionic Surfactant Analysis .............................................................. 53
3 -3 -3 Cationic Surfactant Anaiysis ............................................................ -56
3.4 Pen Kem 7000 Acoustophoretic Titrator .............................................................. -57
....................................................................................... 3.5 Pen Kem 50 1 Zeta Meter 58

. . Conductivity Experiments ...................................................................................... 59
.............................................................................................. Aggregation S tudies -59
3.7.1 Zeta Potential Measurements of Ionic Surfactants ............................ 60
3.7.2 Image AnaIysis Work ....................................................................... 1
3.7.3 Analysis of SDS as a Function of Tirne ............................................ 61
. .-..................*.......*.-.............*.................... CHAPTER 4 RESULTS AND DISCUSSION 62
3.1 Adsorption Isotherms ............................................................................................. 62
.......................................................... 3.2 Electrokinetic Zeta Potential Measurements 71
4.3 Acoustophoresis Experirneots ................................................................................ 80
1.4 Spike Addition of TTAB to SDS Stabilized Systems ............................................ 82 .
4.5 Conductivlty Experiments ......................... .... ........................................................ -85
CHAPTER 5 . CONCLUSIONS AND FURTHER WORK .............................................. 86
REFERENCES .................................................................................................................. 91
VITAE ................................................................................................................................ 94

LIST OF FIGURES
Figure 2.1 Schematic Drawing ofthe Electrical Double Layer. (after israelachvili 1992) ................................................................................................. 1 1
Figure 2.2 (a) Stenc Stabilization of Colloidal Particles with Nonionic Surfactants. ............... (b) Electrosteric Stabilization with Ionic Surfactants. ..................................... ,.. 20
Figure 2.3 (a) Electrostatic Repulsion Energy as a Function of Surface Potential for a PS Latex System r = 0.1 pun' T = 25 O C : (1) 40 mV, (2) 60 mV, (3) 80 mV. (b) van der Waals Attraction Energy as a Function of Particle Radius,
................................ Aij i = 1.95 x 1 0 - l ~ J, T = 25 O C : (1) 50 nm, (2) 100 nm, (3) 150 MI 23
Figure 2.4 (a) Total interaction Potential of a PS Latex System, r = 0.05 p, Ai j i = 1.95 x 1 0 - l ~ J. T = 15 O C : (1) 80 mV, (2) 60 mV, (3) 40 mV. (b) Effect of Steric Layer Thïckness, r = 0.05 p, Al jl = 1.95 x 10'19 J, T = 25 O C :
.............................................................................. ( 1 ) 2.25 m ~ , ( 2 ) 2.90 nm, ( 3 ) 3.45 m. 24
Figure 2.5 Idealized L4 Type Isothenn for Adsorption of Nonionic Surfactants .................... at the Solid/Solution interface (after G.D. Parfitt and C.H. Rochester 1983) 37
Figure 2.6 Schematic of Acoustophoretic Mechanism (afier B.J. Marlow and D. Fairhurst 1988). ........................................................................ 43
Figure 3.1 üV Spectrum of SDS:Methylene Blue Cornplex. ............................................ 55
Figure 4.1 Adsorption Isotherm for CO-850 on ST1120 Carbon Black (+)- pmol g-'. (.)- pnol m-' ............................................................................................ 65
Figure 4.2 Adsorption Isotherm for SDS on ST1120 Carbon Black ............................................................................................. ( + ) - p o l g'i, (.)- pmol rn" 66
Figure 4.3 Mixed Adsorption Isotherm of SDS and CO-720 on ST1110 Carbon Black (*) Total Adsorption, (a) CO-720 ( 0 ) SDS ............................................. 69
Figure 4.4 Adsorption Isotherm for SDS, TTAB and CO-720 on ST1120 Carbon Black. (m) SDS, (+) CO-720 ............................................................................... 70
Figure 4.5 Equilibrium Process in Mixed AnionicKationic Surfactant System (after Scamehom et al. 1988) ............................................................................................. 75

Figure 1.6 Zeta Potential as a Function of Temperature for CO-710/SDS Systems (+) 16 OC. ( i )24 O C . (m) 32 O C ......................................................................................... 80
Figure 4.7 PIot of Zeta Potential as a Function of Added T'T'AB to STI 120 ............................................................................................. Stablized with SDS/CO.720 84
Figure 1.8 Determination of CMC of T'LU fiom Conductivity ................. Measurements in DD W ...., .......................................................................... 87
Figure 4.9 Titration of T'AB with SDS in DDW ............................................................. 88

RAM
SDS
TTAB
CMC
DDW
RPM
w
PEO
EO
MBAS
CVP
ST1120
DLVO
PB
C.C.C.
PS
Relative acoustophoretic mobility
Sodium dodecyl sulfate
TetradecyItrimethylammonium bromide
Critical micelle concentration
Deionized distilled water
Revolutions per minute
Ultraviolet
Poiyethylene oxide
Ethylene oxide unit
Methylene blue active substance
Cotloid vibrational potential
Sterling carbon black
Colloidal Stability theones of B. De jaguin. L.D. Landau, J.W. Venvey and J. Th. Overbeek
Poisson-Boltzmann
Critical coagulation concentration
Po 1 ystyrene

Electrical force. N
Electrical charges, C
Permittivity of fiee space, kg-' m-' s4 A'
Dielectric constant of the medium
Separation distance between the centers of the charges. m
Work to b ~ g two charges together &om an infîîite distance, J
Concentration of positive ions in the bulk medium. moles L-'
Charge on the ion, C
Elernentary electric charge, C
Surface potential, V
Boltzmann constant, J K"
Temperature, K
Charge density, C m-'
Valency nurnber
Concentration of n type ions in the bulk medium. moles L"
The reciprocal of the thickness of the double layer, m"
Electrostatic potential on the particle, V
Counter ion charge number
Particle radius, m
Hamaker constant, I
Surface to surface distance, m
H a , + a 2
Particle radius, m
Volume of a molecule of the dispersion medium, rn3
Polymer solvent interaction parameter
Concentration of the polymer in the steric layer. mol m"
. . . V l l l

Stenc layer thickness, m
Nurnber of moles of surfactant adsorbed on a unit mass of soiid,moles kg-'
Total nurnber of moles of solution before adsorption, moles
Change in mole fraction of surfactant resulting from adsorption
Mass of insoluble adsorbent, kg
Amount adsorbed, mol rnS2
Number of moles of surfactant adsorbed. moles
Surface area of substrate, m'
Zeta potential, V
Fluid density, kg m"
Particle density, kg m-'
Fluid viscosity. N s rn"
Volume fiaction of the particle
Dielectric constant
Particle weight Baction
Wavelength of light. nm

LIST OF TABLES
9 ................................................................... Table 1.1 Exarnples of ColIoidal Dispersions
............................................... Table 2.1 Selected HLB Values of Nonionic Surfactants 32
............................. ................... Table 3.1 Nonionic Surfactants and Physical Data ,.. 39
................................................... Table 3.2 Absorptivity Data for Nonionic Surfactants 50
3 ............................... ....................... Table 3.3 Physical Properties of Sterling 1 120 .. 5 1
.................................. Table 3.4 Surface Area Measurements on ST1 120 Carbon Black 51
Table 4.1 Absorption Isothenn Data for Surfactants on STI 130 ................................... 64
.......... Table 4.2 Zeta Potential of Carbon Black Solutions as a function of added SDS 72
........................ Table 4.3 Zeta Potential Measurements of Mixed TTAB/SDS Solution 73
.................... Table 4.3 Zeta Potential of STl 120 Stabilized with Nonionic Surfactants 77
Table 4.5 Effect of Temperature on the Zeta Potential of SDSKO-720 Systems .......... 79
......................... Table 4.6 Detemination of the Critical Micelle Concentration of SDS 85
Table 3.7 Determination of the Critical Micelle Concentration of TTAB ...................... 85

CHAPTER 1. INTRODUCTION
Colloids are an intricate part of our world. One accepted definition of a colloid is
any system that has one or more of its components with at least one dimension in the
nanometer-micrometer size range. Exarnples include: aerosols, foams, inks, and
pharmaceuticals. These are al1 systems that contain srna11 particles or large molecules.
The ability to control and predict the stability of a colloidal system is of vital
interest in a broad range of industries including: pharmaceuticals, detergency, xerography,
and cosmetics. EEorts to understand this stability stem fiom increased product life,
efficient dmg delivery. and consistent product performance. The ability to manipulate a
colloid is based upon an understanding of the factors that impart stability to the system.
Equally important is a thorough understanding of the factors which can destabilize a
system.
One of the more frequently encountered types of colloidal systems is dispersions.
Dispersions consist of one phase of matenal homogeneously rnixed in a second. nie
phases can be liquid, gas or solid. Examples of some of these systems are listed below in
Table 1.1 .' As will be discussed in Chapter 2. there has been an intensive effort during
the past several decades to develop a unimg theory to understand and predict colloidal
stability. One of the primary means of generating stable dispersions is through the
intelligent application of stabilizers or surfactants.

Table 1.1 Examples of Colloidal Dispersions
Dispersed Phase Dispersion Medium Name Exarnples
Liquid
Solid
Gas
Liquid
Solid
Gas
Liquid
Solid
Gas
Gas
Liquid
Liquid
Liquid
Solid
Solid
Solid
Liquid aerosol
Solid aerosol
Foarn
Emulsion
Colloidal Suspension
SoIid Foam
Solid Emulsion
Solid suspension
Fog, liquid sprays
Smoke, dust
Soap solutions
Milk. mayonnaise
Au sol, Agi sol
Expanded Polystyrene
Opal, pearl
Pigmented plastics
Surfactants are a class of molecules that have a unique chernical structure. There
are three general classes of surfactants: anionic, cationic and nonionic. Ln general their
molecular makeup consists of both a hydrophobie and a hydrophilic portion. in this thesis
the following terrns will be used to descnbe surfactant structure. The hydrophobic
portion (usually a hydrocarbon chah) will be referred to as the tail. The hydrophilic
(charge bearing or containhg polar groups) will be referred to as the head. The dual
nature of these types of molecules allows thern to preferentially position themselves at the
interface between non miscible components. Surfactants find widespread use in colloidal
systems. They are often the only means of generating stable dispersions in some systems.
More recently, mixtures of surfactants have been employed in the area of colloidal
stability. Mixtures oflen exhibit spergistic behaviour which is unavailable in single

surfactant systems. However, the properties of these mixtures are complex and are at
present not well understood.
One of the driving forces for understanding surfactant behaviour in these rnixed
systems is the potential to optirnize their use and performance. Emulsion polyrnerization
is an example of a colloidal system that relies heavily on the properties of surfactants.
The synthesis of the polymer and the final particie size distribution in the product are
intncately linked to surfactant behavior in the colloidal system. Of fundamental
importance is a thorough understanding of surfactant behaviour during the seeding or
growing process of the primary particles. During this process seed particles are first
generated, these primary particles c m be aggregated to form the secondary particles.
Surfactants play a prime role in both the growth of the pnmary particles and the
subsequent stabilization of the secondary particles. Control over the extent and
uniformity of the secondary particle size is a result of a number of processes. Currently
there exist some opposing ideas regarding the role of the surfactants during the particle
growth and stabilization phases.
Emulsion polyrnerization typically involves a number of di fferent chemicals and
factors that exert influence on the final particle size distribution. Some of the more
important factors include shear rate. temperature, pH1 and type of surfactants.
Recent research into narrowly dispersed aggregates at the Xerox Research Centre
of Canada has provided a starting point to begin this investigation into mixed surfactant
systems. From the procedure developed at Xerox, narrowly dispersed aggregates are
produced fiom a pnmary particle size of 0.15 p with a final aggregafe size anywhere
between 5 and 10 Fm. The primas. particles are stablized with a mixture of anionic and

nonionic surfactants. Cationic surfactant is added to the systems to destabilize it and to
begin the aggregation process. There are several hypotheses directed at explaining the
behavior/roie of the individual surfactant components in the mixture.
The surfactants in this system initially serve to keep the latex particles stable in
soiution. Aggregation is induced by the addition of cationic surfactant, which causes the
formation of a thick viscous gel. This gel is subsequently broken up at higher temperature
to form aggregates with a remarkably narrow size distribution. The restabilization is
thought to be primarily a function of the aggregate size and of the surfactant concentration
and conformation on the particle surface. in order to M e r understand and explain the
process, a method of determining the concentration and effect of individual surfactants in
t h i s complex mixture was required.
This thesis describes a first attempt at obtaining analytical techniques for
determining individual surfactant concentrations is such complex systems. A secondary
objective of this research proj ect was to investigate if narrow aggregate distributions
could be obtained by aggregating dispersions of colloidal carbon black.

CHAPTER 2. BACKGROUND AND THEORY
2.1 DLVO Theory
The ability to control and manipulate colloidal stability has been the focus of a
large and concentrated effort for the past several decades. Depending on the application
of a colloidal system, fme-control over the stability of the system can have a ciramatic
influence on the end-use properties. In the area of colfoid science the theones of
De jaguin, Landau, Verwey and Overbeek (DLVO theory) are often used to defme and
predict the stability of a given system.
The DLVO theory unified the theones goveming attraction and repulsion in
colloidal particle systems. The theory deals with the potential energy of interaction
between colloidal particles as a function of distance. It combines the attractive (van der
Waals) and repulsive (electrostatic) energies between particles to predict the total
interaction energy. The major contributing factors to the repulsive and attractive forces
acting between colloidal particles will be outlined next.
2.1.1 Electrostatic Repulsion
Electrostatic repulsion arises between colloidal particles when two similarly
charged surfaces approach each other at a small distance of separation. The repulsion is a
direct consequence of the interaction between the sirnilady charged surfaces.'
There has been a vast amount of theoretical and experimental work directed at
explaining the nature of the electrical interface. The interface exists between the solid and

its surrounding solution environment. Repulsive electncal forces acting between the
surfaces of similarly charged colloids are often the primary means of stabilization within a
system.'
Colloidal particles may acquire surface charge through one or a combination of the
following mechanisms: (i) preferential dissolution of surface ions. (ii) direct ionization of
surface groups, (iii) substitution of surface ions, (iv) specific ion adsorption." The forces
acting between "charged surfaces" have their ongin in Coulomb's Law. This law
describes the interaction between point charges separated by a distance r in a vacuum.
Coulomb's law m u t be modified in order to extend its applicability to colloicial systems.'
The interaction of two charges in a vacuum, separated by distance r, can be
described by Equations 2.1 and 7.2
where
Fe1 = elecûicaI force, N
q 1 ,qz = electncal charges, C
&O = permittivity of fiee space, kg" m*' s4 A'
E = dielectric constant of the medium

r = separation distance between the centers of the charges, m
w = the work necessary to bring two charges together fiom an infinite
distance, J.
For charges of the same sign the work will be positive and the interaction will be
repulsive. The quantity of work is defined as the "elecû-ical potential" at r due to the
charge q,, and is given the symbol Y.
in order to describe systems of more practical interest Coulomb's law must be
modified by the Boltzmann distribution to account for al1 ions present in the system.
which is descnbed by Equatior? 2.3. If the surface has a negative electrical potential
(negative surface charge), the concentration of positive charges in the region surrounding
the surface c m be calcuiated by the following expression:
where
c, = concentration of positive ions surrounding the surface, moles L*'
Co = concentration of positive ions in the bulk medium, moles L"
Z, = charge on the ion, C
e = elementary electnc charge, C
Y = surface potential, V
k = BoItmiann constant, J K-'
T = temperature. K.

One of the approximations often invoked to describe the electrical interface is to
express the charge density of the surface as a fûnction of potential upon rnoving away
fiom the charged surface. Charge density is related to the surroundhg ion concentration
profile as s h o w by Equation 2.4j
where
P'
21
e
Y
k
n1o
T
= charge density. C rn'j
= vaiency nurnber
= eiementary electric charge. C
= surface potential, V
= Boltzmann constant, J K-'
= concentration of n type ions in the buk medium, moles L-'
= temperature, K.
Reiating Equation 2.4 to the potential results in the Poisson-Boltzmann (PB) equation
The Poisson equation implies that the potentiais associated with the various
charges combine in an additive manner, whereas the Boltzmann distribution irnplies an

exponential relationship between the charges and the potential. The PB equation has no
explicit solution and must be soived for limiting cases. The solution to the above
differential equation under conditions of low surface potential and the condition of
electroneutrality results in the Debye-Huckel approximation which is expressed as
Equation 2.6,
Where
y 0 = the potential at the particle surface, V
K = the reciprocai of the thickness of the double layer, m-'.
The thickness of the double layer for surface potentials less than 25 mV is calculated
according to Equation 2.7
The thickness of the double layer varies inversely with the concentration of
solution electrolytes, and the square of the valency of the counter ion. By changing either
the concentration or the identity of the surroundhg electrolyte, the thickness of the double
layer cm be manipulated. in systems whose stability is entirely dependent on electric
double layer interactions this has important implications. This strong dependence on ion
valency and concentration is the basis for the Schulze-Hardy rule! The Schulze-Hardy
mle predicts the amount of inert electrolyte necessary to destabilize a colloidal system.

this arnount is most often referred to as the critical coagulation concentration (c.c.c). At
the C.C.C. the surface charge of the particles will have been screened by the added
electrolyte, this causes the attractive forces to dominate and the dispersion will become
unstable.
The solution taken as a whole will be electrically neutral. However in the vicinity
of the charged surface, at the particle-solvent interface. there will exist an irnbalance of
electrical charges. This charge irnbalance in the system depends heavily on the net charge
of the surface. The region of excess charge of opposite sign around a charged surface is
commonly referred to as the "ionic atmosphere" or "charge cloud" associated with that
potential. This ionic atmosphere consists of a higher concentration of counter ions over
CO-ions as predicted fiom Equation 7.3. In colloidal systems the "charge cloud" in
conjunction with the charged interface is commonly referred to as the "electncal doubie
layer" associated with the particle.
As a consequence of the dynarnic nature of a solution, the ions present in the
double layer exist in a dif ise state. This results in a surrounding ionic environment that
is rapidly undergoing change. Taking account of this added complexity, Gouy and
Chapman developed a mode1 to describe the electrical double layer that relates the
potential of the surface to the diffise portion of the double layer.' It does not involve the
ssurnption of low potentials invoked in the Debye-Huckle approximation. A schematic of
the interface is given in Figure 2.1.

FFUSE LAYER (MOBILE IONS)
I \ BOUND (IMMOBILE) COUNTER-IONS
PARTICLE SURFACE IONS
Figure 2.1 Schematic Drawing of the Electncal Double Layer (after Israelachvili 1992).

2.1.2 Gouy-Chapman Mode1 of the Electrical Interface
The "Stem Layer" is the small space separating the ionic atmosphere around a
surface €rom the acnial diffuse double layer. and consists of tightly bound counter ions
that are not ''fiee" to move with the thermal motion of the aqueous system. The Stem
Layer has a thickness on the order of a few angstroms, and its width accounts for the finite
size of charged groups and ions specifically associated with the surface.'
It is assumed that the electrical potential in the solution surrounding the surface
decreases exponentially with distance. This approximation is not valid at points close to
the surface, where the potential decreases much more rapidly due to the presence of bound
counter ions in the Stem Layer which are more effective at screening the surface charge.
Several simplifjmg assumptions are employed to theoretically treat the nature of the
interface. These include: (i) ions fiom both the solution and the surface are treated as
point charges, (ii) the surface is treated as a Mform charge, (iii) charges of opposite sign
c m approach infinitely closely. and (iv) the dielectric constant of the solvent is assurned
to remain constant throughout the double layer.
The actual surface potential represented by y~ is replaced in the Gouy-Chapman
model with y,. This is the potential of the surface at the interface between the Stem plane
and the solution. The Gouy-Chapman model accounts for the mobility of ions in aqueous
solution. The diffuse model of the double layer reflects the change in potential associated
with the surface on moving away fiom the interface.
No exact analytical expressions exist for solving the equations associated with the
nature of the interface, recourse to nurnencal solutions or to various approximations are
ofien invoked. According to Overbeek. the rate of double layer overlap in typical

Brownian motion between particles is too fast for adsorption equilibrium to be
maintained.' Often models of the interface assume that the potential remains constant
during particle collision or that the surface charge remains constant; the true situation lies
between these two assurnptions.
Reerink and Overbeek developed an expression to calculate the interaction
potential caused by the overlap of the d i h e portion of two double layers. This
interaction is referred to as the electrostatic repdsion term (TlR). The main assumption in
their derivation is that the interparticle separation is large compared to the thickness of the
double layers. For equal sphencal particles this denvation is represented by Equations
2.8-2.10.

where
'+'d
z
E
a
= electrostatic potential on the particle, V
= counter ion charge number
= permittivity of the medium (water), kg*' m-' s4 A'
= particle radius, m.
Viscosity effects in solution dictate that only a portion of the double layer will
move up to approximately the Stem Layer. The dividing line is referred to as the shear
plane position where viscosity effects in the solution change drarnatically. The potential
at the shear plane is termed the "electrokinetic" or "zeta potential". It is normally
assumed that the zeta potential and the Stem potential are the same in magnitude. The
slight difference arises as a consequence of a structured aqueous layer which displaces the
shear plane of the zeta potential slightly outward from that of the Stem plane.
2.1.3 van der WaaIs Forces Between Colloidal Particles
The prirnary attractive force between two molecular bodies is the van der Waals
attractive force. There are many subdivisions of these forces, some of the more important
ones include: (i) permanent dipole-induced dipole, (ii) permanent dipole-permanent
dipole, and (iii) induced dipole-induced dipole interaction.' The "induced dipole -induceci
dipole" interaction is generally referred to as the London dispersion force. London forces
act between non-polar molecules through polarization of one molecule by fluctuation in
the charge distribution in a second molecule and vice versa. This short-range attraction
varies inversely with d6 where d is the intemolecular distance.

The attractive force that is operative between molecules can also be applied in the
area of colloids with the appropriate modifications. Hamaker derived an expression to
scale-up the van der Waals attraction between molecules to descnbe colloidai systems.
The derivation assumes that the attraction between particles are additive, and is calculated
by summing the interactions between al1 interparticle molecular pairs. The summations
predict that London interactions decay much Iess rapidly than those of individual
molecules, and the law generally obeys an inverse relationship with distance.
The van der Waals attractive force (VA) is overestimated at large distances since
the derivation neglects the finite time required for propagation of electromagnetic
radiation between particles. This weakens V, because the particles will oscillate further
out of phase the greater their separation. For rnost practical applications in colloidal
science this "retardation" effect is not important.
2.1.4 Hamaker Equation
For non-polar particles the predominating attractive forces are London dispersion
forces. Harnaker derived the following expression to describe the attractive dispersion
forces acting between two spherical particles of colloidal dimensions (Equation 2.1 1):
where
A = Hamaker constant. J

H = surface to surface distance, m
ai , a2 = particle radii, m.
One of the difficulties in calculating the van der Waals attraction between
colloidal particles is the evaluation of the Harnaker constant. This constant c m be
calculated fiom either a microscopie or a macroscopic approach. Both approaches have
their own merit depending upon the separation distances between the particles. The
original equations describing the interparticle interactions were deveioped under vacuum
conditions. To account for the influence of the dispersion medium, the Hamaker constant
is replaced with an effective Harnaker constant (Equation 2.11) that evaluates the
interaction between particles 1 and 2 interacting through an intervening mediurn 3.'
Equation 2.12 simply states that as two particles approach one another the particle-
dispersion medium interactions are replace with particle-particle and dispersion medium-
dispersion medium interactions. The interaction of particles of the same material is
always attractive. The strength of the interaction increases the greater the chemical
difference between the particles and the dispersion medium. That is, the attraction
between non-polar particles in a polar medium is stronger than that of polar particles in a
polar medium. The main assumptions in the Hamaker rnolecular theory include the

following: (i) the interactions can be considered pair-wise, (ii) bodies are assurned to have
uniforni density (iii) the interactions of the molecular clouds are instantaneous, (iv) al1
dispersion force attractions are due to one dominant frequency, and (v) the bodies are not
distorted by the attractive forces.
2.1.5 Steric Stabiiization
An altemate method of hnparting stability to a colioidal system involves the
adsorption of polymers or surfactant molecules on the surface of the colloidal particles.
The term "steric stabilization" is fiequently used to describe this method of stabilization.
Adsorbed polymer c h a h acting as stabilizers offer several advantages over electrostatic
stabilization. They are generally insensitive to electrolytes. have utility in both aqueous
and nonaqueous systems, and exhibit good fieeze-thaw stability7
An effective stabilizer will be strongly anchored to the particle surface and exhibit
hi@ enough surface coverage (to avoid lateral movement during stress) to maintain
stability on close approach of the particles. Spontaneous re-dispersion of dried particles is
a characteristic feature of stencally stabilized systems. There have been severai
expressions developed to describe the interaction between colloidal particles with
adsorbed stabilizers.' One of the more fiequently encountered is the Fischer equation for
the enthalpy of mixing (Equation 2.13):
where
5 = volume of a molecule of the dispersion medium. rnj
17

4 = surface to surface distance, m
Ali = polyrner-solvent interaction parameter
7
ci = concentration of the polyrner in the stenc layer, mol rn';
-3
Pi = çtabilizer density in the steric layer, kg rn"
6 = steric layer thickness, rn
a = particle radius, m.
The Fischer equation relates the change in fiee energy of the steric layer as a
function of the restricted volume upon approach of the particles. It relates the excess
chernical potential to the excess osrnotic pressure. The fast two terms of the equation
reflect the overlap volume occupied by the approach of two spheres. The first and second
term take into account the interaction between the adsorbed layer and the solvent, and the
interaction between the two adsorbed layers.
Consideration must be given to the interaction between the stabilizer and the
solvent in order to achieve the desired level of stability. The dispersion medium must be
a "good solvent for the stabilizer, in order to prevent the mutual attraction between
adsorbed layers.
ORen stabilizers are added to systems which already posses some electrostatic
stability fiom surface charges on the particle. Some systems derive their stability fiom
both stenc and electrostatic contributions. The stabilizers themselves may contain
charged groups. as is the case with ionic surfactants. The term "electrostenc" is often
employed to descnbe such systems. These methods of stabilization are illustrated in

Figure 2.2. in nonaqueous systems where electrostatic stabilization is rarely possible.
steric stabilization is oflen the only means of stabilizing a ~ ~ s t e r n . ~
There are several different methods available for directly measuring the interaction
between adsorbed steric layers. These include: (i) crossed mica cylinders, (ii) crossed
quartz filaments, and (iii) small hemi-spherical caps. Other methods are based on
particdate dispersions.

Overlap of Steric (a)
Overiap of Electrosteric
Figure 2.2 (a) Steric Stabilization of Colloidal Particles with Nonionic Surfactants. (b) Electrostenc Stabilization with Ionic Surfactants.

2.1.6 Interaction Potential Curves
To summarize, the stability of a given colloidal system can be predicted by
cornblliing the attractive and repulsive terms outlined in equations 2.1 - 2.13. The
calcuiations Uivolved are ofien presented in the form of potential energy curves which
relate the interaction potential between two colloidal particles as a function of distance.
Figure 2.3 (a) is a graphical representation of equation 1.8, the effect of increasing surface
potential c m be easily seen. When the distance between the particle centres approaches 4
nm the repulsive energy becomes strong, the energy barrier becomes steeper upon
increasing the surface charge. The van der Waals attractive energy between two
polystyrene particles of equal size is shown in the c u v e below (Figure 2.3 (b)). The
steeper curves reflect the increase in attractive force that accompanies an increase in
particle size. The effect of surface charge on the stability of the system is s h o w in Figure
3.1 (a) which combines the repulsive and attractive terms fiom equations 2.8 and 2.1 1.
The system represented by the top cuve exhibits stability even at small separation
distances, whereas the system represented by the bottom curve is not stable. Figure 2.4
(b) dernonstrates the effect of adding a stenc stabilizer to the system. The drarnatic effect
of the added stabilizer, can been seen at close separation distances between the particles.
The energy barrier becomes large and the system is stable. At these close distances of
separation in the absence of added stabilizer attractive forces would dominate and the
particles would undergo flocculation.
These theoretical calculations provide the fiamework to measure the stability of a
dispersion of particles. They can be used to explain and predict the stability of a
dispersion if an understanding of the properties and particle size are known. These curves

can be used to test experirnental data and provide the fiamework fiom which to
investigate the aggregation behavior of dispersions. First the system consists of prirnary
particles that are stabilized with a mixture of anionic/nonionic surfactant, destabilization
is induced by addition of cationic surfactant. The caiculated curves provide a means of
determinhg how the system should respond if the parameters involved in the calculations
are known or can be determined fkom expenment. Further consideration of stabilizer
behaviour and selection will be outlined in the next section.

Interparticle separation, nm
O 4 8 12 16
interparticle separation, nm
Figure 2.3 (a) Electrostatic Repulsion Energy as a Function of Surface Potential for a PS Latex System r = 0.1 prn, T = 25 OC: (1) 40 mV, (2) 60 mV, (3) 80 mV (b) van der Waals Attraction Energy as a Function of Particle Radius, Al 1 = 1.95 x 1 J, T = 25 OC: (1) 50 m, (2) 100 MI, (3) 150 nm.

O 4 8 12 16
lnterparticle separation, nm
lnterparticle separation, nm
Figure 2.4 (a) Total Interaction Potential of a PS Latex System, r = 0.05 p, A t j l = 1.95 x ~ o ' ' ~ J . T = 2 5 OC: (1) 80 mV,(2) 60 mV, (3)40 m V ( b ) EffectofStenc Layer Thickness, r = 0.05 pn, AljI = 1.95 x 10-l9 J. T = 25 O C : (1) 2.25 nm. ( 2 ) 2.90 nm. (3) 3.45 m.
2.1.7 Effect of Added Stabilizers
The adsorptior. of nonionic surfactants on a particle surface force the shear plane
away fÏom the surface reducing the zeta potential relative to the Stem potential.
Adsorbed nonionic surfactant gives rise to a steric barrier on the particle. The stenc layer
is composed of both surfactant molecules and, in the case of polyethylene oxide
nonionics. a highly ordered water layer. The plane of shear is then effectively moved
M e r fiom the surface of the particles.
If the potential energy barrier is large compared to the thermal energy (kT) of the
particles, the system is kinetically stable. For larger particles, flocculation into the
secondary minimum may have observable effects. The stability of a colloidal system can
be manipulated by changing the solvent or temperature. Changing these variables can
modi@ the interaction potential from virtually hard sphere repulsive to moderately
attractive. For a particle size of 100 nm, the change fiom strong repulsion to attraction in
the dispersion occurs only within a srnaIl temperature or pressure range.

2.2 Surfactants
Surfactants are a class of rnolecules that have a unique chemical structure. These
molecules consist of a hydrophobic non-polar portion bonded to a hydrophilic polar
portion. There are three major types of surfactants: anionic, cationic, and nonionic. This
classification scheme is based on the nature of the hydrophilic portion of the molecule.
Surfactants have been used in product formulations for centuries &om primitive
inks and paints to modem detergents and medicines. Several fields rely heavily on the use
of surfactants including: detergency, enhanced oil recovery, and pharmaceutical
industries. Surfactants are most widely employed for their ability to lower the interfacial
energy. A cornmon example of a surfactant is soap. Natural soaps are the sodium salts of
fatty acids. One of the disadvantages of these materials is îhat diey are converted into
insoluble magnesium and calcium salts in hard water.' This lirnits their effectiveness in
the area of detergency. This phenornena lead to the development of synthetic soaps or
surfactants.
One of the defming features of surfactant solutions is the critical micelle
concentration or CMC. This is the concentration of surfactant in solution above which
addition of more surfactant results in the formation of rnice~les.~ The structure of a
micelle is described below. At the CMC several properties of the bulk solution also
change, including: density, solubility, osmotic pressure, conductivity and light scattering
ability. At the CMC the addition of M e r surfactant to the solution does not increase the
fiee surfactant in solution but gives rise to additional micelles. The consequence of this
equilibriurn is that the surface properties of the solution remain relativeiy constant.
2.2.1 Micelle Definition and Energy Description
in a micelle, hydrocarbon chahs are shielded fiom water; the entire structure as
seen by water is hydrophilic and compatible. However, detailed consideration of micelle
eeometry indicates that the rnolecular chahs are more "randomly" arr-mged throughout C
the micelle interior, Le. they are not totally shielded by the head groups in typical systems.
For micelles to fom, the Gibbs fiee energy of their formation has to be negative
(Equation 2.14). Individual surfactants have a characteristic concentration range in which
micelles form, this indicates that there are both positive and negative contributions to the
Gibbs fkee energy of formation:
where
AH = enthalpy contribution, .i
AS = entropy contribution, J K" .
Upon rnicellization, the hydrophobie parts are shielded (AH negative) but polar
head groups are brought close together. This gives rise to a positive interaction energy
between the head groups of ionic surfactants. The entropy of the surfactant upon
micellization will be negative, consequently there is a need for a sufficient change in
enthalpy for the overall reduction in fiee energy.
There is a contribution fiom the solvent on the micellization process. The effect is
greater in water than in less polar solvents. The nature of the volume available to the

solvent molecules changes in such a way as to increase the entropy of the solvent, since
prior to micelle formation, these molecules were tightly associated to the polar or ionic
head in the surfactant.
However, the inability of srna11 solvent molecules to penetrate the relatively large
solute-molecule domain reduces the entropy of the solvent molecule near these domains.
ïhe decrease in total entropy of the solvent is approximately proportional to the overall
area of the solute domains. Micellization reduces this area, therefore entropic effects of
this sort favour micekation. It is clear entropy changes for both surfactant and water
must be considered in calculating the fiee energy of micelli~ation.~
Water molecules form structured clusters around hydrophobic molecules ( i.e. they
become ordered ). The entropy of these stnictured water layers are lower than they are in
the bulk solution. Upon the formation of micelles, these water molecules are released into
the bulk solution with a subsequent increase in entropy. At higher temperatures, energy
effects usually dorninate and enthalpy is negative.
The CMC decreases and the aggregation nurnber (the nurnber of individual
surfactant molecules within a micelle) increases with increasing hydrophobic chah length
and increasing salinity. Both of these effects cause the surfactant to become less
hydrophilic. Increasing the salinity increases the screening of the charges associated with
the ionic head groups; this lowers the CMC considerably. The presence of branches,
chahs, or double bonds has the opposite effect and hinden micelle formation increasing
the CMC .

2.2.2 Nonionic Surfactants
The most fiequently used nonionic surfactants are prepared by adding ethylene
oxide to long chah hydrocarbons with temiinal polar groups (OH, COOH). Ethylene
oxide adducts were first patented in 1930. These surfactants are produced by the reaction
of ethylene oxide with a reactive hydrogen atom on the hydrophobic moiety as illustrated
by the reaction mechanism belowl':
'O'
X is one of the following species: NH, O, or S.
R is an alkyl or allcylphenyl group
The ethoxylation is carried out in the presence of catalysts. The quality of the
product depends on the purity of the ethylene oxide and starting materials. *fie major
impurity in commercially produced products are polyglycols. These are forrned by the
reaction of water with ethylene oxide. Commercial products produced in this fashion
generally do not exist in pure fom.
The CMC's are much lower for nonionic surfactants than ionic surfactants with
comparable chain lengths, as illustrated by the following values at room temperature: 6.8
x 10" M for C,?EO, (EO represents one ethylene oxide unit) versus 8.0 x IO-' M for
anionic sodium dodecyl sulfate (SDS). ' ' The electrical repulsion between head groups
strongly opposes micelle formation for ionic surfactants. The differences in CMC have a

tremendous impact on the properties of a system depending on the particular requirements
of the surfactant.
2.2.3 Cloud Point Temperature
Sensitivity to temperature is a distinctive feature of nonionic micellar solutions.
These solutions become turbid beyond the so-called cloud point temperature. This
temperature marks the condition where a surfactant rich liquid begins to f o m in
equilibrium with the rnicellar solution. This phenornenon is a consequence of the
breakdown of hydrogen bonding between the ethoxy groups of the surfactant and the
surrounding water. This was confirmed by experiments that compared the molecular
volume occupied per surfactant molecule at different temperatures. ï h e cloud point can
be manipulated by changing the length of the polar portion of the molecule. Ln contrast,
the CMC is far more sensitive to the number of carbon atoms in the tail than to the
number of ethoxy groups. Understanding Cloud Point behaviour is an important
consideration when selecting a particular surfactant for an application.
The -'head group" is the polar or ionic portion of a surfactant molecule. This
group is easily solvated and can have specific interactions with the solvent including:
solvation, dipole-dipole, ion-dipole, and in polar solvents hydrogen b ~ n d i n ~ . ~
The Kraft Temperature or Kraft Point is the temperature at which the solubility of
a surfactant becomes equal to the CMC. h other words the solubility of individual
surfactant molecules in the solution is equal to the CMC of the s~rfactant.~

The lifetime of a swfactant molecule in a micelle is of the order of 1 x IO-'
seconds. This reflects the dynarnic nature of micelles; there exists a constant interchange
of individuai surfactant molecules between micelles and solution.
2.2.4 HLB Classification
One of the primary means of c l a s s img nonionic surfactants is through the
hydrophilic-lipophilic balance or HLB classification scheme. This is an ernpirical
classification fint developed by ~riffen.' A number assignment is calculated based on
the weight percent of hydrophilic portion of the molecule. Features such as solubility and
micelle forrning behaviour can be derived fiom this classification. For the nonionic alkyl-
aryl polyethylene oxides the following simple formula (Equation 2.16) can be used to
calculate this parameter:
weight % POE glycol HLB =
5
The HLB classification of some representative commercial nonionic nonylphenol
polyethylene oxides are shown in Table 2.1.

Table 2.1 Selected HLB Values of Nonionic Surfactants
IGEPAL CO-720
IGEPAL CO-850
IGEPAL CO-880
IGEPAL CO-890
Nonionic surfactants may interact with the surface through one or a combination
of the following mechanisms: hydrogen bonding, adsorption by polarization of rr
electrons, van der Waals dispersion forces, and altemating hydrophobic bonding.
Alternating hydrophobic bonding may result when the surfactant chahs orient thernselves
so that their respective head groups are joined. This then allows two separate tail sections
to interact with the surface. Surfactants which contain an aromatic ring in the
hydrophobic region may exert specific interaction with nonpolar solids.
2.2.5 Applications
Main fields of domestic and industrial applications that employ the use of
nonionic surfactants include: detergents, cleaners, cosmetics, textile, leather, fur, oit, and
plastics. As a general guide, the application of a pmicular surfactant can be generally
classified according to the nurnber of ethoxy groups in the polar portion of the molecule.
The HLB classification outlined above can be considered a general guide for applications:
5-6 are suitable as emulsifiers for hydrocarbons. 8- 12 for wetting agents and detergents,

12- 15 in dispersing agents. For a constant chah length o f hydrophobie groups the
products range fiom waxy, pasty to iiquid which is a function of the length of the
hydrophilic portion of the molecule.

2.3 Adsorption Isotherms for Nonionic Surfactants
For an understanding of surfactant behaviour and design it is equally important to
characterize the material with which the surfactant will interact. Throughout the literature
the terni adsorbate is used to designate the matenal which the surfactant adsorbs on. The
term adsorbent is reserved for the species that is adsorbed. Adsorbates can be classified
into two general categones depending on the nature of the surface. Hydrophilic or polar
adsorbates are matenals with surfaces containhg ionogenic sites or dipolar molecular
groups including hydroxyl or carbonyl. These matenals ofien have a hi& a f i t y for
water; examples include silicates. inorganic oxides, hydroxides, and natural fibres. The
other broad category of adsorbates are "low energy" or "non-specific", since they interact
with adsorbate through van der Waals dispersion forces rather than the more specific and
generally stronger dipolar or electrostatic forces. Examples of non-polar adsorbates
include: carbon blacks, organic pigments, and some polymers.
The surface properties of the solid substrate depend on the treatment and additives
used during the manufacturing process. For this reason it is highly desirable to
characterize the adsorbents as thoroughly as possible. Methods of characterization
include particle sizing techniques and surface analysis. Surface analysis may inctude
conductometric titrations to assess the number and concentration of ionizable groups on
the surface.
Adsorption isotherms can be used to study the adsorption process of surfactants as
a function of surfactant concentration. The isotherms are generally computed by
determinhg the amount of surfactant that is depleted fiom solution due to the adsorption

process. This change in the nurnber of moles of surfactant adsorbed on a unit mass of
solid is given to a good approximation by Equation 2.16."
where
4 = number of moles of sufactant adsorbed on a unit mass of solid. mol
rio = total number of moles of solution before adsorption, mol
Ax2 = change in mole fiaction of surfactant resulting fiom adsorption
m = mass of insoluble adsorbent, g.
2.3.1 Methods for Evaluating Surfactant Concentrations
There have been nurnerous different approaches to determinhg the change of
surfactant concentration in solution upon adsorption. Most of them ùivolve a priori
calibration of the surfactant at the appropriate experimental concentrations involved.
Some of the more fiequently used methods include: changes in refractive index, UV
absorbante, surface tension, innared spectroscopy, and radio-tracer techniques.
As previously rnentioned, cornmercially produced surfactants contain a mixture of
isomers. The extent of polydispersity m u t be taken into consideration when calculating
an isotherm. Depending on both the substrate and the solution conditions this may result

in preferential adsorption of one of the isomeric species. tsotherms that exhibit this type
of behaviour tend to deviate fiom their expected concentration dependence.
An alternative expression for describing the amount of surfactant adsorbed for less
well defined surfaces is the surface excess which can be calculated fiom Equation 2.17:
where
TI= = arnount adsorbed, mol m-'
4 = number of moles of surfactant adsorbed, mol
As = surface area of substrate, m2.
The surface area of the rnaterial c m be determined by a variety of techniques; one
of the most comrnon is the BET adsorption isotherm named after Brunauer, Emmett and
Teller. The limitation of this technique is that the surface area is calculated on the basis
of the area occupied by inert gas molecules (usually nitrogen). This area is not equivalent
to that accessible to the surfactant due to the difference in molecular geometry.
Consequently there exists some uncertainty on the calculation of the surface excess.
2.3.2 Shape of Isotherms
Adsorption isotherms for nonionic surfactants are generally Langmuir-type
isotherms and have the general structure illustrated in Figure 2.5.

Figure 2.5 Idealized L4 Type Isotherm for Adsorption of Nonionic Surfactants at the SoIid/SoIution Interface (after Parfin and Rochester 1983).

The plateau found in A is only relevant to a few systems. The dificulty
encountered in this region of the isotherrn is to accurately assess the small concentrations
of surfactant involved. The idection and sharp increase in adsorption at B occurs at bulk
solution concentrations that are close to the CMC of the surfactant. This is followed by a
second plateau in region C. The molecular structure of the surfactant significantly
influences the shape of the isotherm in many ways. Increasing the length of the
hydrocarbon chah generally increases the magnitude of the maximum adsorption for a
given hydrophobic substrate. This is usually due to the combination of increased solute-
surfactant interactions coupled with increased tail-tail interactions afier the adsorption has
taken place. The opposite effect is observed on increasing the size of the polar head
group. This c m be explained by an increased steric demand of the hydrophilic portion of
the molecule coupled with their increased affinity for the solvent (Le. as the proportion of
the rnolecule that is soluble is increased the greater the tendency for the surfactant to
remain in solution). The relationship may not hold for substrates with polar surfaces
where the adsorption of nonionics on the substrate occurs with the hydrophilic or "head-
group" of the surfactant oriented towards the surface to the substrate.
Comrnercially produced surfactants exhibit similar isotherm shapes at high surface
coverage in al1 cases. Adsorption reflects the same hydrophilic/hydrophobic forces that
drive self-assembly of the micelles in s~lut ion. '~ Isotherms for the adsorption of
nonionics at the solid Iiquid interface are observed to plateau at concentrations in excess
of the CMC. Generally it is believed that the mixture behaves in a similar manner to the
component that has the average rnolecular weight of the mixture.

The strength of the interaction between the adsorbent-adsorbate can be inferred
fkom the shape of the isotherm. S '-shaped" isotherms are typical, in the limit of low
surface coverage, this represents a weak adsorbent-adsorbate interaction. A sharp
increase in the isotherm is consistent with the onset of a CO-operative adsorption arnong
the surfactant molecules. It has been experirnentally observed that CO-operative
adsorption occurs at lower concentrations in commercially produced surfactants than the
equivalent homogeneous material. Plateau adsorption is reached at one to three times the
CMC of the surfactant.
2.3.3 Steric Layer Thickness
In addition to understanding of the properties of an adsorption isotherm, it is
important to consider the factors that influence the conformation of these materials afier
adsorption is cornplete. The adsorption of surfactant results in an outward movement of
the plane of shear between the solid and solution interface. This can be detected by a
decrease in the zeta potential in the system afier adsorption has taken p l a ~ e . ' ~ Changes in
the thickness of the adsorbed layer are reflected in the plane of shear which can be
detected by measuring zeta potential values within a system.
At low ionic strength, the thickness of the adsorbed layer approaches a limit equal
to the hydrodynamic thickness. '' The electrokinetic thickness at low ionic strength
should approximately equal the steric thickness. Only at low ionic strengths can the
effective slipping plane be identified with the electrokhetic thickness. At high salt
concentrations the electrokinetic thickness is always smaller due to compression of the
double layer resulting fiom a screening of surface charges.

Large repulsive energies occur at slight overlap of the adsorbed layers if the
hydrophilic portion of the surfactant is in a good solvent. This repulsion was discussed
earlier as the stenc stabilization mechanism. Water is a good soivent for polyethylene
oxide head groups, this resdts in strong repulsion and negligible interpenetration of
adsorbed head groups and imparts good stability in the system. The effect of
polydispersity of surfactant samples results in a preferential adsorption of the shorter
chahs. The phenornena was investigated by Kronberg et al. who concluded "'the final
distribution of adsorbed species fiom polydisperse systems may take considerable time.
due to the preferential adsorption of short-chah homologues at equilibrium".'5 Due to
the manufacturing conditions of nonionics there ofien exists a wide EO chah length
distribution that may vaxy considerably behveen dif5erent batches. in order to assess
theoretical trends it is necessary to work with pure materials. With commercial samples
the adsorption isotherms rnay not be reproducible arnong different batches. Thus it is
important to have adequate knowledge of the purity of the materials being used in order to
assess the size and behaviour of the steric layer.
The dependence of adsorption strength on EO chah length, provides an
explanation of the variation in adsorption characteristics between different batches of
nonionic surfactant, the content of fiee polyethylene oxide typically varies between
3 %-8 % by weight in commercial samples. For nonionic surfactants with 20 and 50 EO
units al1 isotherms reach a plateau value at solution concentrations correlating with the
CMC's of the surfactants. l 5
Isotherm plateau coverage reflects the affmity of the hydrophobic moiety of the
surfactant to a non-polar environment. This plateau coverage usually occurs when the

concentration of the surfactant in the solution has reached a value of 85-90 96 of the CMC
of the surfactant under consideration. With technical p d e surfactants it is difficult to
establish theoretical trends. The affinity of the ethylene oxide chah to the particle may be
influenced by the presence of carboxylic groups which hydrogen-bond with ether oxygen
atorns. The standard fiee energy of adsorption becomes less negative as the ethylene
oxide chah length is increased. Anionic SDS has a much lower affinity to non polar
sufaces than nonionics. Nonionics adsorb more strongly and can displace anionics fiom a
surface.I6 This is anticipated by considering their respective CMC values which reflect
the a&ity of the surfactant to dissolve in solution. Surfactants have the ability to modiQ
the interface and prornote dispe:sion between unlike phases. Ionic surfactants also have
the ability to impart a charge to a neutral surface. in the next section the importance of
measuring and understanding the effect of surface charge will be discussed.

2.4 Acoustophoresis
One of the primary rneans of measuring charges on colloidal particles is to
evaluate the zeta potential. There are several methods available to perform these
measurements; one of the more versatile is the technique of acoustophoresis. The
technique of acoustophoresis c m be used to characterize colloidal dispersions of Ioadings
up to 50 % by volume. Acoustophoresis utlilizes the interaction of sound waves with the
electrically charged colloidal particles to detemine the relative acoustic mobility (RAM).
This value can subsequently be converted to a zeta potential. The technique is based on
the phenornena that particles in solution are surrounded by diffuse ciouds of ions known
as the "double layer". When this layer is subject to an altemating acoustic field it
becomes polarized and the particles move with respect to the field (see Figure 2.6).
2.4.1 Principles of Operation
Separation is induced between a colloidal particle and its surrounding diffuse
double layer through the interaction with sound waves. This results in an altemating
potential termed the colloid vibration potential (CVP). The CVP is several orders of
magnitude greater than the related ion vibration potential (IVP) which was predicted and
discussed by Debye in the 1930's.

PROPAGATION
DIRECTION
Figure 2.6 Schemaiic of Acoustophorectic Mechanism (after Marlow and Fairhurst, 1988).

The CVP is dependent upon the following characteristics of the colloid: (i) zeta
potentiai (ii) particle concentration, (iii) fiequency of the acoustic wave, and (iv) the
nature of the supporting electrolyte.
Acoustophoretic measurements are given in units of Relative Acoustic Mobility
(RAM). in order to perform a measurement. the machine is calibrated using a zirconium
oxide colloid at pH 4. The charge on the particles is unarnbiguousiy positive at this pH.
Al1 subsequent measurernents are based on this reference including phase detection and
absolute magnitude of the signal. The zeta potential is rclated to the RAM according to
Equation 2.18.
where
4 = zeta potential, V
P I = fluid density, kg m"
Pz = particle density, kg m"
E = pemittivity of fiee space, kg-' m" s4 A'
rt = fluid viscosity, Ns rn"
0 = volume fraction of the particle
D = Dielectric constant.

The volume fraction of the particles cm be easily calculated fkom their weight
fiaction according to Equation 2.19:
where
P 1 = fluid density, kg rn"
P2 = particle density, kg m-'
x = particle weight fraction
4) = volume fhction of the particle.
2.4.2 Electroacoustics
As rnentioned previously, electroacoustics involves passing a hi& fkequency
sound wave through a colIoidal sus~onsion. The wave fiequencies are usually on the
order of several hundred kHz. The sound wave causes the particles to oscillate with the
same frequency.
The particle motion can be detected because it gives rise to an altemating
electncal signal. The signal arises because in addition to the very low amplitude motion
of the particle, there is a larger rnovement of the ions associated with the double layer.
Since the fluid can respond to the pressure wave more quickly than the particle (if pz > pl)
a small dipole is generated. The presence of many such dipotes in the suspension, al1

pointing in the same direction, creates a macroscopic electnc field. This field can be
detected by placing two electrodes in the suspension positioned at the peak and trough of
the sound ~ a v e . ~
Cornpressional sound waves give nse to a penodic polarkation of the ionic
atmosphere surrounding the particles, causing each particle to act as a vibrating dipole
which results in an altemating voltage. This altemating voltage is the CVP mentioned
above. During this phenomena double layer relaxation is the dominant process. A more
cornplete description of the phenomena is outlined below.17
2.4.3 Advantages of Electroacoustics
The Pen Kem systern is highly versatile and offers several advantages over
traditional electrokinetic techniques. Some of its more salient features Uiclude: ability to
operate within a wide range of particle sizes (nm to pm), sample concentration ranges
fiom as low as ppm to volume f i l h g systems, and adaptability to on-line measurements.
Measurements can be applied to a wide range of materials including opaque,
photosensitive or mobile living organisms.
The interaction of sound waves with particles has been studied for decades. The
well known Debye Eflect was first proposed in the 1930's.'' The general prernise is as
follows: dynarnic reactions of ions in an ultrasonic field will be difTerent for ions of
different nasses. The relative displacement of anions and cations produces a separation
of charge accompanying the sound wave, resulting in a potential difference.

Further study in this field by Hemans, Rutgers and Enderby indicate the CVP is
dependent upon the following characteristics of the system: zeta potential, concentration
and nature of the particles, fiequency of the acoustic wave, and supporthg electrolyte
nature and concentration. ' ' The sound source m u t be able to generate a monochromatic, plane progressive
sound wave, whose wavelength mut be much greater than the radius of the particles in
order to promote the harmonies necessary for signal generation. The fluid will respond to
the sound wave by varying harmonically and it will transfer its momenturn to the particle
through 'î&cous coupling" resulting in the same harmonica1 motion for the particles.
Due to the difference in density between the two mediurns the particles will experience
"relative" harmonic motion with respect to their surrounding aqueous environment. In
order for this process to be effective, the double layer relaxation time must be less than
the period of oscillation of the sound wave. Th~s aliows the particles to reach a steady-
state prior to disturbance fiom the next wave.
The polarization of the electric double layer is a dynamic process. Le. the electric
field is measured as a function of time. in an acoustic field the double layer ions lead the
particle, and the theory assumes that the penod of the acoustic wave is much greater than
the dynamic relaxation time of the particle as well as the double layer relaxation time.
That is to Say, the particles and their surrounding double layer have relaxed prior to being
disturbed by the next portion of the sound wave.
The CVP is the signal generated in the receiver by the peak amplitude of the
altemating potentiai of the particles, when the electrodes are separated by U2. The

moment of each dipole is proportional to the zeta potential and the relative velocity
between particle and fluid as described by Equation 2.18.
Retardation is a phenornena that stems fiom the fact that polarization of the double
layer ions result in an induced electric field. The induced electric field opposes particle
motion. This is important for small particles that are highiy charged in a media of Iow
conductivity where the double layers of the particles would be extremely thick ( 10 < Ka <
LOO). It is important to have a method to measure the surface charge of particles to gain
an understanding of the factors contributhg to the stability. The effect of surface charge
in relation to colloid stability has been mentioned earlier in section 7.1 and will be
discussed fUrther in the next section.
2.4.4 Electrical Nature of the Solid-Liquid Interface
The electrical charges on a surface are often the most important factor which
govem the adsorption at the solid liquid interface. This property becomes highly
important when there is an electrical interaction between the ion and the surface.
This picture c m be somewhat complex because the surface usually presents an
uneven charge distribution normal to the surface. The solid surface may contain groups
whose ionic properties are dependent on pH and temperature, this is often the case with a
large nurnber of inorganic oxides. Due to the p ~ c i p l e of electroneutrality, the net charge
on the solid surface m u t be efiectively neutralized by an opposite charge close to the
interface in solution.

CHAPTER 3. EXPERIMENTAL
3.1 Materials
3.1.1 Nonionic Surfactants
The nonionic surfactants used in the study were supplied by Rhône-Poulenc's
Surfactants and Specialities Group of Cranbury, New Jersey. They are commercially
produced surfactants with a polydisperse size distribution. The surfactants are listed in
Table 3.1 along with some of their physical characteristics. These surfactants were
chosen primarily because of their widespread use as stabilizers in commercial colloidai
systems.
Table 3.1 Nonionic Surfactants and Pbysical Data.
Trade Narne Nurnber of EO units Appearance @ 25 O C Molecular Weight
Igepal CO-720 12 hazy viscous liquid 748
Igepal CO-850 20 soft wax I l00
Igepal CO-880 30 waxy solid 1540
Igepal CO-890 40 waxy solid 1980
Igepal CO-970 50 hard waxy solid 2420

Table 3.2 Absorptivity Data for Nonionic Surfactant, h = 174 nm.
Trade Name Molar Absorptivity.
L mol-' c d
Igepai CO-720 1400
Igepal CO-850 2700
Igepal CO-880 1300
lgepal CO-970 1600
3.1.2 Ionic Surfactants
Two types of ionic surfactants were employed in this study. A cationic
teaadecyltnmethylammonium bromide (TTAB) [C ,,H2,N(CH3)$3r was purchased fiom
sigma" Chernical Company of St. Louis, Missouri. This matenal is a white powder and
has a reported 99.9 % pur@, it was used as received. The anionic surfactant was Sodium
dodecylsulfate (SDS), Electro Pure, [C,2H2,0S03]Na and was purchased fiom
Polysciences of Warrington, Pennsylvania. This matenal is also a white powder and was
used as received.
3.1.3 Carbon Black
The carbon black used in a11 the adsorption studies was sterling@l 120 (ST1120)
produced by Cabot Corporation. The powdered sample has physical characteristics as
Listed in Table 3.3.
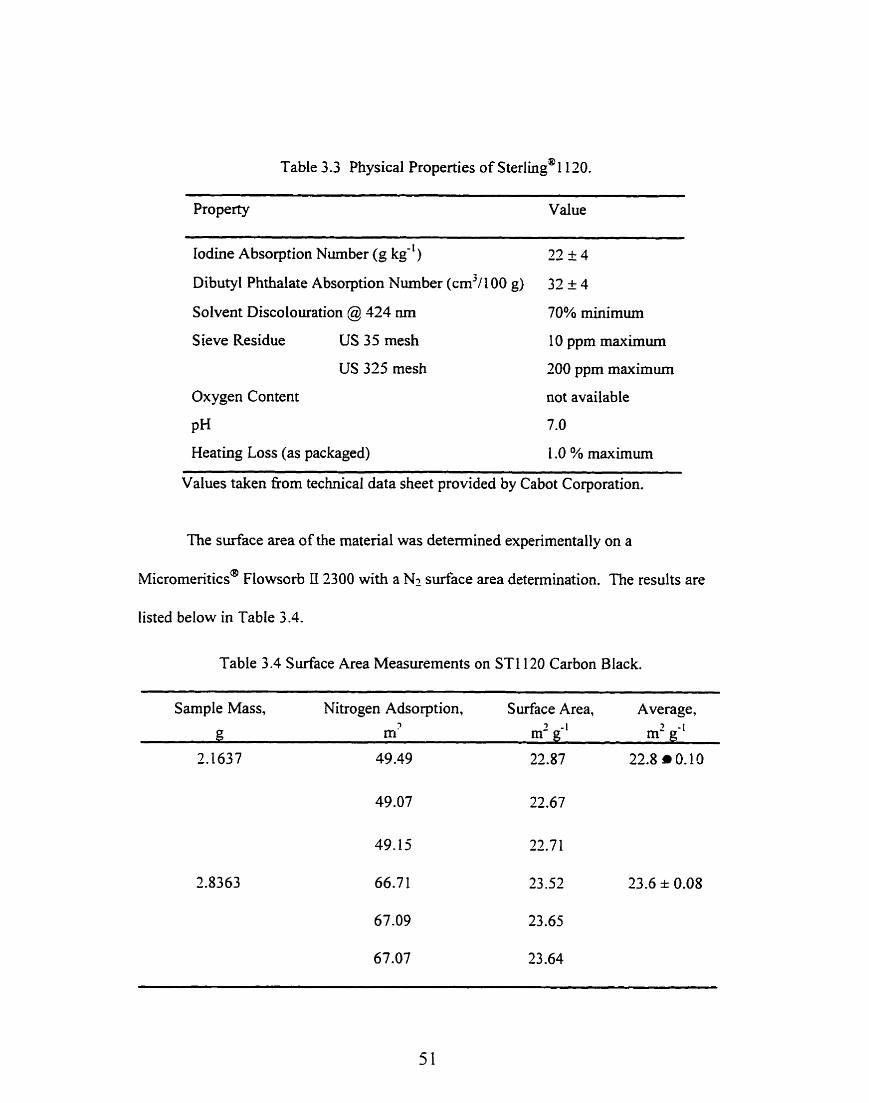
Table 3.3 Physical Properties of ~terling'@l120.
Property Value
Iodine Absorption Nurnber (g kg-') -- 77 + 4 -
Dibutyl Phthalate Absorption Nurnber (cm3/100 g) 32 f 4
Solvent Discolouration @ 124 nrn 70% minimum
S ieve Residue US 35 mesh 10 ppm maximum
US 325 mesh 200 ppm maximum
Oxygen Content not available
PH 7.0
Heating Loss (as packaged) 1 .O % maxirnun
Values taken fiom technical data sheet provided by Cabot Corporation.
n i e surface area of the matenal was determined experimentally on a
~icromeritics@ Flowsorb II 2300 with a Nz surface area determination. The results are
listed below in Table 3.4.
Table 3.4 Surface Area Measurements on STI 120 Carbon Black.
Sarnple Mass, Nitrogen Adsorption, Surface Area, Average,
g rn' ' - 1 m- g
2.1637 49.49 22.87 22.8 O. 1 C)

Carbon black is classified as an arnorphous carbon and is characterized by an
imperfect or degenerate graphite structure. These materials have physical properties in
the following ranges: specific gravity 1.86-2.04, carbon-carbon bond distance 0.142 nm,
and interlayer spacing distance of 0.365 m.'' This material was chosen for adsorption
studies because of its uniform hydrophobie surface.
3.2 Adsorption Isotherm Preparation
A controlled amount of adsorbent was dispersed in aqueous solution, using
distilled water or deionized distilled water (DDW). This was accomplished by adding 30
g of powdered carbon black to 1.5 L of water. This solution was then stirred at 200 rpm
using a Janke & Kunkel mechanical stirrer to ensure a homogeneous mixture.
Subsequently 30 mL of this continuously stirred solution was pipetted to a screw cap
centrifuge tube (capacity 50 mL).
Controlled incremental arnounts of surfactant were added to the tubes. Distilled
water was added to each tube to make the final volume up to 40 mL. Each adsorption
curve was composed of 8-10 points whose concentrations were selected to encompass the
surface saturation of the solid adsorbent.
The tubes were then rolled on a colloid roll mi11 for 12-1 5 hours to ensure that the
adsorption equilibrium had been reached between the particle surface and the solution.
To separate the particles fiom the supernatant, the sarnples were centnfuged for one hour
at 10,000 rpm ushg a Milton-Roy MR 1 8.22 centrifuge. Any remaining particdates were
removed during a subsequent filtration step through a cellulose nitrate filter with an
average pore size of 0.05 Fm.

3.3 Surfactant Analysis
3.3.1 Nonionic Analysis
The UV-visible analysis of the supernatant was performed using a Hewlett
Packard 8452A diode array spectrophotometer. The absorbance of the solution was
measured at 274 nm, the wavelength at which the aromatic portion of the nonionic
surfactant exhibits a strong absorbance signal. The measured absorbance values were
converted into concentration values by means of a calibration curve. The calibration
c u v e was prepared to encompass al1 concentration ranges encountered during the course
of the adsorption studies. An individual curve was prepared for each nonionic surfactant
to account for changes in molar absorptivity that accornpany changes in molecular weight.
3.3.2 Anionic Surfactant Analysis
SDS is among a class of compounds known as rnethylene blue active substances
(MBAS). The anionic surfactant combines with the rnethylene blue (a cationic dye) in a
1 : 1 complex formation. Methylene blue exhibits a strong [IV spectnim, and the
concentration of the SDS species in solution can be determined fiom the stoichiometry of
the reaction.
The anionic surfactant was analyzed by first coupling it with methylene blue dye
then extracting this complex into chloroforrn. This reaction occurs through a 1 : 1 ion pair
formation by the surfactant anion and the methylene blue cation. The intensity of the
resulting blue colour (at 652 nrn) in the chloroform phase is a measure of anionic
surfactant concentration. The amount of surfactant adsorbed in p o l g'l was calculated
by determining the change in the nurnber of moles between the initial and equilibriurn

surfactant concentration. This technique was adopted fkom a method used in the analysis
of surfactants in wastewater.19 The method relies on the strong interaction between the
ionic head groups of the dye and surfactant. The ion-pair forms a large organic molecule
which is easily removed h m the aqueous solution by extraction into an organic solvent.
The interpretation of the absorbance values is accomplished by means of a calibration
curve. The calibration curve is obtained by preparing a series of standards and measuring
the absorbance of these standards at 652 nm. Experirnental values are then calculated
based on the regression line fiom the calibration curve. A üV spectrum of the
SDS:Methylene Blue complex is illustrated in Figure 3.1.

Methylene Blue:SDS Complex Signal
\
100 200 300 400 500 600 700 800 900
Wavelength, nm
Figure 3.1 UV-visible Spectrum of SDS:Methylene Blue Complex.

3.3.3 Cationic Surfactant Analysis
The anaIysis of the cationic surfactant was carried out using the analytical
technique developed by Tsubouchi et al." The method involves the determination of
cationic surfactmts by a two-phase titratiun. The cationic surfactant solution is treated
with an indicator under controlied pH conditions. The indicator and the cationic
surfactant form an ion pair that is blue in colour. This mixture is then subsequently
titrated with the sodium salt of tetraphenyl borate. Under these conditions the dye-
surfactant complex is replaced by a surfactant-surfactant complex, with subsequent
protonation of the indicator. The protonated indicator has a yellow colour which signals
the end point of the reaction. Knowing the concentration of the anionic surfactant in the
titrant solution the amount of cationic surfactant cm be determined. The reaction can be
represented accordhg to Equation 3.1.
blue yellow colourless
where
CAS' In O, w
- cationic surfactant - indicator - organic or aqueous phase respectively.

3.4 Pen Kem 7000 Acoustophoretic Titrator
Acoustophoresis experiments were performed using the Pen Kern 7000
Acoustophoretic ~itrato? As described in the introduction, this technique exploits the
interaction of sound waves with the electical interface. The device measures the relative
acoustophoretic rnobility (w of the sample. These values can be converted to zeta
potentiai values if the density and volume percent of the colloid are known.
The samples were prepared at 2-5 % solids by weight. This was accomplished by
weighmg the ST1120 particles into a 1 L Nalgene screw top bottle and adding a
controlled amount of surfactant. The sample was then made up to volume with distilled
water. Washed zirconia grinding media were added to the bottle which was then placed
to roll on a colloid mi11 for a minimum of 15 hours. After equilibration of the particles
and surfactant, the sample could be measured. A minimum of 250 rnL of solution is
required to perform a single experiment. If the experiment does not involve caIculations
of surfactant arnounts, accurate volumes are not necessary provided al1 probes on the
measuring unit are sufficiently submerged for data collection.
In addition to acoustophoretic rneasurements the unit is equipped with
conductivity, pH and temperature probes. These probes allow for m e r characterization
of the sample during the course of an experiment. An automated burette can also be
employed to add reagents such as acid, base or surfactant solutions to the sample.
Experiments were conducted in "titration" or "time mode". in time mode the
instrument simply monitors the properties of the colloid as a function of tirne. The
measurement intervals are operator controlled. In titration mode. measurements are

generated as a function of added reagent. Both the volume and mixing time during the
titration can be set by the operator allowhg for flexibility in experimental design and data
collection. Experiments on carbon black solutions were made in both titration and time
mode.
3.5 Pen Kern 501 Zeta Meter
Electrokinetic measurements were performed ushg the Pen Kern 50 1 Zeta
~ e t e r ? This instrument measures the electrokinetic potential of the sarnple. The sarnple
is placed in a quartz chamber and a voltage is applied. The particles migrate in response
to the applied potential, and are illurninated with a laser bearn and monitored with an
optical microscope. Adjustments are made to keep the particles motionless in the applied
tield, the zeta potential of the particles can then be read fkom the digital display. The
sarnple volume of the chamber is approxirnately 25 mL. The concentration of the colloid
should be in the following range; 1 o6 to 1 o9 particles cm", shce this allows for optimal
passage of the laser light while permitting suscient particles to establish a consistent
signal. The colloidal dispersions had to be diluted pnor to measurement. Where possible
this was accomplished by diluting with the mother solution from which the dispersion had
been prepared.
This instrument was used in conjunction with the Pen Kern 7000 system as a
check on the stability of the systems. The advantage of this instrument was that it was
able to provide unambiguous assignment of positive or negative charge to the particles
under study. One of the limitations of this device was the diEculty in recreating the
background supernatant solution fiom which the particles were taken. Values were

recorded by takmg five individual measurements. the mean of the these values was taken
to represent the zeta potential. The systems studied included nonionics with variable
hydrophilic chah lengths, anionic and cationic systems at dif'ferent concentrations and
mixed surfactant systems adsorbed on ST I 1 20.
3.6 Conductivity Experiments
The CMC's of TTAB and SDS were determined experimentally through the
measurement of conductivity in aqueous solution. The conductivity was recorded during
the titration of DDW with a concentrated surfactant solution. The CMC is determined by
a change in the dope of the conductivity curve that occurs at the onset of micellization.
The solutions were titrated in a themostated ce11 and repeated in triplicate. Additional
experiments were performed to investigate the change in conductivity that occurs during
the rnixing of ionic surfactants. These experiments were usehl for providing information
regarding the strength of the formation of the "pseudo-nonionic" complex fonned from
the interaction of the two ionic surfactants.
3.7 Aggregation Studies
Sarnples for aggregation studies were prepared by rolling ST 1 120 at 3 wt % solids
in grinding media and excess anionic surfactant. After equilibration the solution was
placed in a ta11 graduated cylinder to allow the larger size aggregates to settle out of
solution. Incremental arnounts of cationic surfactant were added to this solution to
encompass the CMC of the cationic surfactant. Any change in the particle size
distribution was monitored using an optical microscope.

The ST 1 1 20 particles mixed with SDS appear unifom and stabilized. Variable-
sized aggregates do not appear visible under this magnification. Microfiltration of this
dispersion with cellulose nitrate filter pore size O. 1 pn does not remove the smallest
particles fiom solution. M e n the pore size of the filter is changed to 0.05 p al1 of the
particles are removed nom solution. This was confirmed by measuring the W-spectra of
the filtered solution which did not reveal any scattering caused by particles remaining in
solution.
3.7.1 Zeta Potential Measurements of Ionic Surfactants
A solution of anionically stabilized particles was prepared (50 mi, of SDS mother
solution concentration = 2 x IO-' M, 3 g of ST1120 carbon black, and 950 mL of distilled
water) and controlled arnounts of cationic surfactant solution were added. Observations
to the final state of aggregation were made.
Controlled addition of SDS to the particles was accomplished by adding the
surfactant solution to 30 mL of 0.03 wtiwt solution of ST1120. The volume was made up
to 40 rnL with distilled water. Solutions were equilibrated for 24 hours prior to
measurement. Initial measuring attempts revealed the samples were too concentrated to
be used in the PenKemSO 1 system. Samples were diluted by pipetting 1 mL of the
surfactant mixture and adding 39 mL of distilled water. The resulting solutions were in
the appropriate particle concentration range to make measurements.

3.7.2 Image Analysis Work
Samples were prepared and stabilized with a variety of surfactant systems. A
limitation of this work is that the lower lirnit particle size detectable by the optical
microscope is around 1 p. The ST1120 particles exhibit a polydisperse distribution
with a significant fiaction of the particles below this lower limit.
3.7.3 Analysis of SDS as a Function of Time
Samples were prepared at 10 wt % solids with an initial SDS solution
concentration of I x 1 0 ' ~ M. TTAB cationic surfactant was added at 0.8 molar ratio to
SDS and the dispersion was rnixed under hi& shear (4000 rpm) for 60 S. This solution
was then transferred to a beaker and mixed at a constant stirring rate of 200 rpm. Samples
of this solution were taken at intervals of 1 hour over an eight hour penod. These samples
were analyzed for the concentration of £iee SDS to determine the effect of time on the
adsorption of SDS.

CHAPTER 4. RESULTS AND DISCUSSION
4.1 Adsorption Isotherms
The adsorption of nonionic surfactant ont0 carbon black has been studied
' 7 73. 24 previously by several investigators."+ --- The adsorption isotherm plots f?om this
expenmental work have the same shape and charactenstics as curves in the literature. A
direct cornpanson was not possible as the substrates used to conduct the adsorption
experiments were not identical in terms of particle size and surface area. Individual
mixtures of nonionics with STI 120 exhibited complete dispersion of the carbon black
towards the completion of the adsorption for al1 surfactants investigated. The
experimental work of Abe and Kuno was performed using the nonylphenol family of
surfactants with ethylene oxide chahs ranging from five to thirty units."
It is assurned that the surfactants adsorb with their hydrophobic portions oriented
toward the surface of the particles and that plateau coverage is reached upon formation of
a monolayer of surfactant. This is a valid assurnption below the turbidity point of the
surfactant, where the surfactant molecules would undergo micellization upon increasing
the concentration of surfactant in solution. At the turbidity point, a true solution no
longer exists and phase separation occun with subsequent deposition on the surface. The
adsorption process can be further complicated because both surface-hydrophilic
interactions and hydrophilic-solvent interactions must be taken into consideration.
The experimental values obtained from the adsorption isotherm studies on ST1120
are listed in Table 4.1. The calcuiation of saturation adsorption was assurned to coincide

with the formation of a monolayer on the surface of the particles. For the nonionic
surfactants the isotherms follow the anticipated pattern of decreasing arnount adsorbed
upon hcreasing the length of the ethylene oxide c h a h This trend can be explained by the
increased stenc demand of the longer head groups. Plateau adsorption was reached in the
region corresponding with the CMC of the surfactant. One unexpected result was the
higher SDS adsorption. Schwuger and Smoika who completed expenments with
surfactant adsorption onto graphitized carbon revealed similar findings "the saturation
adsorption in the case of SDS is higher than that found for the nonionics examined" the
result was explained by the smaller space requirements for the ionic head groups which
resulted in a higher packing density.16 The experimental adsorption isotherm for CO-850
on carbon black is shown in Figure 4.1 and the isotherm for SDS is given in Figure 4.2.
The adsorption of single surfactants was complemented by mixed adsorption
studies. Mixtures of ionic and nonionic surfactants were studied to investigate the
cornpetitive adsorption behaviour. A plot showing the mixed adsorption of SDS and CO-
720 on ST1120 is shown in Figure 4.3. During this experirnent the total number of moles
of surfactant remained constant, while the ratio between the individual surfactants was
varied. From the plot the total amount adsorbed decreases as the ratio of SDS:CO-720 is
increased. This would suggest that the CO-720 component adsorbs more strongly than
SDS. The adsorbed arnount of CO-720 in this mixed system is higher than the amount
calculated from the individual CO-720 isotherm. A direct cornparison is difficult as the
concentration range in this experirnent was chosen to accommodate the CMC of SDS.
This surfactant concentration range is up to 20 times larger dian the CMC of CO-720.
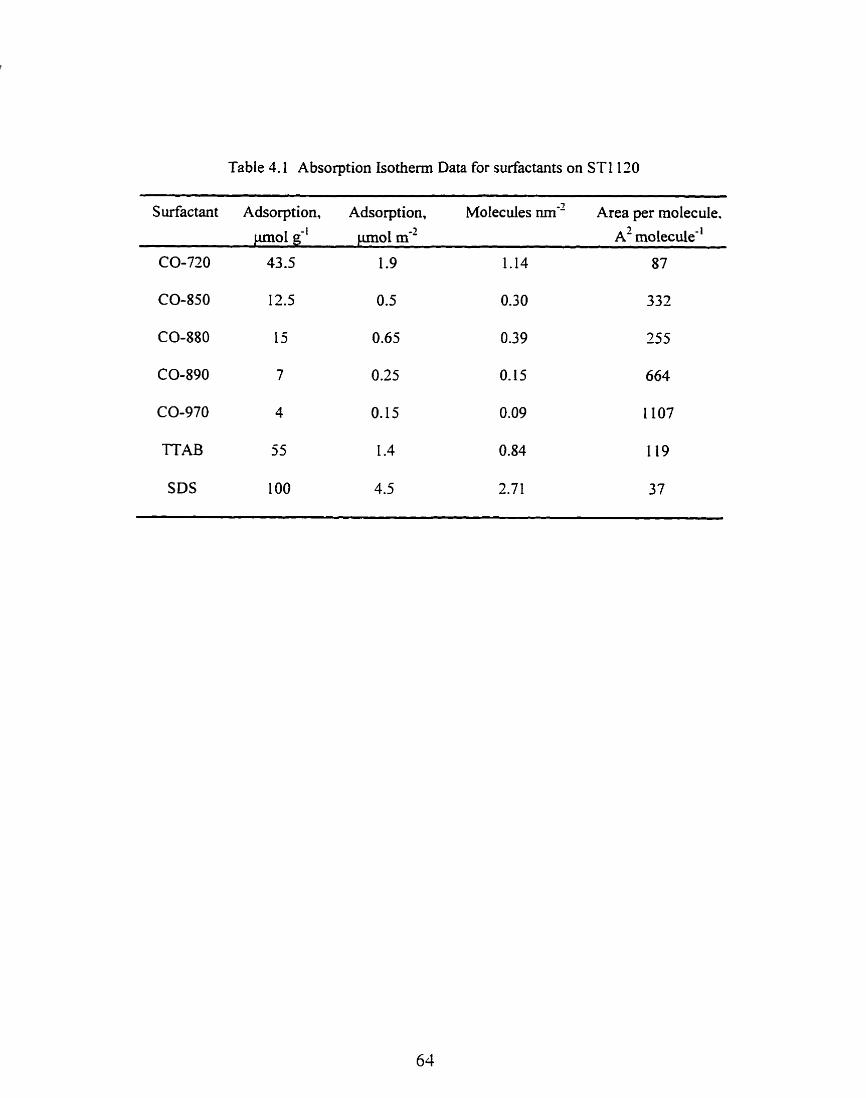
Table 4.1 Absorption Isotherm Data for surfactants on STI 120
Surfactant Adsorption, Adsorption, Molecules nm" Area per molecule.
p o l g-' p o l m-? A' mo leculë'
CO-720 43.5 1.9 1.14 87
SDS 1 O0 4.5 2.71 37

CMC (1.8 x 10' mol 1" ) / R
m m
8 I I I
O 2 4 6 8
Equilibrium Solution Concentration x lo4, mol C'
Figure 4.1 Adsorption Isothem for CO-850 on ST1120 Carbon Black. (+)-p.mol g'', (.)-pnol m"

Adsorption of SDS on ST1120
CMC ( 8 x 10⁴ mol L1 )
1 I n I I
O 2 4 6 8 I O
Equilibrium Solution Concentration x lo4 mol 1''
Figure 4.2 Adsorption Isotherm for SDS on ST1120 Carbon Black. (+)-pmol g-', (.)-pnoi m.'

An initial experiment was designed to investigate the behaviour of al1 three
surfactants and the possibility of determining their individual concentrations. One of the
obstacles to this appmach is the cornplex equilibrium that exists in such a solution. The
large differences in the CMC's of the surfactants, in addition to the interactions between
the ionic surfactants and the formation of mixed micelles make this analysis very
cornplex. To prevent flocculation of the particles it was thought that a mixture of
SDSKO-720 would be initially added to an aqueous solution of STI 120. It was
anticipated that the system would remain stable in the presence of cationic addition due to
the steric stabilization imparted by the nonionic. Afier equilibration an analysis of the
supernatant would provide information about the behaviour of the individual components
within this mixture. However, al1 systems exhibited some degree of flocculation. These
flocs alter the surface area available for adsorption. A plot of this rnixed isotherm is
given in Figure 4.4. The adsorption of the nonionic surfactant rernains essentially
constant throughout the isotherm at 1 7- 1 8 prnol g'l, this value is alrnost half of the
maximum adsorption calculated fiom the individual CO-720 isotherm. This lower value
can be attnbuted to the competition for adsorption sites on the particle surface with 'TTAB
and SDS. No detectable amounts of TTAB could be found in the filtered solution. One
possible explanation for this is the interaction that takes place between the charged head
groups of the ionic surfactants. During this expenment SDS was always in excess of
TTAB and the latter may have been consurned by interaction with SDS. Optical
microscopy revealed the presence of a white solid phase mixed in with the particles. This
component was likely a coacervate fomed fiom the neutralization of the charged head
groups of SDS and TTAB. This white coacervate phase was reproducible in the absence

of particles when TTAB and SDS were combined in solution at concentration equal to
those used in the isotherm experiment.
By increasing the concentration of CO-720 the coacervate could be redissolved in
solution. This was caused by a soiubiiizhg effect of the nonionic on the SDS:TTAB
cornplex. This coacervate cornpiex and its equilibrium will be discussed further in die
next section.

1,
+
[SDS] = O - .O9 M [CO-7201 = -09 - O M
*
O 2 4 6 8 10
Molar ratio of SDS to CO-720
Figure 4.3 Mixed Adsorption lsotherm of SDS and CO-720 on ST1120 Carbon Black. (e) Total Adsorption. (a) CO-720, ( 0 ) SDS
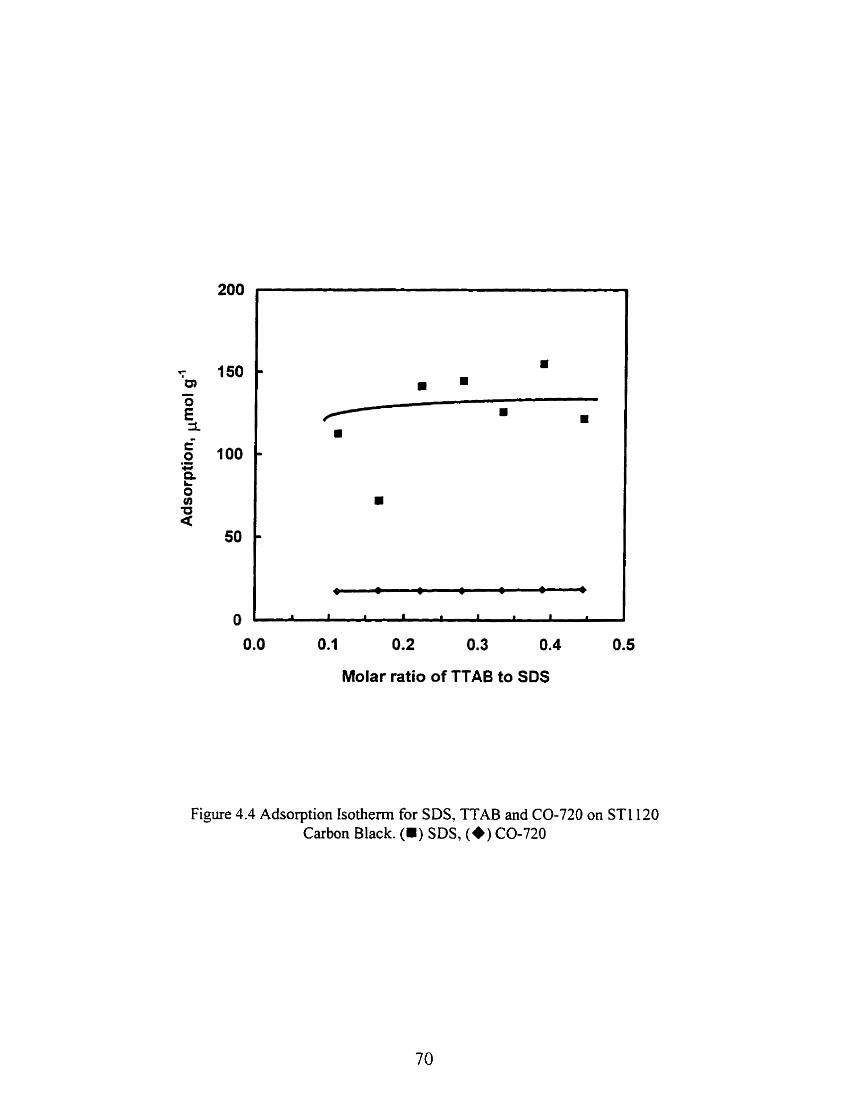
0.0 0.1 0.2 0.3 0.4 0.5
Molar ratio of TTAB to SDS
Figure 4.4 Adsorption Isothem for SDS, TTAB and CO-720 on ST1120 Carbon Black. (m) SDS, (*) CO-720

4.2 Electrokinetic Zeta Potential Measurements
The Pen Kem 501 Zeta Meter was used to analyze a variety of colloidal systems.
The particles stabilized with nonionic surfactants exhibited the greatest variation in
rneasurement. Generally, these systems had particles that exhibited a distribution of
charge as evidenced by the non-uniform flow of particles in the view field. This occurs
because particles with variable surface charge migrate at different speeds under an applied
potential. One method of addressing this problem is to conduct the measurement in a
dilute ionic solution. The ionic solution uniformly compresses the electric double layer in
these low potential systems. This has the effect of normalizing the potential, subsequent
measurements are straightforward if the particles exhibit a uniform potential.
To assess the effect of surfactant concentration on the particle surface charge. a
nurnber of sarnples were prepared with incremental increases in the concentration of SDS.
The results are displayed in Table 4.2. This data reveals that maximum surface charge is
reached at a low concentration of surfactant and that increasing the solution concentration
does not significantly alter the adsorption of the surfactant.

Table 4.2. Zeta Potential of Carbon BIack Solutions as a Function of Added SDS
- -
Volume of SDS, [SDS]/CMC Zeta Potential, mL mV
Another set of experiments involved measuring the zeta potential of ST1120
stabilized with SDS or 1TAB. The zeta potential of the prepared sample was measured to
determine the charge on the particle surface. hcrernental amounts of oppositely charged
surfactant were added to this solution to destabilize the system. The experiment was
approached fiom two directions. First TTAB was added to an SDS stabilized system.
The molar amounts were calculated to encompass an equimolar and subsequent excess
addition. The results are s h o w in Table 4.3.

Table 4.3 Zeta Potential Measurements of Mixed TTABISDS Solution.
- - - - - - - - - - - - - - -
Vol. SDS. [SDSl, M Excess, Stability Zeta Potential,
mL rnrnoles mV
O O - 1.33 x 1 O-' Stable 35
1 .O0 2.22 x 10" -4.44 x 1 O-' Stable 17
1.25 2.78 x 10" -2.22 x IO*' Unstable
1.50 3.33 x 10" O Stable -5 1
2.00 4.44 x 1 0" 4.44 x 1 O*' Stable -4 7
-
Vol. TTAB, [TTAB], M Excess. Stability Zeta Potential,
mL m o l e s mV
1 .O0 2.22 x 1 0" -2.1 1 x 1 O-' Stable -48
2 .O0 4.44 x 10" -1 -22 x 1 O-' Stable -48
3 .O0 6.66 x 1 0 ~ ~ -3.36 x 1 O-' Unstable
3.00 8.88 x 10-' 5.52 x 10'' Stable 34
5-00 1 . 1 1 ~ 1 0 " 1 .44~10- ' Stable 44
To investigate the effects of aggregation in the system, controlled arnounts of SDS
were added to ST1120 stabilized with TTAB surfactant. The systern undergoes the
following transition: stable-unstable-restabilized. The particles are ionically stabilized by
TTN3 surfactant which begin to undergo neutralization by the SDS lowering the zeta
potential of the particles. Upon subsequent addition of surfactant the particles are
neutralized and weak flocculation takes place. Flocculation is induced because the
electrostatic repulsive forces are not sufficient to overcome the attractive forces between
the particles. It may also result from bridging effects fiom the combination of anionic and
cationic surfactants. The combination of SDS and TTAB would result in a neutral species
with twenty-six carbon atoms in the back bone. This may be large enough to act as a
bridging agent between the particles that promotes flocculation within the system. Upon
M e r addition of anionic surfactant the system is restabilized with an observed zeta
potential similar in magnitude and sign to the system stabilized only by SDS. A proposed
rnechanism for this adsorption involves the additional surfactant adsorbing ont0 the
carbon black particles which are covered with the complex formed by association behveen
the anionic and cationic surfactants. n i e problem was approached fiom both a cationic
and anionic stablized system, with subsequent addition of the opposite ionic surfactant.
These systems show some interesting features. Pior to addition of the other
surfactant component both systems are stable, but upon addition of surfactant the absolute
value of the zeta potential begins to drop. A region of instability is approached when an
equimolar arnount of opposite surfactant has been added. Beyond this region the system
is then restabilized upon M e r addition of surfactant. One possible explanation for these
observations is as follows, the oppositely charged surfactants will neutralize the charge on
the particle surface, as this is the primary means for stabilization the system will become
unstable. Upon m e r addition the surfactant restabilizes the system and the particles
now exhibit charge reveeal. Currently there is not a clear understanding of the events
that take place. Amante has proposed a mode1 that accounts for the behaviour in mixed
surfactant ~ ~ s t e r n s . ' ~ The complex equilibriurn that exists can be described by Figure 4.5.

mixed micelte w m c safaaant
a---- m m c srrrfaclant
complex ion pair
free surfactant
Figure 4.5 Equilibnum Process in Mixed Anionic/Cationic Surfactant System. (afier Scarnehom et al. 1988)

4.3 Acoustophoresis Experimen ts
The acoustophoresis experiments were conducted rnainly at 2 and 5 % solids
content of ST1120 carbon black. In theory, the measurement of zeta potential should be
independent of particle concentration in dilute systerns. It was found that at 5 % solids
the signal from the instrument was more consistent and steady. One of the difficulties of
working in aqueous solution without a background electrolyte is that the "diBise" portion
of the electncal double layer may be very large, which translates into a weaker signal. To
cornpensate for this, a higher particle weight fiaction c m be used resulting in a stronger
signal due to the presence of more particles. The experirnents were designed to
complement the data collected fiom the adsorption isotherm experiments so as to assess
the effect of surfactant adsorption on surface charge. The experiments consisted of the
following types: time run in single surfactant systems, tirne run in mixed surfactant
systems, spike surfactant addition to mixed systems, titration of mixed systems.
The time expenments for the nonionic surfactants revealed some surprising
results. The colloidal system exhibits a negative zeta potential in the presence of these
surfactants that c m not be attributed to the existing charge on the particles and does not
onginate fiom the neutral surfactant molecules. This same phenomena was also reported
by Cork Hill et al 26.
It was argued that this may arise from the dipole nature of the ethoxy groups.
Another explanation would be ionization of the alcohol end groups. This does not appear
to be a reasonable explanation given the pKa of typical polyethylene glycols is around 17
and the pH in the experimental systems under investigation ranged fiom 5 to 7.

One explanation may be the solubilization of the solution ions in the adsorbed
layer. Two main sources exist for these ions: impurities fiom the carbon black powder or
irnpurities f?om the added surfactant. However, it has been reported by Kratohvil and
Matjevic. that hydrophobie carbon pigments ofien exhibit a negative charge in aqueous
solution, but no explanation was given to interpret this phenomena in tems of surface
chemistry." The pH of the systems ranged between 5 and 7 and the zeta potential ftom
- 15 to -20mV. It was also observed that the nonionic with the larger head group (CO-
850) had a slightly higher zeta potential, refer to Table 4.4 for zeta potential values.
Table 4.4 Zeta Potential of ST1120 Stabilized with Nonionic Surfactants.
Surfactant Solids, Tirne, Conc., ConcKMC Zeta Potential.
wt% min mol L-' mV
CO-720 5 172 5 x 10⁻³ 5
CO-850 5 193 5 x 10⁻³ 4
SDS 5 480 1 x 1 O-' 1.25
TTAB 5 510 5 x 10⁻³ 1.4
Both of these systems also exhibited a slight temperature dependence. It is a well
known phenomena of nonionic surfactant systems to show an increase in absorption as a
function of temperature.' This is a result of progressive dehydration of the ethylene
oxide chah, resulting in a decrease in stenc demand on the surface of the molecule. This
interpretation should be valid below the cloud point temperature of the surfactant, above
which phase separation ensues between the surfactant and the solvent and which rnay
result in a large deposition of surfactant on the particle surface.
n i e STI L 20 mixed with SDS showed a negative zeta potential as anticipated the
strong adsorption fiom the isotherm experiments was revealed by the large negative zeta
potential of these systems. From several experiments the mean value of the zeta potential
ranged between -80 and -90 mV. This negative maximum in zeta potential is assumed to
occur at saturation coverage. The zeta potential of these systerns exhibited some
temperature dependence, and was observed to increase as a function of temperature. The
systems were allowed to reach equilibrium to ensure that the measured signal reflected a
steady state. The increase in signal with temperature may be due to a decrease in counter
ion binding with SDS andor an increase in surfactant adsorption. The increase in surface
coverage would be the result of an increase in the capacity of the surface to adsorb
additional surfactant. This can occur if the water hydration surrounding the hydrophilic
head group decreases with increasing temperature, resulting in a closer packing of
surfactant molecules. These systems also exhibited a narrow range over which the charge
on the surface changed drarnatically. A 20 % increase in SDS concentration resulted in a
1 50 Oh increase in the charge on the particle surface.
The TTAB surfactant did not have as high a signal in magnitude as the SDS
system. This is in agreement with the lower adsorbed amount calculated fiom the
isothenn.
The existing surface charge prior to adsorption may also have had some influence
in this process. As was mentioned above, the ST1120 systern stabilized by nonionic
exhibited a negative zeta potential in these systems. Some of the cationic surfactant may

have pre-adsorbed on the particle. at any anionic site. This would then reduce the surface
area available for additional surfactant for adsorption.
The mixed SDSKO-720 system showed strong temperature dependence.
Experiments in these systems were conducted at 16,24 and 32 OC (see values in Table
1.5). This dependence is a function of the following factors: increased nonionic
adsorption with increased temperature, CO-operative adsorption betvueen the two
surfactant molecules. ûther effects also dominate in mixed surfactant systems, die
respective CMC's change to a large extent the nonionic/anionic form mixed micelles and
mixed adsorbed layers. The nonionic molecules act as charge separators between the
head groups of the ionic surfactants, while the charged head groups promote enhanced
solubility of the nonionic surfactants. The strong function of temperature could have
consequences for the stability of systems under certain conditions, refer to Figure 1.6 for a
plot showing the temperature dependence in these systems.
Table 4.5 Effect of Temperature on the Zeta Potential in SDSICO-720 Systems.
Temperature, [SDS], [CO-7201, PH S.C., Zeta Potential,
OC 1 0 ' ~ M 1 0 - ' ~ 1 O-? s mv

[CO-7201 = 5 x 1 o4 M [SDS] = 1 x 1W2 M [ST1120] = 5 % solids by wt
25 50 75
Time, min
Figure 4.6 Zeta Potential as a Function of Temperature for CO-720/SDS Systems. (e) 16 OC, (i) 24 OC, (a) 32 OC

The rnixed anionichonionic systems were designed to maintain colloid stability in
the presence of TTAB addition. The addition of a spike amount of TTAB proceeded as
anticipated, the sign of the colloid was reversed or neutralized upon the equimolar
addition of the TTAB to the system. Two chernical phenornena take place upon this
addition. First, SDS is neutralized in solution by the formation of a complex ion pair with
TTAB. Second SDS is neutralized at the sttrface of the particle with a subsequent
lowering of the repulsive energy. The complex ion pair may then subsequently migrate to
the surface of the particle.
Several factors complicate the analysis fiom these types of experiments. Firstly,
the addition of the nonionic was intended to provide some means of stenc stabilization to
the particles. Thus. upon neutralization by the addition of TTM, the particles would
remain stabilized due to the presence of the sterîc barrier. However, the particles do
exhibit some form of aggregation. Acoustophoretic measurements depend on a uniform
dispersion, the semi-aggregated state of ST1120 may introduce some uncertainty into the
calculated zeta potential (Equation 2.18).
It is clear however, that the p ~ i c l e s show charge reversal upon a slight excess of
added surfactant. This would indicate preferential adsorption of the TTAB to the surface
of the now surfactant coated particles. An experimental plot is shown in Figure 4.7. This
plot shows the dependence of zeta potential during the titration of TTAB surfactant to a
system of STI 120 stabilized with CO-720/SDS solution. The curve has three distinct
regions. At the start of the titration, the zeta potential is negative as the ST1120 particles
are coated with a mixture of nonionic/anionic surfactants. The zeta potential initially
hcreases due to the neutralization of SDS anaor the adsorption of TTAB. A steady-state

is reached duruig which the surface charge on the particle is neutralized. A second
distinct region of the cuve is the sharp drop in zeta potential that occurs when the ratio of
[TTAB] to [SDS] is in the range of 0.6. During the addition of TTAB the concentration
of the complex ion produced by the interaction of TTAJ3 with SDS is increasing. This
complex would preferentially locate itseif on the surface of the particles and may enhance
the adsorption a f i i t y for SDS. This may explain the steep &op observed in zeta
potential. The last region of the curve is the change in sign of the ST1120 particles fiom
negative to positive. This change of sign coincides almost exactly when the added
amount of TTAB is equivalent to the amount of SDS. It is not entirely clear what causes
the drop in the zeta potential in the middle of the curve, however die experiment was
highly reproducible. An identical trend was o bserved when the concentration of TTAB
was doubled.
4.4 Spike Addition of TTAB to SDS Stabilized Systems
Adding a spike amount of TTAB to initiate flocculation in the system provided a
starting point to monitor the zeta potential of the ST1120 particles as a function of tirne.
The zeta potential values exhibited sorne scattering and this reflects a number of
phenomena that take place upon surfactant addition. Firstly, the equilibrium
concentration of the surfactant is measured as a function of time. This reflects the
changes in the system that accornpany the destabilization experienced by the particles
upon addition of cationic surfactant. The equilibrium value appears to increase with tirne.
This may be the result of the adsorption of the pseudo-nonionic complex formed by the
ion pairing between the cationic and anionic sur fa~tan t~~. Another contnbuting factor

would be destabilization of the colloicial system resulting fian charge neutralization or
the lowerùig of charge on the particle surface. The floccdation of the particles would
reduce the surface area available to the surfactant which may then undergo desorption into
the surrounding aqueous environment. Al1 experirnents were run for a period of 4-6 hours
after addition of TTAB.

Titration of 7ZOISDS Solution with TTAB
lime, min O 100 200 300 400 500 600 700
*- Zeta Potential - Temperature
0.3 0.5 0.8 1 .O
Molar Ratio of TTAB:SDS [CO-7201 = 5 x lo4 M, [SDS] = 1 x IO-* M. [STI 1201 = 5 % solids by wt F A B ] = 8.9 x IO-' M
Figure 4.7 Plot of Zeta Potential as a Function of added TTAB to ST1120 Stablized With SDSKO-720.

4.5 Conductivity Expetiments
Conductivity experiments can be used to determine experimentally the CMC of
the ionic surfactants. The value is determined by the change in slope of the conductivity
plot that accornpanies the onset of micellization. The experirnents were reproducible and
the values agreed well with the accepted CMC literature values for SDS and T T A B . ~ ~ A
conductivity plot for =AB is s h o w in Figure 4.8.
TabIe 4.6 Detemination of the Criticat Micelle Concentration of SDS
R a 1 Number S pecific Conductivity, Temperature, CMC,
S m-' OC1 mol L-'
Table 4.7 Determination of the Critical Micelle Concentration of TTAB
Trial Number Specific Conductivity Temperature
S m-' O C
CMC, mol L"
Literature Values:CMC for TTAB is 3.5 x IO-' M at 25 O C and CMC for SDS is8.0 x 10'' M at 25 "C

Conductivity measurernents can also be used to assess the strength of interaction
between TTAB and SDS. The experirnent consists of titrating one reagent Uito a stirred
solution of the other. A theoretical value for the conductivity can be predicted based on a
summation of the four ions involved. The counter ions for the ionic surfactants fiuiction
as an inert electrolyte. The two ionic surfactants however may combine to f o m a
complex ion pair as was discussed earlier. The formation of this complex should be
reflected by a decrease in expected conductivity of the solutions as these moiecules form
ion pairs and do not contribute to the conductivity. The deviation from a calcuiated
sumrnation of the respective conductivities can be used to interpret the strength of the
interaction between the two ion pairs. Any surfactant added beyond the equivalence point
should contribute to the overall conductivity in an additive manner. A plot of TTAB
titrated with SDS is shown in Figure 4.9. ' I b is figure cleariy demonstrates the change in
dope that occurs when an equimolar arnount of SDS has been added. At this point both
ions from SDS contribute to the overall conductivity.
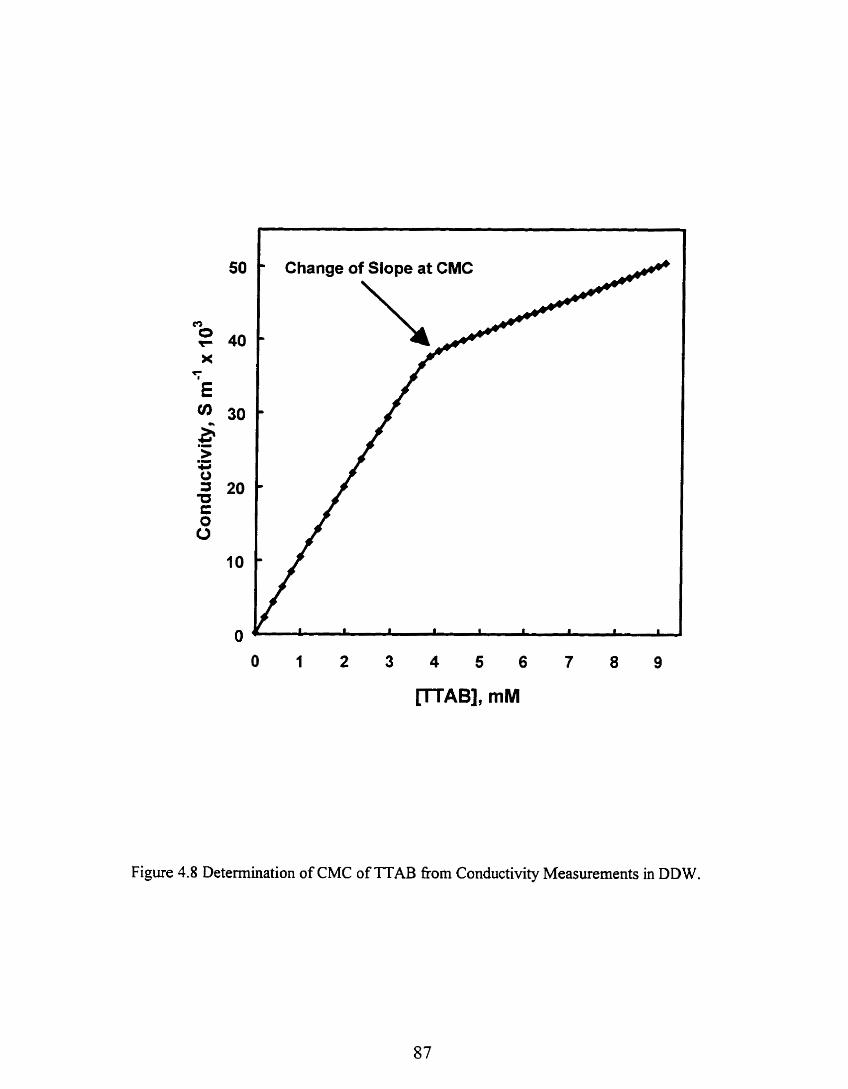
Change of Slope at CMC A&
Figure 4.8 Determination of CMC of TTAB fkom Conductivity Measurements in DDW.

250 mL of 5 x lo4 M n A B . [SDS] 4 x10" M. temp 24 O C
0.0 0.3 0.5 0.8 1 .O 1.3 1.5
Molar Ratio [SDS]:pTAB]
Figure 4.9 Titration of TTAB with SDS in DDW.

CHAPTER 5. CONCLUSIONS AND FURTHER WORK
The adsorption isotherms investigated for al1 surfactants on ST 1 120 followed the
anticipated theory for surfactant adsorption on hydrophobie particles. The analysis of the
supernatant for individual surfactants was successful in solutions containing two
component mixtures. Individual surfactant concentrations could be established fiorn the
deveIoped procedures.
The strong interaction between SDS and TTAB introduces some uncertainty into
the analysis of individual surfactant components in three component mixtures. A betîer
understanding of the equilibrium of these cornponents would improve the certainty of
these calculations. Analysis of the coacervate phase observed afier mixhg of TTAB and
SDS could verify that this species is the cornplex ion pair. This analysis could aid in
understanding the events taking place during acoustophoretic experiments in these mixed
systerns.
Adsorption isotherm behaviour is a strong function of the CMC of the surfactant
under investigation. A more thorough understanding of the changes in CMC that
accompany mixtures of surfactants would provide a more complete picture of the events
that take place during surfactant adsorption in these mixed systems.
Acoustophoretic expenments provided a means of understanding the modification
of surface charge that accompanies surfactant adsorption. A mapping of charge reversal
on the particles was possible during neutralization titrations. The experiments that
involved a three component mixture of surfactants exhibited some unmual characteristics.

The modification of the surface charge in these systems may be better understood by
investigating the behavior of the complex ion formed between TTAB and SDS. The
generation of this complex likely alters the adsorption properties of a11 surfactants in the
system. An understanding of the strength of this complex and its solution properties
could help in interpreting the results fiom the acoustophorectic titrations.
To complement the adsorption isotherm ds!ta, a measurement of the steric layer
thickness of the adsorbed surfactant would be helpful. This type of data would provide
some insight into the conformation of the adsorbed surfactant molecules. Additionally
any changes in this conformation that take place in mixed systems would provide a clearer
picture of the association or interaction between the different surfactant components.
image analysis of the flocculated systems could be used to detemine the state of
aggregation within these systems. The secondary particle size distribution could be
studied as a function of surfactant components in the mixture. Analysis of the supernatant
for individual surfactant components could provide and explanation of some of the events
that take place during the aggregation process.
It is clear that surfactants play a major role in the stability and flocculation steps of
the ST1120 particles. The concentration and adsorption behavior of these surfactants can
be determined through straightfonvard analytical techniques. The materials used in the
expenmental work were chosen to provide a mode1 for rnixed surfactant adsorption on
hydrophobie substrates. The methods and experimental techniques are applicable to a
variety of colloidal systems involving mixtures of surfactants. Only slight modifications
of the analytical techniques would be required to examine new systems.

REFERENCES
D. J . Shaw, Introduction to Colloid and Surface Chemise Fourth Edifion. Oxford: Butterworth-Heinemann Ltd., 1 990.
' J. Israelachvili. Intermo[ecular & Surface Forces.. London: Academic Press, 1992.
3 R. Aveyard.. "Adsorption at the Airkiquid, Liquidniquid, and Solid/Liquid
Interfaces", in: Th. F. Tadros (Ed.), Surfactants. London, Academic Press, 1984; pp. 155-1 73.
4 D. Myers, Surfaces. Interfuces. ond Colloihi Principles and Applications. New York:
VCH Publishers, inc., 199 1.
j P. C. Hiemenz, Principles ofcolloid and surface chernis~ . New York: Marcel
Dekker,inc., 1986.
R. J. Hunter. introduction to Modern Colloid Science. London: Oxford University Press Lnc., 1993.
7 D. Napper, Poiymeric Stabilimtion of Colloicial Dispersions. London: Academic Press Inc., 1983.
C. A. Miller, P. Neogi, Szu$?acfant Science Series volume 1 7 Interfacial Phenornena Eqiiilibrium and Dynamic Effecrs. New York: Marcel Dekker, Inc.. 1985.
9 ni. F. Tadros (Ed.), Surfacianrs. Great Britain: Academic Press Ltd., 1984.
' O Hoesht, Nonionic Surjuctunts. Montreal, 1 985. Trade Brochure.
" N.M. van 0s. J.R. Haak, L.A.M. Rupert, Physico-Chemical Properties ofselected Anionic. Cationic and Nonionic Surfactants. The Netherlands: Elsevier Science Publishers B.V., 1993.
" J. S. Clunie and B. T. Ingram., "Adsorption of Nonionic Surfactants", in: G. D. Parfitt, C. H. Rochester (Eds.), Adsorptionfrom Solution ut the Solid Liquid Interface. London, Academic Press Ltd., 1983; pp. 105-1 52.
13 J. R. Aston, J. S. Godfiey and T. W. Healy., ''Nonionic Surfactant Adsorption on Latex Oxide and Carbon Black coIloida1 Systems", in: L. W. Goodwin., R. Buscall (Ed.)? Colloidal Poiyrner Particles. Great Britain, Academic Press Ltd., 1995.

'' MA. Cohen Stuart, Th. Van Den Boomgaard. Sh. M. Zourab, and J. Lyklema. The Layer Thickness of Adsorbed Nonionic Surfactants: Cornparison Between Electrokinetic and F i h Thickness Methods., Colloi& and Surfaces. 1984,9, 163-1 72.
l5 B. Kronberg, L. Kii11, and P. Stenius. Adsorption of Nonionic Surfactants on Latexes, Journal of Dispersion Science and Technology, 198 1,2 ,2 15-232.
16 M.J. Schwuger and H.G. Srnoka. Mixed adsorption of ionic and nonionic surfactants on active carbon, CoIloià & Polymer Science, 1977,255, 589-594.
l 7 B. J. Marlow and D. Fairhurst. Colloid Vibration Potential and the Electrokinetic Characterïzation of Concentrated Colloids.. Langmuir, 1988,4.6 1 1-626.
'' K . Othmer ( E d . ) Encyclopaedia of Chernical Technoiow Volume 4.3rd ed. New York: b h n Wiley & Sons, Inc., 1978; pp 630-667.
19 M. H. Franson (Ed.), Srandard Methoh for the h i n a t i o n of Water und Wastewater. London, Academic Press, 1 992; pp 5-33-5-4 1 .
'O M. Tsubouchi. H. Mitsushio, and N. Yarnasaki. Determination of Cationic Surfactants by Two-Phase Titration, Anuiytical Chemistry. 198 1 , 53, 1957- 1959.
'' B. Kronberg at al. The Effect of Surface Polarity on the Adsorption of Nonionic Surfactants. Journal of Colloid and Interface Science. Vol. 1 02, No. 2, 1 9 84, pp. 4 1 8-423.
i? -- R. Abe and H. Kuno. The Adsorption of Polyoxyethylated Nonylphenol on Carbon Black in Aqueous Solution., KoUoid-Zeifschrfl ttnd Zeitschri/r fur Polymere, 1962, 1 8 1 , 70.
'' B. Kronberg et al. Adsorption of nonionic surfactants on latexes. Journal of Dispersion Science und Technology. Vol. 2(2&3), 198 1, pp. 2 15-232.
?'' M.A. Stuart et al. The Layer Thickness of Adsorbed Nonionic Surfactants: Comparison Between Electrokinetic and Film Thickness Methods. Colloidr and Surfaces, Vol. 9, 1984, pp. 163-172.
3 J.C. Amante et al. Precipitation of Mixtures o Anionic and Cationic Surfactants. Journal of Colloid and Interface Science, Vol. 144, No. 1, 199 1 , pp. 243-25 3.
26 J. M. Corhill et al. Adsorption of Non-ionic Surface-active Agents at the GraphodSolution Interface. Transactions of the Faraday Society, Vol. 62, 1962, pp. 979-986.

" S. Kratohvil and E. Matjevic. S tability of Carbon Suspensions. Coifoids and Szwjizces. Vol. 5, 1982, pp. 179-1 86.
'' A. Mehreteab and F. J. Loprest. Formation of Pseudo-Nonionic Complexes of ANonic and Cationc Surfactants. Journal of Colloid and Interface Science, Vol. 125, No .2, 1988, pp. 602-609.
29 N.M. van Os. J.R. Haak, L.A.M. Rupert, Physico-Chernical Properties of Selected A nionic. Cationic and Nonionic Surfactants. The Nether lands : Elsevier Science Publishers B.V., 1993.