the american express open state of women-owned businesses ... · 1 state of women-owned businesses...
TRANSCRIPT

The American Express OPEN State of Women-Owned Businesses ReportA Summary of Important Trends, 1997–2011

Introduction . . . . . . . . . . . . . . . . . . . . . . . . . . . . . . . . . . . . . . . . . . 1
Executive Summary . . . . . . . . . . . . . . . . . . . . . . . . . . . . . . . . . . . . . 2
Women-Owned Businesses in the United States in 2011 . . . . . . . . . 5
A Brief History of the Business Census: Data Improvements, Definitional Changes . . . . . . . . . . . . . . . . . . . 7
State Trends . . . . . . . . . . . . . . . . . . . . . . . . . . . . . . . . . . . . . . . . . . . 8
Industry Trends . . . . . . . . . . . . . . . . . . . . . . . . . . . . . . . . . . . . . . . 11
The Economic Clout of Women-Owned Firms: Steady Growth, Stalled Progress . . . . . . . . . . . . . . . . . . . . . . . . . . 13
Revenue Growth . . . . . . . . . . . . . . . . . . . . . . . . . . . . . . . . . . . . . . . . 13
Employment Growth . . . . . . . . . . . . . . . . . . . . . . . . . . . . . . . . . . . . . 14
Measuring Growth: The Denominator Matters . . . . . . . . . . . . . . . . . . 15
Looking Forward: Better Understanding the Entrepreneurial Marathon . . . . . . . . . . . 16
Study Methodology . . . . . . . . . . . . . . . . . . . . . . . . . . . . . . . . . . . . 17
Acknowledgements . . . . . . . . . . . . . . . . . . . . . . . . . . . . . . . . . . . . 17
Summary Tables . . . . . . . . . . . . . . . . . . . . . . . . . . . . . . . . . . . . . . 18
table of contents
1
state of Women-oWned businesses RepoRt
Introduction
It is frequently stated that one cannot manage what one cannot measure . Thus, there is an ongoing interest among those in the field of women’s enterprise development in knowing how women-owned firms are faring . Especially in these economic times, comparing and contrasting the growth of women-owned firms with that of men-owned firms, and with the economy as a whole, can provide useful insights for public policy makers, corporate decision makers, entrepreneurial support organizations and the women’s business community itself .
A detailed reporting of the number, size and growth of women-owned businesses in the U .S . economy is published every five years, as part of the quinquennial Survey of Business Owners conducted by the U .S . Census Bureau . However, the U .S . economy moves quickly, and there is a lag of several years between the gathering and reporting of this invaluable information .
With this publication, American Express OPEN bridges that gap, offering an up-to-date accounting of the state of women-owned businesses in the United States in 2011 . Using data from the three most recent business census surveys (1997, 2002, and 2007)—the most recent of which was just published in December 2010—this report provides estimates of the number, employment
and revenues of women-owned firms as of 2011 . Data are reported at the national level in total, and by industry, revenue and employment size class . Trends at the state level are also reported . By sharing these estimates in a timely manner, it is our aim to inform business planning, program development and enterprise support activities—as well as to shine a light on gains made and barriers to address .
This new analysis not only confirms what we know from past government reports—that women continue to launch enterprises at a rate exceeding the national average, yet their firms remain smaller than those owned by their male counterparts—but shares a new and nuanced investigation into the growth trends among women-owned enterprises over the past 14 years .
The report concludes with several observations and calls to action for everyone interested in small business development in general—and women’s enterprise development in particular—to consider . It is our hope that the findings contained in this report will spark debate and discussion, increase understanding, and intensify a collective focus on addressing the issues that are preventing women-owned firms from reaching their full potential .

2
state of Women-oWned businesses RepoRt
Executive Summary
• Asof2011,itisestimatedthatthereareover8.1million women-owned businesses in the United States, generating nearly $1 .3 trillion in revenues and employing nearly 7 .7 million people .
• Between1997and2011,whenthenumberofbusinesses in the United States increased by 34%, the number of women-owned firms increased by 50%—a rate 1½ times the national average .
• Despitethefactthatthenumberofwomen-owned firms continue to grow at a rate exceeding the national average, and account for 29% of all enterprises, women-owned firms only employ 6% of the country’s workforce and contribute just under 4% of business revenues . Further, the employment and sales growth of women-owned enterprises between 1997 and 2011 (8% and 53%, respectively) lags the national average (17% and 71%) .
• Combiningequally-ownedfirms1 with women-owned enterprises finds that women- and equally-owned firms number nearly 12 .9 million as of 2011, generate nearly $2 .6 trillion in revenues, and employ nearly 15 .8 million people . Women- and equally-owned firms together represent 46% of U .S . firms and contribute 13% of total employment and 8% of firm revenues .2
• Overall,women-ownedfirmshavedonebetterthantheir male counterparts over the past 14 years . The number of men-owned firms (which represent 51% of all U .S . firms) grew by only 25% between 1997 and 2011—half the rate of women-owned firms . Employment in men-owned firms has actually declined by nearly 5% over the past 14 years, while revenues grew by just 33%, both well below the growth seen among women-owned and all U .S . firms .
• Women-ownedfirmscontinuetodiversifyinallindustries . The fastest growth in the number of women-owned firms over the past eight years3 has been in education services (up 54%), administrative and waste services (47%), and construction (41%) . However, there are only two industries in which the economic clout of women-owned firms—meaning not only growth in the number of firms but in employment and revenues as well—has outpaced industry-level growth: construction and mining .
• Theindustrieswiththehighestconcentrationof women-owned firms are: health care and social assistance (52% of firms in this sector are women-owned, compared to a 29% share overall), educational services (46%), other services (which includes personal care services such as beauty salons and pet-sitting, dry cleaners, and automobile repair) (41%), and administration and waste services (including employment and travel agencies, janitorial and landscaping services, and convention organizers) (37%) . The industries with the lowest concentration of women-owned firms (in industries contributing 2% or more of the business population) are construction (a fast-growing industry for women as previously noted, but where just 8% of firms are women-owned) and finance and insurance (20%) . All other industries are close to the 29% share in all industries—again illustrating that women-owned
1 equally-owned firms are multi-owner firms that are 50% owned by a woman or women and 50% owned by a man or men.
2 changes in the way that equally-owned firms have been defined over time guard against an accurate reporting of trends in the growth of women- and equally-owned firms over time.
3 unlike the other national and state-level trends reported in this publication, which go back to 1997, industry trends are only reported back as far as the 2002 census, due to changes in industry classification between 1997 and 2002.

3
state of Women-oWned businesses RepoRt
firms are gaining a foothold in all sectors of the U .S . economy, and that few industries can continue to be labeled “non-traditional .”
• Nationally,thenumberofwomen-ownedbusinesseshas increased by 50% since 1997 . The states with the fastest growth in the number of women-owned firms over the past 14 years are: Georgia (97 .5%), Nevada (87 .6%), Mississippi (76 .7%), Florida (73 .3%), and North Carolina (68 .8%) . The states with the lowest rates of increase in the number of women-owned firms between 1997 and 2011 are: Alaska (8 .8%), West Virginia (17 .8%), Iowa (20 .1%), Indiana (23 .7%), and Vermont (26 .2%) .
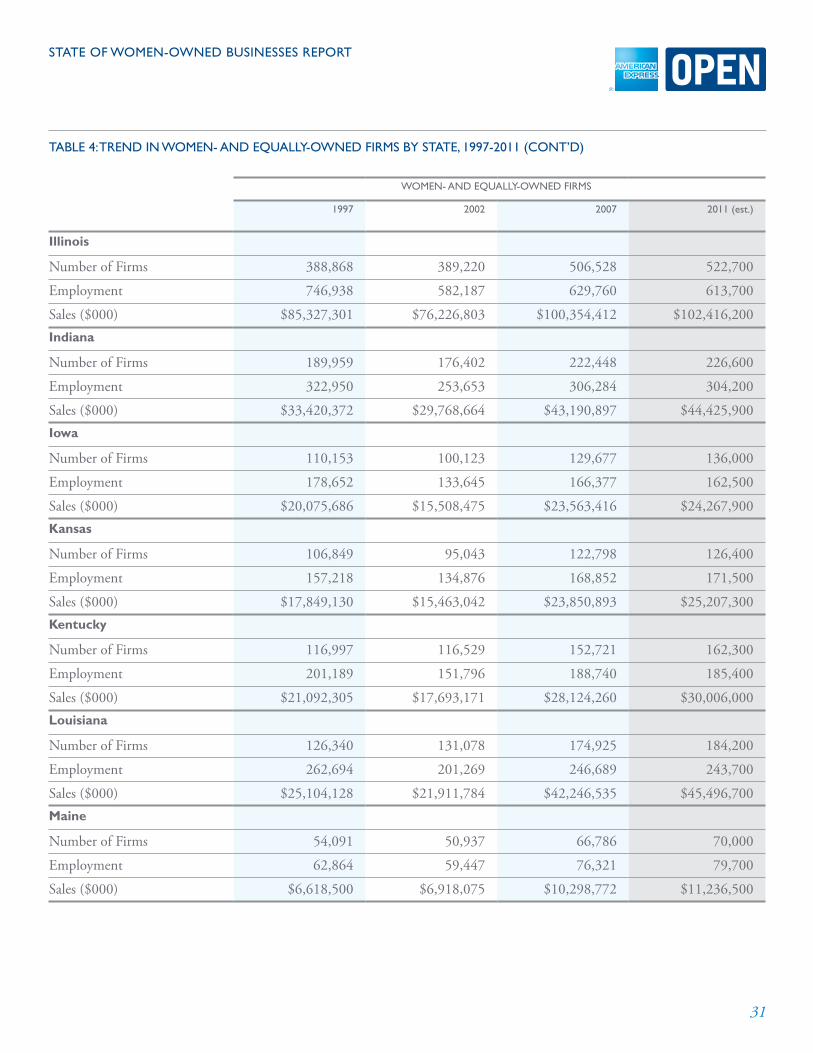
• Intermsofgrowthineconomicclout,thestatesinwhich the revenues of women-owned firms have increased well above the national average of 53 .4% over the 1997 to 2011 period are: Wyoming (170%), the District of Columbia (146 .7%), New Hampshire (117 .8%), Utah (117 .6%), and Louisiana (110 .3%) . The states in which the revenues of women-owned firms lag the national average to the greatest extent are: Iowa (which saw a 3 .1% decline in women-owned firm revenues), Maine (up only 12 .9%), Michigan (15 .3%), Illinois (24 .3%), and Rhode Island (28 .3%) .
• Themostimportantinsightgainedfromouranalysislies not in industry or state trends, but in our finding that—even as women-owned firms continue to grow in number at rates exceeding the national average—they are not moving along the growth continuum . In terms of both revenue and employment, the share of women-owned firms at the highest levels of business accomplishment has remained essentially unchanged over the past 14 years . In 1997, 2 .5% of women-owned firms had 10 or more employees, and 1 .8% had $1 million or more in revenues . As of 2011, 1 .9% of women-owned firms have 10 or more employees and 1 .8% have $1 million or more in revenues .4
• Thesituationismuchthesameformen-ownedfirms . While men-owned firms are, on average, larger than women-owned firms—about twice as many have firms with 10 or more employees and three times as many have reached the $1 million revenue mark—they, too, have not moved up the growth continuum . Indeed, over the past 14 years, the share of men-owned firms with 10 or more employees has declined, from 6 .6% to 4 .9% . Similarly, in 1997 6 .6% of men-owned firms had $1 million or more in revenues . That share declined to 6 .3% in 2011 .
• Lookingatemploymentandrevenuegrowthbetween1997 and 2011 across the business size spectrum—within the population of women-owned firms—finds that the average 8 .1% employment growth among women-owned firms is exceeded only among firms with between 10 and 99 employees . Employment growth among both very small and larger women-owned firms has been below average over the past 14 years . With respect to revenue growth, women-owned firms generating between $10,000 and $99,999 in revenue, as well as those generating $1 million or more, have seen above average revenue growth since 1997, whereas women-owned firms in the $100,000 to $999,999 revenue range have grown at a below-average rate .
• Thismixofprogressandparalysisbearsadeeperlook . Reviewing the totality of small business and large corporate (publicly traded) growth trends over the past decade leads one to the conclusion that, in the battle of David/Diana versus Goliath, Goliath is winning . While it’s always been the case that the very largest firms—those that are publicly-traded on stock exchanges—are few in number, but punch above their weight in terms of employment and revenue generation, their dominance in the U .S . economy has grown over the past 14 years . In 1997, publicly traded firms represented 2% of firms and contributed 43% of the jobs and 55% of business revenues .
4 this same holds true for women- and equally-owned firms, among which 3% have 10 or more employees and 3% have $1 million or more in revenues.

4
state of Women-oWned businesses RepoRt
Now, large publicly traded firms, though still just 3% of U .S . businesses, employ 53% of workers and generate nearly two-thirds (64%) of business revenues .
• Further,whilewomen-ownedfirmscontribute6%ofU .S . jobs and 4% of firm revenues compared to all U .S . firms, the picture is brighter when comparing women-owned firms to all privately held firms . Taking large, publicly traded firms out of the picture, women-owned firms are providing employment to 13% of the smaller firm workforce and generating 11% of firm revenue—and those shares have grown over the past 14 years . Thus, moderate growth in the economic contributions of women-owned businesses has been masked by the overall trend in large firm economic dominance .
• Tosummarize,howwomen-ownedfirmsarefaringdepends on whether one looks at trends within the population of women-owned firms over time, how women-owned firms have performed compared to their male counterparts, or how they are faring compared to the economy as a whole . Within the population of women-owned firms, we see steady growth but a lack of progress up the size continuum . And, when comparing like to like, small- and mid-size women-owned firms are keeping pace with the national average—and are topping the very sluggish growth seen among men-owned firms in the 1997-2011 period . However, something is putting women-owned firms off their stride as they grow larger; they fall behind toward the end of the entrepreneurial marathon, when entering the 100-employee and million-dollar “anchor leg” of the race .

5
state of Women-oWned businesses RepoRt
Women-Owned Businesses in the United States in 2011After analyzing trends in the growth in the number and size of women-owned firms in the 1997, 2002 and 2007 economic census surveys, and extrapolating those trends forward (taking into account economic conditions),5 we estimate that—as of 2011—there are over 8 .1 million women-owned businesses in the United States: 8,125,800 to be precise . As of this year, women-owned firms are generating $1,255,798,300,000 (nearly $1 .3 trillion) in revenues and employing 7,650,400 people .
Between 1997 and 2011, when the number of businesses in the United States increased by 34%, the number of women-owned firms increased by 50%—a rate 1-1/2 times the national average .
Despite the fact that the number of women-owned firms continues to grow at a rate exceeding the national average, and now account for 29% of all enterprises, women-owned firms only employ 6% of the country’s workforce and contribute just under 4% of business revenues—roughly the same share they contributed in 1997 . Further, the employment and sales growth of women-owned enterprises between 1997 and 2011 (8% and 53%, respectively) lags behind the national average (17% and 71%) .
Combining equally-owned firms6 with women-owned enterprises finds that women—and equally-owned firms number 12,863,700 as of 2011 . These firms generate $2,586,732,300,000 (nearly $2 .6 trillion) in revenues, and employ 15,784,600 people . Women- and equally-owned firms together represent 46% of U .S . firms and contribute 13% of total employment and 8% of firm revenues, somewhat less than the 15% and 10% shares contributed 14 years ago .7
5.4
819
7.1 6.5 7.1 7.8 7.68.1
7.7
941
1,2021,256
1997 2002 2007 2011
# Firms
# F
IRM
S, E
MPL
OY
EES
(MIL
LIO
NS)
FIR
M R
EVEN
UES
(BI
LLIO
NS)
Sources: 1997-2007, Census Bureau. 2011 estimates,American Express OPEN/Womenable.
EmploymentRevenue ($B)
NUMBER & REVENUES of WOMEN-OWNED FIRMSGROWING STEADILYEmployment Up Only 8% Over Past 14 Years
5 Refer to study methodology on page 17 for more details.
6 equally-owned firms are multi-owner firms that are 50% owned by a woman or women and 50% owned by a man or men.
7 changes in the way that equally-owned firms have been defined over time guard against an accurate reporting of trends in the growth of women- and equally-owned firms over time.

6
state of Women-oWned businesses RepoRt
GROWTH IN NUMBER OF WOMEN-OWNED FIRMSEXCEEDS NATIONAL AVERAGEBut Women-Owned Firms Lag in Employment/Revenue Growth
34.4
50
25.4
NUMBER OF FIRM
16.8
8.1
-4.8
EMPLOYMENT
71.4
33.3
53.4
REVENUES
American Express OPEN/Womenable estimates as of 2011, based on 1997-2007 data from US Census Bureau.
All Firms
% C
HA
NG
E, 1
997-
2011
Men-owned FirmsWomen-owned Firms
-10
0
10
20
30
40
50
60
70
80
This mix of progress and paralysis bears a deeper look . Reviewing the totality of small business and large corporate (publicly traded) growth trends over the past decade (see Table 1 in the Summary tables section) leads one to the conclusion that, in the battle of David/Diana versus Goliath, Goliath is winning . It’s always been the case that the very largest firms—those that are publicly-traded on stock exchanges—are few in number but punch above their weight in terms of employment and revenue generation . However, their dominance in the U .S . economy has grown over the past 14 years . In 1997, privately held firms accounted for 98% of all firms, 57% of private sector employment and 45% of firm revenue . Conversely, publicly traded firms represented 2% of firms but contributed 43% of the jobs and 55% of business revenue .
As of 2011, privately held firms still account for nearly all (97%) businesses, but are now contributing less than half of U .S . jobs (47%) and 36% of business revenue . Large, publicly traded firms, though still just 3% of U .S . businesses, now employ 53% of workers and generate nearly two-thirds (64%) of business revenues .
Women-owned firms have largely held their own against the recent tide of very large corporation growth . While, as noted above, the share of jobs and revenues provided by women-owned firms remains low (6% and 4%, respectively), it is virtually the same as it was in 1997 (7% and 4%) .
The loss of small firm clout has thus come primarily from men-owned businesses . The number of men-owned firms (which represent 51% of all U .S . firms) grew by only 25% between 1997 and 2011—half the rate of women-owned firms . Employment in men-owned firms has actually declined by nearly 5% over the past 14 years; the share of jobs provided by privately held men-owned firms has declined from 42% to 34% since 1997 . In addition, during that period, revenues generated by men-owned firms grew by just 33%; the share of revenues generated by men-owned firms has dropped from 36% to 28% of business revenues .
Publicly-traded/OtherEqually-ownedWomen-ownedMen-owned
MOST FIRMS PRIVATELY-OWNED, YETPUBLICLY-TRADED FIRMS ACCOUNT FOR 2/3 OF REVENUES
American Express OPEN/Womenable estimates as of 2011, based on 1997-2007 data from US Census Bureau.
SHARE OF FIRMS SHARE OF REVENUE
3
64
44
28
17
29
51

7
state of Women-oWned businesses RepoRt
A Brief History of the Business Census: Data Improvements, Definitional ChangesIt is important to note—as we move into an analysis of trends by state, industry and business size—why this report only includes data from the three most recent business censuses, when the Census Bureau first provided sex-disaggregated business counts in the 1977 census . The reason lies in the progress made over time by the Census Bureau in industry inclusion and in the changes that have been made in how the gender of business ownership is determined .
As summarized in Table 2 in the Summary Tables section, there have been a variety of definitional changes that have affected the number, share, and economic clout of women-owned businesses . The first census survey to include an accounting of women-owned firms, in 1977, was experimental and included only some industries . In fact, only with the 1992 census were all women-owned firms—including C corporations—included in the count . That census survey also marked the only time that publicly traded women-owned firms were tabulated . The difficulty of determining the gender of ownership of publicly traded firms led to their being put into a separate category thereafter .
The threshold of ownership has also changed over time . Prior to 1997, firms with 50% or more ownership by a woman or women were counted as women-owned . Starting with the 1997 census, that threshold was raised to 51% or more, to match government procurement definitions . Thus, the separate equally-owned category was born .
While the Summary Tables do offer tabulations of “women- and equally-owned firms,” this report will not focus on that population—because the method for determining equal ownership (which has, in our view, improved accuracy) has differed in each of the past three censuses . In 1997, equal ownership was determined at the company level through administrative records . Starting in 2002, ownership was determined at the personal rather than at the company level, by asking the gender of the top three owners of the firm (virtually all firms have three or fewer owners) . This methodological improvement resulted in a drop in the count of equally-owned firms from 1997 to 2002 . Then, in 2007, the gender of the top four owners of the firm was used to determine gender status of ownership, resulting in an increase in equally-owned firms . Therefore, while it may interest some to know the number and size of women- and equally-owned firms in each of these census years—and in our 2011 estimates—care should be taken not to ascribe changes over time to anything other than definitional differences .

8
state of Women-oWned businesses RepoRt
State Trends
Nationally, there are 8 .1 million women-owned businesses . The states with the greatest number of women-owned firms, naturally, are the most populous ones . California is home to the greatest number of women-owned firms in the country, followed by Texas, New York, Florida, and Illinois . The top five states are the same as in 1997, although Texas has surpassed New York to claim the number two spot .
top ten states: numbeR of Women-oWned businesses, 2011
state Number of Women-
Owned Firms
2011 Rank
1997 Rank
California 1,080,000 1 1
Texas 636,000 2 3
New York 622,300 3 2
Florida 585,500 4 4
Illinois 357,300 5 5
Georgia 287,500 6 10
Pennsylvania 282,600 7 7
Ohio 256,400 8 6
Michigan 242,900 9 8
North Carolina 236,100 10 12
Rounding out the top ten are Georgia, Pennsylvania, Ohio, Michigan and North Carolina . Only North Carolina is new to the top ten, moving up from the number 12 spot 14 years ago . Falling out of the top ten was New Jersey, which was the ninth most populous state for women-owned firms in 1997 and now stands at #11 .
For additional information on the number and size of women-owned firms at the state level—including estimates of number of firms, employment and revenues, and growth rates over the 1997-2011 period for all 50 states plus the District of Columbia, refer to Tables 3 and 4 in the Summary Tables section .
What is more interesting than looking at the states with the greatest number of women-owned firms, however, is to look at the growth in women-owned firms at the state level: both growth in terms of number of firms and in the revenues that these firms are generating .
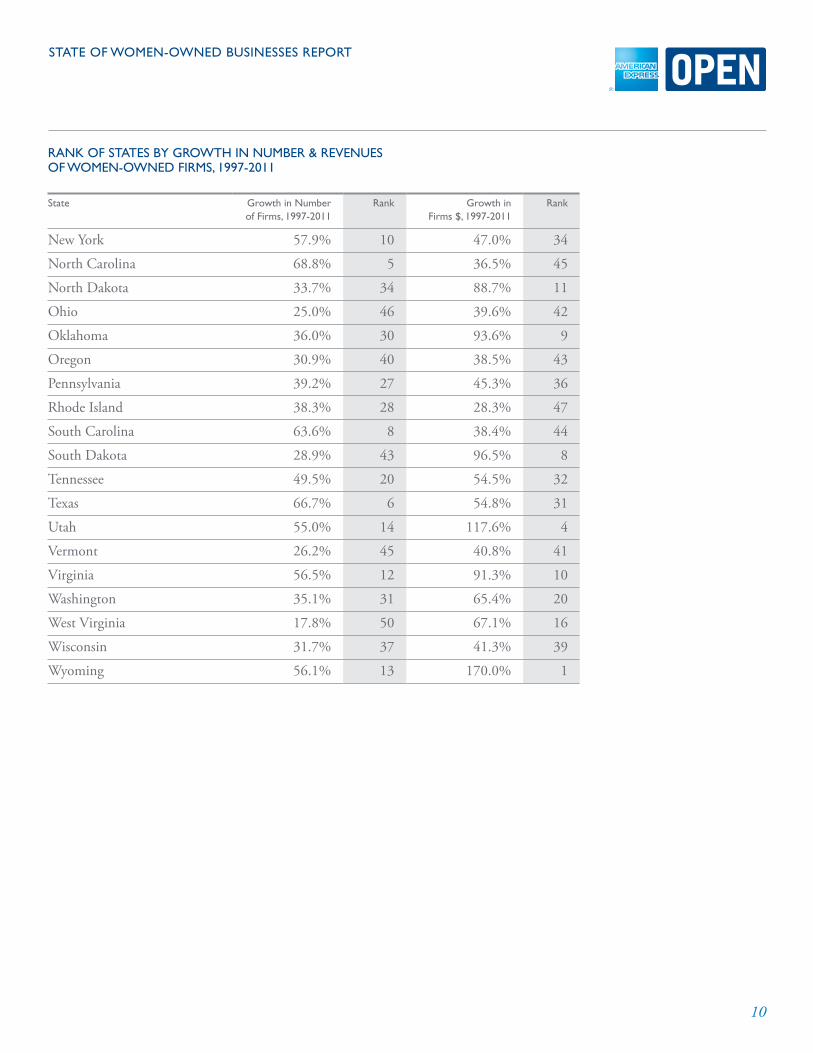
Nationally, the number of women-owned businesses has increased by 50% since 1997 . The states with the fastest growth in the number of women-owned firms over the past 14 years are: Georgia (97 .5%), Nevada (87 .6%), Mississippi (76 .7%), Florida (73 .3%), and North Carolina (68 .8%) . The states with the lowest rates of increase in the number of women-owned firms between 1997 and 2011 are: Alaska (8 .8%), West Virginia (17 .8%), Iowa (20 .1%), Indiana (23 .7%), and Vermont (26 .2%) .
In terms of growth in economic clout, the states in which the revenues of women-owned firms have increased well above the national average of 53 .4% over the 1997 to 2011 period are: Wyoming (170%), the District of Columbia (146 .7%), New Hampshire (117 .8%), Utah (117 .6%), and Louisiana (110 .3%) . The states in which the revenues of women-owned firms lag behind the national average to the greatest extent are: Iowa (which saw a 3 .1% decline in women-owned firm revenues), Maine (up only 12 .9%), Michigan (15 .3%), Illinois (24 .3%), and Rhode Island (28 .3%) .

9
state of Women-oWned businesses RepoRt
Rank of states by GRoWth in numbeR & Revenues of Women-oWned fiRms, 1997-2011
state Growth in number of firms, 1997-2011
Rank Growth in firms $, 1997-2011
Rank
Alabama 65 .7% 7 55 .3% 30
Alaska 8 .8% 51 61 .8% 25
Arizona 57 .8% 11 96 .7% 7
Arkansas 48 .2% 22 64 .3% 23
California 54 .2% 17 58 .9% 27
Colorado 47 .9% 23 78 .1% 13
Connecticut 35 .0% 32 66 .4% 17
Delaware 51 .5% 18 78 .8% 12
District of Columbia 50 .9% 19 146 .7% 2
Florida 73 .3% 4 60 .3% 26
Georgia 97 .5% 1 66 .1% 18
Hawaii 55 .0% 15 64 .5% 22
Idaho 40 .9% 25 75 .7% 15
Illinois 49 .0% 21 24 .3% 48
Indiana 23 .7% 47 58 .6% 28
Iowa 20 .1% 49 -3 .1% 51
Kansas 23 .7% 48 41 .1% 40
Kentucky 39 .3% 26 32 .1% 46
Louisiana 54 .5% 16 110 .3% 5
Maine 32 .4% 36 12 .9% 50
Maryland 61 .3% 9 65 .8% 19
Massachusetts 31 .1% 39 65 .3% 21
Michigan 31 .6% 38 15 .3% 49
Minnesota 27 .3% 44 45 .9% 35
Mississippi 76 .7% 3 56 .0% 29
Missouri 33 .3% 35 44 .2% 38
Montana 29 .9% 41 77 .6% 14
Nebraska 29 .1% 42 54 .2% 33
Nevada 87 .6% 2 107 .7% 6
New Hampshire 37 .2% 29 117 .8% 3
New Jersey 44 .8% 24 44 .7% 37
New Mexico 33 .8% 33 62 .4% 24
10
state of Women-oWned businesses RepoRt
Rank of states by GRoWth in numbeR & Revenues of Women-oWned fiRms, 1997-2011
state Growth in number of firms, 1997-2011
Rank Growth in firms $, 1997-2011
Rank
New York 57 .9% 10 47 .0% 34
North Carolina 68 .8% 5 36 .5% 45
North Dakota 33 .7% 34 88 .7% 11
Ohio 25 .0% 46 39 .6% 42
Oklahoma 36 .0% 30 93 .6% 9
Oregon 30 .9% 40 38 .5% 43
Pennsylvania 39 .2% 27 45 .3% 36
Rhode Island 38 .3% 28 28 .3% 47
South Carolina 63 .6% 8 38 .4% 44
South Dakota 28 .9% 43 96 .5% 8
Tennessee 49 .5% 20 54 .5% 32
Texas 66 .7% 6 54 .8% 31
Utah 55 .0% 14 117 .6% 4
Vermont 26 .2% 45 40 .8% 41
Virginia 56 .5% 12 91 .3% 10
Washington 35 .1% 31 65 .4% 20
West Virginia 17 .8% 50 67 .1% 16
Wisconsin 31 .7% 37 41 .3% 39
Wyoming 56 .1% 13 170 .0% 1
11
state of Women-oWned businesses RepoRt
Industry Trends
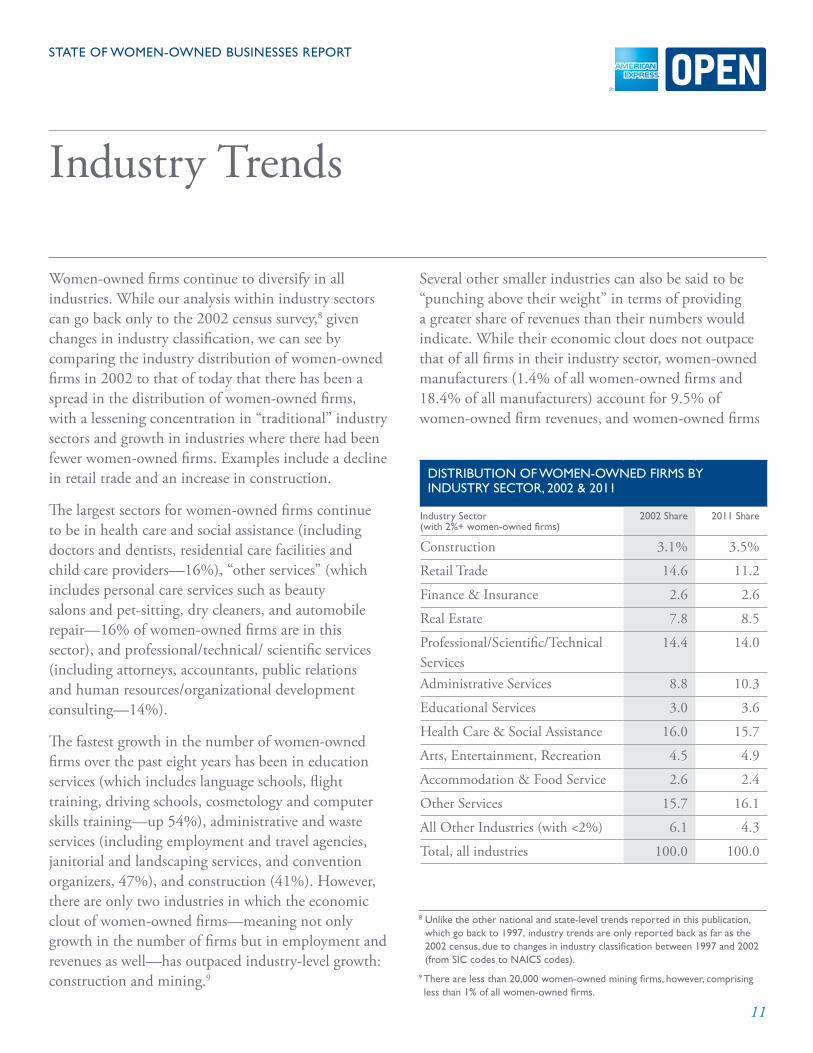
Women-owned firms continue to diversify in all industries . While our analysis within industry sectors can go back only to the 2002 census survey,8 given changes in industry classification, we can see by comparing the industry distribution of women-owned firms in 2002 to that of today that there has been a spread in the distribution of women-owned firms, with a lessening concentration in “traditional” industry sectors and growth in industries where there had been fewer women-owned firms . Examples include a decline in retail trade and an increase in construction .
The largest sectors for women-owned firms continue to be in health care and social assistance (including doctors and dentists, residential care facilities and child care providers—16%), “other services” (which includes personal care services such as beauty salons and pet-sitting, dry cleaners, and automobile repair—16% of women-owned firms are in this sector), and professional/technical/ scientific services (including attorneys, accountants, public relations and human resources/organizational development consulting—14%) .
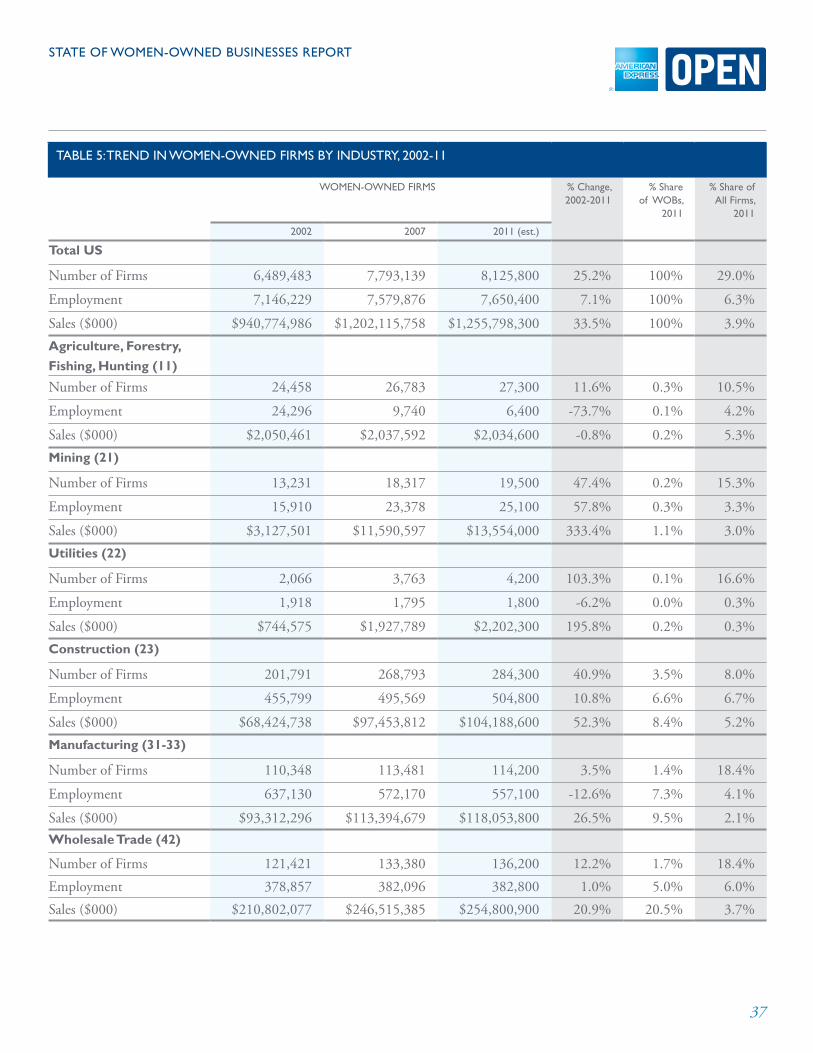
The fastest growth in the number of women-owned firms over the past eight years has been in education services (which includes language schools, flight training, driving schools, cosmetology and computer skills training—up 54%), administrative and waste services (including employment and travel agencies, janitorial and landscaping services, and convention organizers, 47%), and construction (41%) . However, there are only two industries in which the economic clout of women-owned firms—meaning not only growth in the number of firms but in employment and revenues as well—has outpaced industry-level growth: construction and mining .9
Several other smaller industries can also be said to be “punching above their weight” in terms of providing a greater share of revenues than their numbers would indicate . While their economic clout does not outpace that of all firms in their industry sector, women-owned manufacturers (1 .4% of all women-owned firms and 18 .4% of all manufacturers) account for 9 .5% of women-owned firm revenues, and women-owned firms
distRibution of Women-oWned fiRms by industRy sectoR, 2002 & 2011
industry sector (with 2%+ women-owned firms)
2002 share 2011 share
Construction 3 .1% 3 .5%
Retail Trade 14 .6 11 .2
Finance & Insurance 2 .6 2 .6
Real Estate 7 .8 8 .5
Professional/Scientific/Technical Services
14 .4 14 .0
Administrative Services 8 .8 10 .3
Educational Services 3 .0 3 .6
Health Care & Social Assistance 16 .0 15 .7
Arts, Entertainment, Recreation 4 .5 4 .9
Accommodation & Food Service 2 .6 2 .4
Other Services 15 .7 16 .1
All Other Industries (with <2%) 6 .1 4 .3
Total, all industries 100 .0 100 .0
8 unlike the other national and state-level trends reported in this publication, which go back to 1997, industry trends are only reported back as far as the 2002 census, due to changes in industry classification between 1997 and 2002 (from sic codes to naics codes).
9 there are less than 20,000 women-owned mining firms, however, comprising less than 1% of all women-owned firms.

12
state of Women-oWned businesses RepoRt
in the wholesale trade sector (1 .7% of women-owned firms and 18 .4% of all wholesale trade firms) contribute fully 20 .5% of women-owned firm revenues .
The industries with the highest concentration of women-owned firms are: health care and social assistance (52% of firms in this sector are women-owned, compared to a 29% share overall), educational services (46%), other services (41%), and administrative and waste services (37%) . The industries with the lowest concentration of women-owned firms (in industries contributing 2% or more of the business population) are construction (where just 8% of firms are women-owned) and finance and insurance (20%) . All other industries are close to the 29% share in all industries, again illustrating that women-owned firms are gaining a foothold in all sectors of the U .S . economy .
For more detailed information and a set of trend tables, see Tables 5 and 6 in the Summary Tables section .
HEALTH AND EDUCATIONAL SERVICES ARE DOMINANT INDUSTRIES FOR WOMEN
% S
hare
Wom
en-o
wne
d w
/in in
dust
ryAmerican Express OPEN/Womenable estimates as of 2011, based on 1997-2007 data from US Census Bureau.
Construction and Finance/Insurance are Most Male-Dominated
29% among all industries
8
2025 25
29 31 34
3741
46
52
Con
stru
ctio
n
Fina
nce/
Insu
ranc
e
Rea
l Est
ate
Acc
omm
/Foo
d Sv
c
P/S/
T S
vc
Art
s/En
t/R
ec
Ret
ail T
rade
Adm
in S
vcs
Oth
er S
vcs
Educ
Svc
s
Hea
lth C
are

13
state of Women-oWned businesses RepoRt
The Economic Clout of Woman-Owned Firms: Steady Growth, Stalled ProgressPerhaps the most important insight gained from our analysis lies not in an accounting of the current number of women-owned enterprises, nor in industry or state trends, but in our finding that—even as women-owned firms continue to grow in number at rates exceeding the national average—they are not moving along the growth continuum . In terms of both revenue and employment, the share of women-owned firms at higher levels of business accomplishment has remained essentially unchanged over the past 14 years .
The situation is much the same for men-owned firms . While men-owned firms are, on average, larger than women-owned firms—about twice as many have firms with 10 or more employees and three times as many have reached the $1 million revenue mark—they, too, have not moved up the growth continuum . Let’s explore this situation in more detail .
Revenue GRoWthIn 1997, 1 .8% of women-owned enterprises had $1 million or more in revenues . As of 2011, while the absolute number of those enterprises has grown—from under 100,000 to nearly 150,000—their share remains at 1 .8% of the women-owned business population . Looking across the revenue size spectrum within the population of women-owned firms, we can see that women-owned firms are exceeding their average 50% increase in numbers between 1997 and 2011 only among firms in the $10,000 to $100,000 revenue range . (Dark blue line in chart at right .)
Looking at revenue growth across the business size spectrum (light blue line) paints a more positive picture . Women-owned firms generating $1 million or more in revenues, as well as those generating between $10,000 and $100,000 in revenue, have seen above average revenue growth since 1997, compared to the average woman-owned business .
This finding within the population of women-owned firms contrasts with the finding among all firms, where only firms with $1 million or more in revenue had above-average revenue growth . As seen in the chart on page 14, the revenue growth of women-owned firms by revenue size class (light blue line) exceeds the national average (dark blue line) all the way up to the million-dollar revenue mark .
WOMEN-OWNED FIRMS GENERATING $5-100KSEEING GREATEST GROWTH IN NUMBER & CLOUT
# Firms
% G
RO
WT
H, 1
997-
2011
REVENUE SIZE OF FIRMAmerican Express OPEN/Womenable estimates as of 2011, based on 1997-2007 data from US Census Bureau.
Revenue
<$5K $5-9.9K $10-24.9K $25-49.9K $50-99.9K $100-249K $250-499K $500-999K $1M+
Avg Growth in # Firms, 50%
Avg Growth in Revenue 53.4%
30
40
50
60
70
$1M+ Firms Also Exceed Avg. Revenue Growth

14
state of Women-oWned businesses RepoRt
REVENURE GROWTH OF WOMEN-OWNED FIRMSEXCEEDS NATIONAL AVERAGE EXCEPT AT $1M+ LEVEL
All Firms
% G
RO
WT
H IN
REV
ENU
ES, 1
997-
2011
REVENUE SIZE OF FIRMAmerican Express OPEN/Womenable estimates as of 2011, based on 1997-2007 data from US Census Bureau.
Women-Owned Firms Men-Owned Firms
<$5K $5-9.9K $10-24.9K $25-49.9K $50-99.9K $100-249K $250-499K $500-999K $1M+
Overall avg revenue growth: 71.4%
Men-Owned Firms Lag Behind All But the Smallest Firms
0
10
20
30
40
50
60
70
80
In contrast, revenue growth among men-owned firms (grey line) lags behind the national average in all but among the smallest revenue classes—firms with less than $10,000 in revenue .
employment GRoWthIn 1997, 2 .5% of women-owned firms had 10 or more employees . As of 2011, while the absolute number of women-owned firms employing 100 or more workers is up slightly (from 7,439 to an estimated 7,700), the share of women-owned firms with 100+ employees has declined slightly, to 1 .9% . In terms of the evaluating the growth in the number of women-owned firms across the employee-size spectrum, average growth is exceeded only among non-employer firms . As one looks along the employment size spectrum (dark blue line in chart above right), the rate of growth in the number of women-owned firms declines steadily as the employment size of the firm increases .
Looking at employment growth across the business size spectrum, again among women-owned firms only, (light blue line in chart above right) finds that the average 8 .1% employment growth among women-owned firms
is exceeded only among firms with between 10 and 99 employees; employment growth among both very small and larger women-owned firms has been below average over the past 14 years .
. GROWTH IN EMPLOYMENT HIGHEST IN WOMEN-OWNEDFIRMS WITH 10-100 EMPLOYEES
% G
RO
WT
H, 1
997-
2011
American Express OPEN/Womenable estimates as of 2011, based on 1997-2007 data from US Census Bureau.
0 1-4 5-9 10-19 20-49 50-99 100-499 500+
Avg Growth in # Firms, 50%
Self-Employed Growing in Number, Larger Firms Declined in Number
Avg Growth in Employment, 8.1%0
10
20
30
40
-10
-20
-30
50
60
Number of FirmsEmployment
EMPLOYMENT SIZE OF FIRM
When employment growth among women-owned firms is compared with that of men-owned firms and all U .S . firms, however (see chart on page 15), it can clearly be seen that women-owned firms (light blue line) keep pace with employment growth among all firms (dark blue line) up until the 100-employee mark, and exceed employment growth compared to men-owned firms (grey line) up until the 500-employee mark .
Clearly, when comparing like to like, small- and mid-size women-owned firms are keeping pace with the national average—and are topping the very sluggish growth seen among men-owned firms during the 1997-2011 period .
However, something is putting women-owned firms off their stride as they grow larger; they fall behind toward the end of the entrepreneurial marathon, when entering the 100-employee and million-dollar “anchor leg” of the race .

15
state of Women-oWned businesses RepoRt
EMPLOYMENT GROWTH OF WOMEN-OWNED FIRMSMATCHES NAT’L AVERAGE UNTIL 100-EMPLOYEE MARK
% G
RO
WT
H I
N E
MPL
OYM
ENT
1997
-201
1
American Express OPEN/Womenable estimates as of 2011, based on 1997–2007 data from US Census Bureau.
1–4 5–9 10–19 20–49 50–99 100–499 500+
Overall avg employment growth: 16.8%
-10
0
5
-15
-5
10
15
20
25 All Firms Women-Owned Firms Men-Owned Firms
EMPLOYMENT SIZE OF FIRM
measuRinG GRoWth: the denominatoR matteRsAs has been mentioned, a review of economic trends over the past 14 years by business size shows relatively smaller differences in the contributions of women- and men-owned firms than between the contributions of small and very large firms: the big firms are getting bigger and too many of the small firms are staying small .
Earlier, we reported that women-owned firms contribute 6% of U .S . jobs and 4% of firm revenues, and that these shares have not grown substantially since 1997 . (See dotted lines in chart on the right .) While true, if one looks at the share of employment and revenue provided by women-owned firms among the population of privately held firms (solid lines
in chart)—taking large, publicly traded firms out of the picture—women-owned firms are providing employment to 13% of the smaller firm workforce and generating 11% of firm revenue—and those shares have grown over the past 14 years .
Thus, moderate growth in the economic contributions of women-owned businesses has been masked by the overall trend in large firm economic dominance . While this does not discount the most significant finding—that women-owned firms are generally keeping pace with revenue and employment growth until scaling the final hill of “the entrepreneurial marathon”—it does show that, among privately-held firms at least, there has been some improvement in the economic contributions of women-owned firms .
TREND IN ECONOMIC GROWTH OF WOMEN-OWNEDFIRMS MASKED BY LARGE FIRM CONTRIBUTIONS
% S
hare
of _
_ Pr
ovid
ed B
y W
omen
-Ow
ned
Firm
s
SOURCES: 1997-2007, Census Bureau. 2011 estimates, American Express OPEN/Womenable.
Greater Growth Seen If Comparison Made to Private Firms
Employment vs PrivateRevenues vs Private
Employment vs AllRevenue vs All
4.4
1997 2002 2007 2011
4.2 4 3.9
6.8 6.5 6.4 6.3
9.810.7 10.9 11.1
1212.9 13.2 13.4

16
state of Women-oWned businesses RepoRt
Looking Forward: Better Understanding the Entrepreneurial MarathonThis report hopes to make important contributions to the women’s enterprise community on several levels . First, it provides up-to-date estimates of the number and the economic contributions of women-owned enterprises—not only nationally but by industry and state as well .
Second, this publication charts new ground by taking a detailed look at the economic contributions and growth of women-owned enterprises at all levels of business size, showing for the first time that women-owned firms are, indeed, keeping pace with all U .S . firms—and staying ahead of their male counterparts—but only until they reach the “Heartbreak Hill” of the entrepreneurial marathon: the 100-employee threshold and the million-dollar revenue mark .
Third, we hope that this report will start a much needed dialogue about how we are—or are not—serving the needs of women and men business owners as they train for and begin their entrepreneurial marathon . In particular, are we channeling women and men onto different paths based on incorrect assumptions of their growth intentions? And are our definitions of business success and valuations of entrepreneurial goals broad enough to include less linear paths, blending growth with balance, and measuring triple bottom line10 returns on investment—areas in which women business owners have been shown to differ from many of their male counterparts?
It has long been known that the vast majority of women- and men-owned firms start small and stay that way . We also know that women-owned firms are typically both younger and smaller than their male-owned counterparts . However, the new data brought to light in this report should help dispel the myth that women are “lifestyle business owners” or that their firms are small by choice . If that were the case they would not be keeping pace with the average employment and revenue growth along the business size spectrum—and not growing faster than men-owned firms—but only up to the 100-employee threshold or the million-dollar mark .
Something is preventing many women business owners from reaching their full potential—and this is of critical importance not only from a human capital development perspective but from a job creation perspective . The more we learn about how to help more women business owners achieve higher levels of growth—what internal or external barriers to growth need to be addressed—the stronger our national economy will be .
It is hoped that these findings will spur greater conversation, collaboration and cooperation at all levels—in the public sector, in the small business community, among entrepreneurship support providers and among corporate decision makers—in furtherance of our common goal of spurring economic growth and small business development . Start booming!
10 this term refers to measuring business success not only by monetary profit (the first bottom line) but also by a firm’s impact on the people and the planet.
17
state of Women-oWned businesses RepoRt
Study MethodologyThis report is based on data from the United States Census Bureau, specifically their de-facto quinquennial business census, the Survey of Business Owners (SBO), which is conducted every five years in years ending in 2 and 7 . Data from the past three census surveys—1997, 2002, and 2007—were collated, analyzed and extrapolated forward to 2011, factoring in relative changes in Gross Domestic Product (GDP) both nationally and at the state level .
Specifically, growth in GDP from 1997 to 2007 ($8 .3 to $14 trillion) was compared to that from 2007 to the fourth quarter of 2010 ($14 to $14 .7 trillion) . Relative
annual growth rates were then used to estimate the growth in the number of firms over the 2007 to 2011 period—thus bending a straight-line extrapolation downward in keeping with slower economic growth during the period . This was done both at the national level and with gross state product figures (which were available up to the fourth quarter of 2009) .
For detailed information on the 1997, 2002, and 2007 economic censuses, visit: http://www .census .gov/econ/census07/www/get_data .html . A preview of upcoming changes for the 2012 economic census may be found at: http://www .census .gov/econ/census12/ .
AcknowledgementsThis report is commissioned and provided by American Express OPEN . American Express OPEN is the leading payment card issuer for small businesses in the United States and supports business owners with products and services to help them run and grow their businesses . This includes business charge and credit cards that deliver purchasing power, flexibility, rewards, savings on business services from an expanded lineup of partners and online tools and services designed to help improve profitability . Learn more at www .OPEN .com and connect with us at openforum .com and twitter .com/openforum .
American Express is a global services company, providing customers with access to products, insights and experiences that enrich lives and build business success . Learn more at www .americanexpress .com and connect
with us on www .facebook .com/americanexpress, www .twitter .com/americanexpress and www .youtube .com/americanexpress .
This report was prepared for American Express OPEN by Womenable, a research, program and policy development consultancy whose mission is to improve the environment for women-owned businesses worldwide . Womenable pursues this mission by working with the stewards of women’s entrepreneurship around the world—policy makers, multi-lateral organizations, corporate decision makers, entrepreneurial support organizations and the women’s business community—to evaluate, implement and improve policies and programs to support women’s enterprise development . Learn more at womenable .com .
18
state of Women-oWned businesses RepoRt
Summary Tables
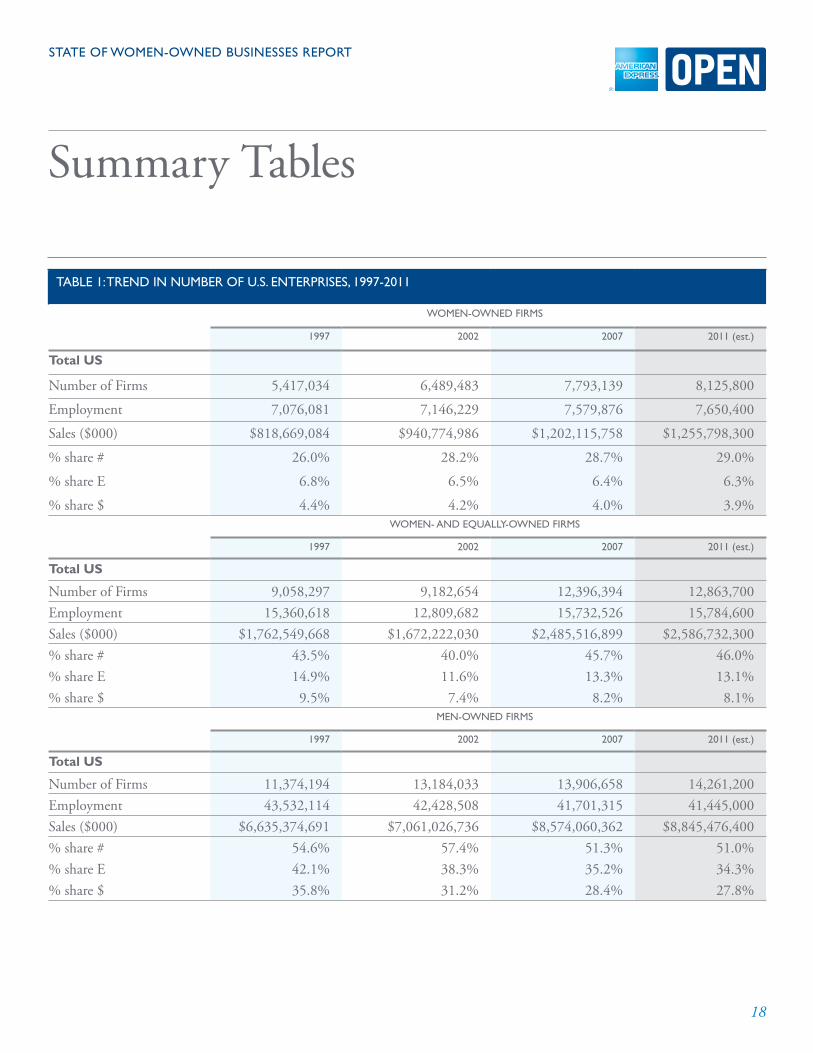
table 1: tRend in numbeR of u.s. enteRpRises, 1997-2011
Women-oWned fiRms
1997 2002 2007 2011 (est.)
Total US
Number of Firms 5,417,034 6,489,483 7,793,139 8,125,800
Employment 7,076,081 7,146,229 7,579,876 7,650,400
Sales ($000) $818,669,084 $940,774,986 $1,202,115,758 $1,255,798,300
% share # 26 .0% 28 .2% 28 .7% 29 .0%
% share E 6 .8% 6 .5% 6 .4% 6 .3%
% share $ 4 .4% 4 .2% 4 .0% 3 .9%Women- and equally-oWned fiRms
1997 2002 2007 2011 (est.)
Total US
Number of Firms 9,058,297 9,182,654 12,396,394 12,863,700 Employment 15,360,618 12,809,682 15,732,526 15,784,600 Sales ($000) $1,762,549,668 $1,672,222,030 $2,485,516,899 $2,586,732,300% share # 43 .5% 40 .0% 45 .7% 46 .0%% share E 14 .9% 11 .6% 13 .3% 13 .1%% share $ 9 .5% 7 .4% 8 .2% 8 .1%
men-oWned fiRms
1997 2002 2007 2011 (est.)
Total US
Number of Firms 11,374,194 13,184,033 13,906,658 14,261,200 Employment 43,532,114 42,428,508 41,701,315 41,445,000 Sales ($000) $6,635,374,691 $7,061,026,736 $8,574,060,362 $8,845,476,400% share # 54 .6% 57 .4% 51 .3% 51 .0%% share E 42 .1% 38 .3% 35 .2% 34 .3%% share $ 35 .8% 31 .2% 28 .4% 27 .8%
19
state of Women-oWned businesses RepoRt
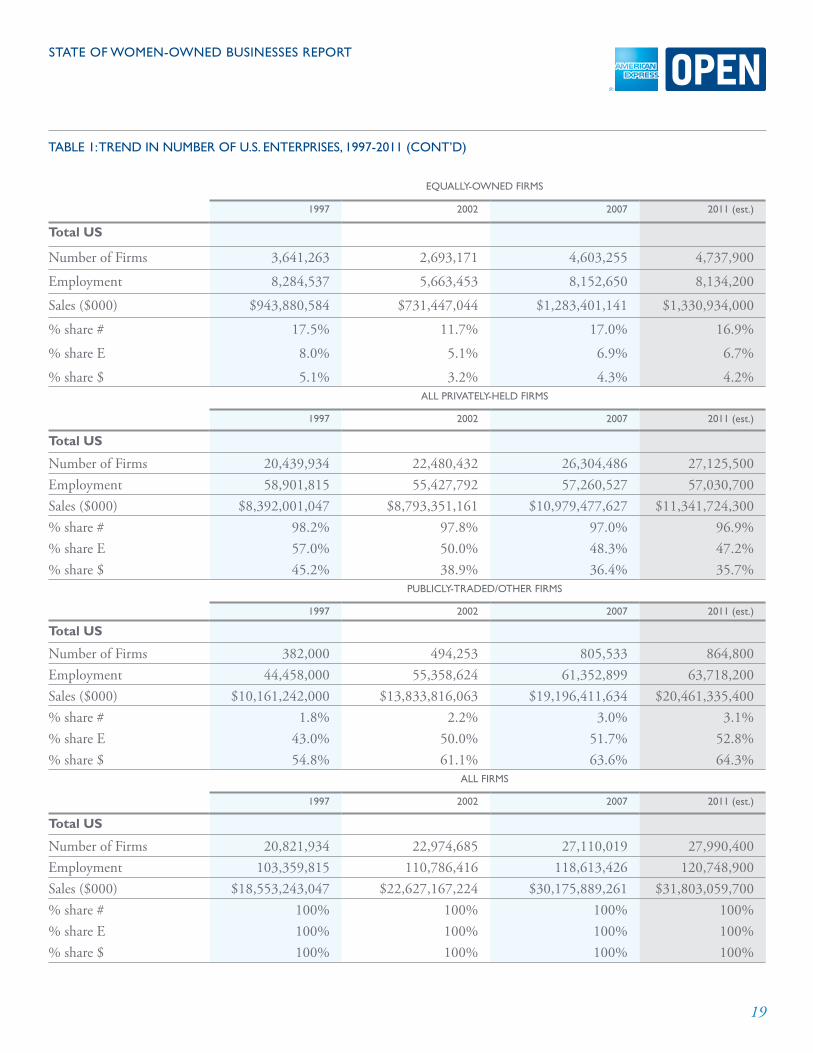
table 1: tRend in numbeR of u.s. enteRpRises, 1997-2011 (cont’d)
equally-oWned fiRms
1997 2002 2007 2011 (est.)
Total US
Number of Firms 3,641,263 2,693,171 4,603,255 4,737,900
Employment 8,284,537 5,663,453 8,152,650 8,134,200
Sales ($000) $943,880,584 $731,447,044 $1,283,401,141 $1,330,934,000
% share # 17 .5% 11 .7% 17 .0% 16 .9%
% share E 8 .0% 5 .1% 6 .9% 6 .7%
% share $ 5 .1% 3 .2% 4 .3% 4 .2%all pRivately-held fiRms
1997 2002 2007 2011 (est.)
Total US
Number of Firms 20,439,934 22,480,432 26,304,486 27,125,500 Employment 58,901,815 55,427,792 57,260,527 57,030,700 Sales ($000) $8,392,001,047 $8,793,351,161 $10,979,477,627 $11,341,724,300% share # 98 .2% 97 .8% 97 .0% 96 .9%% share E 57 .0% 50 .0% 48 .3% 47 .2%% share $ 45 .2% 38 .9% 36 .4% 35 .7%
publicly-tRaded/otheR fiRms
1997 2002 2007 2011 (est.)
Total US
Number of Firms 382,000 494,253 805,533 864,800 Employment 44,458,000 55,358,624 61,352,899 63,718,200 Sales ($000) $10,161,242,000 $13,833,816,063 $19,196,411,634 $20,461,335,400% share # 1 .8% 2 .2% 3 .0% 3 .1%% share E 43 .0% 50 .0% 51 .7% 52 .8%% share $ 54 .8% 61 .1% 63 .6% 64 .3%
all fiRms
1997 2002 2007 2011 (est.)
Total US
Number of Firms 20,821,934 22,974,685 27,110,019 27,990,400 Employment 103,359,815 110,786,416 118,613,426 120,748,900 Sales ($000) $18,553,243,047 $22,627,167,224 $30,175,889,261 $31,803,059,700% share # 100% 100% 100% 100%% share E 100% 100% 100% 100%% share $ 100% 100% 100% 100%
20
state of Women-oWned businesses RepoRt
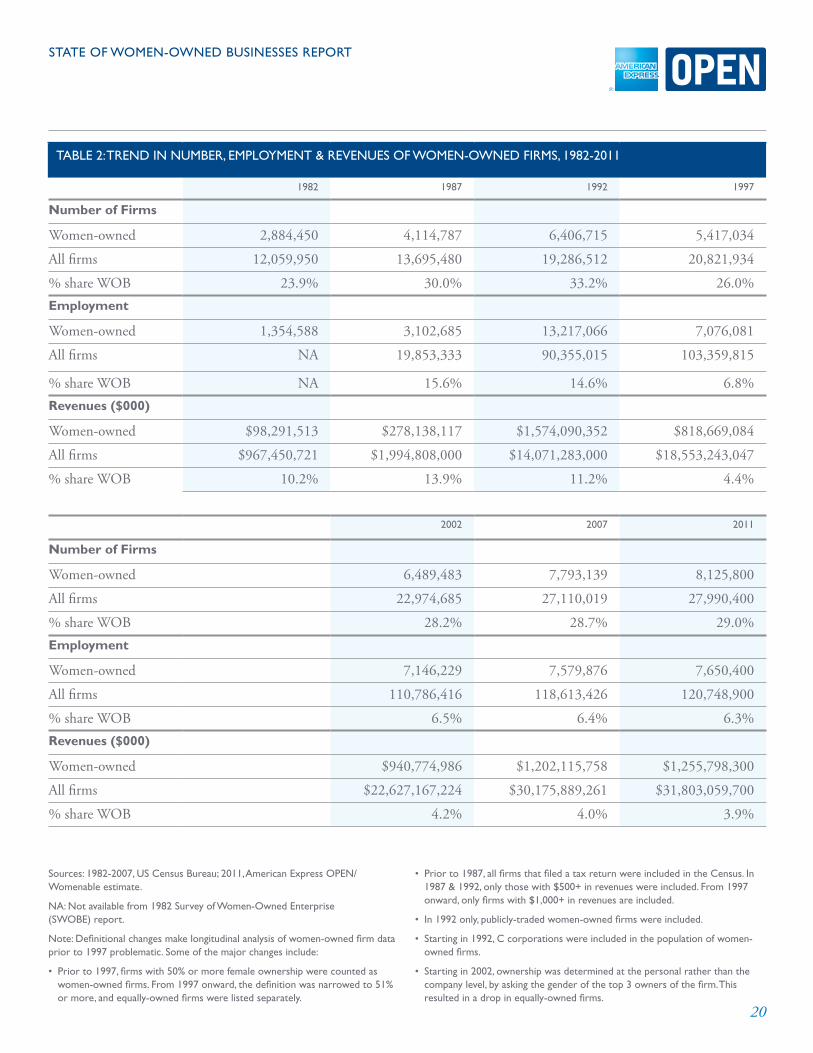
table 2: tRend in numbeR, employment & Revenues of Women-oWned fiRms, 1982-2011
1982 1987 1992 1997
Number of Firms
Women-owned 2,884,450 4,114,787 6,406,715 5,417,034
All firms 12,059,950 13,695,480 19,286,512 20,821,934
% share WOB 23 .9% 30 .0% 33 .2% 26 .0%Employment
Women-owned 1,354,588 3,102,685 13,217,066 7,076,081
All firms NA 19,853,333 90,355,015 103,359,815
% share WOB NA 15 .6% 14 .6% 6 .8%Revenues ($000)
Women-owned $98,291,513 $278,138,117 $1,574,090,352 $818,669,084
All firms $967,450,721 $1,994,808,000 $14,071,283,000 $18,553,243,047
% share WOB 10 .2% 13 .9% 11 .2% 4 .4%
2002 2007 2011
Number of Firms
Women-owned 6,489,483 7,793,139 8,125,800
All firms 22,974,685 27,110,019 27,990,400
% share WOB 28 .2% 28 .7% 29 .0%Employment
Women-owned 7,146,229 7,579,876 7,650,400
All firms 110,786,416 118,613,426 120,748,900
% share WOB 6 .5% 6 .4% 6 .3%Revenues ($000)
Women-owned $940,774,986 $1,202,115,758 $1,255,798,300
All firms $22,627,167,224 $30,175,889,261 $31,803,059,700
% share WOB 4 .2% 4 .0% 3 .9%
sources: 1982-2007, us census bureau; 2011, american express open/Womenable estimate.
na: not available from 1982 survey of Women-owned enterprise (sWobe) report.
note: definitional changes make longitudinal analysis of women-owned firm data prior to 1997 problematic. some of the major changes include:
• Priorto1997,firmswith50%ormorefemaleownershipwerecountedaswomen-owned firms. from 1997 onward, the definition was narrowed to 51% or more, and equally-owned firms were listed separately.
• Priorto1987,allfirmsthatfiledataxreturnwereincludedintheCensus.In1987 & 1992, only those with $500+ in revenues were included. from 1997 onward, only firms with $1,000+ in revenues are included.
• In1992only,publicly-tradedwomen-ownedfirmswereincluded.
• Startingin1992,Ccorporationswereincludedinthepopulationofwomen-owned firms.
• Startingin2002,ownershipwasdeterminedatthepersonalratherthanthecompany level, by asking the gender of the top 3 owners of the firm. this resulted in a drop in equally-owned firms.

21
state of Women-oWned businesses RepoRt
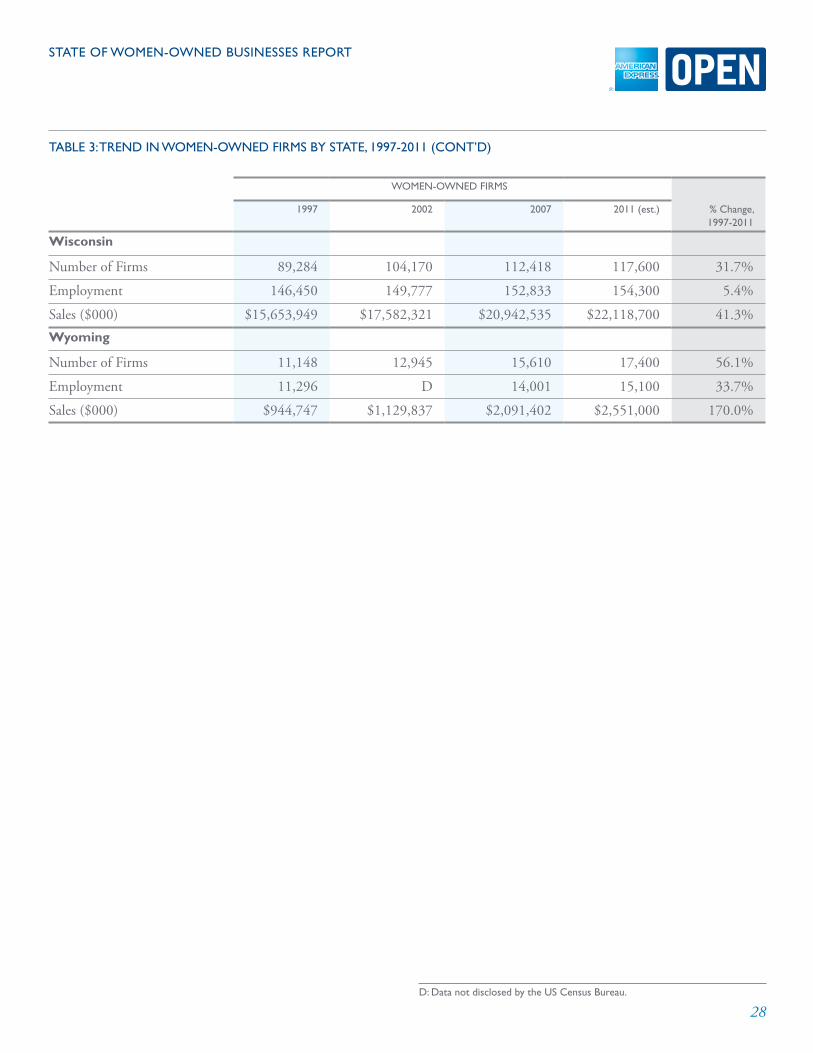
table 3: tRend in Women-oWned fiRms by state, 1997-2011
Women-oWned fiRms
1997 2002 2007 2011 (est.) % change, 1997-2011
Total US
Number of Firms 5,417,034 6,489,483 7,793,139 8,125,800 50 .0%
Employment 7,076,081 7,146,229 7,579,876 7,650,400 8 .1%
Sales ($000) $818,669,084 $940,774,986 $1,202,115,758 $1,255,798,300 53 .4%Alabama
Number of Firms 69,515 81,821 107,481 115,200 65 .7%
Employment 97,966 96,235 100,695 101,200 3 .3%
Sales ($000) $10,230,379 $11,435,046 $14,939,027 $15,890,200 55 .3%Alaska
Number of Firms 16,633 16,308 17,822 18,100 8 .8%
Employment 16,520 17,556 18,440 18,900 14 .4%
Sales ($000) $1,942,339 $2,348,329 $2,931,415 $3,143,100 61 .8%Arizona
Number of Firms 88,780 109,748 138,080 140,100 57 .8%
Employment 101,601 128,926 147,392 149,300 46 .9%
Sales ($000) $11,304,658 $15,761,202 $21,795,502 $22,231,900 96 .7%Arkansas Number of Firms 42,581 49,618 58,585 63,100 48 .2%
Employment 64,379 54,969 62,129 61,500 -4 .5%
Sales ($000) $6,490,255 $6,339,427 $9,752,602 $10,663,400 64 .3%California
Number of Firms 700,513 870,496 1,039,486 1,080,000 54 .2%
Employment 932,462 941,136 974,622 979,700 5 .1%
Sales ($000) $121,191,163 $137,692,325 $184,974,809 $192,603,300 58 .9%Colorado
Number of Firms 114,807 135,220 160,083 169,800 47 .9%
Employment 132,506 128,447 138,617 139,900 5 .6%
Sales ($000) $13,762,595 $16,359,446 $22,618,972 $24,510,700 78 .1%Connecticut Number of Firms 72,393 82,118 93,480 97,700 35 .0%
Employment 78,598 88,074 89,942 92,200 17 .3%
Sales ($000) $9,276,337 $12,215,939 $14,409,072 $15,437,700 66 .4%

22
state of Women-oWned businesses RepoRt
table 3: tRend in Women-oWned fiRms by state, 1997-2011 (cont’d)
Women-oWned fiRms
1997 2002 2007 2011 (est.) % change, 1997-2011
Delaware
Number of Firms 13,662 15,344 19,446 20,700 51 .5%
Employment 19,192 19,359 18,402 18,200 -5 .2%
Sales ($000) $1,831,055 $2,020,973 $3,017,397 $3,274,600 78 .8%District of Columbia
Number of Firms 13,979 15,675 19,286 21,100 50 .9%
Employment 17,320 D 25,977 28,900 66 .9%
Sales ($000) $1,813,270 $2,403,019 $3,805,691 $4,473,600 146 .7%Florida
Number of Firms 337,811 437,355 581,192 585,500 73 .3%
Employment 371,412 432,071 470,466 472,200 27 .1%
Sales ($000) $48,261,328 $61,275,106 $76,867,239 $77,370,700 60 .3%Georgia
Number of Firms 145,576 196,195 278,334 287,500 97 .5%
Employment 190,577 196,810 228,992 231,600 21 .5%
Sales ($000) $25,267,240 $30,026,706 $40,889,861 $41,964,700 66 .1%Hawaii
Number of Firms 25,807 29,943 37,373 40,000 55 .0%
Employment 30,138 38,569 37,748 39,500 31 .1%
Sales ($000) $3,253,329 $4,594,306 $4,968,149 $5,352,300 64 .5%Idaho
Number of Firms 25,763 28,824 35,594 36,300 40 .9%
Employment 25,873 26,633 32,873 33,400 29 .1%
Sales ($000) $2,405,407 $3,216,407 $4,103,736 $4,227,400 75 .7%Illinois Number of Firms 239,725 284,954 343,111 357,300 49 .0%
Employment 392,569 351,317 339,371 332,100 -15 .4%
Sales ($000) $44,273,464 $46,861,800 $53,730,382 $55,027,900 24 .3%

23
state of Women-oWned businesses RepoRt
table 3: tRend in Women-oWned fiRms by state, 1997-2011 (cont’d)
Women-oWned fiRms
1997 2002 2007 2011 (est.) % change, 1997-2011
Indiana
Number of Firms 107,082 118,857 129,621 132,500 23 .7%
Employment 131,778 136,457 150,463 152,800 16 .0%
Sales ($000) $13,578,102 $16,481,128 $20,637,409 $21,529,700 58 .6%Iowa
Number of Firms 57,527 63,821 66,270 69,100 20 .1%
Employment 71,724 63,324 61,243 57,900 -19 .3%
Sales ($000) $8,093,311 $7,398,962 $7,886,061 $7,844,200 -3 .1%Kansas
Number of Firms 54,638 59,635 65,180 67,600 23 .7%
Employment 58,497 61,596 68,098 70,300 20 .2%
Sales ($000) $6,928,221 $6,948,910 $9,253,112 $9,778,500 41 .1%Kentucky
Number of Firms 65,965 77,159 86,429 91,900 39 .3%
Employment 95,453 84,096 89,059 87,300 -8 .5%
Sales ($000) $9,876,600 $9,451,101 $12,381,271 $13,051,500 32 .1%Louisiana
Number of Firms 70,550 86,876 102,847 109,000 54 .5%
Employment 116,063 114,635 110,631 109,600 -5 .6%
Sales ($000) $11,462,806 $12,253,105 $22,092,433 $24,107,800 110 .3%Maine
Number of Firms 30,598 32,512 38,490 40,500 32 .4%
Employment 28,263 26,510 29,648 30,000 6 .1%
Sales ($000) $3,212,307 $3,282,306 $3,541,893 $3,625,900 12 .9%Maryland
Number of Firms 115,801 137,410 172,115 186,800 61 .3%
Employment 139,616 141,906 165,454 172,200 23 .3%
Sales ($000) $14,657,414 $17,295,183 $22,307,616 $24,308,900 65 .8%

24
state of Women-oWned businesses RepoRt
table 3: tRend in Women-oWned fiRms by state, 1997-2011 (cont’d)
Women-oWned fiRms
1997 2002 2007 2011 (est.) % change, 1997-2011
Massachusetts
Number of Firms 142,661 161,918 178,114 187,000 31 .1%
Employment 155,191 173,368 167,928 171,100 10 .3%
Sales ($000) $16,752,596 $23,133,981 $25,487,227 $27,684,900 65 .3%Michigan
Number of Firms 184,590 217,673 248,421 242,900 31 .6%
Employment 228,132 229,221 244,342 242,900 6 .5%
Sales ($000) $26,498,569 $29,216,689 $30,928,408 $30,545,700 15 .3%Minnesota
Number of Firms 108,417 123,905 133,237 138,000 27 .3%
Employment 124,616 123,233 140,525 143,600 15 .2%
Sales ($000) $13,457,542 $16,251,660 $18,635,862 $19,638,400 45 .9%Mississippi
Number of Firms 38,321 47,102 60,846 67,700 76 .7%
Employment 54,183 53,948 56,715 57,500 6 .1%
Sales ($000) $5,995,011 $6,728,498 $8,572,422 $9,352,900 56 .0%Missouri
Number of Firms 103,626 120,443 130,726 138,100 33 .3%
Employment 134,301 147,372 140,142 141,700 5 .5%
Sales ($000) $15,002,981 $18,604,649 $20,217,661 $21,640,200 44 .2%Montana
Number of Firms 22,404 24,519 28,129 29,100 29 .9%
Employment 22,240 21,238 28,532 29,600 33 .1%
Sales ($000) $2,047,559 $2,138,505 $3,397,707 $3,635,900 77 .6%Nebraska
Number of Firms 33,469 38,679 41,003 43,200 29 .1%
Employment 42,044 46,868 46,708 48,100 14 .4%
Sales ($000) $4,536,547 $5,765,418 $6,432,875 $6,994,200 54 .2%

25
state of Women-oWned businesses RepoRt
table 3: tRend in Women-oWned fiRms by state, 1997-2011 (cont’d)
Women-oWned fiRms
1997 2002 2007 2011 (est.) % change, 1997-2011
Nevada
Number of Firms 33,311 47,675 63,317 62,500 87 .6%
Employment 49,477 54,268 64,773 64,400 30 .2%
Sales ($000) $5,971,518 $8,643,138 $12,579,594 $12,405,100 107 .7%New Hampshire
Number of Firms 27,265 31,024 35,586 37,400 37 .2%
Employment 33,911 37,731 36,984 37,700 11 .2%
Sales ($000) $3,112,620 $4,665,353 $6,127,210 $6,780,800 117 .8%New Jersey
Number of Firms 155,345 185,197 213,398 224,900 44 .8%
Employment 247,040 243,020 256,397 258,200 4 .5%
Sales ($000) $30,000,725 $35,573,077 $41,189,464 $43,404,800 44 .7%New Mexico
Number of Firms 38,706 42,254 49,886 51,800 33 .8%
Employment 48,236 42,037 49,378 49,600 2 .8%
Sales ($000) $4,449,686 $4,714,288 $6,814,989 $7,226,600 62 .4%New York
Number of Firms 394,014 505,077 594,492 622,300 57 .9%
Employment 461,127 469,207 466,606 467,400 1 .4%
Sales ($000) $59,496,722 $70,838,360 $84,046,898 $87,454,500 47 .0%North Carolina
Number of Firms 139,900 173,874 225,512 236,100 68 .8%
Employment 221,973 224,736 253,009 256,800 15 .7%
Sales ($000) $24,166,074 $26,743,381 $32,023,015 $32,991,000 36 .5%North Dakota
Number of Firms 12,417 13,203 15,237 16,600 33 .7%
Employment 13,482 11,651 16,120 17,400 29 .1%
Sales ($000) $1,166,763 $1,317,510 $1,860,625 $2,201,700 88 .7%

26
state of Women-oWned businesses RepoRt
table 3: tRend in Women-oWned fiRms by state, 1997-2011 (cont’d)
Women-oWned fiRms
1997 2002 2007 2011 (est.) % change, 1997-2011
Ohio
Number of Firms 205,044 229,972 249,114 256,400 25 .0%
Employment 291,361 264,038 289,699 289,400 -0 .7%
Sales ($000) $30,596,853 $32,314,892 $40,985,031 $42,713,600 39 .6%Oklahoma
Number of Firms 67,481 75,025 84,427 91,800 36 .0%
Employment 82,531 92,546 96,698 102,900 24 .7%
Sales ($000) $8,911,638 $9,254,893 $14,717,185 $17,253,000 93 .6%Oregon
Number of Firms 80,543 88,317 103,620 105,400 30 .9%
Employment 91,379 83,054 97,076 97,500 6 .7%
Sales ($000) $10,334,626 $10,608,262 $14,035,799 $14,314,100 38 .5%Pennsylvania
Number of Firms 202,990 227,117 265,136 282,600 39 .2%
Employment 257,841 279,970 288,393 297,000 15 .2%
Sales ($000) $34,043,332 $38,998,092 $46,082,536 $49,468,000 45 .3%Rhode Island
Number of Firms 19,886 23,195 26,431 27,500 38 .3%
Employment 28,678 25,562 22,417 21,400 -25 .4%
Sales ($000) $2,683,580 $3,640,614 $3,339,397 $3,442,800 28 .3%South Carolina
Number of Firms 64,232 76,831 99,458 105,100 63 .6%
Employment 100,284 92,773 100,308 100,300 0 .0%
Sales ($000) $10,634,412 $10,890,936 $14,149,756 $14,713,600 38 .4%South Dakota
Number of Firms 14,121 15,573 17,082 18,200 28 .9%
Employment 14,323 14,718 17,117 18,100 26 .4%
Sales ($000) $1,202,178 $1,546,639 $2,052,027 $2,361,700 96 .5%

27
state of Women-oWned businesses RepoRt
table 3: tRend in Women-oWned fiRms by state, 1997-2011 (cont’d)
Women-oWned fiRms
1997 2002 2007 2011 (est.) % change, 1997-2011
Tennessee
Number of Firms 99,772 117,935 142,451 149,200 49 .5%
Employment 142,080 116,955 126,083 123,600 -13 .0%
Sales ($000) $14,538,315 $17,640,826 $21,387,001 $22,463,600 54 .5%Texas
Number of Firms 381,453 468,705 610,007 636,000 66 .7%
Employment 548,756 553,843 592,308 597,300 8 .8%
Sales ($000) $65,065,262 $65,817,396 $97,094,681 $100,733,200 54 .8%Utah
Number of Firms 41,991 48,475 61,468 65,100 55 .0%
Employment 54,135 53,497 56,739 57,200 5 .7%
Sales ($000) $5,096,187 $5,920,242 $10,142,709 $11,087,400 117 .6%Vermont
Number of Firms 17,030 18,989 20,447 21,500 26 .2%
Employment 13,524 14,974 13,351 13,300 -1 .7%
Sales ($000) $1,313,146 $1,454,095 $1,724,022 $1,848,800 40 .8%Virginia
Number of Firms 132,219 157,030 192,081 206,900 56 .5%
Employment 172,227 183,468 199,248 205,900 19 .6%
Sales ($000) $17,486,395 $22,123,426 $30,272,850 $33,443,900 91 .3%Washington
Number of Firms 123,042 137,394 157,989 166,200 35 .1%
Employment 139,032 126,818 149,093 151,400 8 .9%
Sales ($000) $15,099,236 $17,368,371 $23,103,402 $24,976,400 65 .4%West Virginia
Number of Firms 30,231 31,301 33,787 35,600 17 .8%
Employment 33,724 31,539 36,095 37,300 10 .6%
Sales ($000) $3,298,735 $3,252,129 $4,777,819 $5,511,400 67 .1%
28
state of Women-oWned businesses RepoRt
table 3: tRend in Women-oWned fiRms by state, 1997-2011 (cont’d)
Women-oWned fiRms
1997 2002 2007 2011 (est.) % change, 1997-2011
Wisconsin
Number of Firms 89,284 104,170 112,418 117,600 31 .7%
Employment 146,450 149,777 152,833 154,300 5 .4%
Sales ($000) $15,653,949 $17,582,321 $20,942,535 $22,118,700 41 .3%Wyoming
Number of Firms 11,148 12,945 15,610 17,400 56 .1%
Employment 11,296 D 14,001 15,100 33 .7%
Sales ($000) $944,747 $1,129,837 $2,091,402 $2,551,000 170 .0%
d: data not disclosed by the us census bureau.

29
state of Women-oWned businesses RepoRt
table 4: tRend in Women- and equally-oWned fiRms by state, 1997-2011
Women- and equally-oWned fiRms
1997 2002 2007 2011 (est.)
Total US
Number of Firms 9,058,297 9,182,654 12,396,394 12,863,700
Employment 15,360,618 12,809,682 15,732,526 15,784,600
Sales ($000) $1,762,549,668 $1,672,222,030 $2,485,516,899 $2,586,732,300Alabama
Number of Firms 113,335 111,821 166,582 177,400
Employment 185,166 161,239 190,573 191,600
Sales ($000) $18,920,751 $18,363,804 $28,065,177 $29,912,400 Alaska
Number of Firms 31,337 26,735 33,942 34,500
Employment 36,474 33,414 40,130 41,000
Sales ($000) $5,695,745 $5,103,264 $6,840,084 $7,085,000 Arizona
Number of Firms 168,481 169,535 252,814 256,300
Employment 325,681 294,994 392,381 395,200
Sales ($000) $33,709,058 $34,045,169 $57,966,778 $58,975,900 Arkansas
Number of Firms 87,812 83,242 115,125 122,800
Employment 153,281 112,383 152,564 152,400
Sales ($000) $15,875,683 $13,882,054 $23,055,452 $25,060,000 California
Number of Firms 1,166,650 1,217,249 1,636,146 1,692,300
Employment 2,138,821 1,842,591 2,194,450 2,201,100
Sales ($000) $276,052,587 $266,528,851 $398,382,595 $413,013,200 Colorado
Number of Firms 193,304 198,369 261,767 276,400
Employment 276,482 248,961 285,908 287,900
Sales ($000) $30,838,123 $31,849,277 $45,032,536 $48,064,500

30
state of Women-oWned businesses RepoRt
table 4: tRend in Women- and equally-oWned fiRms by state, 1997-2011 (cont’d)
Women- and equally-oWned fiRms
1997 2002 2007 2011 (est.)
Connecticut
Number of Firms 107,355 108,816 129,605 134,100
Employment 159,935 143,146 162,676 163,200
Sales ($000) $18,219,477 $21,469,045 $26,043,205 $27,611,100 Delaware
Number of Firms 22,551 23,144 30,694 32,500
Employment 41,404 34,932 37,655 36,800
Sales ($000) $3,997,309 $4,111,969 $6,115,486 $6,574,700 District of Columbia
Number of Firms 17,892 18,301 23,848 25,900
Employment 29,061 D 34,937 36,900
Sales ($000) $3,078,217 $3,586,973 $5,538,784 $6,363,600 Florida
Number of Firms 556,331 618,601 911,784 918,100
Employment 813,734 724,526 941,602 943,800
Sales ($000) $99,927,531 $103,579,467 $154,781,217 $155,746,600 Georgia
Number of Firms 234,348 260,864 400,772 412,300
Employment 362,624 323,345 409,796 413,000
Sales ($000) $44,870,930 $47,975,954 $70,051,001 $71,783,400 Hawaii
Number of Firms 41,516 43,807 58,147 61,900
Employment 60,510 72,550 69,901 72,100
Sales ($000) $7,560,916 $8,210,512 $10,035,084 $10,589,300 Idaho
Number of Firms 58,298 54,467 84,814 86,700
Employment 93,900 77,199 118,763 120,600
Sales ($000) $9,939,644 $8,825,824 $16,228,782 $16,686,700
31
state of Women-oWned businesses RepoRt
table 4: tRend in Women- and equally-oWned fiRms by state, 1997-2011 (cont’d)
Women- and equally-oWned fiRms
1997 2002 2007 2011 (est.)
Illinois
Number of Firms 388,868 389,220 506,528 522,700
Employment 746,938 582,187 629,760 613,700
Sales ($000) $85,327,301 $76,226,803 $100,354,412 $102,416,200 Indiana
Number of Firms 189,959 176,402 222,448 226,600
Employment 322,950 253,653 306,284 304,200
Sales ($000) $33,420,372 $29,768,664 $43,190,897 $44,425,900 Iowa
Number of Firms 110,153 100,123 129,677 136,000
Employment 178,652 133,645 166,377 162,500
Sales ($000) $20,075,686 $15,508,475 $23,563,416 $24,267,900 Kansas
Number of Firms 106,849 95,043 122,798 126,400
Employment 157,218 134,876 168,852 171,500
Sales ($000) $17,849,130 $15,463,042 $23,850,893 $25,207,300 Kentucky
Number of Firms 116,997 116,529 152,721 162,300
Employment 201,189 151,796 188,740 185,400
Sales ($000) $21,092,305 $17,693,171 $28,124,260 $30,006,000 Louisiana
Number of Firms 126,340 131,078 174,925 184,200
Employment 262,694 201,269 246,689 243,700
Sales ($000) $25,104,128 $21,911,784 $42,246,535 $45,496,700 Maine
Number of Firms 54,091 50,937 66,786 70,000
Employment 62,864 59,447 76,321 79,700
Sales ($000) $6,618,500 $6,918,075 $10,298,772 $11,236,500

32
state of Women-oWned businesses RepoRt
table 4: tRend in Women- and equally-oWned fiRms by state, 1997-2011 (cont’d)
Women- and equally-oWned fiRms
1997 2002 2007 2011 (est.)
Maryland
Number of Firms 172,757 181,054 239,677 257,100
Employment 252,370 222,803 282,735 290,700
Sales ($000) $26,901,245 $26,981,488 $40,265,407 $43,761,500 Massachusetts
Number of Firms 203,198 206,066 242,040 251,800
Employment 305,761 280,610 299,292 297,600
Sales ($000) $32,901,807 $37,258,173 $45,416,936 $48,565,800 Michigan
Number of Firms 296,862 299,446 379,151 372,000
Employment 496,568 399,259 469,105 471,400
Sales ($000) $54,414,975 $48,855,069 $59,664,021 $59,210,500 Minnesota
Number of Firms 185,092 179,320 227,053 235,100
Employment 297,895 247,269 314,110 317,200
Sales ($000) $31,230,370 $30,318,800 $44,344,268 $46,883,100 Mississippi
Number of Firms 67,562 70,252 96,818 105,700
Employment 115,030 94,511 109,898 108,400
Sales ($000) $12,658,900 $11,511,066 $16,876,740 $18,153,900 Missouri
Number of Firms 196,985 188,406 245,993 259,300
Employment 375,552 292,076 346,728 338,800
Sales ($000) $40,612,876 $35,517,006 $51,418,686 $54,366,500 Montana
Number of Firms 46,234 42,967 57,281 59,200
Employment 63,580 54,405 69,785 70,800
Sales ($000) $6,094,525 $5,949,345 $9,488,497 $10,087,200

33
state of Women-oWned businesses RepoRt
table 4: tRend in Women- and equally-oWned fiRms by state, 1997-2011 (cont’d)
Women- and equally-oWned fiRms
1997 2002 2007 2011 (est.)
Nebraska
Number of Firms 69,980 63,929 81,407 84,800
Employment 119,812 94,378 118,782 118,500
Sales ($000) $13,290,825 $12,101,716 $16,227,096 $17,096,200 Nevada
Number of Firms 60,403 71,609 108,290 107,000
Employment 127,973 105,831 148,739 148,200
Sales ($000) $15,511,058 $15,515,292 $26,672,434 $26,377,700 New Hampshire
Number of Firms 45,302 44,910 56,761 59,300
Employment 73,290 73,435 76,409 77,100
Sales ($000) $7,299,026 $9,372,748 $11,800,921 $12,777,000 New Jersey
Number of Firms 244,033 250,491 305,646 317,900
Employment 437,512 369,584 410,169 404,700
Sales ($000) $57,026,560 $57,828,824 $72,012,046 $74,979,100 New Mexico
Number of Firms 68,390 62,715 84,432 87,200
Employment 118,190 90,267 136,900 140,200
Sales ($000) $10,974,528 $9,917,689 $19,077,801 $20,487,800 New York
Number of Firms 563,019 634,542 780,692 810,900
Employment 794,056 720,846 772,887 770,000
Sales ($000) $109,090,936 $110,148,945 $140,596,308 $144,969,300 North Carolina
Number of Firms 234,836 245,416 352,890 367,500
Employment 423,694 364,007 477,971 484,600
Sales ($000) $45,328,713 $43,203,599 $64,280,125 $66,614,900

34
state of Women-oWned businesses RepoRt
table 4: tRend in Women- and equally-oWned fiRms by state, 1997-2011 (cont’d)
Women- and equally-oWned fiRms
1997 2002 2007 2011 (est.)
North Dakota
Number of Firms 24,872 22,274 29,973 32,500
Employment 37,556 27,695 36,473 35,900
Sales ($000) $3,388,485 $3,028,170 $5,055,624 $5,875,200 Ohio
Number of Firms 318,458 311,074 384,180 395,100
Employment 565,588 436,399 521,221 513,800
Sales ($000) $58,565,367 $52,202,058 $73,087,954 $75,504,500 Oklahoma
Number of Firms 130,832 119,828 169,391 186,200
Employment 188,464 167,262 204,003 210,800
Sales ($000) $21,039,014 $17,965,380 $34,690,863 $40,653,900 Oregon
Number of Firms 148,579 137,050 182,427 185,000
Employment 247,238 185,980 249,774 250,000
Sales ($000) $27,590,635 $23,615,906 $36,177,281 $36,823,000 Pennsylvania
Number of Firms 319,096 304,785 399,003 421,500
Employment 561,164 466,112 551,144 548,300
Sales ($000) $64,678,856 $60,856,934 $83,897,272 $89,301,500 Rhode Island
Number of Firms 31,564 31,424 37,685 38,700
Employment 54,137 48,211 49,756 49,000
Sales ($000) $5,223,957 $6,192,013 $6,779,353 $7,024,500 South Carolina
Number of Firms 100,375 105,061 149,542 157,400
Employment 174,607 150,746 188,912 191,200
Sales ($000) $18,065,244 $17,257,746 $26,068,665 $27,352,400

35
state of Women-oWned businesses RepoRt
table 4: tRend in Women- and equally-oWned fiRms by state, 1997-2011 (cont’d)
Women- and equally-oWned fiRms
1997 2002 2007 2011 (est.)
South Dakota
Number of Firms 32,245 27,533 39,067 41,600
Employment 55,154 36,278 46,850 43,800
Sales ($000) $7,105,780 $3,987,553 $6,519,271 $6,305,500 Tennessee
Number of Firms 171,137 169,190 235,145 245,200
Employment 280,500 205,073 265,287 262,900
Sales ($000) $29,872,009 $28,645,352 $43,243,760 $45,345,800 Texas
Number of Firms 675,193 676,296 1,021,016 1,060,300
Employment 1,179,318 949,508 1,257,707 1,266,700
Sales ($000) $136,428,785 $119,363,215 $208,420,020 $216,598,200 Utah
Number of Firms 75,869 75,232 114,825 122,100
Employment 127,644 110,208 162,023 168,400
Sales ($000) $13,239,732 $12,478,745 $24,362,204 $26,444,300 Vermont
Number of Firms 30,984 28,832 36,344 38,000
Employment 48,706 38,623 40,194 37,600
Sales ($000) $4,318,647 $3,940,585 $5,130,259 $5,376,700 Virginia
Number of Firms 200,289 211,259 285,690 306,800
Employment 326,991 305,783 375,859 387,900
Sales ($000) $32,035,278 $35,026,174 $52,976,690 $58,170,200 Washington
Number of Firms 232,779 212,709 292,179 306,100
Employment 421,903 277,187 436,262 439,600
Sales ($000) $48,181,153 $38,399,834 $70,677,377 $75,941,500

36
state of Women-oWned businesses RepoRt
table 4: tRend in Women- and equally-oWned fiRms by state, 1997-2011 (cont’d)
Women- and equally-oWned fiRms
1997 2002 2007 2011 (est.)
West Virginia
Number of Firms 47,631 43,819 53,267 56,100
Employment 69,538 57,175 69,648 69,700
Sales ($000) $7,104,101 $6,036,697 $9,911,381 $11,303,700 Wisconsin
Number of Firms 165,572 158,194 205,464 214,400
Employment 374,116 290,132 384,448 386,800
Sales ($000) $40,243,559 $33,425,486 $51,454,804 $53,948,200 Wyoming
Number of Firms 25,457 22,478 32,061 34,700
Employment 37,133 D 45,103 48,300
Sales ($000) $4,049,325 $3,293,117 $9,537,471 $11,737,100
d: data not disclosed by the us census bureau.
note: percent growth figures are not provided for women- and equally-owned firms due to the definitional changes in the population of equally-owned firms over time. (see the explanation on page 7 for more information.) thus, these figures should only be looked at within each time period, and not over time.
37
state of Women-oWned businesses RepoRt
table 5: tRend in Women-oWned fiRms by industRy, 2002-11
Women-oWned fiRms % change, 2002-2011
% share of Wobs,
2011
% share of all firms,
2011
2002 2007 2011 (est.)
Total US
Number of Firms 6,489,483 7,793,139 8,125,800 25 .2% 100% 29 .0%
Employment 7,146,229 7,579,876 7,650,400 7 .1% 100% 6 .3%
Sales ($000) $940,774,986 $1,202,115,758 $1,255,798,300 33 .5% 100% 3 .9%Agriculture, Forestry,
Fishing, Hunting (11)
Number of Firms 24,458 26,783 27,300 11 .6% 0 .3% 10 .5%
Employment 24,296 9,740 6,400 -73 .7% 0 .1% 4 .2%
Sales ($000) $2,050,461 $2,037,592 $2,034,600 -0 .8% 0 .2% 5 .3%Mining (21)
Number of Firms 13,231 18,317 19,500 47 .4% 0 .2% 15 .3%
Employment 15,910 23,378 25,100 57 .8% 0 .3% 3 .3%
Sales ($000) $3,127,501 $11,590,597 $13,554,000 333 .4% 1 .1% 3 .0%Utilities (22)
Number of Firms 2,066 3,763 4,200 103 .3% 0 .1% 16 .6%
Employment 1,918 1,795 1,800 -6 .2% 0 .0% 0 .3%
Sales ($000) $744,575 $1,927,789 $2,202,300 195 .8% 0 .2% 0 .3%Construction (23)
Number of Firms 201,791 268,793 284,300 40 .9% 3 .5% 8 .0%
Employment 455,799 495,569 504,800 10 .8% 6 .6% 6 .7%
Sales ($000) $68,424,738 $97,453,812 $104,188,600 52 .3% 8 .4% 5 .2%Manufacturing (31-33)
Number of Firms 110,348 113,481 114,200 3 .5% 1 .4% 18 .4%
Employment 637,130 572,170 557,100 -12 .6% 7 .3% 4 .1%
Sales ($000) $93,312,296 $113,394,679 $118,053,800 26 .5% 9 .5% 2 .1%Wholesale Trade (42) Number of Firms 121,421 133,380 136,200 12 .2% 1 .7% 18 .4%Employment 378,857 382,096 382,800 1 .0% 5 .0% 6 .0%Sales ($000) $210,802,077 $246,515,385 $254,800,900 20 .9% 20 .5% 3 .7%

38
state of Women-oWned businesses RepoRt
table 5: tRend in Women-oWned fiRms by industRy, 2002-11 (cont’d)
Women-oWned fiRms % change, 2002-2011
% share of Wobs,
2011
% share of all firms,
2011
2002 2007 2011 (est.)
Retail Trade (44-45)
Number of Firms 944,682 918,804 912,800 -3 .4% 11 .2% 33 .9%
Employment 851,401 837,834 834,700 -2 .0% 10 .9% 5 .3%
Sales ($000) $149,230,643 $190,411,132 $199,965,000 34 .0% 16 .1% 4 .7%Transportation &
Warehousing (48-49)
Number of Firms 111,466 142,595 149,800 34 .4% 1 .8% 11 .4%
Employment 187,373 217,060 223,900 19 .5% 2 .9% 5 .4%
Sales ($000) $22,446,422 $32,951,928 $35,389,200 57 .7% 2 .8% 5 .6%Information (51)
Number of Firms 80,270 97,211 101,100 25 .9% 1 .2% 25 .4%
Employment 140,958 121,774 117,300 -16 .8% 1 .5% 3 .4%
Sales ($000) $22,077,377 $26,203,062 $27,160,200 23 .0% 2 .2% 2 .4%Finance & Insurance (52)
Number of Firms 167,062 200,474 208,200 24 .6% 2 .6% 19 .9%
Employment 142,046 161,987 166,600 17 .3% 2 .2% 2 .4%
Sales ($000) $26,878,452 $32,226,805 $33,467,600 24 .5% 2 .7% 0 .8%Real Estate, Rental,
Leasing (53)
Number of Firms 504,014 657,854 693,500 37 .6% 8 .5% 25 .4%
Employment 169,707 184,409 187,800 10 .7% 2 .5% 7 .8%
Sales ($000) $48,289,200 $58,707,594 $61,124,700 26 .6% 4 .9% 8 .8%Prof/Sci/Tech Svcs. (54)
Number of Firms 934,851 1,096,614 1,134,100 21 .3% 14 .0% 29 .0%
Employment 573,171 642,055 658,000 14 .8% 8 .6% 7 .9%
Sales ($000) $79,246,625 $107,691,967 $114,291,300 44 .2% 9 .2% 6 .9%Mgmnt of Companies
(55)
Number of Firms 2,100 1,791 1,700 -19 .0% 0 .0% 6 .4%Employment 61,135 51,773 49,600 -18 .9% 0 .6% 1 .7%Sales ($000) $1,706,800 $2,866,681 $3,135,800 83 .7% 0 .3% 2 .7%

39
state of Women-oWned businesses RepoRt
table 5: tRend in Women-oWned fiRms by industRy, 2002-11 (cont’d)
Women-oWned fiRms % change, 2002-2011
% share of Wobs,
2011
% share of all firms,
2011
2002 2007 2011 (est.)
Admin, Support, Waste
Svcs. (56)
Number of Firms 569,300 785,931 836,200 46 .9% 10 .3% 37 .1%
Employment 1,004,905 1,155,277 1,190,200 18 .4% 15 .6% 10 .7%
Sales ($000) $48,213,903 $66,122,536 $70,277,300 45 .8% 5 .7% 9 .5%Educational Svcs. (61)
Number of Firms 192,429 276,164 295,600 53 .6% 3 .6% 45 .7%
Employment 118,121 129,752 132,500 12 .2% 1 .7% 4 .1%
Sales ($000) $7,388,159 $9,848,089 $10,418,800 41 .0% 0 .8% 4 .6%Health Care & Social
Assistance (62)
Number of Firms 1,035,834 1,232,001 1,277,500 23 .3% 15 .7% 52 .1%
Employment 961,302 1,140,269 1,181,800 22 .9% 15 .5% 7 .2%
Sales ($000) $68,457,902 $93,339,444 $99,112,000 44 .8% 8 .0% 5 .9%Arts, Entertainment &
Recreation (71)
Number of Firms 289,205 376,221 396,400 37 .1% 4 .9% 30 .5%
Employment 120,676 115,026 113,700 -5 .8% 1 .5% 5 .5%
Sales ($000) $12,697,121 $16,502,276 $17,385,100 36 .9% 1 .4% 8 .3%Accommodation & Food
Svcs. (72)
Number of Firms 166,701 191,894 197,700 18 .6% 2 .4% 24 .7%
Employment 909,049 965,794 979,000 7 .7% 12 .8% 8 .2%
Sales ($000) $38,687,859 $47,326,828 $49,331,100 27 .5% 4 .0% 7 .5%Other Services (81)
Number of Firms 1,015,724 1,251,744 1,306,500 28 .6% 16 .1% 40 .5%
Employment 386,174 368,090 363,900 -5 .8% 4 .8% 13 .7%
Sales ($000) $36,215,139 $44,818,781 $46,814,800 29 .3% 3 .8% 15 .0%Industries Not Classified
(99)
Number of Firms 6,137 2,774 2,000 -67 .4% 0 .0% 31 .7%Employment 6,302 4,026 3,500 -44 .5% 0 .0% 9 .2%Sales ($000) $777,736 $178,780 $39,800 -94 .9% 0 .0% 7 .4%
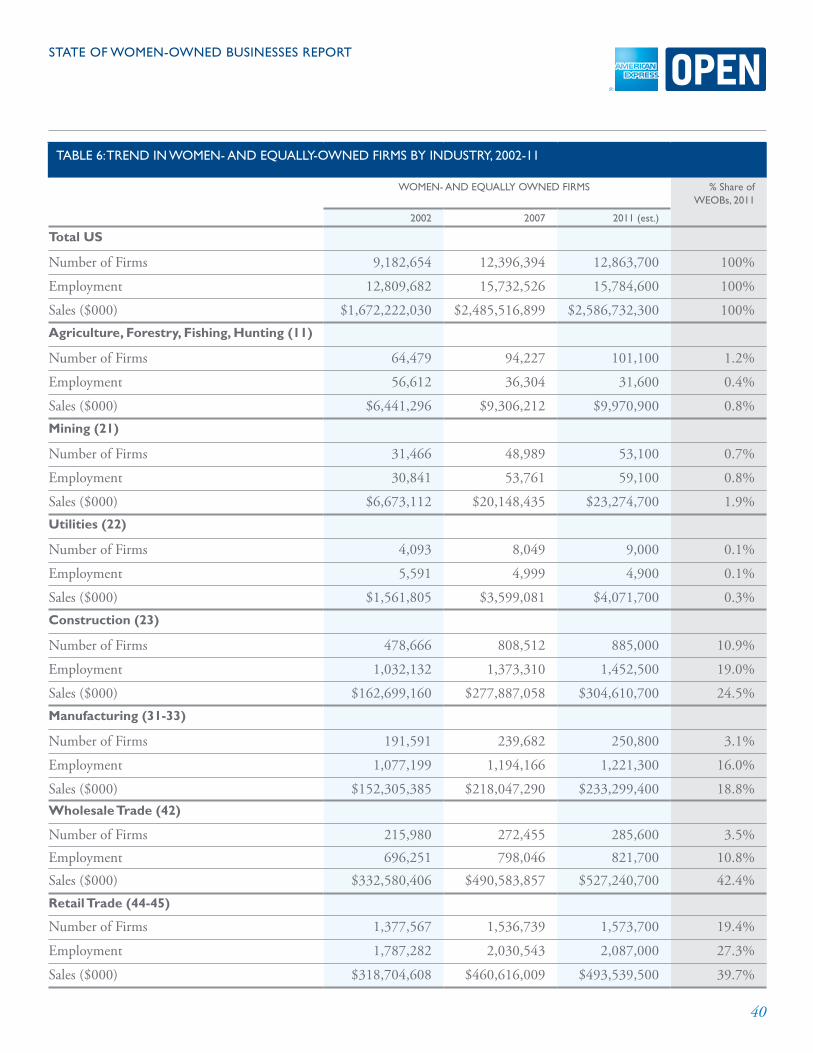
40
state of Women-oWned businesses RepoRt
table 6: tRend in Women- and equally-oWned fiRms by industRy, 2002-11
Women- and equally oWned fiRms % share of Weobs, 2011
2002 2007 2011 (est.)
Total US
Number of Firms 9,182,654 12,396,394 12,863,700 100%
Employment 12,809,682 15,732,526 15,784,600 100%
Sales ($000) $1,672,222,030 $2,485,516,899 $2,586,732,300 100%Agriculture, Forestry, Fishing, Hunting (11)
Number of Firms 64,479 94,227 101,100 1 .2%
Employment 56,612 36,304 31,600 0 .4%
Sales ($000) $6,441,296 $9,306,212 $9,970,900 0 .8%Mining (21)
Number of Firms 31,466 48,989 53,100 0 .7%
Employment 30,841 53,761 59,100 0 .8%
Sales ($000) $6,673,112 $20,148,435 $23,274,700 1 .9%Utilities (22)
Number of Firms 4,093 8,049 9,000 0 .1%
Employment 5,591 4,999 4,900 0 .1%
Sales ($000) $1,561,805 $3,599,081 $4,071,700 0 .3%Construction (23)
Number of Firms 478,666 808,512 885,000 10 .9%
Employment 1,032,132 1,373,310 1,452,500 19 .0%
Sales ($000) $162,699,160 $277,887,058 $304,610,700 24 .5%Manufacturing (31-33)
Number of Firms 191,591 239,682 250,800 3 .1%
Employment 1,077,199 1,194,166 1,221,300 16 .0%
Sales ($000) $152,305,385 $218,047,290 $233,299,400 18 .8%Wholesale Trade (42) Number of Firms 215,980 272,455 285,600 3 .5%Employment 696,251 798,046 821,700 10 .8%Sales ($000) $332,580,406 $490,583,857 $527,240,700 42 .4%Retail Trade (44-45) Number of Firms 1,377,567 1,536,739 1,573,700 19 .4%
Employment 1,787,282 2,030,543 2,087,000 27 .3%
Sales ($000) $318,704,608 $460,616,009 $493,539,500 39 .7%
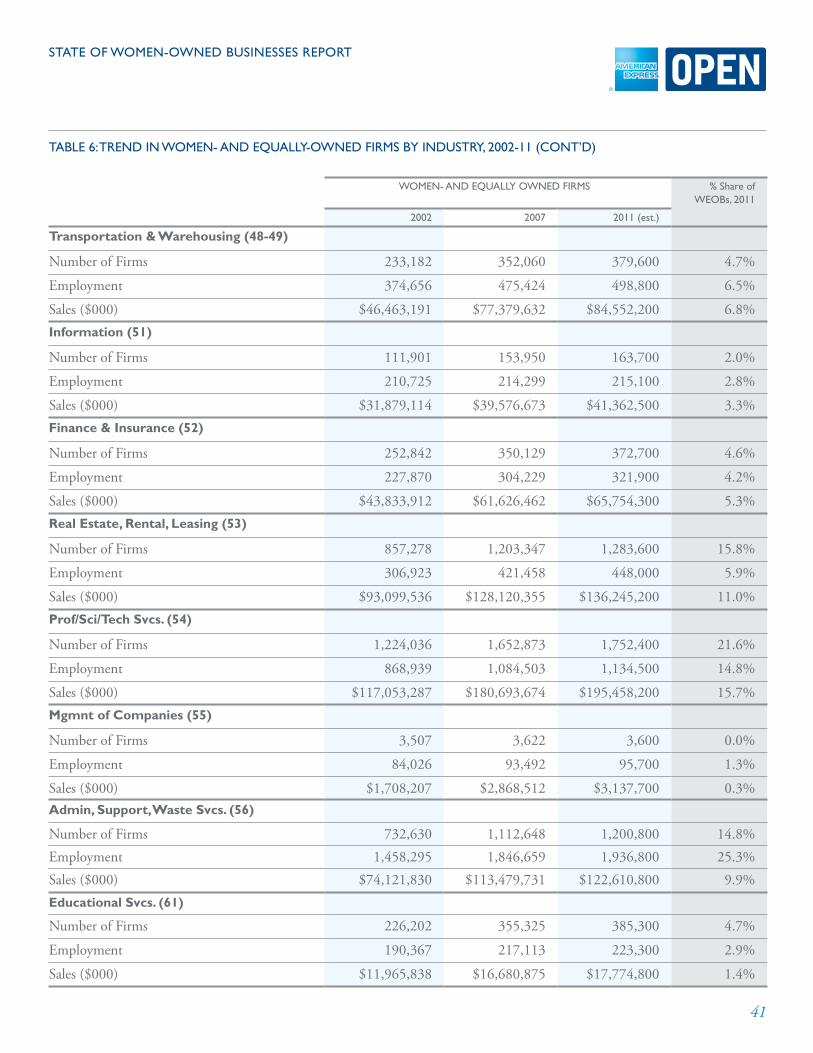
41
state of Women-oWned businesses RepoRt
table 6: tRend in Women- and equally-oWned fiRms by industRy, 2002-11 (cont’d)
Women- and equally oWned fiRms % share of Weobs, 2011
2002 2007 2011 (est.)
Transportation & Warehousing (48-49)
Number of Firms 233,182 352,060 379,600 4 .7%
Employment 374,656 475,424 498,800 6 .5%
Sales ($000) $46,463,191 $77,379,632 $84,552,200 6 .8%Information (51)
Number of Firms 111,901 153,950 163,700 2 .0%
Employment 210,725 214,299 215,100 2 .8%
Sales ($000) $31,879,114 $39,576,673 $41,362,500 3 .3%Finance & Insurance (52)
Number of Firms 252,842 350,129 372,700 4 .6%
Employment 227,870 304,229 321,900 4 .2%
Sales ($000) $43,833,912 $61,626,462 $65,754,300 5 .3%Real Estate, Rental, Leasing (53)
Number of Firms 857,278 1,203,347 1,283,600 15 .8%
Employment 306,923 421,458 448,000 5 .9%
Sales ($000) $93,099,536 $128,120,355 $136,245,200 11 .0%Prof/Sci/Tech Svcs. (54)
Number of Firms 1,224,036 1,652,873 1,752,400 21 .6%
Employment 868,939 1,084,503 1,134,500 14 .8%
Sales ($000) $117,053,287 $180,693,674 $195,458,200 15 .7%Mgmnt of Companies (55)
Number of Firms 3,507 3,622 3,600 0 .0%
Employment 84,026 93,492 95,700 1 .3%
Sales ($000) $1,708,207 $2,868,512 $3,137,700 0 .3%Admin, Support, Waste Svcs. (56) Number of Firms 732,630 1,112,648 1,200,800 14 .8%Employment 1,458,295 1,846,659 1,936,800 25 .3%Sales ($000) $74,121,830 $113,479,731 $122,610,800 9 .9%Educational Svcs. (61) Number of Firms 226,202 355,325 385,300 4 .7%
Employment 190,367 217,113 223,300 2 .9%
Sales ($000) $11,965,838 $16,680,875 $17,774,800 1 .4%

42
state of Women-oWned businesses RepoRt
table 6: tRend in Women- and equally-oWned fiRms by industRy, 2002-11 (cont’d)
Women- and equally oWned fiRms % share of Weobs, 2011
2002 2007 2011 (est.)
Health Care & Social Assistance (62)
Number of Firms 1,177,228 1,503,177 1,578,800 19 .4%
Employment 1,407,808 1,921,484 2,040,700 26 .7%
Sales ($000) $94,718,294 $154,485,574 $168,351,600 13 .6%Arts, Entertainment & Recreation (71)
Number of Firms 385,835 554,913 594,100 7 .3%
Employment 223,895 266,319 276,200 3 .6%
Sales ($000) $21,285,638 $31,033,994 $33,295,600 2 .7%Accommodation & Food Svcs. (72)
Number of Firms 304,934 387,294 406,400 5 .0%
Employment 2,041,432 2,565,581 2,687,200 35 .2%
Sales ($000) $85,926,490 $123,541,924 $132,268,700 10 .6%Other Services (81)
Number of Firms 1,307,012 1,760,521 1,865,700 23 .0%
Employment 717,559 823,440 848,000 11 .1%
Sales ($000) $65,044,248 $93,987,350 $100,702,100 8 .1%Industries Not Classified (99)
Number of Firms 8,866 4,780 3,800 0 .0%
Employment 11,278 7,395 6,500 0 .1%
Sales ($000) $1,167,561 $422,651 $249,800 0 .0%
note: percent growth figures are not provided for women- and equally-owned firms due to definitional changes in the population of equally-owned firms over time. (see page 7 for a detailed explanation.) thus, these figures should only be looked at within each time period, and not over time.
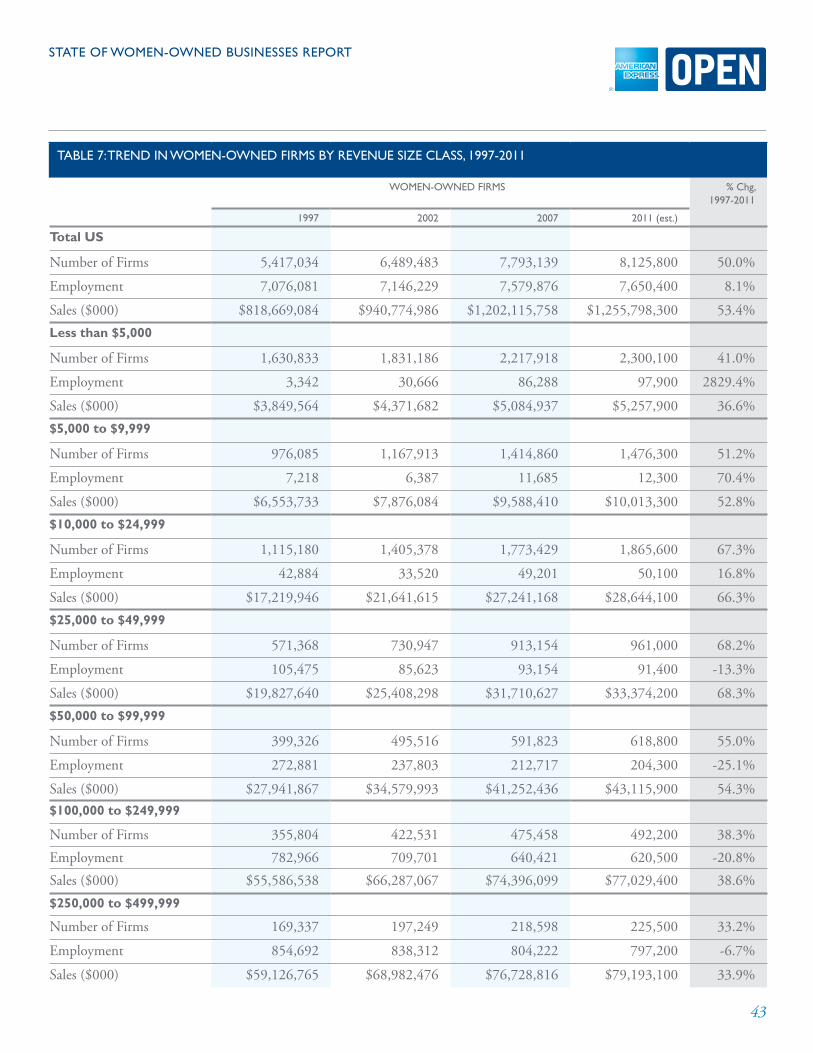
43
state of Women-oWned businesses RepoRt
table 7: tRend in Women-oWned fiRms by Revenue size class, 1997-2011
Women-oWned fiRms % chg, 1997-2011
1997 2002 2007 2011 (est.)
Total US
Number of Firms 5,417,034 6,489,483 7,793,139 8,125,800 50 .0%
Employment 7,076,081 7,146,229 7,579,876 7,650,400 8 .1%
Sales ($000) $818,669,084 $940,774,986 $1,202,115,758 $1,255,798,300 53 .4%Less than $5,000
Number of Firms 1,630,833 1,831,186 2,217,918 2,300,100 41 .0%
Employment 3,342 30,666 86,288 97,900 2829 .4%
Sales ($000) $3,849,564 $4,371,682 $5,084,937 $5,257,900 36 .6%$5,000 to $9,999
Number of Firms 976,085 1,167,913 1,414,860 1,476,300 51 .2%
Employment 7,218 6,387 11,685 12,300 70 .4%
Sales ($000) $6,553,733 $7,876,084 $9,588,410 $10,013,300 52 .8%$10,000 to $24,999
Number of Firms 1,115,180 1,405,378 1,773,429 1,865,600 67 .3%
Employment 42,884 33,520 49,201 50,100 16 .8%
Sales ($000) $17,219,946 $21,641,615 $27,241,168 $28,644,100 66 .3%$25,000 to $49,999
Number of Firms 571,368 730,947 913,154 961,000 68 .2%
Employment 105,475 85,623 93,154 91,400 -13 .3%
Sales ($000) $19,827,640 $25,408,298 $31,710,627 $33,374,200 68 .3%$50,000 to $99,999
Number of Firms 399,326 495,516 591,823 618,800 55 .0%
Employment 272,881 237,803 212,717 204,300 -25 .1%
Sales ($000) $27,941,867 $34,579,993 $41,252,436 $43,115,900 54 .3%$100,000 to $249,999 Number of Firms 355,804 422,531 475,458 492,200 38 .3%Employment 782,966 709,701 640,421 620,500 -20 .8%Sales ($000) $55,586,538 $66,287,067 $74,396,099 $77,029,400 38 .6%$250,000 to $499,999 Number of Firms 169,337 197,249 218,598 225,500 33 .2%
Employment 854,692 838,312 804,222 797,200 -6 .7%
Sales ($000) $59,126,765 $68,982,476 $76,728,816 $79,193,100 33 .9%

44
state of Women-oWned businesses RepoRt
table 7: tRend in Women-oWned fiRms by Revenue size class, 1997-2011
Women-oWned fiRms % chg, 1997-2011
1997 2002 2007 2011 (est.)
$500,000 to $999,999
Number of Firms 100,230 121,553 135,989 141,000 40 .7%
Employment 893,969 986,237 923,323 927,400 3 .7%
Sales ($000) $69,398,077 $84,728,761 $95,050,961 $98,642,400 42 .1%$1,000,000 or more
Number of Firms 98,870 116,985 141,908 147,900 49 .6%
Employment 4,112,652 4,213,120 4,758,865 4,849,300 17 .9%
Sales ($000) $559,164,953 $625,662,232 $841,062,304 $880,527,900 57 .5%

45
state of Women-oWned businesses RepoRt
table 8: tRend in Women- and equally oWned fiRms by Revenue size class, 1997-2011
Women-oWned fiRms
1997 2002 2007 2011 (est.)
Total US
Number of Firms 9,058,297 9,182,654 12,396,394 12,863,700
Employment 15,360,618 12,809,682 15,732,526 15,784,600
Sales ($000) $1,762,549,668 $1,672,222,030 $2,485,516,899 $2,586,732,300Less than $5,000
Number of Firms 2,375,675 2,327,260 3,090,252 3,190,293
Employment 6,174 D 202,175 229,615
Sales ($000) $5,573,951 D $7,155,232 $7,376,611$5,000 to $9,999
Number of Firms 1,408,110 1,486,190 1,997,567 2,080,091
Employment 12,679 D 21,653 22,909
Sales ($000) $9,445,712 D $13,513,119 $14,082,556$10,000 to $24,999
Number of Firms 1,691,962 1,845,597 2,587,668 2,713,067
Employment 71,096 52,262 85,191 87,164
Sales ($000) $26,366,721 $28,583,937 $40,104,471 $42,027,756$25,000 to $49,999
Number of Firms 984,521 1,053,366 1,476,075 1,544,893
Employment 183,699 130,586 167,340 165,050
Sales ($000) $34,508,860 $36,800,281 $51,556,906 $53,943,632$50,000 to $99,999
Number of Firms 809,367 807,264 1,098,032 1,138,445
Employment 502,384 370,332 397,288 382,575
Sales ($000) $57,236,221 $56,855,157 $77,257,734 $80,060,746$100,000 to $249,999 Number of Firms 828,309 772,767 1,028,187 1,056,170 Employment 1,658,372 1,210,665 1,285,401 1,233,185 Sales ($000) $130,803,682 $121,975,664 $162,151,413 $166,540,095$250,000 to $499,999 Number of Firms 434,183 393,093 517,453 529,111
Employment 2,071,948 1,579,592 1,783,527 1,743,148
Sales ($000) $152,411,478 $138,382,271 $182,319,923 $186,507,105

46
state of Women-oWned businesses RepoRt
d= data not disclosed by census bureau.
note: percent growth figures are not provided for women- and equally-owned firms due to the definitional changes in the population of equally-owned firms over time. (see the explanation on page 7 for more information.) thus, these figures should only be looked at within each time period, and not over time.
table 8: tRend in Women- and equally oWned fiRms by Revenue size class, 1997-2011
Women-oWned fiRms
1997 2002 2007 2011 (est.)
$500,000 to $999,999
Number of Firms 271,172 254,865 342,689 352,701
Employment 2,357,920 1,944,933 2,215,490 2,195,550
Sales ($000) $188,518,584 $177,971,943 $239,893,790 $247,086,319$1,000,000 or more Number of Firms 254,996 242,217 348,470 361,556
Employment 8,496,344 7,467,472 9,574,463 9,725,400
Sales ($000) $1,157,684,458 D $1,711,564,310 $1,789,107,489

47
state of Women-oWned businesses RepoRt
table 9: tRend in Women-oWned fiRms by employment size class, 1997-2011
Women-oWned fiRms % chg, 1997-2011
1997 2002 2007 2011 (est.)
Total US
Number of Firms 5,417,034 6,489,483 7,793,139 8,125,800 50 .0%
Employment 7,076,081 7,146,229 7,579,876 7,650,400 8 .1%
Sales ($000) $818,669,084 $940,774,986 $1,202,115,758 $1,255,798,300 53 .4%No employees
Number of Firms 4,685,535 5,734,025 6,992,932 7,316,000 56 .1%
Employment - - - - 0 .0%
Sales ($000) $115,443,527 $160,244,074 $202,483,064 $214,668,600 86 .0%1 to 4 employees
Number of Firms 444,121 461,896 499,625 507,400 14 .2%
Employment 923,514 939,479 978,484 986,200 6 .8%
Sales ($000) $103,567,582 $113,455,460 $136,863,702 $141,525,200 36 .7%5 to 9 employees
Number of Firms 150,300 149,063 151,544 151,700 0 .9%
Employment 974,625 970,986 988,001 989,900 1 .6%
Sales ($000) $84,335,319 $96,553,311 $116,479,023 $120,979,100 43 .5%10 to 19 employees
Number of Firms 79,327 82,942 85,462 86,300 8 .8%
Employment 1,046,787 1,105,339 1,138,798 1,151,700 10 .0%
Sales ($000) $91,167,777 $103,155,850 $128,994,789 $134,290,600 47 .3%20 to 49 employees
Number of Firms 39,987 43,244 44,694 45,400 13 .5%
Employment 1,167,829 1,269,752 1,322,941 1,344,700 15 .1%
Sales ($000) $104,393,025 $118,005,642 $153,029,727 $159,838,900 53 .1%50 to 99 employees Number of Firms 10,325 11,072 11,413 11,600 12 .3%Employment 693,586 750,562 770,967 781,800 12 .7%Sales ($000) $71,473,096 $74,405,956 $94,226,425 $97,411,900 36 .3%100 to 499 employees Number of Firms 6,566 6,578 6,918 7,000 6 .6%
Employment 1,213,289 1,195,043 1,290,103 1,300,900 7 .2%
Sales ($000) $113,055,559 $114,737,129 $161,038,049 $167,755,600 48 .4%

48
state of Women-oWned businesses RepoRt
table 9: tRend in Women-oWned fiRms by employment size class, 1997-2011
Women-oWned fiRms % chg, 1997-2011
1997 2002 2007 2011 (est.)
500 or more employees
Number of Firms 873 662 722 700 -19 .8%
Employment 1,056,451 915,068 1,090,584 1,095,400 3 .7%
Sales ($000) $135,233,199 $160,217,565 $209,051,547 $219,386,100 62 .2%
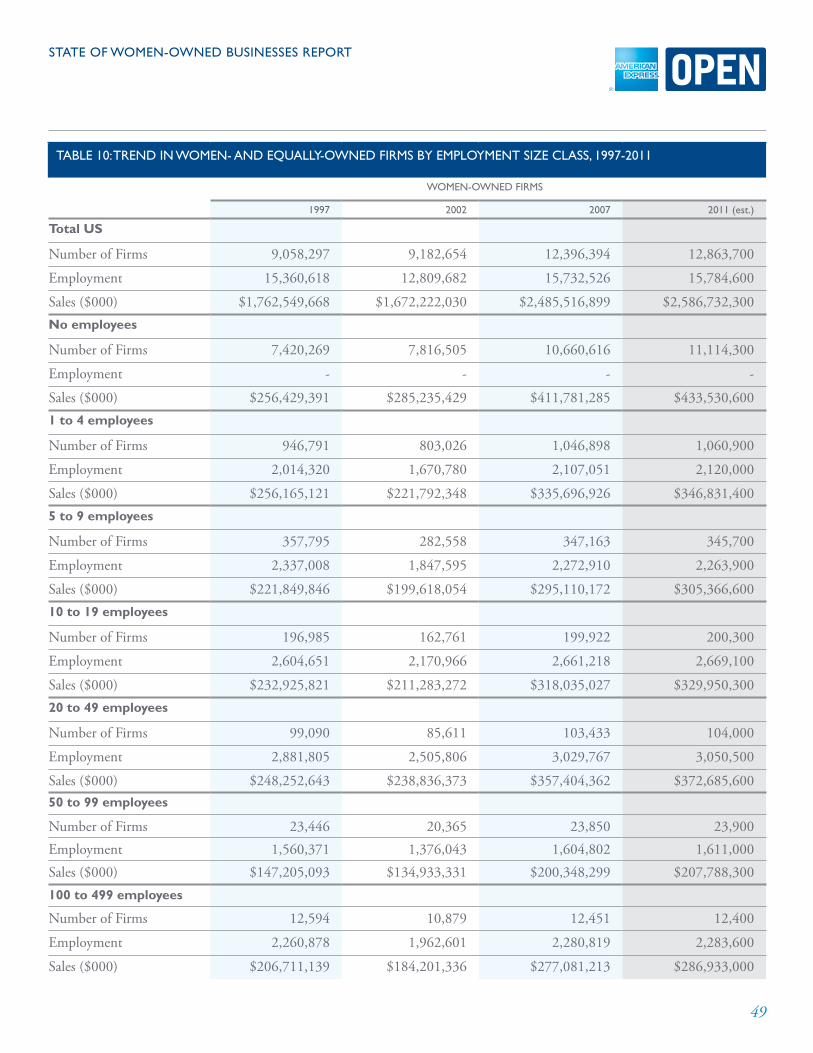
49
state of Women-oWned businesses RepoRt
table 10: tRend in Women- and equally-oWned fiRms by employment size class, 1997-2011
Women-oWned fiRms
1997 2002 2007 2011 (est.)
Total US
Number of Firms 9,058,297 9,182,654 12,396,394 12,863,700
Employment 15,360,618 12,809,682 15,732,526 15,784,600
Sales ($000) $1,762,549,668 $1,672,222,030 $2,485,516,899 $2,586,732,300No employees
Number of Firms 7,420,269 7,816,505 10,660,616 11,114,300
Employment - - - -
Sales ($000) $256,429,391 $285,235,429 $411,781,285 $433,530,6001 to 4 employees
Number of Firms 946,791 803,026 1,046,898 1,060,900
Employment 2,014,320 1,670,780 2,107,051 2,120,000
Sales ($000) $256,165,121 $221,792,348 $335,696,926 $346,831,4005 to 9 employees
Number of Firms 357,795 282,558 347,163 345,700
Employment 2,337,008 1,847,595 2,272,910 2,263,900
Sales ($000) $221,849,846 $199,618,054 $295,110,172 $305,366,60010 to 19 employees
Number of Firms 196,985 162,761 199,922 200,300
Employment 2,604,651 2,170,966 2,661,218 2,669,100
Sales ($000) $232,925,821 $211,283,272 $318,035,027 $329,950,30020 to 49 employees
Number of Firms 99,090 85,611 103,433 104,000
Employment 2,881,805 2,505,806 3,029,767 3,050,500
Sales ($000) $248,252,643 $238,836,373 $357,404,362 $372,685,60050 to 99 employees Number of Firms 23,446 20,365 23,850 23,900 Employment 1,560,371 1,376,043 1,604,802 1,611,000 Sales ($000) $147,205,093 $134,933,331 $200,348,299 $207,788,300100 to 499 employees Number of Firms 12,594 10,879 12,451 12,400
Employment 2,260,878 1,962,601 2,280,819 2,283,600
Sales ($000) $206,711,139 $184,201,336 $277,081,213 $286,933,000

50
state of Women-oWned businesses RepoRt
table 10: tRend in Women- and equally-oWned fiRms by employment size class, 1997-2011
Women-oWned fiRms
1997 2002 2007 2011 (est.)
500 or more employees
Number of Firms 1,328 939 1,211 1,200
Employment 1,681,586 1,275,890 1,775,962 1,789,200
Sales ($000) $193,010,613 $196,321,887 $290,083,437 $303,673,600
note: percent growth figures are not provided for women- and equally-owned firms due to the definitional changes in the population of equally-owned firms over time. (see the explanation on page 7 for more information.) thus, these figures should only be looked at within each time period, and not over time.

This report published March 2011 by American Express OPEN, with research provided by Womenable—which takes full responsibility for the integrity of the findings and the conclusions drawn . Our sincere thanks are extended to the Economic Census Branch of the Company Statistics Division of the U .S . Census Bureau, which provided invaluable insights during the preparation of this analysis .
For OPEN press inquiries: Rosa m. alfonso Director of Public Affairs American Express OPEN 212-640-1712 [email protected]
For Customer Service, please call the number on the back of your Card.
visit openforum.com/women