the animal movement program: integrating gis with spatial analysis of animal movements u.s....
TRANSCRIPT

The Animal Movement Program:Integrating GIS with Spatial
Analysis Of Animal Movements
U.S. Department of Interior
U.S. Geological Survey
Alaska Biological Science Center
Glacier Bay Field Station

The Animal Movement Program
The need for a program integrating GIS and animal movement analysis
What Animal Movement can do How do I make it run on my computer? The next version

Other movement programs Homer CalHome MacPaal Antelope Wildtrak Telem Ranges V Many single-function programs
What was missing?
Integration with GIS (none) A full suite of analysis functions (Ranges?) Ability to handle a wide variety of data (none) Extensibility (none) Ability to run on all major operating systems
and processors (none)

Animal Movement is an ArcView Extension
ArcInfo/ArcView is the most widely used GIS program
ArcView is available for all major operating systems and processors
ArcView has a versatile built-in object oriented programming language
Extensions to ArcView can be loaded and unloaded easily

Animal Movement
Will utilize any type of point data that can be brought into ArcView
Works in any projection* Works on any selected subset of data* Produces Coverages, Grids, or Tables
i.e. all output is compatible with ArcView
*Except Gin= Gout2 G = Garbage

Changes to the ArcView View Doc
Buttons
ToolsMenu

Most of The Sample Data
Pacific Halibut
Dungeness Crab

MCP Home Range
Minimum Convex Polygon

Kernel Home Range Analysis

Kernel Home Range Analysis

Harmonic Mean
Harmonic Mean Point ThemeShaded by Z values
Harmonic Mean Raster Theme

Jennrich-Turner Home Range
95% ellipse
Major axis
Minor axis

Bootstrapping Home Range Sample Size
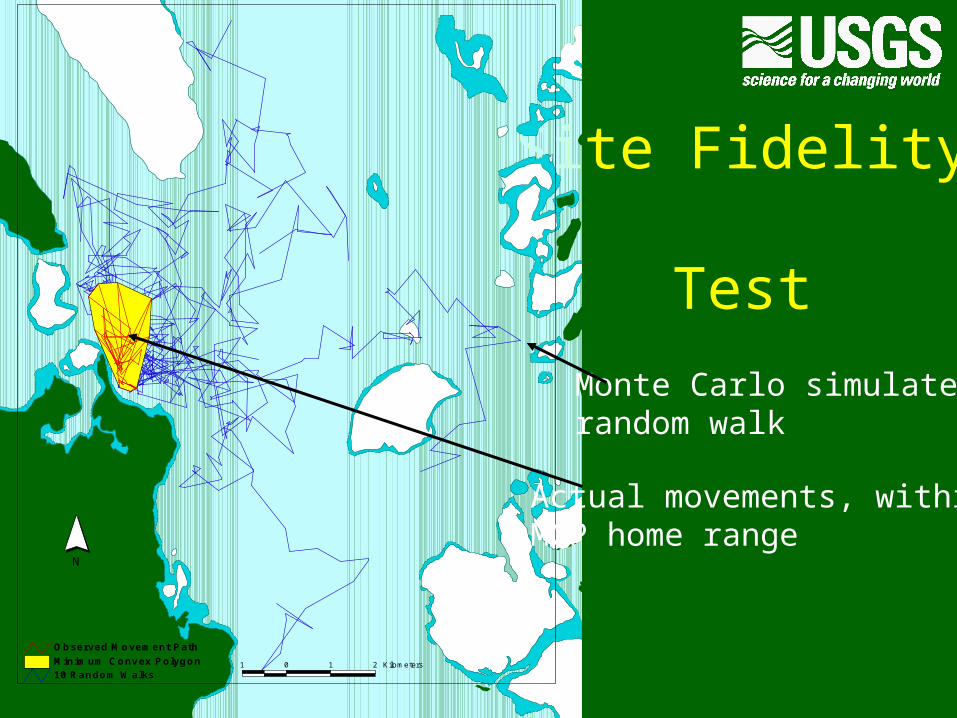
Site Fidelity Test
N
10 Random WalksMinimum Convex PolygonObserved Movement Path
1 0 1 2 Kilometers
Monte Carlo simulatedrandom walk
Actual movements, within MCP home range

Site Fidelity with and without boundaries

Circular Statistics
Movement path
Vector histogramwith mean vectorin red

Text output from theCircular Statistics Function
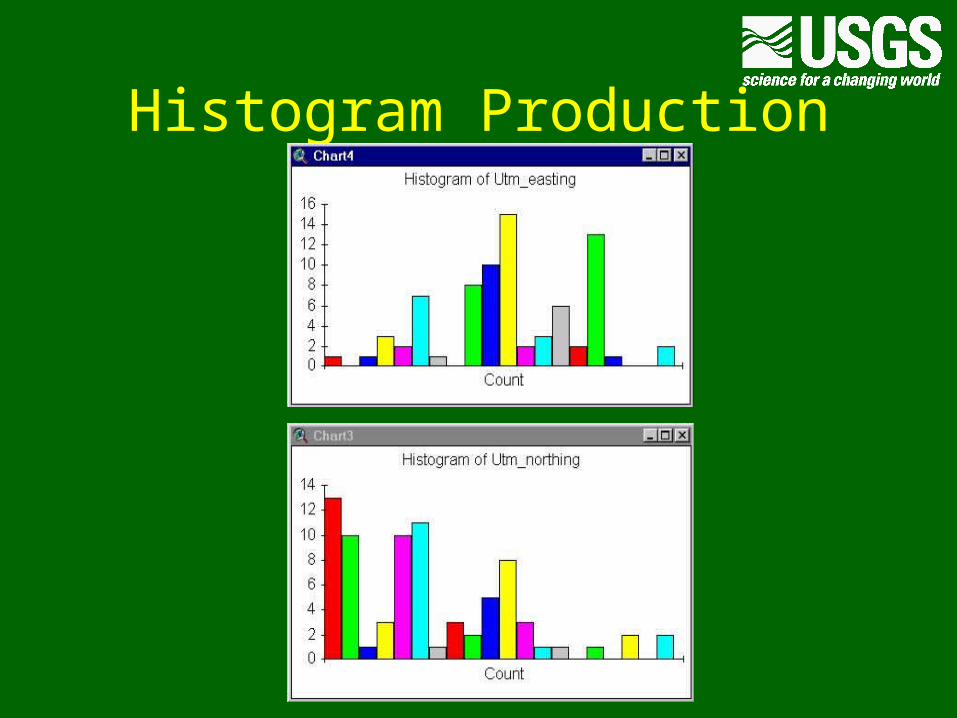
Histogram Production

Outlier removal and Probability MCPs
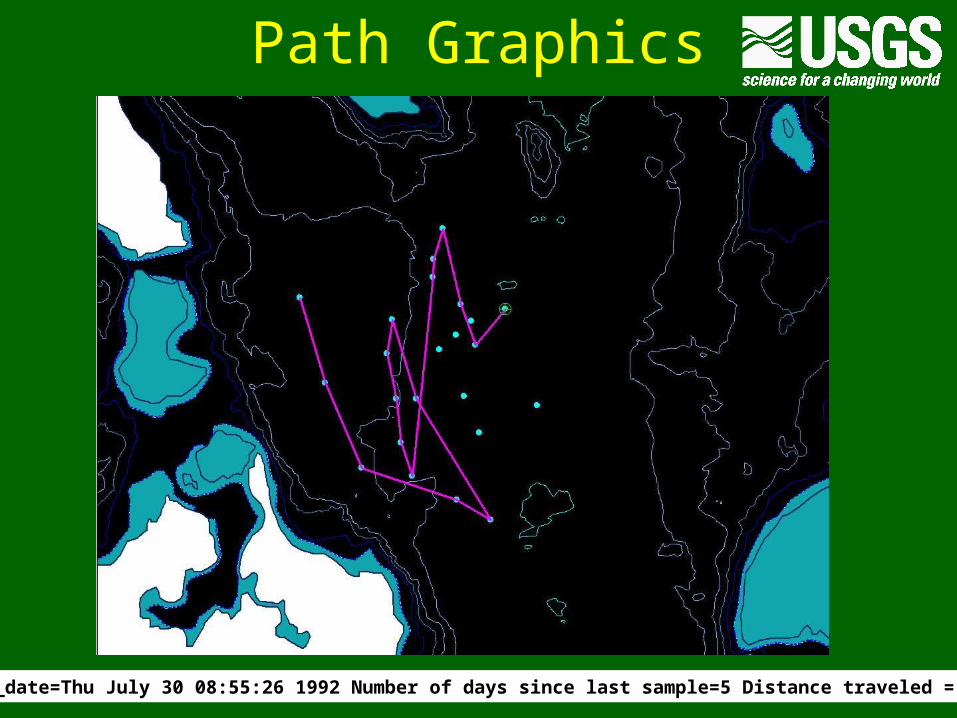
Path Graphics
Obsrv_date=Thu July 30 08:55:26 1992 Number of days since last sample=5 Distance traveled = 89.86

Point to Polyline Generation

Point Buffer
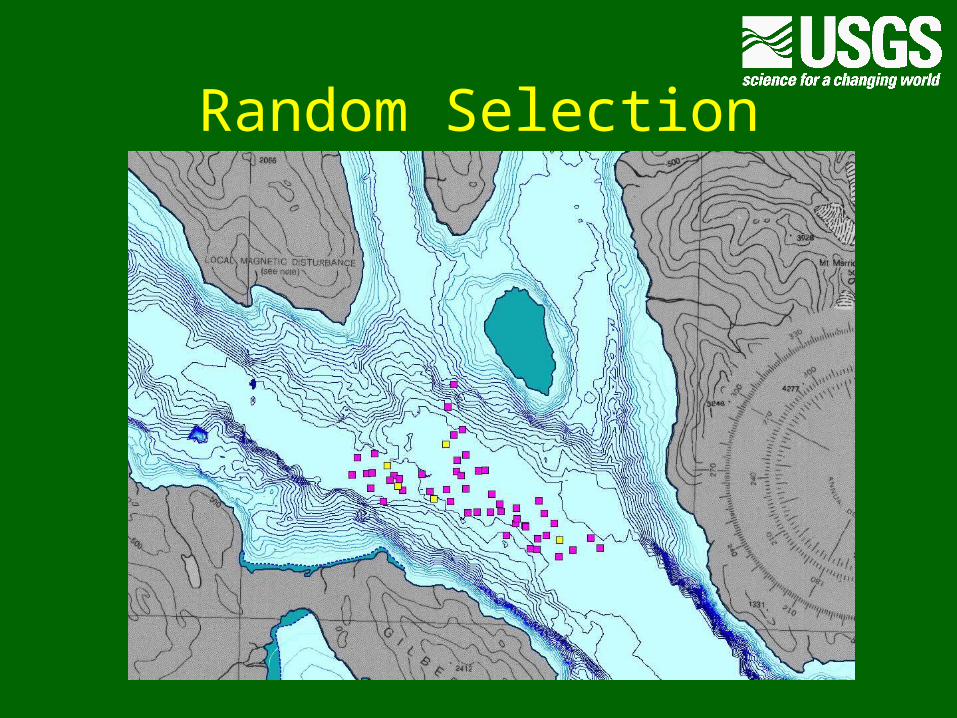
Random Selection

Generate Random Points
Polygon

Spider Analysis
From all points to the harmonic mean

Spider Analysis
From all Points to the nearest Point or Polygonin another Coverage

Other View Tools
Point statistics (36 calculated values) Tests of complete spatial randomness Nearest neighbor analysis Classify points by polygons Calculate distances between themes
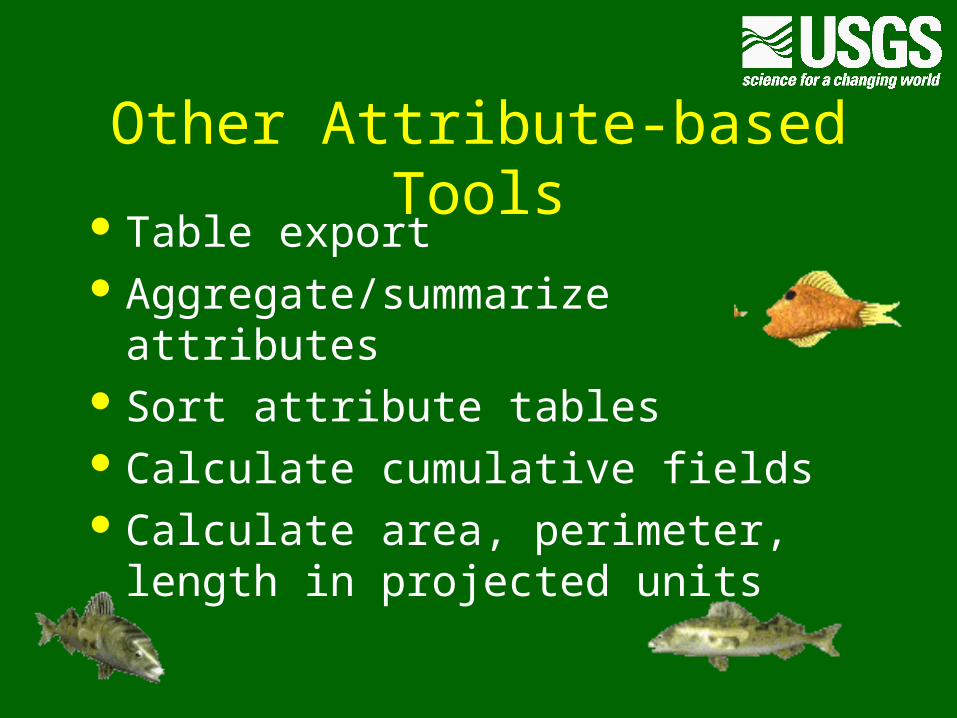
Other Attribute-based Tools Table export Aggregate/summarize attributes Sort attribute tables Calculate cumulative fields Calculate area, perimeter, length in
projected units

What else can Animal Movement be used for?
Analysis of many point phenomena LSCV is the best method of determining
Kernel smoothing factor to use in Spatial Analyst Extension density estimation
Odds and ends are useful for filling various holes in ArcView’s capabilities

About Animal Movement
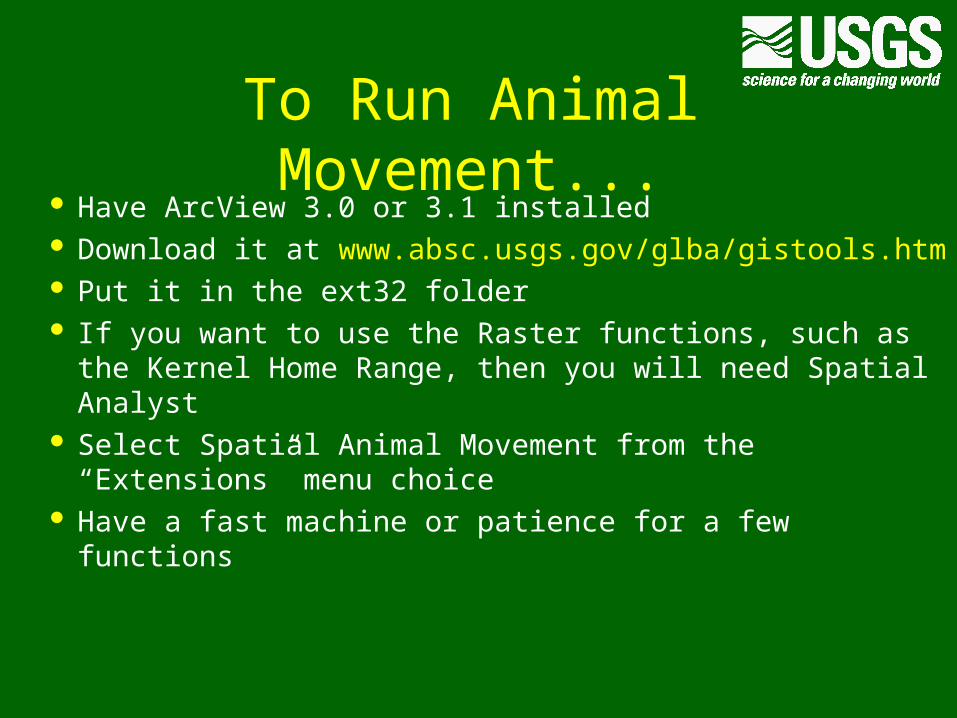
To Run Animal Movement... Have ArcView 3.0 or 3.1 installed Download it at www.absc.usgs.gov/glba/gistools.htm Put it in the ext32 folder If you want to use the Raster functions, such as the
Kernel Home Range, then you will need Spatial Analyst Select Spatial Animal Movement from the “Extensions”
menu choice Have a fast machine or patience for a few functions

Animal Movement Ver. 2.0 Batch Processing* Habitat Analysis Functions
Compositional Analysis Availability Analysis Spider/Distance Analysis* Classify Points by Polygons*
More Random Generation Tools* Dirichlet Tesselation and Delaunay Triangulation* Static and Dynamic Interaction A Few Statistics
Spearman’s Rho Mann-Whitney U test Wilcoxon Matched-Pairs Signed-Rank Test Regression