the ap arms race: is grade-weighting to blame? · the ap arms race: is grade-weighting to blame?...
TRANSCRIPT
IntroductionGrade Weights
Student ResponsivenessConclusions
The AP Arms Race: Is Grade-Weighting to Blame?
Kristin KlopfensteinSenior Researcher
UTD Texas Schools Project
April 7, [email protected]

Educational Arms RaceAP Arms RaceWhy Weight?Research Questions
“In many ways, we are caught up in the educational equivalent of a nuclear arms race. We know that this overemphasis on test scores hurts all involved, especially students. But we also know that anyone or any institution opting out of the competition does so at considerable risk.”
Richard Atkinson, former President, University of California system
February, 2001
The Educational Arms Race
IntroductionGrade Weights
Student ResponsivenessConclusions

“AP has become a significant factor in... [Atkinson’s] ‘educational arms race,’ as applicants and their parents seek every advantage to improve their chances of acceptance. For example, it is now common for upper middle-class parents to evaluate and choose high schools for their children based on the number of AP courses offered at those schools, thereby placing great pressure on schools to expand their AP offerings.”
Geiser and Santelices, 2004The Role of Advanced Placement and
Honors Courses in College Admissions
The AP Arms Race
Educational Arms RaceAP Arms RaceWhy Weight?Research Questions
IntroductionGrade Weights
Student ResponsivenessConclusions
The AP arms race also occurs at the student level when individual students take more AP courses than they optimally would. How might grade weighting drive this?
AP course grades => improve class rank=> increase probability of acceptance
The AP Arms Race
Educational Arms RaceAP Arms RaceWhy Weight?Research Questions
IntroductionGrade Weights
Student ResponsivenessConclusions
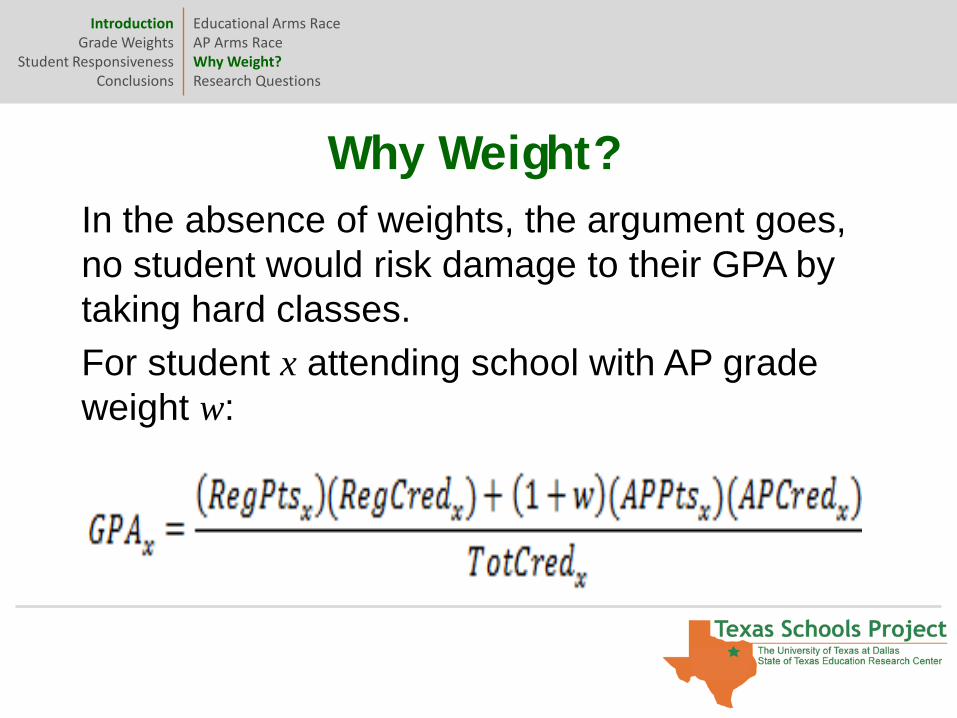
In the absence of weights, the argument goes, no student would risk damage to their GPA by taking hard classes. For student x attending school with AP grade weight w:
Why Weight?
Educational Arms RaceAP Arms RaceWhy Weight?Research Questions
IntroductionGrade Weights
Student ResponsivenessConclusions
1. Why are grade weights so controversial? 2. What do Texas high schools do?3. Do students increase AP course-taking in response
to greater AP grade weights, and do students from different demographic groups respond differently?
4. How do the availability and grade weighting of pre-AP/honors, IB, and dual credit courses influence AP-taking?
5. What is the optimal grade weight?
Research Questions
Educational Arms RaceAP Arms RaceWhy Weight?Research Questions
IntroductionGrade Weights
Student ResponsivenessConclusions

Why are grade weights controversial?
IntroductionGrade Weights
Student ResponsivenessConclusions
Once weight grades in one type of class, is a slippery slope. Weights reflect
institutional value, hence…
HB 3851 and the ensuing fiasco.
Why the Controversy?AP SurveyTexas High Schools
AP Survey
IntroductionGrade Weights
Student ResponsivenessConclusions
• Telephone survey of Texas public high schools regarding their AP-related policies during the 2003-04 academic year.
• Started with largest schools serving grades 11 and/or 12 and worked to smallest from TEA directory.
• Spoke with counselors whenever possible.
• Among schools contacted, only a handful refused.
• Final sample of 911 campuses, 787 offering AP and with complete survey info on weighting practices.
Why the Controversy?AP SurveyTexas High Schools
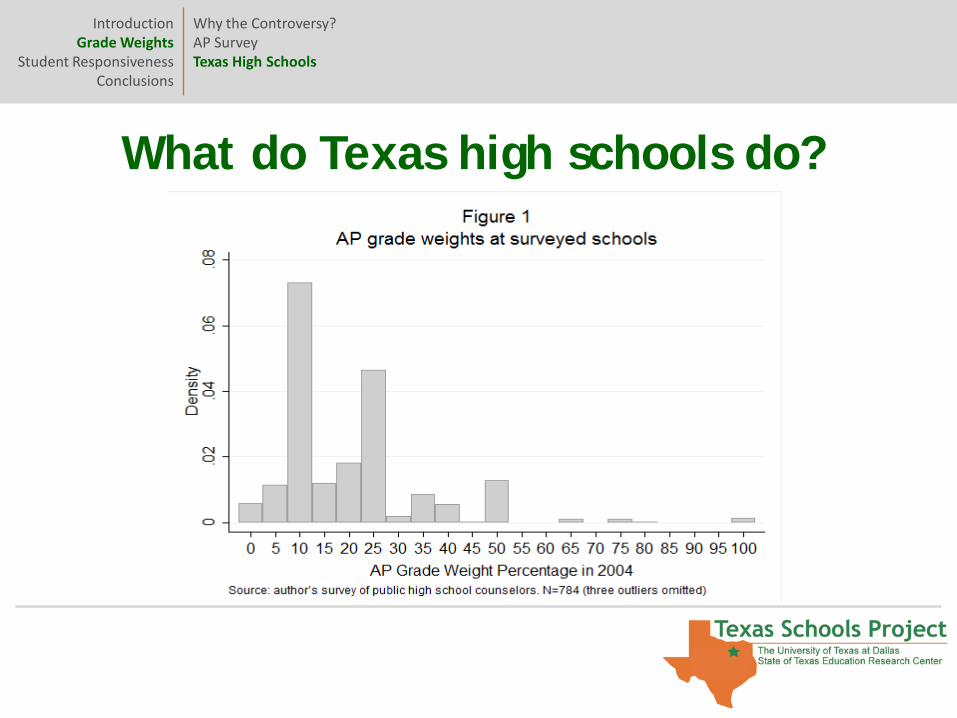
What do Texas high schools do?
IntroductionGrade Weights
Student ResponsivenessConclusions
Why the Controversy?AP SurveyTexas High Schools
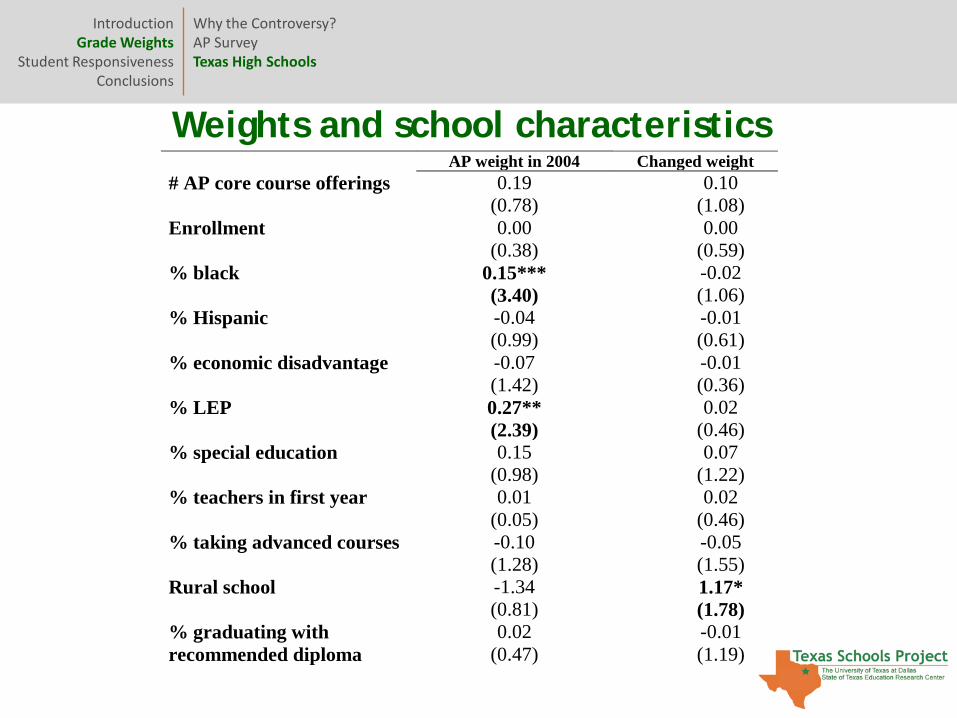
Weights and school characteristics
IntroductionGrade Weights
Student ResponsivenessConclusions
Why the Controversy?AP SurveyTexas High Schools
AP weight in 2004 Changed weight # AP core course offerings 0.19
(0.78) 0.10
(1.08) Enrollment 0.00
(0.38) 0.00
(0.59) % black 0.15***
(3.40) -0.02 (1.06)
% Hispanic -0.04 (0.99)
-0.01 (0.61)
% economic disadvantage -0.07 (1.42)
-0.01 (0.36)
% LEP 0.27** (2.39)
0.02 (0.46)
% special education 0.15 (0.98)
0.07 (1.22)
% teachers in first year 0.01 (0.05)
0.02 (0.46)
% taking advanced courses -0.10 (1.28)
-0.05 (1.55)
Rural school -1.34 (0.81)
1.17* (1.78)
% graduating with recommended diploma
0.02 (0.47)
-0.01 (1.19)

TheoryMethodologyResults
IntroductionGrade Weights
Student ResponsivenessConclusions
Do students increase AP course-taking in response to greater AP grade weights? The theory.
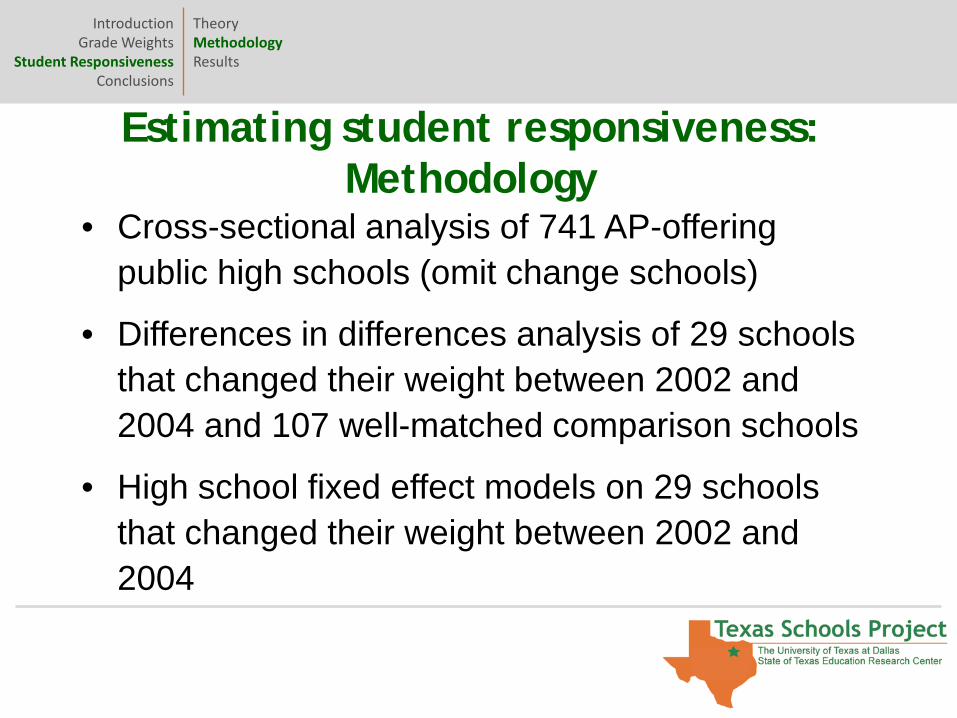
• Cross-sectional analysis of 741 AP-offering public high schools (omit change schools)
• Differences in differences analysis of 29 schools that changed their weight between 2002 and 2004 and 107 well-matched comparison schools
• High school fixed effect models on 29 schools that changed their weight between 2002 and 2004
Estimating student responsiveness: Methodology
TheoryMethodologyResults
IntroductionGrade Weights
Student ResponsivenessConclusions
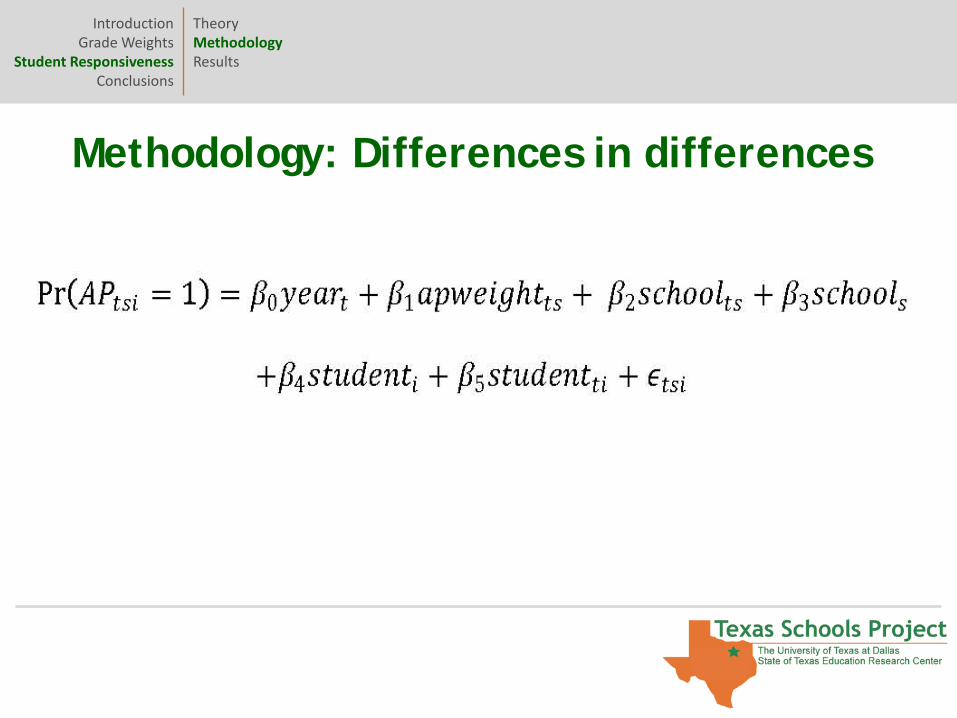
Methodology: Differences in differences
TheoryMethodologyResults
IntroductionGrade Weights
Student ResponsivenessConclusions
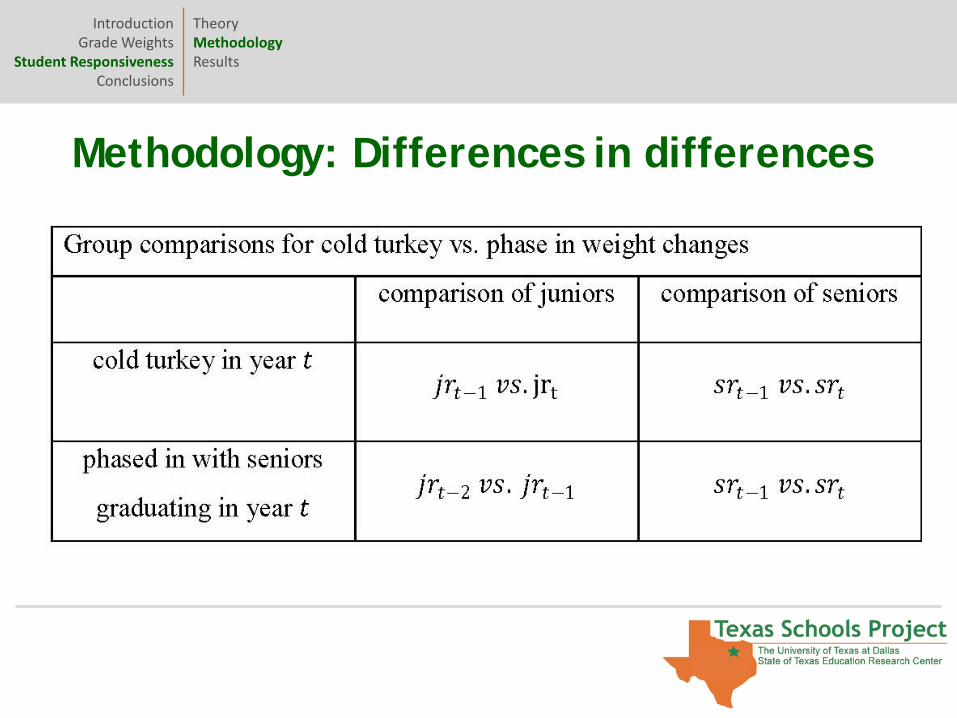
Methodology: Differences in differences
TheoryMethodologyResults
IntroductionGrade Weights
Student ResponsivenessConclusions
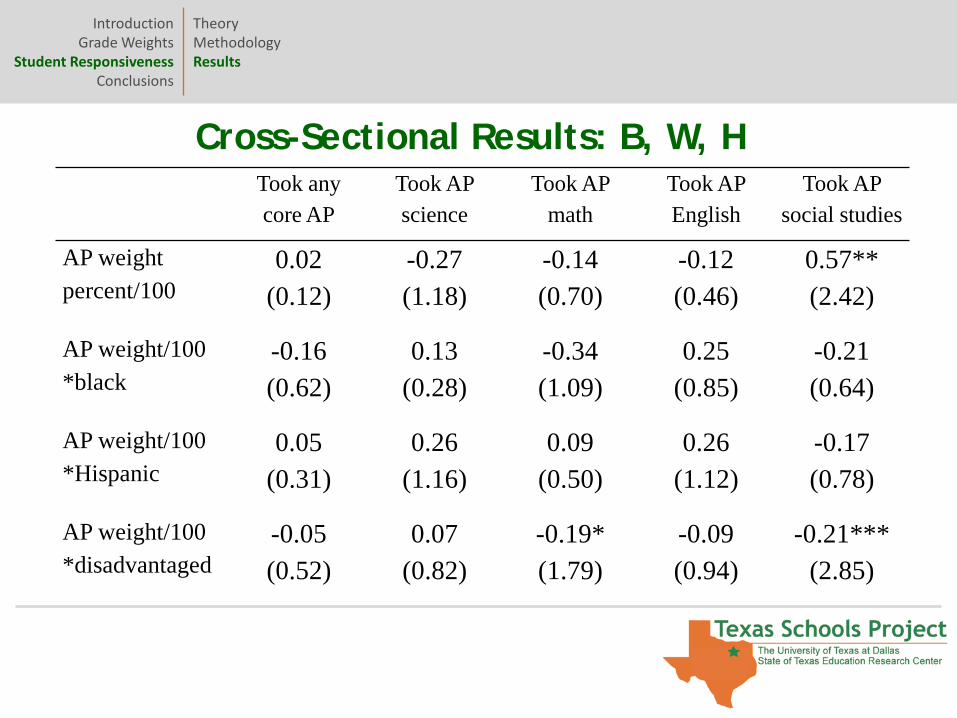
Cross-Sectional Results: B, W, H
TheoryMethodologyResults
IntroductionGrade Weights
Student ResponsivenessConclusions
Took any core AP
Took AP science
Took AP math
Took AP English
Took AP social studies
AP weight percent/100
0.02(0.12)
-0.27(1.18)
-0.14(0.70)
-0.12(0.46)
0.57**(2.42)
AP weight/100*black
-0.16(0.62)
0.13(0.28)
-0.34(1.09)
0.25(0.85)
-0.21(0.64)
AP weight/100*Hispanic
0.05(0.31)
0.26(1.16)
0.09(0.50)
0.26(1.12)
-0.17(0.78)
AP weight/100*disadvantaged
-0.05(0.52)
0.07(0.82)
-0.19*(1.79)
-0.09(0.94)
-0.21***(2.85)
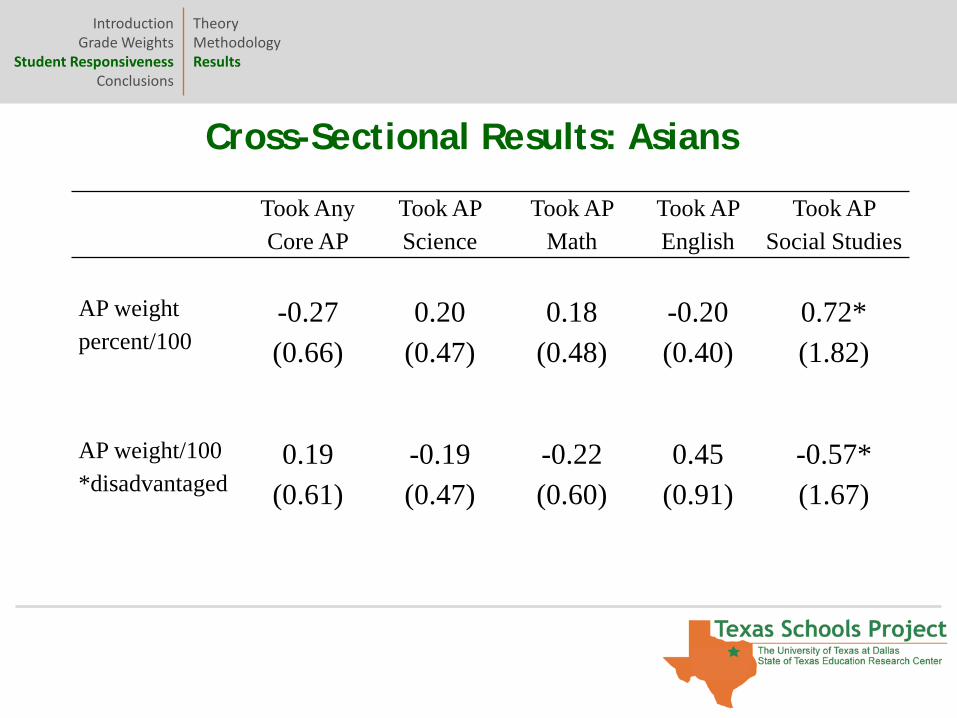
Cross-Sectional Results: Asians
TheoryMethodologyResults
IntroductionGrade Weights
Student ResponsivenessConclusions
Took Any Core AP
Took AP Science
Took AP Math
Took AP English
Took AP Social Studies
AP weight percent/100
-0.27(0.66)
0.20(0.47)
0.18(0.48)
-0.20(0.40)
0.72*(1.82)
AP weight/100*disadvantaged
0.19(0.61)
-0.19(0.47)
-0.22(0.60)
0.45(0.91)
-0.57*(1.67)
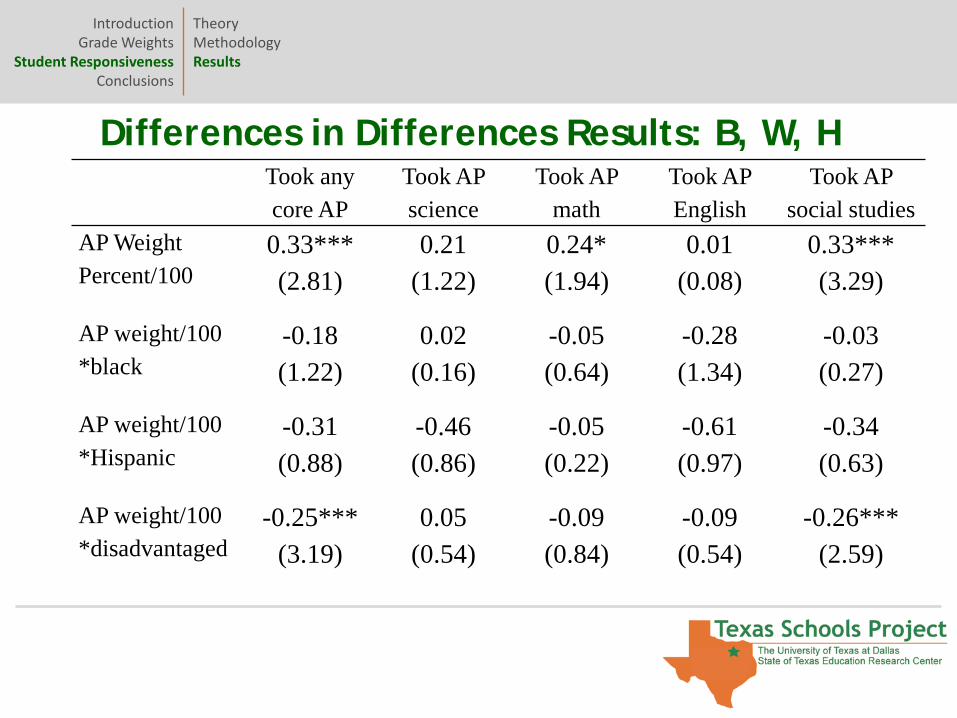
Differences in Differences Results: B, W, H
TheoryMethodologyResults
IntroductionGrade Weights
Student ResponsivenessConclusions
Took any core AP
Took AP science
Took AP math
Took AP English
Took AP social studies
AP Weight Percent/100
0.33***(2.81)
0.21(1.22)
0.24*(1.94)
0.01(0.08)
0.33***(3.29)
AP weight/100*black
-0.18(1.22)
0.02(0.16)
-0.05(0.64)
-0.28(1.34)
-0.03(0.27)
AP weight/100*Hispanic
-0.31(0.88)
-0.46(0.86)
-0.05(0.22)
-0.61(0.97)
-0.34(0.63)
AP weight/100*disadvantaged
-0.25***(3.19)
0.05(0.54)
-0.09(0.84)
-0.09(0.54)
-0.26***(2.59)
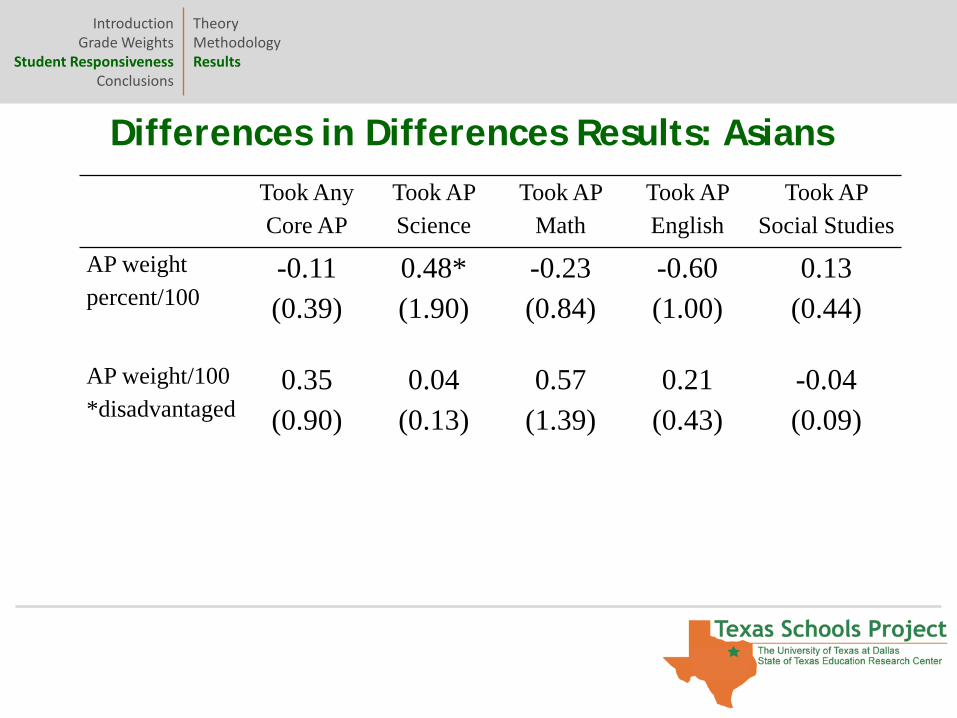
Differences in Differences Results: Asians
TheoryMethodologyResults
IntroductionGrade Weights
Student ResponsivenessConclusions
Took Any Core AP
Took AP Science
Took AP Math
Took AP English
Took AP Social Studies
AP weight percent/100
-0.11(0.39)
0.48*(1.90)
-0.23(0.84)
-0.60(1.00)
0.13(0.44)
AP weight/100*disadvantaged
0.35(0.90)
0.04(0.13)
0.57(1.39)
0.21(0.43)
-0.04(0.09)
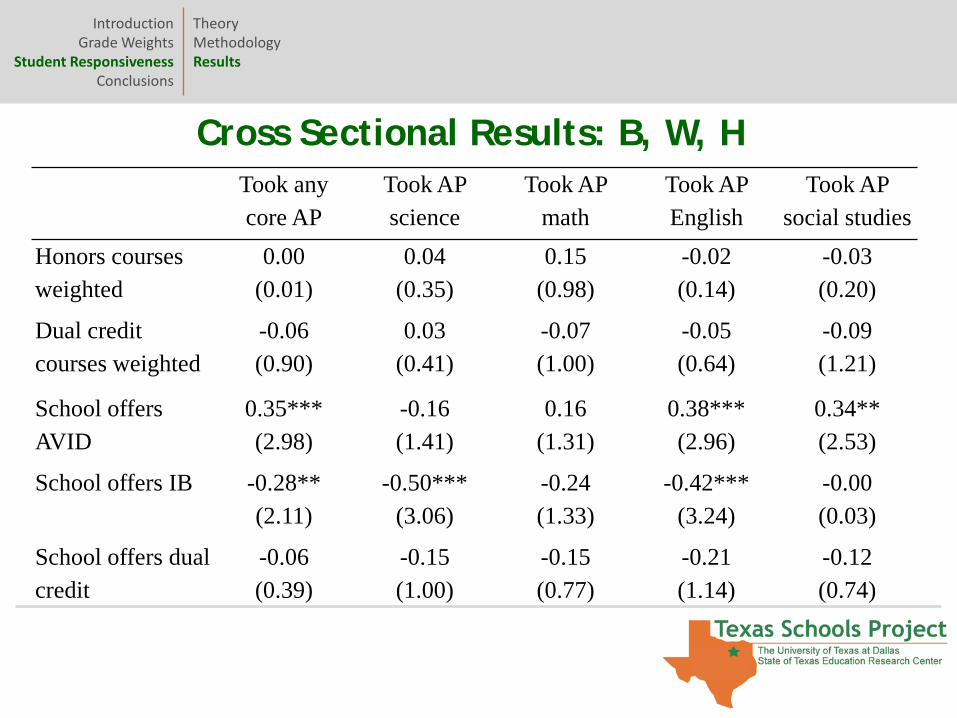
Cross Sectional Results: B, W, H
TheoryMethodologyResults
IntroductionGrade Weights
Student ResponsivenessConclusions
Took any core AP
Took AP science
Took AP math
Took AP English
Took AP social studies
Honors courses weighted
0.00(0.01)
0.04(0.35)
0.15(0.98)
-0.02(0.14)
-0.03(0.20)
Dual credit courses weighted
-0.06(0.90)
0.03(0.41)
-0.07(1.00)
-0.05(0.64)
-0.09(1.21)
School offers AVID
0.35***(2.98)
-0.16(1.41)
0.16(1.31)
0.38***(2.96)
0.34**(2.53)
School offers IB -0.28**(2.11)
-0.50***(3.06)
-0.24(1.33)
-0.42***(3.24)
-0.00(0.03)
School offers dual credit
-0.06(0.39)
-0.15(1.00)
-0.15(0.77)
-0.21(1.14)
-0.12(0.74)
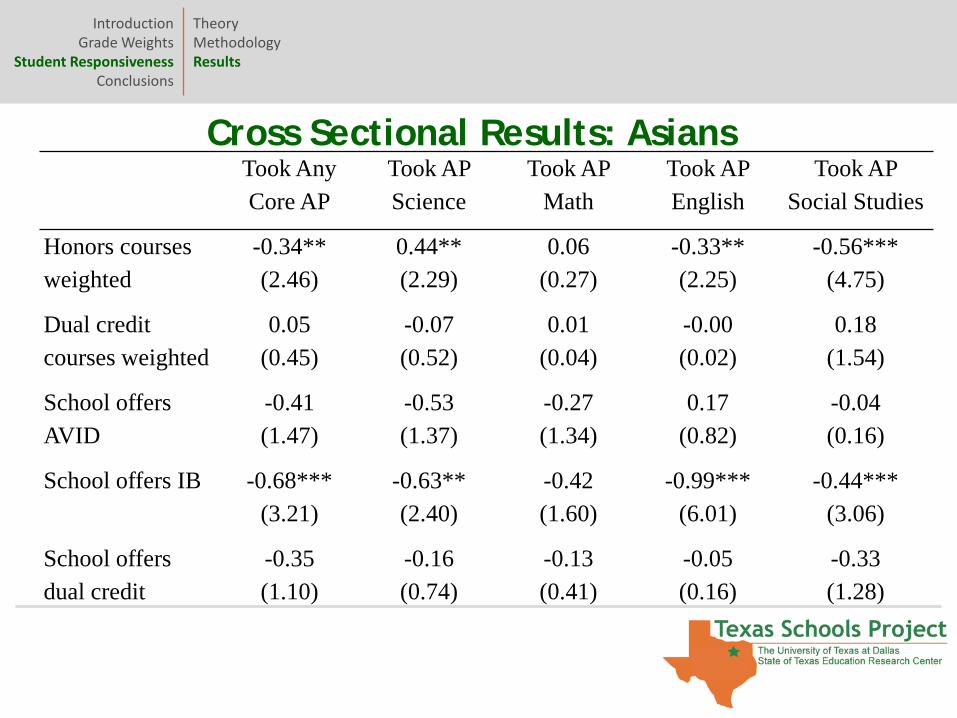
Cross Sectional Results: Asians
TheoryMethodologyResults
IntroductionGrade Weights
Student ResponsivenessConclusions
Took Any Core AP
Took AP Science
Took AP Math
Took AP English
Took AP Social Studies
Honors courses weighted
-0.34**(2.46)
0.44**(2.29)
0.06(0.27)
-0.33**(2.25)
-0.56***(4.75)
Dual credit courses weighted
0.05(0.45)
-0.07(0.52)
0.01(0.04)
-0.00(0.02)
0.18(1.54)
School offers AVID
-0.41(1.47)
-0.53(1.37)
-0.27(1.34)
0.17(0.82)
-0.04(0.16)
School offers IB -0.68***(3.21)
-0.63**(2.40)
-0.42(1.60)
-0.99***(6.01)
-0.44***(3.06)
School offers dual credit
-0.35(1.10)
-0.16(0.74)
-0.13(0.41)
-0.05(0.16)
-0.33(1.28)
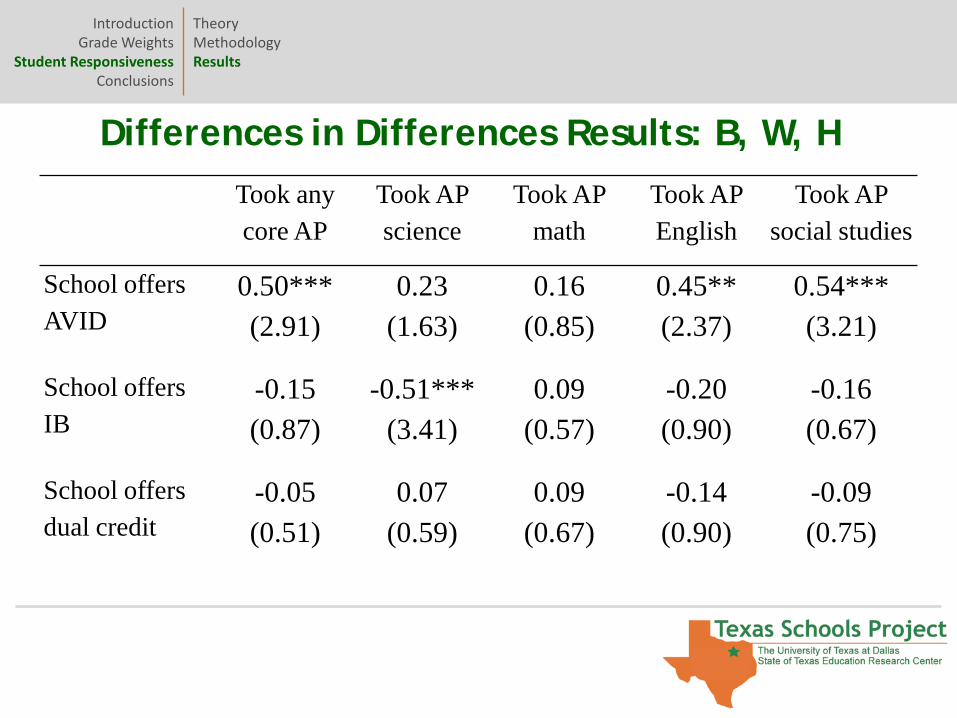
Differences in Differences Results: B, W, H
TheoryMethodologyResults
IntroductionGrade Weights
Student ResponsivenessConclusions
Took any core AP
Took AP science
Took AP math
Took AP English
Took AP social studies
School offers AVID
0.50***(2.91)
0.23(1.63)
0.16(0.85)
0.45**(2.37)
0.54***(3.21)
School offers IB
-0.15(0.87)
-0.51***(3.41)
0.09(0.57)
-0.20(0.90)
-0.16(0.67)
School offers dual credit
-0.05(0.51)
0.07(0.59)
0.09(0.67)
-0.14(0.90)
-0.09(0.75)
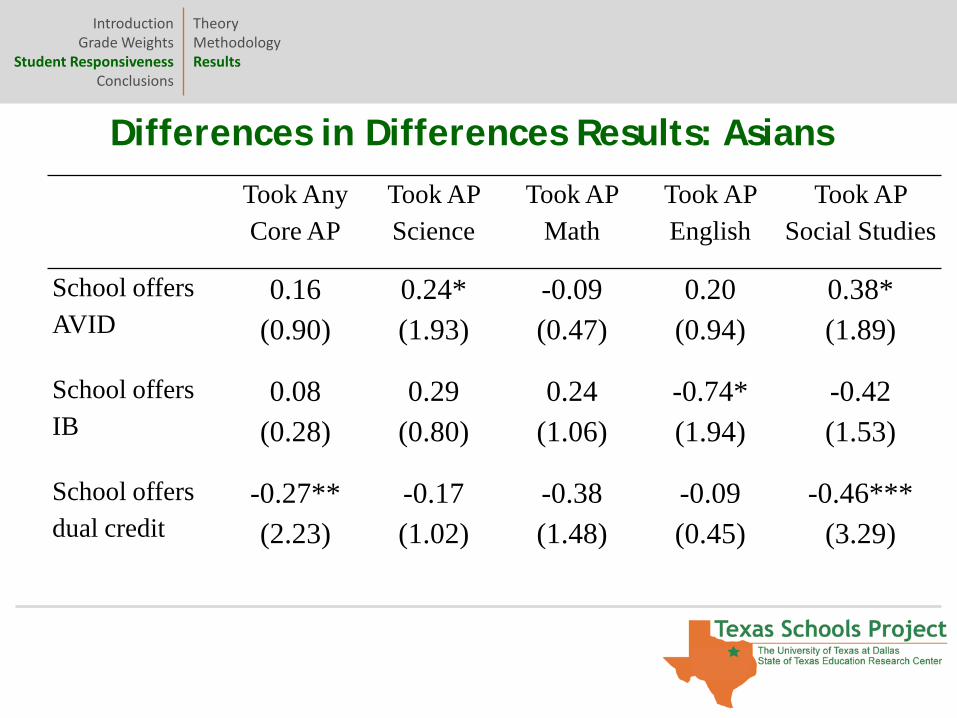
Differences in Differences Results: Asians
TheoryMethodologyResults
IntroductionGrade Weights
Student ResponsivenessConclusions
Took Any Core AP
Took AP Science
Took AP Math
Took AP English
Took AP Social Studies
School offers AVID
0.16(0.90)
0.24*(1.93)
-0.09(0.47)
0.20(0.94)
0.38*(1.89)
School offers IB
0.08(0.28)
0.29(0.80)
0.24(1.06)
-0.74*(1.94)
-0.42(1.53)
School offers dual credit
-0.27**(2.23)
-0.17(1.02)
-0.38(1.48)
-0.09(0.45)
-0.46***(3.29)
• My definition of “optimal”: the weight that incentivizes students by equating the probability of getting 4.0 grade points in an AP class with that of getting 4.0 points in a non-AP class for average student at a school.
• Theory suggests optimal weight potentially different for every school because student abilities and AP course difficulty vary.
• The finding that there is little link between higher weights and AP course-taking behavior indicates a much easier answer: “all weights are equally ineffective at incentivizing AP-taking.”
What is the Optimal Grade Weight?
What is the Optimal Weight?Thoughts on the Texas Fiasco
IntroductionGrade Weights
Student ResponsivenessConclusions
• Given heterogeneity in weighting procedures, savings to higher ed from a uniform GPA could be substantial.
• HB 3851 allowed schools to weight courses however they liked for class rank. Even with outrageous weights, unlikely to further disadvantage first gen college students given minimal incentive effects.
• Much of controversy seems to be driven by concerns of “fairness” under the guise of rhetoric on incentives.
Thoughts on the Texas Fiasco
What is the Optimal Weight?Thoughts on the Texas Fiasco
IntroductionGrade Weights
Student ResponsivenessConclusions
IntroductionGrade Weights
Student ResponsivenessConclusions
Kristin KlopfensteinSenior Researcher
UTD Texas Schools Project