the apparel industry: jordan’s comparative advantage in · pdf file1 | p a g e the...
TRANSCRIPT

1 | P a g e
The Apparel Industry: Jordan’s Comparative Advantage in
International Trade
George Domat, Benjamin Glass, Drusilla Brown
Tufts University
Better Work Monitoring and Evaluation
12 December 2012
I. Introduction
Emergence of the apparel industry is a common step toward industrialization and/or economic
development. Currently, we observe apparel production throughout Latin American, South Asia
and Southeast Asia. However, apparel production in the Middle East has been a less pronounced
feature of economic development.
Although, the stock of human capital and persistent unemployment in most countries along the
southern rim of the Mediterranean would lead us to expect an apparel industry to emerge, apparel
production for export is limited to Morocco, Israel, Egypt, Tunisia and Jordan. The southern
Mediterranean rim countries that do not have an export-oriented apparel industry (Libya, Algeria
and Syria) all have significant petroleum reserves and lack trade agreements with the United
States or Europe that provide trade preferences for apparel.
The position of apparel industry in Jordan appears particularly tenuous. (1) An apparel export
industry did not emerge until after the Qualified Industrial Zone Agreement (1996) with the
United States. As a consequence, a commonly voiced concern is that the apparel industry in
Jordan is an inefficient byproduct of preferential trade agreements between Jordan and the
United States. (2) While Jordan has an apparel export industry, the fraction of production

2 | P a g e
workers who are migrants has steadily risen over the decade and now is approaching 80 percent
of the apparel labor force. Thus, it is not clear that Jordan has the factor endowments that
provide a comparative advantage in apparel. Jordan may be above the level of economic
development at which an apparel industry normally emerges. That is, a skill mismatch may exist
between Jordan’s current human capital endowment and the requirements of the apparel
industry.
The possible marginal economic viability of the Jordanian export apparel industry has been
offered as a reason to resist improvements in working conditions. For example, compliance with
minimum wage law or the harmonization of the minimum wage law across all sectors of the
Jordanian economy are challenged as not being economically feasible if Jordan lacks a
comparative advantage in apparel production.
A more complex set of concerns arises from the reliance on migrant labor. As a consequence of
work permit and visa restrictions, migrants lack the ability to discipline the labor market by
seeking out employers with the most attractive configuration of wages and working conditions.
The intra-firm immobility of migrant labor and limitations on union membership render migrants
vulnerable to violations such as forced labor, excessive overtime, nonpayment of wages, harsh
conditions of work, etc. However, if Jordan has a comparative advantage in apparel production,
the industry can remain viable even if firms are fundamentally in compliance with core labor
standards and Jordanian labor law.
In spite of the concerns for the viability of the Jordanian apparel industry, apparel dominates
Jordan’s export profile. Jordan’s share (percent) of U.S. imports and the world are reported in
Table 1 for 2007. Jordan’s share of the U.S. import market is less than one-one hundredth of one
3 | P a g e
percent in every industry except apparel (1.12%), nonferrous metal products (0.1694%), motor
vehicles bodies trailers (0.0309%) and paper products publishing (0.0109%). Jordan’s share by
sector is depicted in Figure 1, in which the outsized role of apparel in Jordan-U.S. trade is clearly
evident.
Before addressing question concerning the impact of labor market characteristics and trade
policy on the viability of Jordan’s apparel industry, we need to pose a very basic question: Given
Jordan’s endowment of factors of production (capital, land, skilled labor, unskilled labor and
natural resources) would we expect Jordan to be a significant apparel exporter in the absence of
preferential access to the U.S. market and the employment of migrant labor?
In the analysis below, data on U.S. and world trade are used to construct an empirical model of
the determinants of a country’s export share profile. That is, which industry in a country should
have the largest share of the world export market and which industry the lowest? Currently, the
apparel sector is ranked number one among all sectors of the Jordanian economy in terms of
share of the world export market. Is this ranking consistent with Jordan’s factor endowments or
would we expect other sectors of the Jordanian economy to claim a higher share of world exports
than the Jordanian apparel producers?
The first stage of the empirical analysis excludes Jordan. The empirical model determines the
world export share profile for each industry within a country. We then employ Jordanian data to
predict Jordan’s exports by sector. However, in making the prediction, we abstract away from
the unemployment rate, employment of migrant labor, Jordanian labor market institutions and
the Jordan-U.S. Free Trade Agreement (JUSTFA). The abstraction allows us to assess the
4 | P a g e
viability and expected size of the Jordan apparel market in the absence of the JUSFTA and the
employment of migrant labor.
Anticipating our conclusions, we find that
1. The apparel industry’s current status as the number 1 industry among all of Jordan’s
export industries’ in its share of world exports is not predicted by the statistical model in
the absence of migrant labor.
2. The dominant role of the apparel industry in Jordan’s export profile can be rationalized
by having a considerably larger supply of female workers than the supply of women
currently active in the Jordanian work force.
3. The additional supply of female workers which rationalizes the size of Jordan’s apparel
exports is currently provided by migrant labor.
4. However, additional supply of female labor could also be provided by raising the very
low rate of labor force participation by Jordanian females with a secondary level of
education or less. The reservation wage reported by Jordanian females in the apparel
sector is 200 JD per month for a 48 hour work week. The estimated average monthly cost
of a migrant from Sri Lanka working a comparable 48 hour week is 259 JD and worker
from Bangladesh costs about 251 JD per month when travel, living and permitting
expenses are taken into account.
5. Whether taken from the perspective of the labor force participation rate, unemployment
rate or unit labor cost, Jordan appears to have a latent comparative advantage in apparel
even in the absence of migrant labor or the JUSFTA.
5 | P a g e
In Section II below we present the analytical framework and Section III provides a description of
the data employed in the analysis. We then turn to the regression analysis and empirical findings
in Section IV. Discussion and directions for future research follow in Section V.
II. Analytical Framework
According to standard international trade theory, each country tends to export goods that require
its abundant factor intensively in production. So, for example, the United States is generally
considered to be a skilled-labor abundant country. It stands to reason, then, that the United
States will exports goods and services that require intensive use of skilled labor. By contrast, the
United States will import goods that require intensive use of unskilled labor.
We expect, then, that industries with a world market share rank in a country’s export profile will
require a disproportionately large amount of the country’s abundant factor of production.
Industries that rank low require a proportionately small amount of the country’s abundant factor.
Returning to the example of the United States, U.S. industries requiring a large input of skilled
labor will claim a larger share of world exports than U.S. industries that require little skilled
labor.
In the analysis that follows, for each country, we will calculate the share of world exports for
each product category. Exports shares for an individual exporting country are then ranked from
lowest to highest. The calculation of export share by industry is repeated for all countries in the
data set.
We then use regression analysis to develop a mathematical relationship between the ranking for
each industry, the factors of production used intensively in the industry and the country’s
endowment of each factor of production. The mathematical model and information about
6 | P a g e
Jordan’s factor endowments are then used to predict the rank of each industry in Jordan’s export
profile. The predicted rankings are compared to the actual rank. We will be particularly
interested in determining whether we would expect the apparel industry to be Jordan’s number
one export industry.
A straightforward procedure to undertake this analysis is through a cross-country, cross-time
regression of country characteristics on apparel production. By comparing Jordan to other
countries with similar characteristics, we can develop some evidence on whether we expect the
apparel industry to be viable in Jordan in the absence of migrant labor and the JUSFTA.
The formal model is developed below for the interested reader. Others may proceed to Section
III.
Leamer1 provides a foundation for the Testing Trade Theories literature upon which the analysis
below is based. The essential approach is to use an econometric model to explain the volume of
trade between two countries in a particular product as being determined by relative GNP, relative
populations, applicable tariffs, resource endowments relative to population and distance between
the two countries. However, Romalis2 develops a unified analytical framework that provides
more analytical rigor while relaxing some restrictive assumptions concerning the organization of
goods markets imposed by Leamer. Romalis develops a multi-countries Hecksher-Ohlin model
which incorporates Krugman’s model of monopolistic competition and allows for transport costs.
Following Romalis, we begin taking the trade share in sector j of country c as a function
of the factor cost shares as in equation (1). is defined as the share that country c commands of
1 Leamer, Edward E, 1974. "The Commodity Composition of International Trade in Manufactures: An Empirical
Analysis," Oxford Economic Papers, Oxford University Press, vol. 26(3), pages 350-74, November. 2 John Romalis, 2004. "Factor Proportions and the Structure of Commodity Trade," American Economic Review,
American Economic Association, vol. 94(1), pages 67-97, March.
7 | P a g e
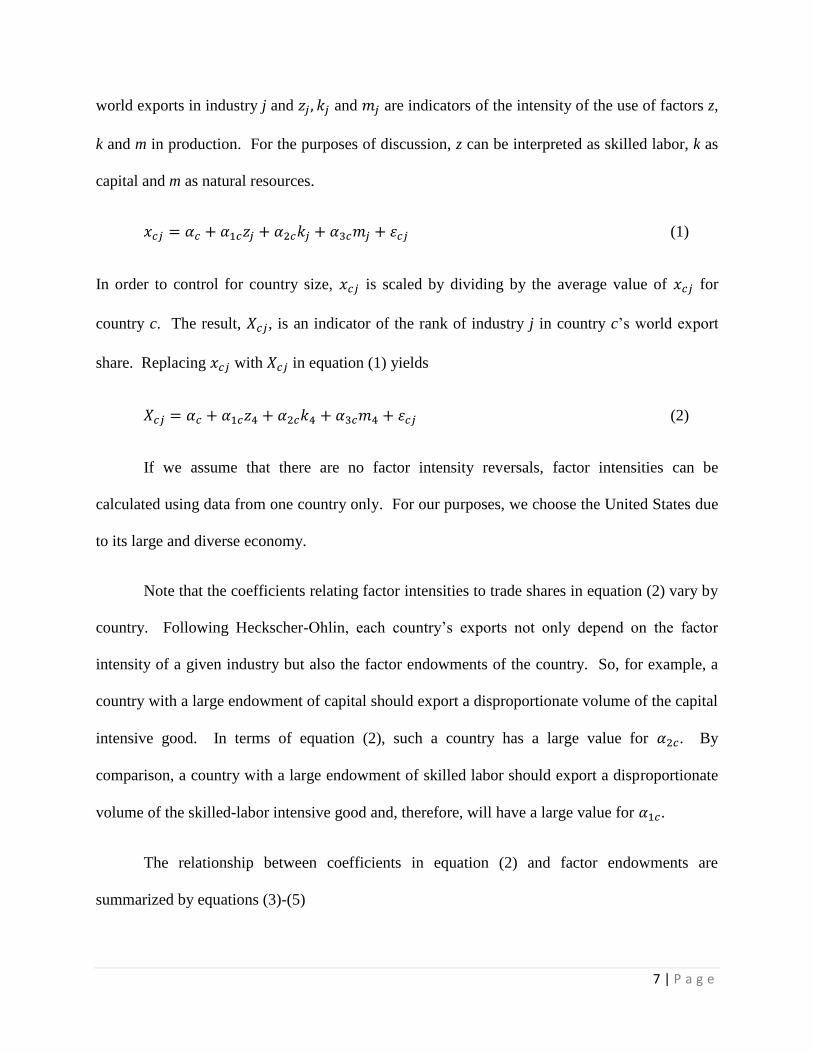
world exports in industry j and and are indicators of the intensity of the use of factors z,
k and m in production. For the purposes of discussion, z can be interpreted as skilled labor, k as
capital and m as natural resources.
(1)
In order to control for country size, is scaled by dividing by the average value of for
country c. The result, , is an indicator of the rank of industry j in country c’s world export
share. Replacing with in equation (1) yields
(2)
If we assume that there are no factor intensity reversals, factor intensities can be
calculated using data from one country only. For our purposes, we choose the United States due
to its large and diverse economy.
Note that the coefficients relating factor intensities to trade shares in equation (2) vary by
country. Following Heckscher-Ohlin, each country’s exports not only depend on the factor
intensity of a given industry but also the factor endowments of the country. So, for example, a
country with a large endowment of capital should export a disproportionate volume of the capital
intensive good. In terms of equation (2), such a country has a large value for . By
comparison, a country with a large endowment of skilled labor should export a disproportionate
volume of the skilled-labor intensive good and, therefore, will have a large value for .
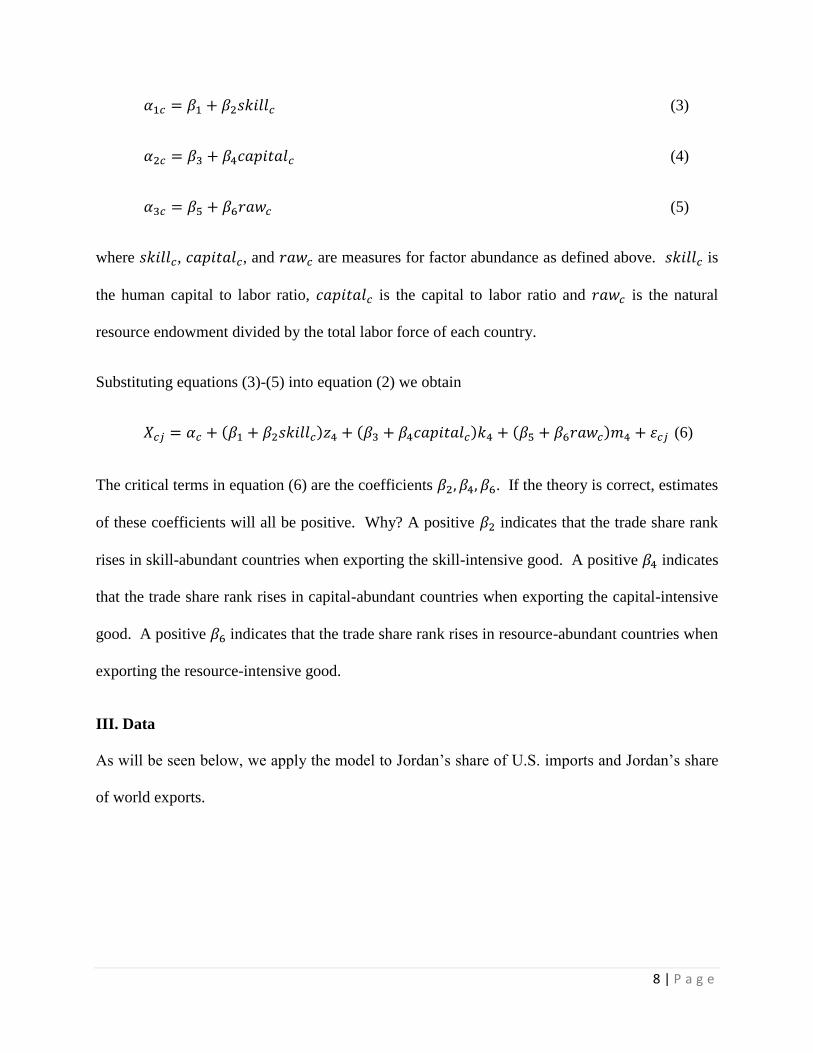
The relationship between coefficients in equation (2) and factor endowments are
summarized by equations (3)-(5)
8 | P a g e
(3)
(4)
(5)
where , , and are measures for factor abundance as defined above. is
the human capital to labor ratio, is the capital to labor ratio and is the natural
resource endowment divided by the total labor force of each country.
Substituting equations (3)-(5) into equation (2) we obtain
(6)
The critical terms in equation (6) are the coefficients . If the theory is correct, estimates
of these coefficients will all be positive. Why? A positive indicates that the trade share rank
rises in skill-abundant countries when exporting the skill-intensive good. A positive indicates
that the trade share rank rises in capital-abundant countries when exporting the capital-intensive
good. A positive indicates that the trade share rank rises in resource-abundant countries when
exporting the resource-intensive good.
III. Data
As will be seen below, we apply the model to Jordan’s share of U.S. imports and Jordan’s share
of world exports.
9 | P a g e
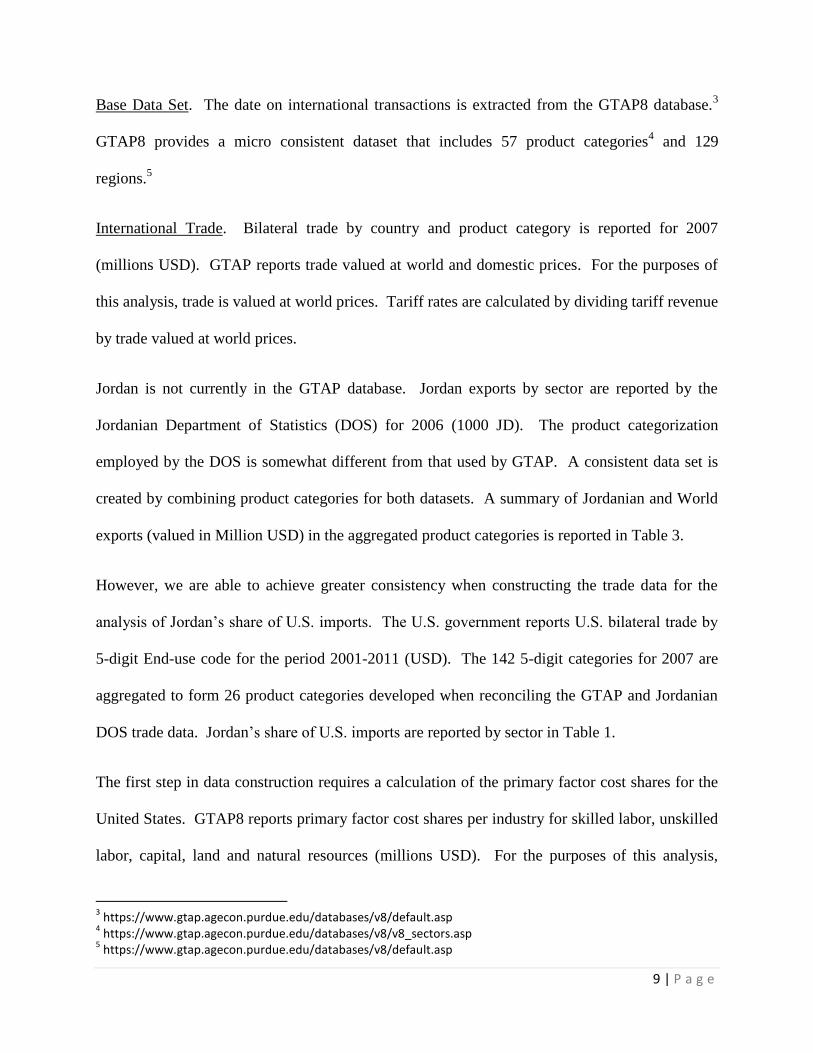
Base Data Set. The date on international transactions is extracted from the GTAP8 database.3
GTAP8 provides a micro consistent dataset that includes 57 product categories4 and 129
regions.5
International Trade. Bilateral trade by country and product category is reported for 2007
(millions USD). GTAP reports trade valued at world and domestic prices. For the purposes of
this analysis, trade is valued at world prices. Tariff rates are calculated by dividing tariff revenue
by trade valued at world prices.
Jordan is not currently in the GTAP database. Jordan exports by sector are reported by the
Jordanian Department of Statistics (DOS) for 2006 (1000 JD). The product categorization
employed by the DOS is somewhat different from that used by GTAP. A consistent data set is
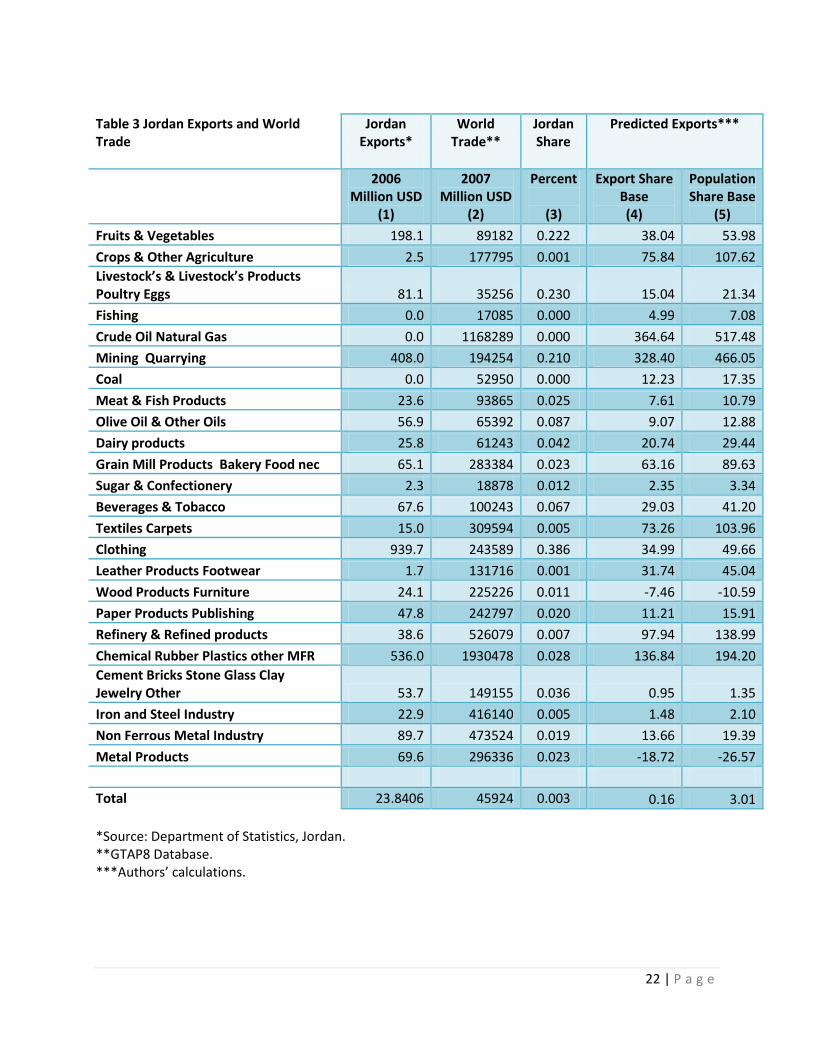
created by combining product categories for both datasets. A summary of Jordanian and World
exports (valued in Million USD) in the aggregated product categories is reported in Table 3.
However, we are able to achieve greater consistency when constructing the trade data for the
analysis of Jordan’s share of U.S. imports. The U.S. government reports U.S. bilateral trade by
5-digit End-use code for the period 2001-2011 (USD). The 142 5-digit categories for 2007 are
aggregated to form 26 product categories developed when reconciling the GTAP and Jordanian
DOS trade data. Jordan’s share of U.S. imports are reported by sector in Table 1.
The first step in data construction requires a calculation of the primary factor cost shares for the
United States. GTAP8 reports primary factor cost shares per industry for skilled labor, unskilled
labor, capital, land and natural resources (millions USD). For the purposes of this analysis,
3 https://www.gtap.agecon.purdue.edu/databases/v8/default.asp
4 https://www.gtap.agecon.purdue.edu/databases/v8/v8_sectors.asp
5 https://www.gtap.agecon.purdue.edu/databases/v8/default.asp
10 | P a g e
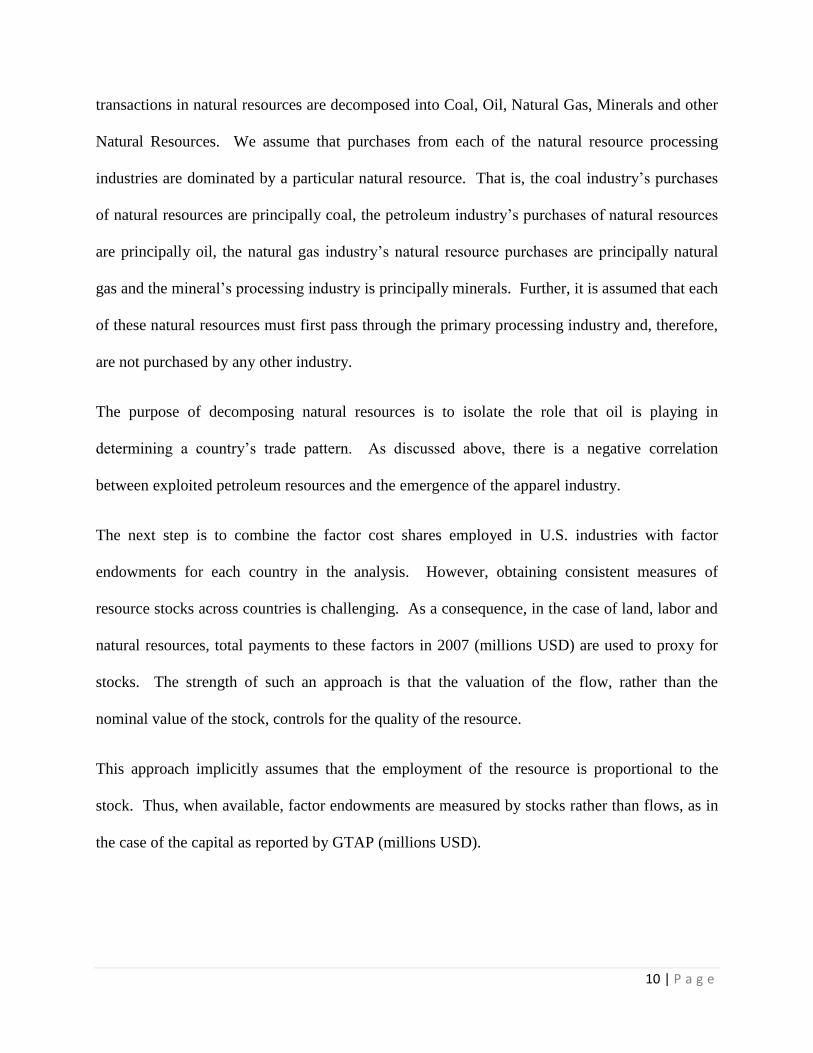
transactions in natural resources are decomposed into Coal, Oil, Natural Gas, Minerals and other
Natural Resources. We assume that purchases from each of the natural resource processing
industries are dominated by a particular natural resource. That is, the coal industry’s purchases
of natural resources are principally coal, the petroleum industry’s purchases of natural resources
are principally oil, the natural gas industry’s natural resource purchases are principally natural
gas and the mineral’s processing industry is principally minerals. Further, it is assumed that each
of these natural resources must first pass through the primary processing industry and, therefore,
are not purchased by any other industry.
The purpose of decomposing natural resources is to isolate the role that oil is playing in
determining a country’s trade pattern. As discussed above, there is a negative correlation
between exploited petroleum resources and the emergence of the apparel industry.
The next step is to combine the factor cost shares employed in U.S. industries with factor
endowments for each country in the analysis. However, obtaining consistent measures of
resource stocks across countries is challenging. As a consequence, in the case of land, labor and
natural resources, total payments to these factors in 2007 (millions USD) are used to proxy for
stocks. The strength of such an approach is that the valuation of the flow, rather than the
nominal value of the stock, controls for the quality of the resource.
This approach implicitly assumes that the employment of the resource is proportional to the
stock. Thus, when available, factor endowments are measured by stocks rather than flows, as in
the case of the capital as reported by GTAP (millions USD).
11 | P a g e
However, it should be noted that in using payments to labor rather than the stock of skilled and
unskilled workers, we are ignoring the presence of unemployed workers and potential workers
who are not in the labor force.
The Jordanian DOS also reports a figure for the capital stock (millions JD)6 and household labor
income for 2006 (JD).7 As noted in the preceding paragraph, relying on household labor income
allows us to focus attention on the stock of currently employed Jordanians. Unemployed
Jordanians and potential labor force participants are not considered in the first stage of the
analysis.
Factor endowments are calculated per capita based on population as reported by GTAP
(millions). The factor endowments for each country are then interacted with the factor cost
shares (for the United States) for each industry. In order to produce estimated coefficients of
comparable order of magnitude, the terms which include endowments are scaled by a factor of
1/1000.
Given the focus on the apparel industry in Jordan and the dominant role of women in the global
apparel industry, the labor force participation of women is of significant interest. We take the
level of female economic activity as a type of endowment. The World Economic Forum8 reports
indices of gender engagement overall and for economic participation and opportunity,
educational attainment, health and survival and political empowerment. We interact female
6 http://www.dos.gov.jo/dos_home_e/main/sel2/nat_1/3.pdf
7 Department of Statistics, Household Expenditure and Income Survey 2006, Table 3.4 Average Annual Current
Income of Household by Source and Governorates (in JD). 8 http://www3.weforum.org/docs/WEF_GenderGap_Report_2006.pdf

12 | P a g e
employment cost share by industry for the United States9 with the Economic Participation and
Opportunity Score to obtain a measure of the availability of female workers.
The dependent variable in the analysis in equation (1) is export share. In order to control for
unobserved country heterogeneity in trade openness, trade share for each country is scaled by the
country’s average trade share. Thus, the dependent variable reflects trade share rank. Further, a
separate intercept is estimated for each exporter to allow for transportation costs, imperfect
competition and preferential trade agreements. Thus, the analysis predicts trade share by
industry relative to a country’s average over all industries as a function of factor intensity and
factor abundance.
IV. Regression Analysis
Equation (6) is estimated in two forms. First, we consider the determinants of the share of world
exports. Results are reported in column (1) of Table 2. We then turn to consider the role of
factor intensity and factor endowments in determining the share of U.S. imports. Results are
reported in column (2). Estimated coefficients of the country dummies are suppressed but are
available upon request.10
We must first consider the validity of the underlying model. A test of validity is that the
interaction between factor cost share and factor endowment should be a positive predictor of
trade share. That is, export share should increase in industries with a high factor cost share for
countries endowed with the factor in question.
9 http://www.bls.gov/cps/wlf-table14-2011.pdf
10 Estimated coefficients of the country dummies are suppressed but are available upon request.

13 | P a g e
Indeed, the estimated coefficients on the interaction terms are all positive and statistically
significant. The only exception is Land, for which the estimated coefficient is negative but not
statistically different from zero.
Turning to the central question of the analysis: How does Jordan’s actual trade compare to the
predictions of the empirical model? To answer this question, we simply calculate Jordan’s
predicted share of world exports and compare values to the actual trade share.
Recall, however, that the statistical model predicts the export share of each sector relative to the
average for an individual country. In order to convert the predicted value relative to the average
to a trade volume, we need to choose a base. There are two obvious choices. First, we can take
Jordan’s current export average share. Alternatively, we can use Jordan’s share of world
population as the base.
Predicted trade base on Jordan’s current share of world exports is reported in column (4) of
Table 3. Note first, that the empirical model broadly predicts exports by sectors. Industries
predicted to have a high export share rank also appear to have above average exports. However,
in the case of apparel, Jordan’ exported a total 939.7 million USD in 2006 whereas the model
predicts exports of 35-50 million USD.
Figure 2 depicts actual Jordanian exports, predicted exports based on Jordan’s current export
share and predicted exports projected from population share for Jordan’s largest export sectors.
It is clear that actual apparel exports (dark blue) are many times larger than the predicted trade
(red and green.)

14 | P a g e
The obvious question is how could apparel be dominating Jordan’s export profile if Jordan lacks
the resource endowments which would predict apparel exports? The answer, of course, is that
Jordanian apparel firms rely on migrant labor to supplement the domestic labor force.
In order to highlight the role of migrants, we adjust the Jordanian parameters to reflect an
increase in the supply of female labor by a factor of three and then recalculate export share rank.
Results are reported in Table 4 and are depicted in Figure 3. Exports from the female labor
intensive sectors, apparel footwear and textiles, jump to 728.24-920.51 million, almost exactly
equal to the actual levels for these three industries.11
V. Discussion and Directions for Future Research
The findings reported in Section IV clearly point to migrant labor as the source of Jordan’s
comparative advantage in apparel and other female labor-intensive sectors. We should not jump
to the conclusion, however, that the apparel industry in Jordan is somehow illegitimate. It is a
well-documented finding in international trade theory that international factor flows are welfare-
improving for the sending country, the factor of production that moves internationally and the
receiving country.
The group that is harmed by international factor flows is the domestic supply of the migrating
factor. In the case of apparel, unskilled Jordanians may be made worse off by the presence of
migrants in the apparel industry. The question arises, then, whether Jordan possesses a latent
comparative advantage in apparel production in the absence of migrant labor. If so, a policy
which increases Jordanian employment in the apparel sector may increase income, narrow the
11 Note also that augmenting the female labor force also rationalizes Jordan’s exports from the agricultural sector.

15 | P a g e
distribution of income and lower the unemployment rate for Jordanian households in the bottom
half of the distribution of income.
Recent Jordanian Government strategy has focused on providing incentives for job-creating
investments. Indeed, between 2000 and 2005, the Jordanian economy grew at a rate of 6 percent
per year. One surprise outcome during the expansion of the apparel industry in Jordan over the
past decade is the failure of the unemployment rate to decline. Of new jobs created, 63 percent
were filled by migrants. As a consequence, the Jordanian unemployment rate remained around
14 percent.
It is commonly argued that there are two fundamental causes of this outcome. First, tax
incentives for investment appear to have targeted industries intensive in low-wage jobs,
particularly apparel. That is, the jobs created may have been a poor match for the skills abundant
in Jordan. Second, there are some labor market imperfections that promote queuing outside of
higher paying jobs. For example, the Civil Service Bureau accepts applications even when no
jobs are available. According to the World Bank,12
20 percent of unemployed Jordanians are
registered with the Civil Service Commission.
The evidence of a mismatch between jobs and skills, however, is not entirely compelling. It is
true that the highest unemployment rate exists among the adult population holding a bachelor’s
degree. However, only 10 percent of the workforce falls into this category. More than half of
the unemployed in Jordan have a secondary level of education or less. Such workers are
typically observed working in the apparel industry in other countries of the world. As can be
12 World Bank 2008 Hashemite Kingdom of Jordan, Resolving Jordan’s Labor Market Paradox
of Concurrent Economic Growth and High Unemployment, Report No. 32901-JO, p. vi.

16 | P a g e
Unemployed Share by
Educational Attainment
(World Bank 2008)
Bachelors and
Above
27%
Intermediate
Diploma
12%
Secondary 14%
Less than
Secondary
46%
Illiterate 1%
S
seen in the box , 61 percent of unemployed workers have a
secondary level of education or less. More importantly from the
perspective of the apparel industry, 47 percent have not
completed a secondary level of education.
Furthermore, the unemployment statistics mask the potential
supply of labor to the apparel industry in Jordan. The
unemployment rate for women in Jordan (26%) is twice that of
men (13%). However, women account for only 27 percent of the
unemployed due to the very low female labor market
participation rate (12%) for Jordan. Most unemployed women in
Jordan have an intermediate diploma or bachelors degree, making them a poor match for
production work in the apparel industry. However, women with a secondary degree or less
generally do not participate in the formal labor market and, thus, are not considered when
contemplating the role of the apparel industry in the unemployment picture. It should also be
noted that about half of the labor cost share in the apparel industry is skilled labor. Jordanian
women with some post-secondary education are also well-qualified for such positions.
Now, it is interesting to ponder why the labor force participation rate for Jordanian women is so
low. Large family size, poor quality or unavailable child care, low wages and the traditional role
of women are likely explanations. However, we can make two clear statements. (1) There is a
large pool of Jordanian females who have the educational attainment normally observed in the
apparel industry. (2) Of the women with a secondary level of education or less, the
unemployment rate is nearly as high as more highly educated women.

17 | P a g e
Thus, the stylized argument that the jobs created by the apparel industry are a poor match for the
demographic characteristics of the workers in the labor force is only partly (and not very
interestingly) correct. If one adds women currently outside of the formal labor market, the
potential domestic labor force available to apparel firms in Jordan is large enough to create a
comparative advantage in apparel for Jordan.
If a mismatch in skills and apparel jobs exists, it is not due to the educational characteristics and
competing employment opportunities of Jordanian females. The mismatch must lie elsewhere.
Some obvious possibilities include
location of the production facilities
cultural restrictions on female employment
formal workplace experience of Jordanian females and/or
legal restrictions on terms of the employment of Jordanian females (relative to non-
Jordanian females)
the reputation of conditions of work in apparel factories.
The relationship between unemployment and migration is not just a simple mathematical one.
The demographic and human capital effects of the apparel industry on a society occur only over
time. The impact of the apparel industry will only emerge as the opportunity to earn money
wages affects family size and workers become adapted to the rigors of factory life. The apparel
industry has commonly been the work opportunity in which workers acquire formal labor market
skills. The presence of a readily available pool of migrant labor will short circuit the normal
mechanisms which induce factory managers and the pool of local labor to learn to work together
to produce increasingly higher-value added products.
18 | P a g e
The findings above are developed based on hypothetical factor supplies. However, a more direct
characterization of the availability of Jordanian labor can found by comparing the per unit cost of
migrant labor to the reservation wage required by Jordanian workers.
Better Work Jordan13
finds that the reservation wage for Jordanian women in the apparel
industry is 200 JD per month for a 48 hour work week. The question is how the reservation
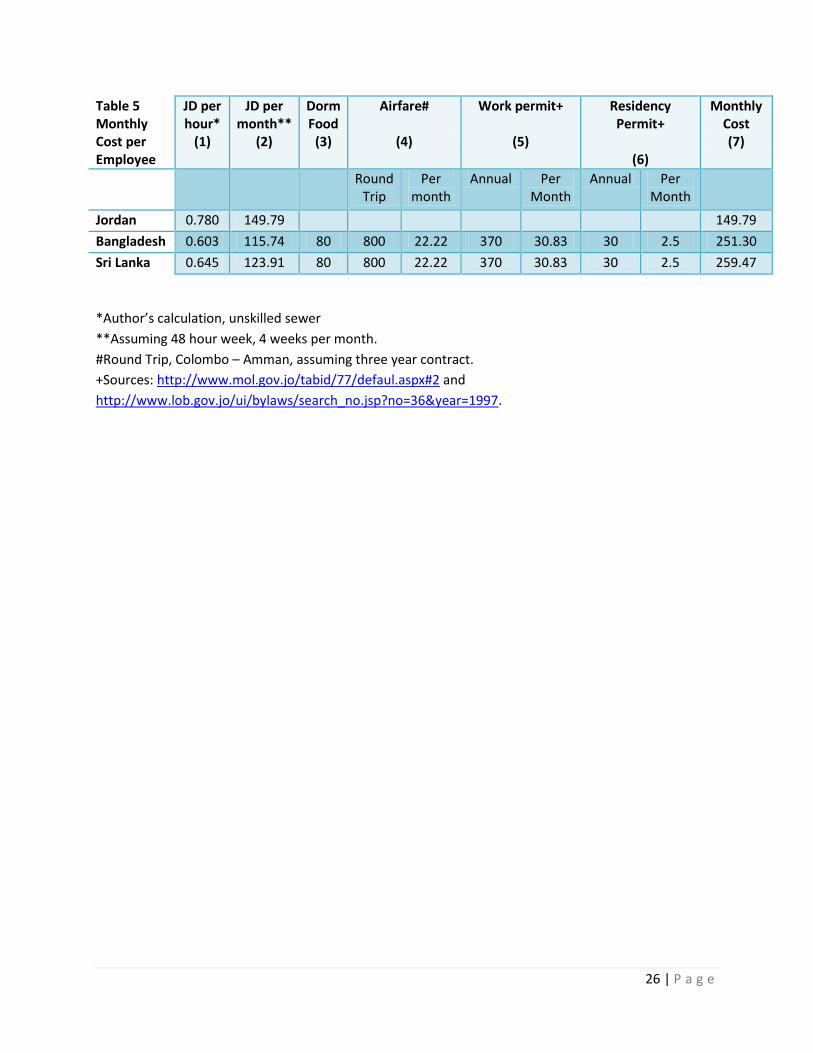
wage compares to the current cost of a migrant. A comparison is provided in Table 5.
Column (1) reports the estimated hourly take-home compensation of an unskilled sewer for
Jordanians and migrants from Bangladesh and Sri Lanka. In column (2), the hourly
compensation is converted to a monthly rate under the assumption of a 48 hour week, four weeks
per month. Columns (3) – (5) estimate additional costs for migrants, including housing and food,
air travel and required work and residency permits. Each cost is converted from a lump sum to a
per month cost assuming a typical three year contract. We find that the monthly cost for an
unskilled sewer from Sri Lanka is 259.47JD and Bangladesh 251.30 JD. We conclude, then, that
the cost of a migrant actually exceeds the reservation wage required by a Jordanian to enter the
apparel sector.
Thus, whether we consider the latent supply of female labor in Jordan or the cost per worker of a
migrant our findings indicate that Jordan has a comparative advantage in the apparel sector even
in the absence of migrant labor and the JUSFTA. However, if Jordan is to realize the full
developmental potential of the apparel sector, policies will need to be in place to increase labor
force participation by Jordanian women with a secondary education level or less.
13
Better Work Jordan. 2012. “Employment of Jordanians in the Garment Industry: Challenges and Prospects,” August.

19 | P a g e
Table 1 US Imports Total and from Jordan
Jordan Share of U.S. Imports
Percent
Fruits & Vegetables 0.0070
Crops & Other Agriculture 0.0014
Livestock’s & Livestock’s Products Poultry Eggs 0.0014
Fishing 0.0000
Crude Oil & Natural Gas 0.0000
Mining Quarrying 0.0004
Coal 0.0010
Dairy products 0.0033
Other Food Products 0.0021
Beverages & Tobacco 0.0039
Textiles Carpets 0.0039
Clothing 1.1213
Leather products Footwear 0.0000
Wood Products Furniture 0.0023
Paper Products Publishing 0.0109
Fertilizer Paint Pharm Soap 0.0065
Chemical Rubber Plastics 0.0033
Cement Bricks Stone Glass Clay Other 0.0032
Iron and Steel Industry 0.0000
Non Ferrous Metal Industry 0.1694
Metal Products 0.0003
Machine Equipment 0.0023
Electrical Equipment nec 0.0002
Motor Vehicles Bodies, Trailers 0.0309
Other Transport Equipment 0.0002
Engineering Instruments Jewelry Other MFEs 0.0000
*Source: United States Census Bureau, US Department of Commerce.

20 | P a g e
Figure 1: Jordan Export Share of U.S. Imports
0.00 0.20 0.40 0.60 0.80 1.00 1.20
Fruits & Vegatables
Crops & Other Agriculture
Livestock’s & Livestock’s Products Poultry Eggs
Fishing
Crude Oil & Natural Gas
Mining Quarrying
Coal
Dairy products
Other Food Products
Beverages & Tobacco
Textiles Carpets
Clothing
Leather products Footwear
Wood Products Furniture
Paper Products Publishing
Fertlizer Paint Pharm Soap
Chemical Rubber Plastics
Cement Bricks Stone Glass Clay Other
Iron and Steel Industry
Non Ferrous Metal Industry
Metal Products
Machine Equipment
Electrical Equipment nec
Motor Vehicles Bodies, Trailers
Other Transport Equipments
Engineering Instruments Jewelery Other MFEs

21 | P a g e
Table 2 Pooled Regression Import
Share on Factory Intensities
Export Share World Trade Share US Imports
(1) (2)
Land share 0.636 1.067
(1.20) (1.64)
Unskilled labor share -0.555 -0.544
(1.26) (1.00)
Skilled labor share -2.120 -2.146
(4.48)** (3.69)**
Capital share 0.604 0.476
(1.33) (0.85)
Oil share 0.525 1.712
(0.71) (1.90)
Gas share -0.974 -2.062
(1.35) (2.32)*
Minerals share -0.319 3.892
(0.17) (1.66)
Female labor share*GEconomicRate 1.261 2.944
(2.30)* (4.36)**
Land share*Land PC -2.284 -2.456
(0.53) (0.47)
Unsklab share*UnSkLab PC 0.049 0.036
(1.55) (0.85)
Sklab share*Sklab PC 0.416 0.596
(8.48)** (9.55)**
Oil share*OilNRPC 9.175 5.977
(12.38)** (6.59)**
Gas share*GasNRPC 33.017 4.455
(15.16)** (1.67)
Mineral share*MinNRPC 286.872
(4.51)**
247.938
(3.19)**
_cons 0.383 (0.84)
1.040
(1.68)
Country dummies yes Yes
N
7,040 6,985
* p<0.05; ** p<0.01
22 | P a g e
Table 3 Jordan Exports and World Trade
Jordan Exports*
World Trade**
Jordan Share
Predicted Exports***
2006 Million USD
(1)
2007 Million USD
(2)
Percent
(3)
Export Share Base (4)
Population Share Base
(5)
Fruits & Vegetables 198.1 89182 0.222 38.04 53.98
Crops & Other Agriculture 2.5 177795 0.001 75.84 107.62
Livestock’s & Livestock’s Products Poultry Eggs 81.1 35256 0.230 15.04 21.34
Fishing 0.0 17085 0.000 4.99 7.08
Crude Oil Natural Gas 0.0 1168289 0.000 364.64 517.48
Mining Quarrying 408.0 194254 0.210 328.40 466.05
Coal 0.0 52950 0.000 12.23 17.35
Meat & Fish Products 23.6 93865 0.025 7.61 10.79
Olive Oil & Other Oils 56.9 65392 0.087 9.07 12.88
Dairy products 25.8 61243 0.042 20.74 29.44
Grain Mill Products Bakery Food nec 65.1 283384 0.023 63.16 89.63
Sugar & Confectionery 2.3 18878 0.012 2.35 3.34
Beverages & Tobacco 67.6 100243 0.067 29.03 41.20
Textiles Carpets 15.0 309594 0.005 73.26 103.96
Clothing 939.7 243589 0.386 34.99 49.66
Leather Products Footwear 1.7 131716 0.001 31.74 45.04
Wood Products Furniture 24.1 225226 0.011 -7.46 -10.59
Paper Products Publishing 47.8 242797 0.020 11.21 15.91
Refinery & Refined products 38.6 526079 0.007 97.94 138.99
Chemical Rubber Plastics other MFR 536.0 1930478 0.028 136.84 194.20
Cement Bricks Stone Glass Clay Jewelry Other 53.7 149155 0.036 0.95 1.35
Iron and Steel Industry 22.9 416140 0.005 1.48 2.10
Non Ferrous Metal Industry 89.7 473524 0.019 13.66 19.39
Metal Products 69.6 296336 0.023 -18.72 -26.57
Total 23.8406 45924 0.003 0.16 3.01
*Source: Department of Statistics, Jordan. **GTAP8 Database. ***Authors’ calculations.

23 | P a g e
Table 4 Jordan Exports and World Trade: Augmented Female Labor Force Participation
Jordan Exports*
Predicted Exports Augmented Female Labor Force
Participation**
2006 Million USD
(1)
Actual Export Share Base
(2)
Population Share Base
(3)
Fruits & Vegetables 198.1 72.99 103.58
Crops & Other Agriculture 2.5 145.51 206.50
Livestock’s & Livestock’s Products Poultry Eggs 81.1 28.85 40.95
Fishing 0.0 7.37 10.45
Crude Oil Natural Gas 0.0 700.98 994.80
Mining Quarrying 408.0 371.28 526.90
Coal 0.0 17.31 24.56
Meat & Fish Products 23.6 45.29 64.27
Olive Oil & Other Oils 56.9 35.33 50.13
Dairy products 25.8 45.03 63.91
Grain Mill Products Bakery Food nec 65.1 211.37 299.96
Sugar & Confectionery 2.3 14.82 21.03
Beverages & Tobacco 67.6 65.27 92.62
Textiles Carpets 15.0 339.16 481.32
Clothing 939.7 244.21 346.57
Leather Products Footwear 1.7 144.87 205.59
Wood Products Furniture 24.1 41.17 58.42
Paper Products Publishing 47.8 118.39 168.01
Refinery & Refined products 38.6 259.49 368.26
Chemical Rubber Plastics other MFR 536.0 1169.65 1659.91
Cement Bricks Stone Glass Clay Jewelry Other 53.7 30.53 43.33
Iron and Steel Industry 22.9 107.31 152.28
Non Ferrous Metal Industry 89.7 134.08 190.28
Metal Products 69.6 56.64 80.37
Total 23.8406 1157.97 1643.34
*Source: Department of Statistics, Jordan. **Authors’ calculations.

24 | P a g e
Figure 2: Jordanian Exports: Actual, Predicted Current Export Share and Predicted Population Millions USD, 2007
-0.100 0.000 0.100 0.200 0.300 0.400 0.500
Fruits & Vegetables
Crops & Other Agriculture
Livestock & Livestock Products Poultry Eggs
Mining Quarrying
Meat & Fish Products
Olive Oil & Other Oils
Dairy Products
Grain Mill Products Bakery Food nec
Sugar & Confectionery
Beverages & Tobacco
Textiles Carpets
Clothing
Leather Products Footwear
Wood Products Furniture
Paper Products Publishing
Refinery & Refined Products
Chemical Rubber Plastics Other MFR
Cement Bricks Stone Glass Clay Jewelry Other
Iron and Steel
Non Ferrous Metal
Predicted Population Share
Predicted Export Share
Actual

25 | P a g e
Figure 3: Jordanian Exports: Actual, Predicted Current Export Share and Predicted Population Augmented Female Labor Force Supply, Millions USD, 2007
0.000 0.200 0.400 0.600
Fruits & Vegetables
Crops & Other Agriculture
Livestock & Livestock Products Poultry Eggs
Mining Quarrying
Meat & Fish Products
Olive Oil & Other Oils
Dairy Products
Grain Mill Products Bakery Food nec
Sugar & Confectionery
Beverages & Tobacco
Textiles Carpets
Clothing
Leather Products Footwear
Wood Products Furniture
Paper Products Publishing
Refinery & Refined Products
Chemical Rubber Plastics Other MFR
Cement Bricks Stone Glass Clay Jewelry Other
Iron and Steel
Non Ferrous Metal
Predicted Population Share FLP
Predicted Export Share FLP
Actual
26 | P a g e
Table 5 Monthly Cost per Employee
JD per hour*
(1)
JD per month**
(2)
Dorm Food
(3)
Airfare#
(4)
Work permit+
(5)
Residency Permit+
(6)
Monthly Cost (7)
Round Trip
Per month
Annual Per Month
Annual Per Month
Jordan 0.780 149.79 149.79
Bangladesh 0.603 115.74 80 800 22.22 370 30.83 30 2.5 251.30
Sri Lanka 0.645 123.91 80 800 22.22 370 30.83 30 2.5 259.47
*Author’s calculation, unskilled sewer
**Assuming 48 hour week, 4 weeks per month.
#Round Trip, Colombo – Amman, assuming three year contract.
+Sources: http://www.mol.gov.jo/tabid/77/defaul.aspx#2 and
http://www.lob.gov.jo/ui/bylaws/search_no.jsp?no=36&year=1997.