jordan’s water resource challenges and the prospects …€¦ · 1 jordan’s water resource...
TRANSCRIPT
1
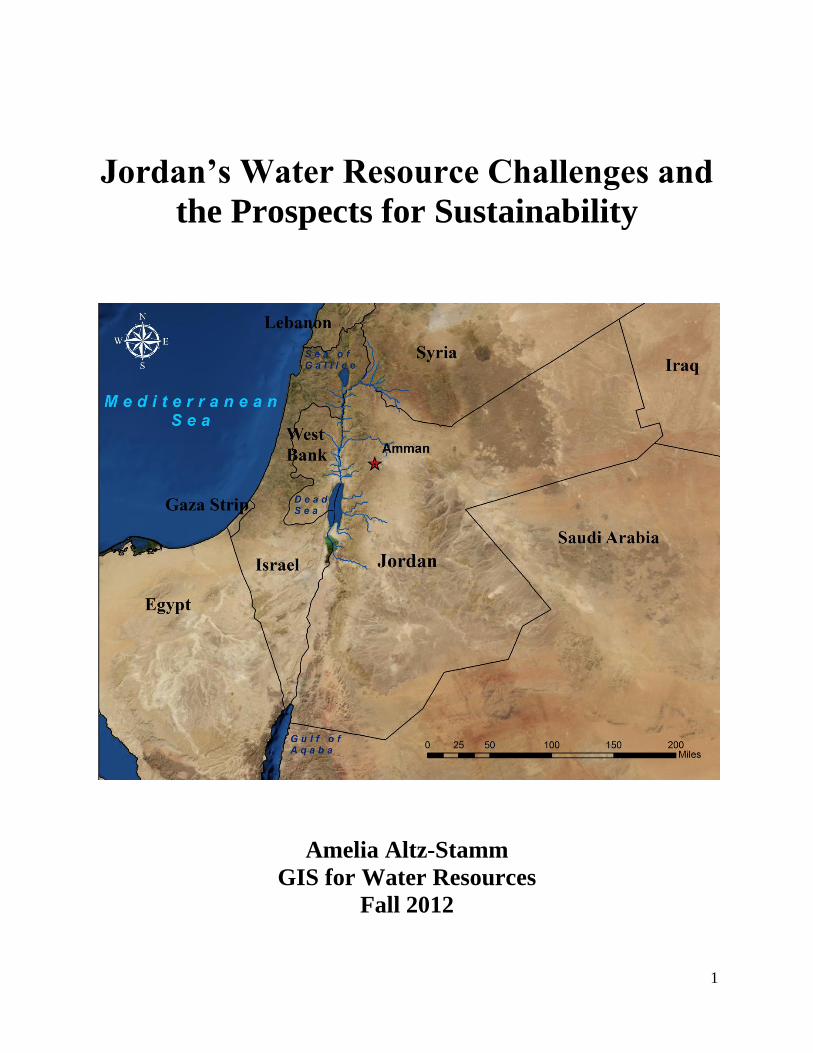
Jordan’s Water Resource Challenges and
the Prospects for Sustainability
Amelia Altz-Stamm
GIS for Water Resources
Fall 2012

2
Introduction
As populations have continued to grow the world over, resources have not. Arguably the
most essential and endangered resource is fresh water and its increasing scarcity has become
more dire with each passing year. The Middle East, in particular, has been confronting a critical
situation with regard to water resources for some time and yet the region still struggles with how
to cope with its dismal lack of fresh water. Populations in the region have more than quadrupled
during the last five decades and are expected to continue to grow at a fast pace. Whereas the per
capita share of renewable water resources in the region was 1,857 m3 per year in 1967, it is now
less than 566 m3 and falling (ESCWA, 2011). In a region already rife with security concerns,
destabilization, and the current and continuing revolutions originating from the Arab Spring, the
maintenance and protection of water resources continues to compete for the attention of national
leaders.
Within this regional setting, Jordan is a prime country to examine due to its even more
dire lack of fresh water resources as compared with its regional neighbors that are more blessed
with water or have the wealth to create it with desalination technology. Jordan is considered the
fourth driest country in the world, which is not surprising due to the desert environment that
encompasses 92% of its land area (Denny et al., 2008). Its per capita share of renewable water
resources is just 140 m3 per year, which is expected to fall to 90 m
3 per year by the year 2025
(Nortcliff et al., 2008). This is significantly lower than the standard “water poverty line” of 500
m3 per person per year (Denny et al.; MWI, 2009) and appears even graver when compared with
an average per capita water availability in the United States of around 9,000 m3 per year
(Aquastat).
In order to better grasp and visualize how Jordan copes with such a poor water situation
and manages to supply its citizens with a sufficient supply of freshwater, Geographic
Information Systems (GIS) is used to map out the country’s water needs, water resources, and
how the needs are met by the resources. This is no small feat in Jordan, where the current water
requirements for agricultural, municipal, industrial and tourist needs amount to 955 million cubic
meters (MCM) per year, whereas the supply of freshwater amounts to only 780-850 MCM per
year (Nortcliff et al.). In addition, it should be noted that the water requirement amount is
actually a bare minimum because water is already rationed and used in a sparing manner.
Unfortunately, the demand on Jordan’s precious water resources will only continue to rise as the
population and its needs continue to grow and develop.

3
Water Demand
Water resources in Jordan are directed towards four different sectors: agriculture,
municipal supplies, industry, and tourism. By far the largest user of the country’s water
resources is agriculture, which uses roughly 64% of the total water supply, while 30% goes to
municipal uses, 5% for industry, and 1% for tourism. Agriculture in Jordan is concentrated in
two primary regions, the Jordan Valley and the Highlands. Figure 1 shows these farmland areas
(for information on the ArcGIS tools used to create maps in this project, see the Appendix).
While the Jordan Valley is a much smaller area of land, this is where the bulk of the country’s
agricultural production occurs and thus, where most of Jordan’s surface water resources are
directed. In much of the Highlands, water is acquired from rainfall or wells.
Figure 1: Jordan’s Main Agricultural Regions
What is somewhat problematic about agricultural production in Jordan is that while it
uses 64% of the country’s available water resources, this sector only adds around 3% to Jordan’s
gross domestic product (MWI). At the same time, the agricultural sector does indirectly
contribute to other aspects of the Jordanian economy within agricultural support services, and it
ensures part of Jordan’s food security and generates tax revenue (Courcier et al., 2005; Nortcliff
et al.). The answer is not necessarily to take all of the water away from the agricultural sector
and put it to more lucrative use elsewhere but rather, this is a signal that demand from agriculture
does need to be attended to and better-managed. Fortunately, Jordan is increasingly looking

4
towards demand management strategies for agriculture, such as better irrigation design and
management, which can lead to more efficient and effective use of its diminishing water supply.
As stated above, the second largest water-consuming sector is the municipal sector,
which accounts for 30% of the country’s water supply and is concerned with people’s daily use
of water in their homes and businesses. These municipal needs, as well as Jordan’s smaller
industrial water needs, are concentrated in the larger population centers in the northwest of the
country. Figure 2 shows these population centers by city and by governorate, as well as non-
labeled smaller circles for the locations of other small towns. What should be noted is that the
capital, Amman, and its surrounding cities use the bulk of the water resources for municipal
purposes, as can be surmised from the larger population in this area. Because of the importance
of Amman as Jordan’s largest and most-populated city, water rationing typically favors it above
all other cities and uses in the country.
Figure 2: Jordan’s Major Population Centers as Represented in Large City and
Governorate Populations.
While Jordan’s population is expected to continue growing as a result of an increase in
the indigenous population, it has also seen and continues to see growth due to the influx of
multiple waves of refugees seeking a safe haven within its borders. This is shown below in
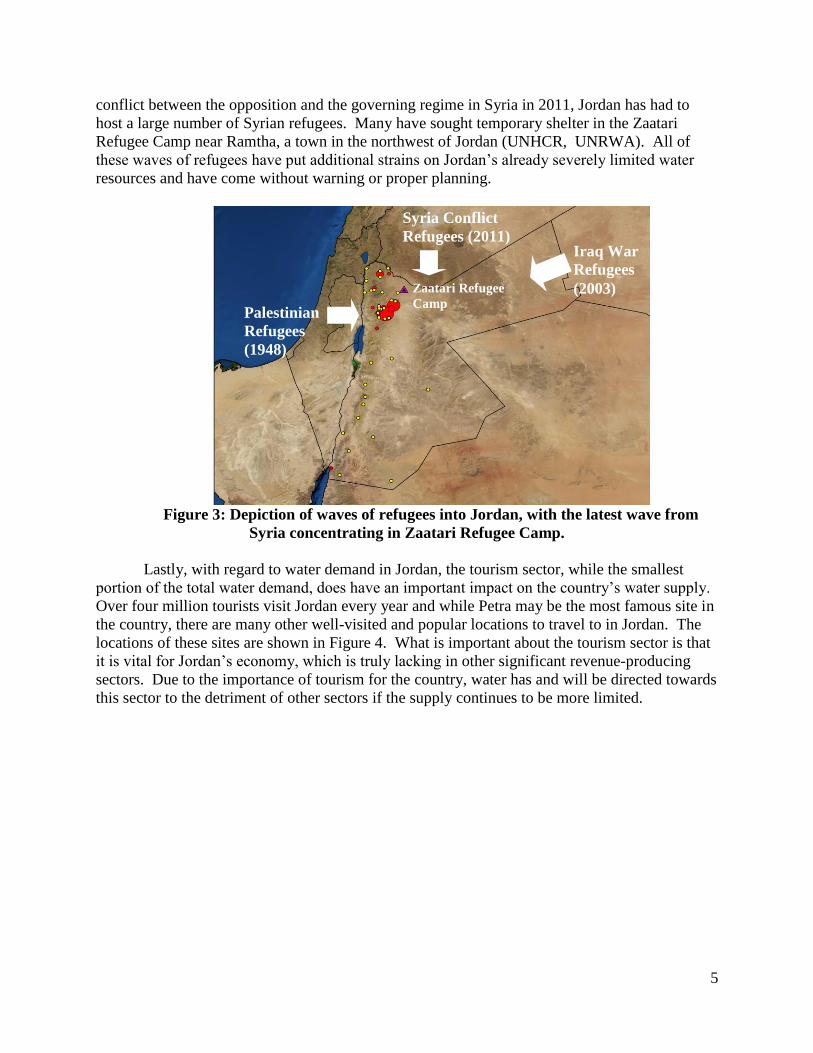
Figure 3. In 1948, during the fighting between what would become Israel and the Palestinians,
anywhere from 500,000 to 1,000,000 Palestinians fled their lands and a large portion of them
arrived in Jordan. In subsequent fighting between Israel and the Palestinians, further waves of
Palestinians fled to Jordan. To this day, roughly 1,983,733 Palestinian refugees remain in
Jordan. During the Iraq War that started in 2003, large numbers of Iraqis sought refuge in Jordan
and roughly 451,700 remain settled in Jordan today. Most recently, since the beginning of the
5
conflict between the opposition and the governing regime in Syria in 2011, Jordan has had to
host a large number of Syrian refugees. Many have sought temporary shelter in the Zaatari
Refugee Camp near Ramtha, a town in the northwest of Jordan (UNHCR, UNRWA). All of
these waves of refugees have put additional strains on Jordan’s already severely limited water
resources and have come without warning or proper planning.
Figure 3: Depiction of waves of refugees into Jordan, with the latest wave from
Syria concentrating in Zaatari Refugee Camp.
Lastly, with regard to water demand in Jordan, the tourism sector, while the smallest
portion of the total water demand, does have an important impact on the country’s water supply.
Over four million tourists visit Jordan every year and while Petra may be the most famous site in
the country, there are many other well-visited and popular locations to travel to in Jordan. The
locations of these sites are shown in Figure 4. What is important about the tourism sector is that
it is vital for Jordan’s economy, which is truly lacking in other significant revenue-producing
sectors. Due to the importance of tourism for the country, water has and will be directed towards
this sector to the detriment of other sectors if the supply continues to be more limited.
Zaatari Refugee
Camp
Iraq War
Refugees
(2003)
Palestinian
Refugees
(1948)
Syria Conflict
Refugees (2011)

6
Figure 4: Locations of major tourist destinations in Jordan.
Water Supply
After accounting for the water users in Jordan, a look to the country’s water supply is
needed in order to see how the demand is met. Jordan’s conventional, or natural, water resources
originate in rainfall, ground waters, and surface waters. The country has developed various ways
in which to capture, store and distribute these waters, and it has developed some unconventional
water resources such as treated wastewater. GIS can aid in the visualization of the location of
these resources, their breadth and the difficulties faced in making them reach end users.
Eastern Castles
Wadi Rum Aqaba
Petra
Showbak Castle
Karak Castle
Mt.
Nebo
Dead
Sea
Amman
Umm Qais Jerash
Pella
Ajloun Castle

7
Annual rainfall for the country at-large is estimated at 266 millimeters (mm) per year but
this does vary within different regions of the country. Some areas in the northwest area of
Jordan can receive as much as 600 mm of rain per year, while sections of the southern and
eastern desert areas receive only around 50 mm per year. It is further posited that 92% of the
rainfall evaporates into the atmosphere (JVA, 2011), leaving the country with an even more
meager share of rainfall. In Figure 5, average rainfall amounts per month are shown. As can be
seen, rainfall is a seasonal affair, typically falling between the months of November and April,
with the rest of the months witnessing almost no rain at all. Rainfall is the only source of
recharge for the country’s groundwater aquifers so its potential decline in the coming years could
pose a significant problem for Jordan (Nortcliff et al.).
January February March April
May June July August
September October November December
Rainfall (mm):
Figure 5: Average monthly rainfall in millimeters in Jordan.
As for Jordan’s groundwater resources, they account for roughly 54% of the total water
supply in the country. There are 12 major basins as seen in Figure 6, along with each basin’s
annual safe yield in MCM. The total safe yield of all of the basins is estimated at 275 MCM per
year, whereas yearly abstraction can be upwards of 473 MCM. This over-abstraction has been
due to the lax enforcement of well drilling regulations and the lack of control on licensed
abstraction rates. In turn, this over-abstraction has lowered the water table a significant amount
and has increased pumping costs (MWI; Al-Halasah and Ammary, 2006). What is more, the
quality of the water in these basins has declined a significant amount due to the overuse of

8
pesticides and insecticides in agriculture, improper disposal of industrial waste, leakage from
landfills and septic tanks, and the general pollution that comes from a burgeoning population
with incomplete wastewater systems (MWI).
Figure 6: Groundwater Basins in Jordan and their annual safe yield in million cubic
meters.
Sometime in early 2013, enhanced abstraction of groundwater from the Disi Aquifer,
located in the south of Jordan, is scheduled to begin and provide Amman with an initial volume
of 80 MCM of additional fresh water per year (Al-Halasah and Ammary). Even this amount,
though, will not be enough to meet all of Jordan’s water needs. Furthermore, due to the remote
location of the aquifer relative to Amman, the pumping costs over land, as well as the up-front
investment costs of devising an extraction system and pumping the water out of the ground, will
make this new water resource more expensive. Users will be asked to pay some of these
expenses and this will likely not be a welcomed and easily accepted cost.

9
Surface waters in Jordan supply roughly 37% of the total water supply. Figure 7 shows
the flow accumulation lines in blue against a backdrop of the elevation map of Jordan. Because
rainfall is concentrated in the northwest of the country, and due to the flow of much of Jordan’s
surface water originating in Syria or Israel, the actual surface flow accumulation is solely within
the northwest of the country, as shown with the area surrounded by a red box.
Figure 7: Flow accumulation lines on a raster map of Jordan showing elevation.
The major suppliers of surface water in Jordan are the Yarmouk, Jordan and Zarqa
Rivers, as well as what is accumulated in side wadis, or valleys, within seasonal streams. Figure
8 shows these waterways, with rivers in dark blue and seasonal streams in light blue.
Area of Actual
Surface Flow

10
Figure 8: Jordan’s surface waters as present in rivers and streams.
The Yarmouk River originates in Syria, flows along the Syria-Jordan border, and then
dumps into the Lower Jordan River. Its historic flow was estimated at 480 MCM per year but
now it is only 171 MCM per year. As for the Lower Jordan River, its waters come from the
Upper Jordan River, whose tributaries come from the Golan Heights and Lebanon and then run
through Israel to the Sea of Galilee, as well as from the Yarmouk River. Its historic flow was
around 1300 MCM per year and has sadly dropped 98% to 20-30 MCM per year today due to the
consumption of the majority of its natural flow from its upstream tributaries (Gafry et al., 2010;
Suleiman, 2003; Courcier et al., 2005). Both the Jordan and Yarmouk Rivers are international
waterways shared with Israel and Syria and are thus vulnerable to the diversions and dams that
those two countries have constructed along their flows. Despite international treaties with regard
to the use of these waters, Jordan, as the downstream riparian, is still constrained in its ability to
acquire more of their flows.
The Zarqa River is mainly the product of seasonal rainfall as well as treated wastewater,
which will be discussed shortly. Due to its proximity to the major population centers in and
around Amman, it suffers from severe pollution. In addition to these rivers, as mentioned above,
rainfall is also collected in side valleys that create seasonal streams running into the Jordan
Valley. These streams are in turn exploited by man-made structures, as discussed in the next
section.

11
Harnessing and Enhancing the Supply to Meet the Demand
In order to make the supply meet the demand in Jordan, measures have been taken to
ensure that water reaches its users. This happens in a variety of ways with the use of dams,
canals, pipelines and treated wastewater. While the use of wells cannot be displayed in map
form as the following ways will be displayed, due to a lack of mapping information on the
location of Jordan’s myriad public and private wells, it should be remembered that a great deal of
water is supplied through the drilling and use of wells. With regard to the above-mentioned
seasonal streams in the side valleys, as well as along the Yarmouk River and the Zarqa River,
Jordan has built ten dams. Figure 9 shows the location of these dams and the accompanying
table lists their potential annual water storage volume. The actual water storage is, of course,
dependent on rainfall. These dams, or reservoirs, capture, store and regulate water flow in order
to better-supply end users in the most efficient manner.
Dam Storage (MCM/year)
Unity Dam 110.0
Wadi Arab 17.0
Ziglab 3.8
King Talal 75.0
Karama 55.0
Shueib 1.4
Kafrein 8.4
Waleh 9.3
Mujib 35.0
Tannour 16.8
Total 331.7
Figure 9: Dams along rivers and side valleys in Jordan, along with their annual storage
capacity in MCM per year.

12
In addition, the King Abdullah Canal (KAC) was built in several waves from the 1960s to
the 1980s and now runs the length of the Jordan Valley for some 110 kilometers. Figure 10
shows the path of the KAC in red. Roughly 110 MCM per year of water is pumped from the
Yarmouk River and nearby wells into the KAC and it has served as the major water supplier for
agriculture in the Jordan Valley, thus representing the backbone of irrigated agriculture.
Increasingly, though, irrigated agriculture is using other water supplies, such as treated
wastewater, and more water from the canal is being transferred to Amman for municipal use, as
discussed in the sections below.
Figure 10: The King Abdullah Canal that runs along the Jordan Valley.
King Abdullah Canal

13
With regard to the water transfer to Amman, the water’s path through above-ground
pipelines is shown in Figure 11 by the white arrows. The water is first pumped from the KAC to
the Zai Water Treatment Plant, which involves pumping it from 200 meters below sea level to
880 meters above sea level, as seen in the elevation profile in Figure 12. The treated water is
then pumped to the Dabouq Holding tank at 1035 meters above sea level, again represented in
Figure 12. Finally, gravity aids the water in its distribution to homes and businesses in Amman
and surrounding population centers, although additional pumping is needed throughout this hilly
area to reach its final destinations.
Figure 11: The path of water being transferred from the KAC to the Zai Water Treatment
Plant, then to the Dabouq Holding Station, and then on to the population centers of
Amman and one of its largest suburbs, Zarqa.
Figure 12: Rough charts of the elevation gain from the KAC to the Zai Water Treatment
Plant and from the Zai Water Treatment Plant to the Dabouq Holding Station in meters.
Amman
Zarqa
Zai Water Treatment
Plant
Dabouq Holding
Station
King Abdullah Canal
Jordan
River

14
Another way in which Jordan is able to supply additional sources of water is through the
use of treated wastewater. It should be noted at the outset, though, that treated wastewater is
only consumed by the agricultural sector as many fears still exist of its use in the municipal
sector. In total, about 62% of the population in the Amman-Zarqa area is serviced with sewerage
systems that produce about 100 MCM of effluent. This wastewater is sent to the Khibrat as-
Samra treatment plant outside of the city of Zarqa, as seen in Figure 13. After treatment in the
plant, the water is released into the Zarqa River bed and flows to the King Talal Dam. The water
is held for a time in the dam to further cleanse it through retention time and then it is finally
released and travels the rest of the distance to the Jordan Valley. Treated wastewater supplies
around 50% of Jordan’s cultivated lands in the Jordan Valley, predominantly in the southern and
middle sections. It is hoped that by the year 2022, the supply of treated wastewater will amount
to 256 MCM per year (MWI).
Figure 13: Treated wastewater is collected in Amman and Zarqa and sent to Khirbet as-
Samra Treatment Plant, then travels along the Zarqa Riverbed to the King Talal Dam and
on to the Jordan Valley.
There are other smaller wastewater treatment facilities in Jordan that serve the same
purpose and it is hoped that these plants will also be increasing their production in the coming
years. This will aid in releasing yet more water from the agricultural sector to the municipal
sector. It is expected that treated wastewater can supply all of Jordan’s agricultural needs in the
future if production continues to increase. Also, there is continuing discussion and attempts to
Khirbet as-Samra
Treatment Plant King Talal Dam
Amman
Zarqa
Middle and
Southern
Sections of
Jordan Valley
Agricultural
Lands
(Wastewater
Collected)
Zarqa River

15
use additional nonconventional sources of water, such as capturing rainwater, importing water
from neighboring countries, desalinating brackish water, and desalinating seawater (Tarawneh,
2008).
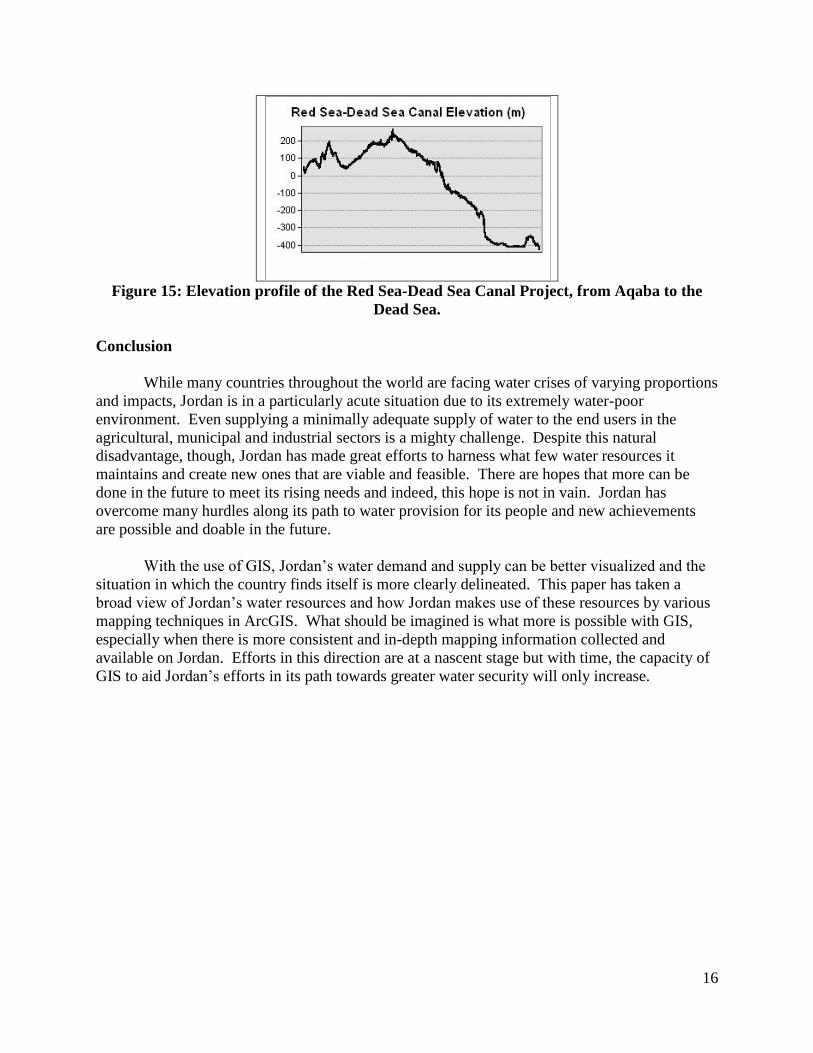
With regard to the last item on that list, the desalination of seawater, the largest and
potentially most impactful project is that of the Red Sea-Dead Sea Canal Project. The proposed
path of the pipeline from Aqaba, at the Red Sea, to the Dead Sea is shown in Figure 14 by the
yellow line. Seawater would be pumped from sea level at Aqaba, up 230 meters in order to cross
over the mountains in its path, and then down to 420 meters below sea level to the Dead Sea.
This elevation profile is shown in Figure 15. The downward flow of water would be used to
generate hydropower, which would partially or wholly provide the energy to desalinate the
seawater for consumption in Amman and surrounding population centers. The excess saltwater
could be pumped into the Dead Sea to reverse its shrinking surface that currently drops by one
meter every year. This project has the potential to provide an additional 850 MCM per year of
freshwater for municipal uses, which would practically eclipse Jordan’s current total water
supply. Therefore, this project is a very attractive option but its construction has still not begun
due to financial, geopolitical and ecological issues under discussion.
Figure 14: Red Sea-Dead Sea Canal Project pipeline location.
Amman
Zarqa
Red Sea-Dead Sea
Proposed Pipeline
Aqaba
Dead Sea
Freshwater
Saltwater
16
Figure 15: Elevation profile of the Red Sea-Dead Sea Canal Project, from Aqaba to the
Dead Sea.
Conclusion
While many countries throughout the world are facing water crises of varying proportions
and impacts, Jordan is in a particularly acute situation due to its extremely water-poor
environment. Even supplying a minimally adequate supply of water to the end users in the
agricultural, municipal and industrial sectors is a mighty challenge. Despite this natural
disadvantage, though, Jordan has made great efforts to harness what few water resources it
maintains and create new ones that are viable and feasible. There are hopes that more can be
done in the future to meet its rising needs and indeed, this hope is not in vain. Jordan has
overcome many hurdles along its path to water provision for its people and new achievements
are possible and doable in the future.
With the use of GIS, Jordan’s water demand and supply can be better visualized and the
situation in which the country finds itself is more clearly delineated. This paper has taken a
broad view of Jordan’s water resources and how Jordan makes use of these resources by various
mapping techniques in ArcGIS. What should be imagined is what more is possible with GIS,
especially when there is more consistent and in-depth mapping information collected and
available on Jordan. Efforts in this direction are at a nascent stage but with time, the capacity of
GIS to aid Jordan’s efforts in its path towards greater water security will only increase.

17
Appendix
Figure 1: Jordan’s Main Agricultural Regions Farmland areas created by georeferencing a jpeg map that delineated these areas onto the Jordan
base map that was already present in ArcGIS.
Figure 2: Jordan’s Major Population Centers as Represented in Large City and
Governorate Populations.
This map was created by geocoding Jordan’s larger cities, indicated by the red circles, as well as
the smaller cities, indicated by the unnamed and smaller circles. Population values were added
to ArcGIS in a table and then joined to the geocoded cities. Proportional symbols were used for
the larger cities and the smaller cities were simply indicated with plain circles. The governorates
shapefile was superimposed on the Jordan base map and their population numbers were also
added to ArcGIS by a table and then joined to the governorates shapefile. Graduated colors were
used to display the differing population amounts by governorate.
Figure 3: Depiction of waves of refugees into Jordan, with the latest wave from Syria
concentrating in Zaatari Refugee Camp.
Zaatari Refugee Camp’s location was geocoded from its latitude and longitude and the other
unlabeled cities were mapped as in Figure 2.
Figure 4: Locations of major tourist destinations in Jordan.
Tourist destinations geocoded from their latitude and longitude.
Figure 5: Average monthly rainfall in millimeters in Jordan.
Rainfall data was found as 30 arc-second ESRI grids, overlaid onto the base map with delineated
countries, and changed from stretched to classified symbology in order to obtain clearer
demarcations of rainfall for presentation purposes.
Figure 6: Groundwater Basins in Jordan and their annual safe yield in million cubic
meters.
Basins were originally depicted in a jpeg image and were then georeferenced in ArcGIS.
Figure 7: Flow accumulation lines on a raster map of Jordan showing elevation.
The elevation map was created from 1-second DEMs obtained from NASA’s LP DAAC. Due to
the difficulty in getting these raster data through the steps from raster to flow accumulation, the
USGS HydroSHEDs 15-second flow accumulation DEMs were used to delineate where streams
and rivers would flow if rainfall fell with more frequency, as depicted by the blue lines on the
map.
Figure 8: Jordan’s surface waters as present in rivers and streams.
The specific stream links were manually selected with the use of a query in order to show only
those areas that truly witness surface flow.

18
Figure 9: Dams along rivers and side valleys in Jordan, along with their annual storage
capacity in MCM per year.
Locations of dams were manually found on the ArcGIS base map and plotted as points and re-
symbolized. The side wadi streams and the rivers were mapped as in Figure 8.
Figure 10: The King Abdullah Canal that runs along the Jordan Valley.
The King Abdullah Canal was manually drawn on the map by sight from the ArcGIS
topographic base map, which was necessary due to the lack of a GIS shapefile for the KAC.
Figure 11: The path of water being transferred from the KAC to the Zai Water Treatment
Plant, then to the Dabouq Holding Station, and then on to the population centers of
Amman and one of its largest suburbs, Zarqa.
City and plant locations on the map were geocoded from their latitude and longitudes.
Figure 12: Rough charts of the elevation gain from the KAC to the Zai Water Treatment
Plant and from the Zai Water Treatment Plant to the Dabouq Holding Station in meters.
Elevation profiles created with ArcGIS interpolation tools.
Figure 13: Treated wastewater is collected in Amman and Zarqa and sent to Khirbet as-
Samra Treatment Plant, then travels along the Zarqa Riverbed to the King Talal Dam and
on to the Jordan Valley.
Locations on the map were once again geocoded from latitudes and longitudes.
Figure 14: Red Sea-Dead Sea Canal Project pipeline location.
Due to the lack of GIS data for this pipeline, it was drawn by sight and therefore represents a
rough estimate of its future location, which is also still being debated.
Figure 15: Elevation profile of the Red Sea-Dead Sea Canal Project, from Aqaba to the
Dead Sea.
Elevation profile created with ArcGIS interpolation tools.
19
Bibliography
Al-Halasah, N.K., Ammary, B.Y. (2006) “Water Resources Policy and Management in Jordan.”
In Hlavinek, P. et al., eds. Integrated Urban Water Resources Management. Springer: The
Netherlands.
Courcier, R., et al. (2005) Historical Transformations of the Lower Jordan Rriver Basin (in
Jordan): Changes in Water Use and Projections (1950-2025). Comprehensive Assessment
Research Report 9. Colombo, Sri Lanka: Comprehensive Assessment Secretariat.
Dai, A., Qian, T., Trenberth, K.E., Milliman, J.D. (2009) “Changes in continental freshwater
discharge from 1948-2004.” Journal of Climate 22: 2773-2791.
Denny, E., Donnelly, K., McKay, R., Ponte, G., Uetake, T. (2008) Sustainable Water Strategies
for Jordan. International Economic Development Program, Gerald R. Ford School of Public
Policy, University of Michigan, Ann Arbor.
Gafny, S., et al. (2010) Towards a Living Jordan River: An Environmental Flows Report on the
Rehabilitation of the Lower Jordan River. Amman: Friends of the Earth Middle East.
Jordan Ministry of Water and Irrigation (MWI). (2009) Water for Life: Jordan’s Water Strategy,
2008-2022.
Jordan Valley Authority (JVA). (2011) Powerpoint Presentation from the JVA Office in Deir
Alla, Jordan Valley.
Meyer-Christoffer, A., Becker, A., Finger, P., Rudolf, B., Schneider, U., Ziese, M. (2011) GPCC
Climatology Version 2011 at 0.25°: Monthly Land-Surface Precipitation Climatology for Every
Month and the Total Year from Rain-Gauges built on GTS-based and Historic Data.
DOI: 10.5676/DWD_GPCC/CLIM_M_V2011_025.
Mohsen, M.S. (2007) “Water strategies and potential of desalination in Jordan.” Desalination
203: 27-46.
Molle, F., Venot, J.-P., Youssef, H. (2008) “Irrigation in the Jordan Valley: Are water pricing
policies overly optimistic?” Agricultural Water Management 95: 427-438.
NASA Land Processes Distributed Active Archive Center (LP DAAC). ASTER L1B.
USGS/Earth Resources Observation and Science (EROS) Center, Sioux Falls, South Dakota.
2001.
Nortcliff, S., Carr, G., Potter, R.B., Darmame, K. (2008) “Jordan’s Water Resources: Challenges
for the Future.” Geographical Paper No. 185, The University of Reading, United Kingdom.

20
Suleiman, R. (2003) The Historical Evolution of the Water Resources Development in the Jordan
River Basin in Jordan. International Water Management Institute and Mission Régionale Eau et
Agriculture.
Tarawneh, Z.S., Hadadin, N.A., Bdour, A.N. (2008) “Policies to Enhance Water Sector in
Jordan.” American Journal of Applied Sciences 5(6): 698-704.
United Nations Economic and Social Commission for Western Asia. (2011) Water Development
Report 4: National Capacities for the Management of Shared Water Resources in ESCWA
Member Countries. United Nations: New York.
United Nations Economic and Social Commission for Western Asia. (2009) Sustainable Water
Supply and Sanitation for All: Regional Assessment Report on the Status and Achievements of
ESCWA Member Countries Towards Improved Water Supply and Sanitation. United Nations:
New York.
Van Aken, M., Courcier, R.. Venot, J.-P., Molle, F. (2007) Historical Trajectory of a River
Basin in the Middle East: The Lower Jordan River Basin (in Jordan). International Water
Management Institute and French Regional Mission for Water and Agriculture, Amman.
Venot, J.-P., Molle, F., Courcier, R. (2008) “Dealing with Closed Basins: The Case of the Lower
Jordan River Basin.” International Journal of Water Resources Development 24(2): 247-263.
Websites:
CityPopulation. http://www.citypopulation.de/Jordan.html.
Jordan Department of Statistics http://www.dos.gov.jo/.
Miyahuna. www.miyahuna.com.jo.
NationMaster. www.nationmaster.com.
Palestinian Refugee ResearchNet. http://prrn.mcgill.ca/.
Umm el-Jimal Project. http://ummeljimal.org/en/gis.html.
United Nations High Commissioner for Refugees. http://www.unhcr.org/.
United Nations Relief and Works Agency. http://www.unrwa.org/.
United States Geological Survey. HydroSHEDS. http://hydrosheds.cr.usgs.gov/.
WorldClim. Global Climate Data. http://www.worldclim.org/current.