the archipelago economy - kjri hamburg · confidential and proprietary any use of this material...
TRANSCRIPT

CONFIDENTIAL AND PROPRIETARY
Any use of this material without specific permission of McKinsey & Company is strictly prohibited
The Archipelago Economy:
2015 Outlook and Beyond
June 2015
CONFIDENTIAL AND PROPRIETARY
Any use of this material without specific permission of McKinsey & Company is strictly prohibited

McKinsey & Company | 1
3.4
2.1
2.1
2.0
2.0
2.0
1.8
1.8
1.8
1.7
1.7
1.6
1.6
1.5
0.9
0.9
India
Canada
Switzerland
Belgium
New Zealand
France
Norway
Portugal
Australia
Indonesia
China
Poland
South Korea
Average rest
United States
Netherlands
SOURCE: Conference Board Total Economy Database; International Monetary Fund; World Bank; McKinsey Global
Institute analysis
Contrary to most belief, Indonesia has demonstrated consistent growth for
the past decade
3.1
Czech Republic
4.0
South Korea 4.2
Slovakia 4.9
Russia
3.7
Estonia 3.8
Poland 3.9
Turkey
Average rest
Australia 3.1
Israel
1.7
4.9
Indonesia 5.2
India 7.7
China
3.4
South Africa 3.5
Brazil 3.6
Chile
11.5
GDP growth, standard deviation,
annualised, 2000-10 Real GDP growth, 2000-10
Overview of OECD and BRIC plus South Africa development
Percent
▪ Strengthening overall
macroeconomics: lowering
government debt/GDP,
containing inflation, etc.
▪ Not only driven by more
labor input, but also
productivity though still a lot
of room to catch-up
▪ Not only due to resources,
sectors such as retail trade,
transport, and
telecommunications growing
fast
▪ Not only centered in
Jakarta: other areas growing
fast, albeit from a smaller base
Other highlights of Indonesia’s
development

McKinsey & Company | 2
Indonesia is the 16th-largest economy in the world, and has the potential
to be the seventh largest by 2030
SOURCE: McKinsey Global Institute
7th largest economy in the world 16th largest economy in the world
135 million members of the consuming
class
45 million members of the consuming
class
71% of population in cities producing
86% of GDP
53% of population in cities producing
74% of GDP
113 million skilled workers needed 55 million skilled workers
$1.8 trillion market opportunity in
consumer services, agriculture and fisheries,
resources, and education
$0.5 trillion market opportunity in
consumer services, agriculture and
fisheries, resources, and education
INDONESIA TODAY … AND IN 2030

McKinsey & Company | 3
Exports
USD million, monthly
50
100
150
200
250
300
350
400
2015 2014 2013
Indonesia
Thailand Vietnam
Philippines
Singapore
Malaysia
SOURCE: Haver Analytics; McKinsey's Global Economics Intelligence analysis
2015 is a tough year for ASEAN – exports declining due to sluggish
demand and weak commodity price
Price of crude oil
Price of crude palm oil
Price of coal
0
50
100
150
2010 2012 2013 2015 2011 2014
USD/bbl, monthly
0
50
100
150
2014 2011 2010 2013 2015 2012
USD/tonnes, monthly
0
500
1,000
1,500
2013 2011 2010 2014 2012 2015
USD/mt, monthly
McKinsey & Company | 4
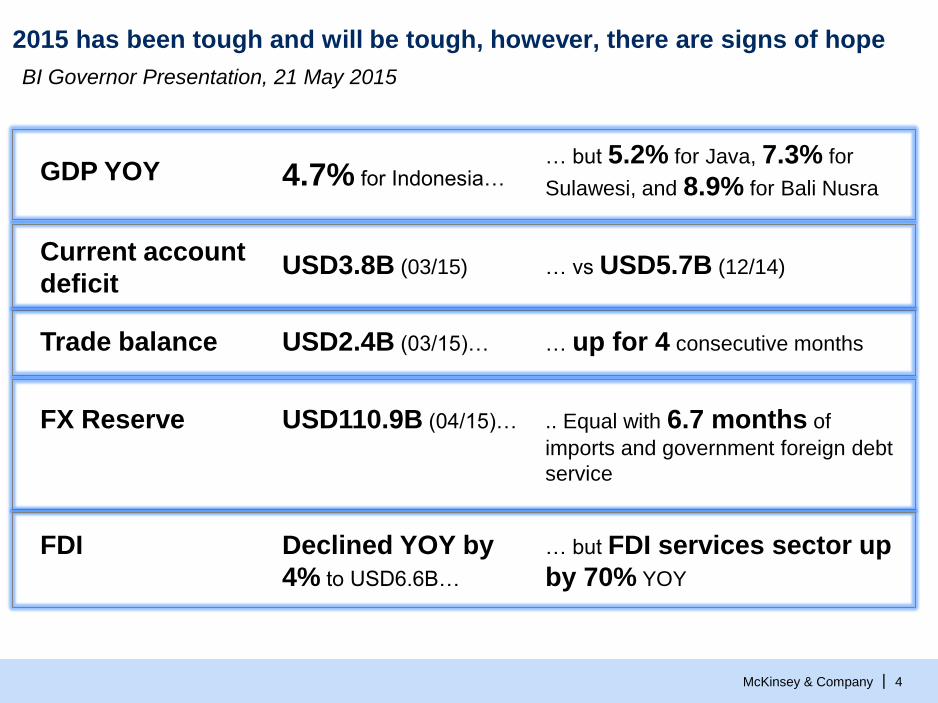
2015 has been tough and will be tough, however, there are signs of hope
FX Reserve
GDP YOY
USD110.9B (04/15)…
4.7% for Indonesia…
.. Equal with 6.7 months of
imports and government foreign debt
service
… but 5.2% for Java, 7.3% for
Sulawesi, and 8.9% for Bali Nusra
Trade balance USD2.4B (03/15)… … up for 4 consecutive months
Current account
deficit USD3.8B (03/15) … vs USD5.7B (12/14)
FDI Declined YOY by
4% to USD6.6B…
… but FDI services sector up
by 70% YOY
BI Governor Presentation, 21 May 2015

McKinsey & Company | 5
Indonesia has a number of opportunities and strengths going in the long
run, but GoI must continue effort to boost sustainable growth
Boosting productivity
Ensuring inclusive growth
Building resilience
Productivity still lags peer countries
USD 6k GDP per person, versus
14k in Malaysia
Unequal growth, rising
inequality – life expectancy in
Yogyakarta is 15 years more
than in West Nusa Tenggara
Rising consuming class
Young population till 2025/30
offers a one-off unique chance to
exploit demographic dividend
Untapped resource potential
Increasing urbanization – 9% p.a.
GDP growth for large middle
weight cities to 2030
Exploiting opportunities
Technologically savvy population –
324m mobile and 93m Internet
users in 2015
Benefitting from inherent strengths
Resource – intensive growth will
pose supply challenges – energy,
food, water
Volatility of world economy
Indonesia
2030
Top 10
economy
SOURCE: McKinsey Global Institute

McKinsey & Company | 6
Indonesia would have ~74 million households in consuming class
by 2030 Consuming class households, 2013–301
Million
SOURCE: McKinsey Global Institute Cityscope database; national statistics offices; McKinsey Global Institute analysis
1 Defined as households with more than $7,500 in annual income (in 2005 purchasing power parity terms). This is the income level at which households
begin to make significant discretionary purchases; Brunei not shown on chart as number of consuming class households in 2030 is only ~0.1 million.
1
1
1
6
3
13
10
11
34
1
2
3
9
9
20
21
23
Laos
Singapore
Cambodia
Malaysia
Vietnam
Myanmar
Philippines
Thailand
Indonesia 74
2030
2013
THE RISE OF ASIA

La
st M
od
ified
5/2
7/2
01
5 1
:33
PM
SE
Asia
Sta
nd
ard
Tim
e
Prin
ted
5/2
6/2
01
5 1
2:2
9 P
M S
E A
sia
Sta
nd
ard
Tim
e
Different regions expected to continue growing – many fast
growing cities are outside Java
SOURCE: 2010 Population Census, Indonesia’s Central Bureau of Statistics; McKinsey Global Institute analysis
Small middleweights
(150,000–2 million)
Large middleweights
(5 million-10 million)
Type of urban area1
1 Urban areas are aggregated areas consisting of cities (kota) and districts (kapupaten) rather than specific city jurisdictions,
GDP compound annual
growth rate, 2010-30 (%)
Less than 5 percent
5 to 7 percent
More than 7 percent
Mid-size middleweights
(2 million–5 million)
Jakarta >10 million
Sumatra
Kalimantan
Java
Sulawesi
Papua
Nusa Tenggara Bali
Maluku
GDP development, 2010-30
INHERENT STRENGTH

McKinsey & Company | 8
2.4
2.9
4.6
7.0
60%
Historical labour
productivity
growth, 2000–
102
Required growth
from labour
productivity,
2010–30
Expected growth
from increased
labour inputs1
GDP growth
target
Achieving Indonesia’s 7 percent annual GDP growth target will require
labour productivity to grow 60 percent faster, in a way that is different
SOURCE: CEIC Data; Indonesia’s Central Bureau of Statistics; Conference Board Total Economy Database; International
Monetary Fund; United Nations Population Division; McKinsey Global Institute analysis
1 Driven by additional workers joining the work force due to demographics and increased participation in work force; productivity assumed to be the
average in 2010–30 based on a business-as-usual growth rate of 5 to 6 percent.
2 Based on an average among national and international data sources.
Annual real GDP growth rates
Percent
Indonesia needs to
boost
productivity in
a way that is
inclusive to the
archipelago, and
resilience to
external shocks and
volatility

McKinsey & Company | 9
Required infrastructure and real estate investment, 2014–301
$ trillion
Infrastructure is one of the key to resolving these challenges: Indonesia
would need investment of ~$2.8 trillion till 2030 in infra and real estate
Transport
Water
Power
Telecom
Commercial
real estate
Residential
real estate
Total
investment
7.0
1.2
1.0
0.6
0.6
0.5
3.1
Others2
0.5
Vietnam
0.7
Singapore
0.7
Malaysia
0.7
Thailand
0.8
Philippines
0.9
Indonesia
2.7
1 In 2013 real dollar terms.
2 Includes Brunei, Cambodia, Laos, and Myanmar.
NOTE: Numbers may not sum due to rounding.
SOURCE: Pike Research; IHS; McKinsey Global Institute analysis

McKinsey & Company | 10 SOURCE: Bank of Indonesia presentation
Government of Indonesia has made infrastructure development a priority
More than 60%
increase in
infrastructure spend
allocation in 2015
revised budget
Acceleration of
execution required
in 2015

McKinsey & Company | 11
With maritime logistic being the focus of the new government for
productivity reform, there can be step change in productivity impact
INFRASTRUCTURE – MARITIME LOGISTIC
2012 current network is point to point with 4 major hubs
Optimized network based on port performance aspirations and
cost-minimization has transshipments and features sub-hubs
SOURCE: MOT, Tg Priok O&D, World Fleet Register Report, Network model output, Team analysis
5,000TEU Major ports
Major regional ports
Current
network
Improved handling
& Cost optimization
41%
0%
274
67%
11%
121
Trans-
shipments
Vessel
utilization
Number of
vessels
Avg vessel
size, TEU ~700 ~1,500
Cost per
TEU, USD 366 191
48%

McKinsey & Company | 12
Shipping
industry
Supporting
industries1
Port industry
The Maritime Logistics study proposes 11 reforms to tackle the challenges
faced today and transform Indonesia in a leading maritime nation
SOURCE: Team analysis
1 Trucking, Logistics centers/ICD, FF and 3PL, Education
3PL Cross cutting themes
▪ National regulatory
reform needed for:
– Harmonization of
regulation across
institutions and regions,
e.g. imports, trucking
circulation
– Investment incentives
▪ Education system will
need to increase
capacity and attract
talents both at sea and
ground
▪ World-class port
operations – incl.
24/7 operations of key
services (e.g. banks,
customs) & provision of
vital supplies (e.g., fuel,
power)
▪ Reducing dwelling
time through:
– Streamlined import
process /better
agency coordination
– Port tariff to reduce
storage at CY
▪ Staged invest-
ments for dredging
or construction of new
sea ports
▪ Acceleration of
implementation of
landlord & concession
models
▪ Improvements in
shipping navigation,
classification, security,
and safety systems
▪ Investments in
– Vessel fleet
– Dockyards
▪ More professionali-
zation and coordina-
tion with ports
– Berth window
– Cut-offs
– Stowage/CWP
▪ Hard land
infrastructure
(logistics centers and
ICDs) and connectivity
to port (e.g. inland
waterways, roads etc)
▪ Professionali-
zation and coor-
dination is required, e.g.
– Choice of network by
FF
– trucking backhaul
utilization
– Warehousing
8 10 1 5
3
4
9
11
2
7
6 $$
Focus today

McKinsey & Company | 13
In summary…
▪ Indonesia has demonstrated consistent growth over the past decade, fueled by strong
fundamentals. We believe that it has the potential to be the top 10 economy in the world in
2030
▪ 2015 is a tough year for ASEAN, and for Indonesia:
– Weak demand and weak commodity price
– Growth projected to slow down to 4.7%, FDI slows down, deficit in current account remains
– Some glimmers of hope, e.g. 70% increase FDI in service sector, trade balance surplus for
four months in a row, inflation under control
▪ There are, however, reasons to be bullish for the long term growth
• Growth of consuming class and young population
• Inherent strengths in natural resources
• Productivity growth must be inclusive and resilience; GoI has recognized this
priority and made conscious effort towards resolving infrastructure, one of the keys for
sustainable productivity
• Recognition that maritime plays a big role in infrastructure – optimized network can
reduce logistic costs by almost half. This effort, however, required movements across port
and adjacent sectors.
• Indonesia is still volatile, however, strong fundamentals say that it remains attractive market.
Thus, to do business in the country means to look for impact beyond profit/return in the
short-term. It means to look for partnership for the long term value creation.
1
3