the attitudes towards loss of hearing questionnaire … jacobs* abstract ... alexander, 1999; client...
TRANSCRIPT
J Am Acad Audiol 18:66–77 (2007)
66
*National Center for Rehabilitative Auditory Research, Portland VA Medical Center, Portland, OR
Gabrielle H. Saunders, National Center for Rehabilitative Auditory Research, Portland VA Medical Center, 3710 SW US VeteransHospital Road, Portland, OR 97213; Phone: 503-220-8262, ext. 56210; Fax: 503-721-1402; E-mail: [email protected]
The research reported here was supported by the Department of Veterans Affairs Health Administration, RehabilitationResearch and Development Grant # C2645R and the National Center for Rehabilitative Auditory Research, Portland VA MedicalCenter, Portland, Oregon.
The Attitudes towards Loss of HearingQuestionnaire (ALHQ): A Comparison of Paper and Electronic Formats
Gabrielle Saunders*
Anna Forsline*
Peter Jacobs*
Abstract
The purpose of the study was to determine whether scores obtained on theALHQ when completed in electronic format are the same as when completedin paper format. Four groups of 25 individuals participated. Each completedthe ALHQ on two occasions in either its paper version, its electronic version,or both. The variance in ALHQ scores from the first to second administrationswas compared across test groups. Data showed that the two forms of thequestionnaire yielded equivalent scores but that completion in different modeson both occasions resulted in more variability in scores than completion in thesame mode on both occasions. It is concluded that when comparingquestionnaire data across administrations, the same response format shouldbe used. Electronic completion took longer than paper completion, but it isconcluded that the numerous advantages of electronic administration outweighthe disadvantages of additional completion time.
Key Words: Counseling, hearing aids, hearing aid outcome, questionnaires
Abbreviations: ALHQ = Attitudes towards Loss of Hearing Questionnaire; E = Electronic; P= Paper; PVAMC = Portland VA Medical Center
Sumario
El propósito de este estudio fue determinar si los puntajes obtenidos en elCuestionario de Actitudes hacia la Pérdida de la Audición (ALHQ), cuando secompleta en formato electrónico, son los mismos que cuando se completa enformato de papel. Participaron cuatro grupos de 25 individuos. Cada grupocompletó el ALHQ en dos ocasiones, tanto la versión en papel, en la versiónelectrónica o en ambas. La variancia en los puntajes para el ALHQ, de la primeraa la segunda administración, se comparó en todos los grupos de prueba. Losdatos mostraron que las dos formas del cuestionario rindieron puntajesequivalentes, pero que al completarlos en diferentes modos en ambas ocasionesse produjo más variabilidad que cuando se completó en el mismo modo en ambasocasiones. Se concluye que cuando se comparan los datos del cuestionarioen las diferentes aplicaciones, debe utilizarse el mismo formato de respuesta.La ejecución en formato electrónico tomó más tiempo que la realización en papel,pero se concluye que las numerosas ventajas de la administración electrónicasuperan las desventajas de un tiempo de administración más prolongado.
Palabras Clave: Consejería, auxiliares auditivos, resultado del auxiliarauditivo, cuestionarios
Abreviaturas: ALHQ = Cuestionario de Actitudes Hacia la Pérdida de laAudición; E = Electrónico; P= Papel; PVAMC = Centro Médico VA de Portland

Hearing aid outcomes measurementis fast becoming a necessarycomponent of clinical service as
audiologists are more often obliged todemonstrate the efficacy of their treatment,provide evidence for third-party payment,conduct cost-effectiveness analyses, andjustify allocation of resources. The majorityof hearing aid outcome measures arequestionnaire based (e.g., Hearing HandicapInventory for the Elderly, Ventry andWeinstein, 1982; Satisfaction withAmplification in Daily Life, Cox andAlexander, 1999; Client Oriented Scale ofImprovement, Dillon et al, 1997).Questionnaires are particularly usefulbecause they provide the users’ perspectiveregarding outcome and supplementlaboratory-based outcome measures, whichwe know do not fully explain real-life listening(Cox, 2003).
Questionnaires, however, tend to beunderutilized because of the time-consumingand relatively cumbersome nature of thedata collection process when compared touse of basic objective clinical measures. Suchprocesses include the use of large quantitiesof paper, time for questionnaire completion,review of patient responses to ensure itemshave not been missed, hand scoring ofresponses and/or entry of responses into adatabase, and, finally, interpretation of thedata. However, now that computers are highlyaccessible and are familiar to manyindividuals, electronic questionnaireadministration is a viable alternative. Theadvantages of electronic administration overpaper format are numerous. They includeaccurate labeling with participant name andcompletion date, absence of missed responses,immediate entry of responses into a database,elimination of data entry errors, the potentialfor larger font size making completion byelderly and visually impaired individualseasier, automated scoring, comparison ofresponses to previous questionnaireadministrations or to population norms,immediate availability of reports that caninclude data from more than one source (e.g.,questionnaire scores plotted in relation to aparticipant’s age and hearing level) andsavings on resources, both financial andenvironmental. Additionally, electronicquestionnaires can be used to makesophisticated decisions that personalize aquestionnaire by adapting it to specific
responses and skipping irrelevant questions. There are, however, some potential
disadvantages to electronic administration ofquestionnaires. For example, manyindividuals consider computers to beimpersonal and some are unfamiliar withcomputers, while others might have negativeattitudes toward them. These factors mayeach alter patient responses. Furthermore,while not necessarily being a disadvantage,electronic questionnaires usually presentquestionnaire items one at a time, while withpaper questionnaires, all items are visible atthe start. This, and the fact that patientscannot see their prior responses, mightinfluence the pattern of answers.
For these reasons, the AmericanPsychological Association developedguidelines for computer-based tests that statethat before applying norms from conventionaltests to computer-based tests, equivalencyof the two must be established (AmericanPsychological Association, 1986). Thisequivalency includes ensuring that means,dispersions, and distributions of scores for thetwo modes of presentation are approximatelythe same.
A number of studies have compared theequivalency of paper and electronicquestionnaires and have evaluated patientpreference for the response format. Studiesin which correlations between scores on paperand electronic questionnaires have beenpublished show Pearson r-values of between0.54 and 0.90 (e.g., Pouwer et al, 1998; Blivenet al, 2001; Caro et al, 2001). Additionally,data have shown that two-thirds or more ofsubjects prefer the electronic format over thepaper format (e.g., Velikova et al, 1999; Caroet al, 2001; Ryan et al, 2002; Cook et al,2004). Even when subjects did not prefer theelectronic form, studies have shown thatbetween 76% and 99% still found itacceptable, or found the electronic versioneasy to use (e.g., Pouwer et al, 1998; Velikovaet al, 1999; Bliven et al, 2001). Preference forthe electronic form was not related to age, sex,familiarity with technology, educational level,visual impairment, reading level, or thepresence of arthritis (Drummond et al, 1995;Pouwer et al, 1998; Velikova et al, 1999;Bliven et al, 2001). Completion time for theelectronic version of the questionnaires wassimilar (Ryan et al, 2002) or slightly longer(Bliven et al, 2001; Caro et al, 2001) than forthe paper versions. However, when manual
Computerized ALHQ/Saunders et al
67
versus automated data entry and scoring areconsidered, presumably these differencesbecome insignificant. Furthermore, becausemost electronic questionnaires do not allowmissing responses, electronic questionnaireswere more complete than paper versions (e.g.,Caro et al, 2001; Hanscom et al, 2002; Ryanet al, 2002).
In our laboratory, we have developed theAttitudes towards Loss of HearingQuestionnaire (ALHQ; Saunders andCienkowski, 1996; Saunders et al, 2005). Itexamines attitudes toward hearing loss andhearing aids on five scales: Denial of HearingLoss, Negative Associations, Negative CopingStrategies, Manual Dexterity and Vision,and Hearing-Related Esteem. It wasdeveloped with two purposes in mind: first,as a tool to elucidate some of the underlyingpsychosocial issues that lead to the refusal toacquire or to use amplification and, second,as a counseling tool to address these issues.The questionnaire takes about ten minutesto complete and is available in two forms: onefor non–hearing aid users and one for currentusers of hearing aids. They differ in thewording of just six questions. The internalconsistency values of the scales is good: fourof the five scales have Cronbach’s α valuesgreater than 0.80. The test-retest reliabilityof the scales is also good; r-values range from0.88 to 0.65. The low interscale correlationsshow that each measures a different construct(Saunders et al, 2005).
Both a paper version and an electronicversion of the ALHQ have been developed.The electronic version has all of theadvantages over the paper version that weredescribed above, but prior to recommendingimplementation of the electronic ALHQ, it isnecessary to confirm equivalence of the twotypes of questionnaire format. This studywas therefore undertaken in order todetermine (a) whether the electronic version
yields the same results as the paper versionand (b) whether participants are able tounderstand and complete the electronicversion as easily as they can complete thepaper version. The paper version is availablein Saunders et al (2005), and both versionscan be downloaded from the National Centerfor Rehabilitative Auditory Research Website (http://www.ncrar.research.va.gov).
METHODS
Study Design
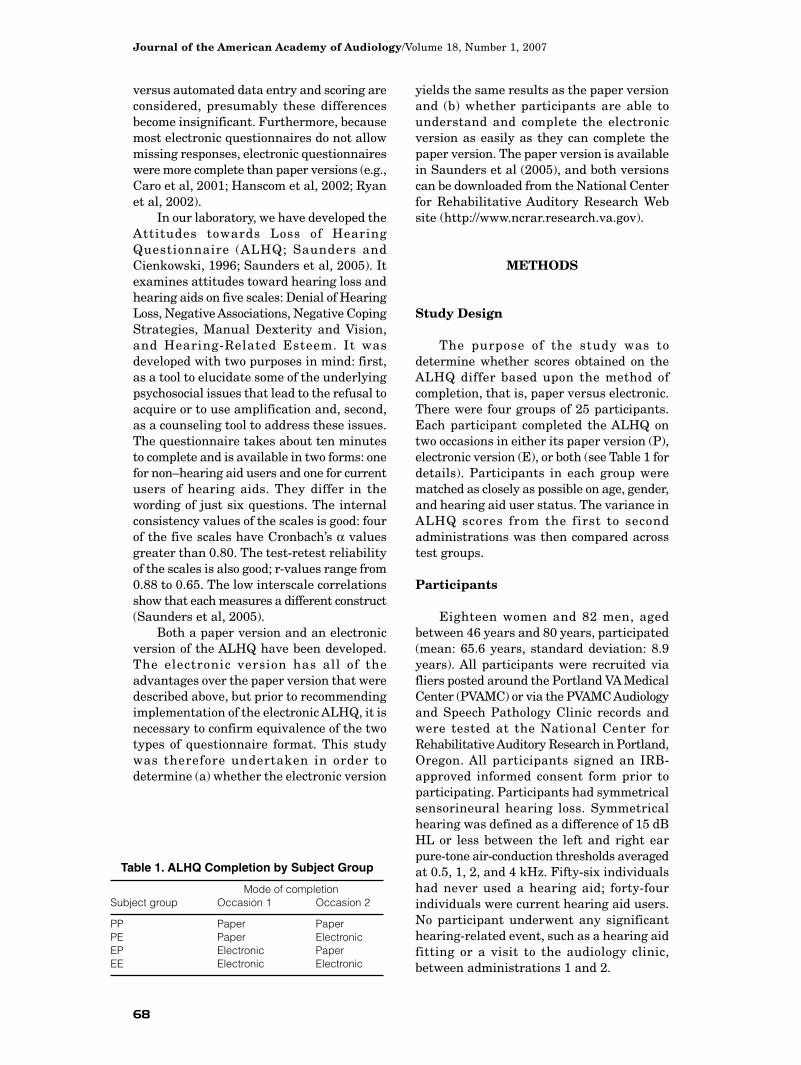
The purpose of the study was todetermine whether scores obtained on theALHQ differ based upon the method ofcompletion, that is, paper versus electronic.There were four groups of 25 participants.Each participant completed the ALHQ ontwo occasions in either its paper version (P),electronic version (E), or both (see Table 1 fordetails). Participants in each group werematched as closely as possible on age, gender,and hearing aid user status. The variance inALHQ scores from the first to secondadministrations was then compared acrosstest groups.
Participants
Eighteen women and 82 men, agedbetween 46 years and 80 years, participated(mean: 65.6 years, standard deviation: 8.9years). All participants were recruited viafliers posted around the Portland VA MedicalCenter (PVAMC) or via the PVAMC Audiologyand Speech Pathology Clinic records andwere tested at the National Center forRehabilitative Auditory Research in Portland,Oregon. All participants signed an IRB-approved informed consent form prior toparticipating. Participants had symmetricalsensorineural hearing loss. Symmetricalhearing was defined as a difference of 15 dBHL or less between the left and right earpure-tone air-conduction thresholds averagedat 0.5, 1, 2, and 4 kHz. Fifty-six individualshad never used a hearing aid; forty-fourindividuals were current hearing aid users.No participant underwent any significanthearing-related event, such as a hearing aidfitting or a visit to the audiology clinic,between administrations 1 and 2.
Journal of the American Academy of Audiology/Volume 18, Number 1, 2007
68
Table 1. ALHQ Completion by Subject Group
Mode of completionSubject group Occasion 1 Occasion 2
PP Paper PaperPE Paper ElectronicEP Electronic PaperEE Electronic Electronic

Computerized ALHQ/Saunders et al
69
Test Measures
The following test measures werecompleted by all participants.
1. Pure-tone audiometry, otoscopy, andtympanometry. Air-conduction thresholdswere measured bilaterally at octavefrequencies between 0.25 and 8 kHz, alongwith interoctave frequencies of 1.5, 3.0, and6.0 kHz. Otoscopy and tympanometry wereconducted to check for cerumen andconductive pathology respectively. Anyparticipants with conductive pathology wereexcluded from the study. For later analyses,a four-frequency pure-tone average (4F-PTA)was computed (4F-PTA = mean of left andright ear thresholds at 0.5, 1.0, 2.0, and 4.0kHz).
2. The Attitudes toward Loss of HearingQuestionnaire (ALHQ v2.1). The ALHQ v2.1is a 22-item questionnaire with five scales:Denial of Hearing Loss (six items), NegativeAssociations (four items), Negative CopingStrategies (eight items), Manual Dexterityand Vision (three items), and Hearing-RelatedEsteem (two items). Each questionnaire itemconsists of a single statement, such as “I tryto avoid small talk because of my hearingdifficulties.” Participants state the extent towhich they agree or disagree with thestatement on a five-point scale ranging from“Strongly agree” to “Strongly disagree.” Twoforms of the ALHQ are available; one fornonusers of hearing aids and one for currentusers of hearing aids. The forms differ in thewording of six questions. For example, oneitem on the nonusers form is “I am pretty surethat I don’t need hearing aids”; the equivalentitem on the current users form is “I reallydon’t think that I need my hearing aids.”The ALHQ is scored such that a high scoreon any scale is indicative of a less favorableattitude, that is, denial rather thanacceptance of hearing loss, negativeassociations with hearing aids, poor copingstrategies, poor manual dexterity and/orvisual acuity, and low hearing-related esteem.Thus, low scores are considered preferable tohigh scores in terms of probable hearing aidoutcome.
All items in the paper version of thequestionnaire are printed on a single side of8.5 x 11 inch paper in Arial 12-point font. Thequestionnaire and scoring key are printedin Saunders et al (2005).
The electronic version of the ALHQ
consists of three modules: a PatientInformation module, a Questionnaire module,and a Report module. All data are stored ina database for later analysis.
The Patient Information module iscompleted by the clinician prior to thepatient’s arrival. The clinician enters patientdata including name, address, date of birth,and audiometric thresholds. Age andaudiometric thresholds will be referencedwhen the program is used to generatecounseling recommendations.
The Questionnaire module is completedindependently by the patient. It consists ofthree simple instruction screens (one or twosentences per screen), followed by 23 questionscreens. The patient’s response to the firstquestion “Have you ever worn hearing aidsbefore?” directs the computer program toselect the non–hearing aid users or currenthearing aid users form, as appropriate. Eachscreen shows a single question, along with theresponse scale. Participants use either themouse or the keyboard to indicate theirresponse. Following a response, the programautomatically moves to the next question.Once all questions have been answered,participants see all of their responses on asingle screen. At this point they can changeany response by clicking on the item theywish to revise.
The Report module automaticallygenerates a report once the questionnairehas been completed. At this time, the reportconsists of demographic information, rawALHQ scores, percentiles scores, and a profilegraph of scores in relation to normative data (see Appendix 1). In the future the report will also contain counselingrecommendations.
Procedures
All participants underwent audiometrictesting, and a case history was taken. Theythen completed the ALHQ. If completing thepaper version, the form appropriate to theirhistory of hearing aid use was provided.Following completion, the experimenterchecked that participants had responded toall items. Any missed items were completedat this time. All testing and completion of theALHQ was done without a family memberpresent.
Participants completing the electronicversion were instructed to sit at the computer
Journal of the American Academy of Audiology/Volume 18, Number 1, 2007
70
and follow the instructions on the screen.The program automatically selects the correctversion based upon participant responsesand will not progress to the next questionuntil a response has been entered. Duringcompletion the experimenter monitoredparticipants’ progress to determine whetherthey experienced any difficulties using thecomputer program.
Between six days and fifteen days afterthe initial visit, participants returned to thelaboratory to compete the ALHQ for thesecond time using the version appropriate totheir group designation.
The time taken to complete both thepaper version and the electronic versionduring both administrations of thequestionnaire was noted for participants inthe EP and EE groups.
RESULTS
Participant Matching
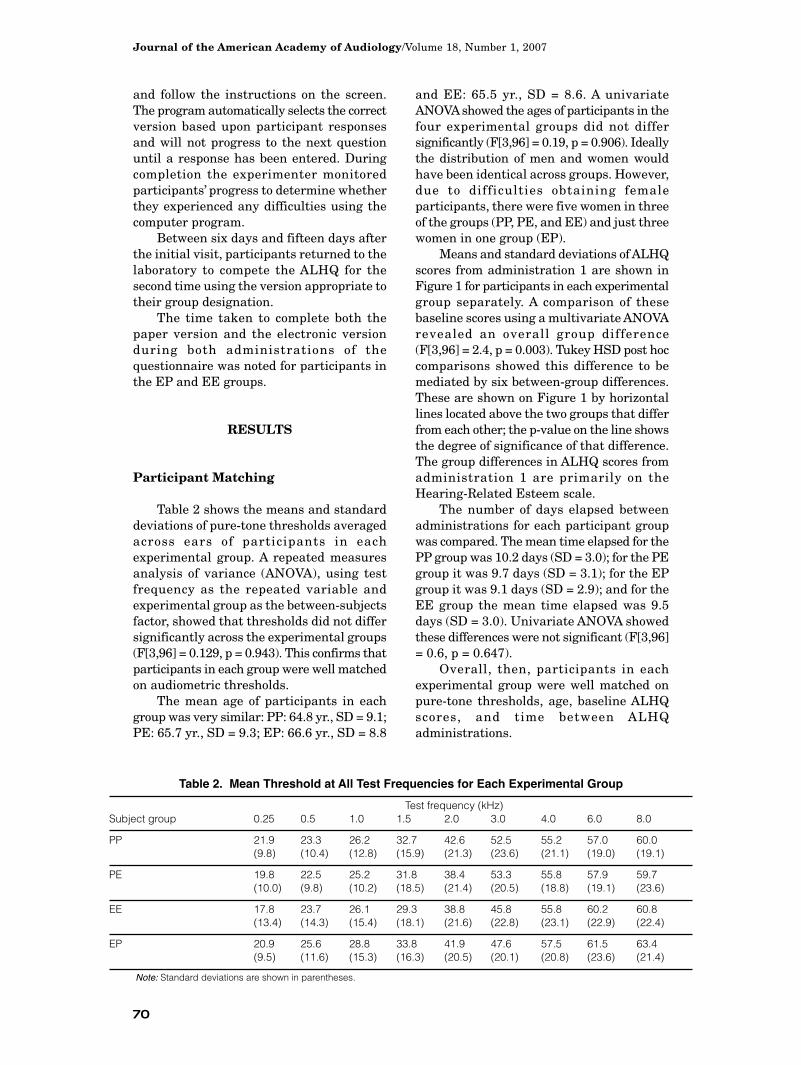
Table 2 shows the means and standarddeviations of pure-tone thresholds averagedacross ears of participants in eachexperimental group. A repeated measuresanalysis of variance (ANOVA), using testfrequency as the repeated variable andexperimental group as the between-subjectsfactor, showed that thresholds did not differsignificantly across the experimental groups(F[3,96] = 0.129, p = 0.943). This confirms thatparticipants in each group were well matchedon audiometric thresholds.
The mean age of participants in eachgroup was very similar: PP: 64.8 yr., SD = 9.1;PE: 65.7 yr., SD = 9.3; EP: 66.6 yr., SD = 8.8
and EE: 65.5 yr., SD = 8.6. A univariateANOVA showed the ages of participants in thefour experimental groups did not differsignificantly (F[3,96] = 0.19, p = 0.906). Ideallythe distribution of men and women wouldhave been identical across groups. However,due to difficulties obtaining femaleparticipants, there were five women in threeof the groups (PP, PE, and EE) and just threewomen in one group (EP).
Means and standard deviations of ALHQscores from administration 1 are shown inFigure 1 for participants in each experimentalgroup separately. A comparison of thesebaseline scores using a multivariate ANOVArevealed an overall group difference (F[3,96] = 2.4, p = 0.003). Tukey HSD post hoccomparisons showed this difference to bemediated by six between-group differences.These are shown on Figure 1 by horizontallines located above the two groups that differfrom each other; the p-value on the line showsthe degree of significance of that difference.The group differences in ALHQ scores fromadministration 1 are primarily on theHearing-Related Esteem scale.
The number of days elapsed betweenadministrations for each participant groupwas compared. The mean time elapsed for thePP group was 10.2 days (SD = 3.0); for the PEgroup it was 9.7 days (SD = 3.1); for the EPgroup it was 9.1 days (SD = 2.9); and for theEE group the mean time elapsed was 9.5days (SD = 3.0). Univariate ANOVA showedthese differences were not significant (F[3,96]= 0.6, p = 0.647).
Overall, then, participants in eachexperimental group were well matched onpure-tone thresholds, age, baseline ALHQscores, and time between ALHQadministrations.
Table 2. Mean Threshold at All Test Frequencies for Each Experimental Group
Test frequency (kHz)Subject group 0.25 0.5 1.0 1.5 2.0 3.0 4.0 6.0 8.0
PP 21.9 23.3 26.2 32.7 42.6 52.5 55.2 57.0 60.0(9.8) (10.4) (12.8) (15.9) (21.3) (23.6) (21.1) (19.0) (19.1)
PE 19.8 22.5 25.2 31.8 38.4 53.3 55.8 57.9 59.7(10.0) (9.8) (10.2) (18.5) (21.4) (20.5) (18.8) (19.1) (23.6)
EE 17.8 23.7 26.1 29.3 38.8 45.8 55.8 60.2 60.8(13.4) (14.3) (15.4) (18.1) (21.6) (22.8) (23.1) (22.9) (22.4)
EP 20.9 25.6 28.8 33.8 41.9 47.6 57.5 61.5 63.4(9.5) (11.6) (15.3) (16.3) (20.5) (20.1) (20.8) (23.6) (21.4)
Note: Standard deviations are shown in parentheses.

Computerized ALHQ/Saunders et al
71
Effect of Demographic Variables uponALHQ Scores
In order to determine whether thevariables of age, sex, and hearing aid userstatus affected the data, three sets of analyseswere conducted. For each of these analyses,the differences in ALHQ scores betweenadministrations 1 and 2 were compared.Pearson correlations were used to examinethe relationship between age and thedifference in ALHQ scores betweenadministrations 1 and 2. None of thecorrelations was significant at p < 0.01(Denial of Hearing Loss: r = 0.226; NegativeAssociation: r = 0.01; Negative CopingStrategies: r = -0.116; Manual Dexterity andVision: r = 0.003; Hearing-Related Esteem:r = 0.123). Multivariate analyses of variancewere then conducted to determine whetherdifferences in ALHQ scores betweenadministrations 1 and 2 differed by sex orhearing aid user status. Both ANOVAsshowed nonsignificant group differences (Sex:F[5,5] = 0.1, p = 0.992; Hearing aid userstatus: F[5,5] = 0.7, p = 0.577). Since age, sex,and hearing aid user status were notsignificantly related to differences in ALHQscores between administrations, the datafrom all subjects were combined for thebetween-participant group analyses.
Comparison of ALHQ Scores acrossAdministrations
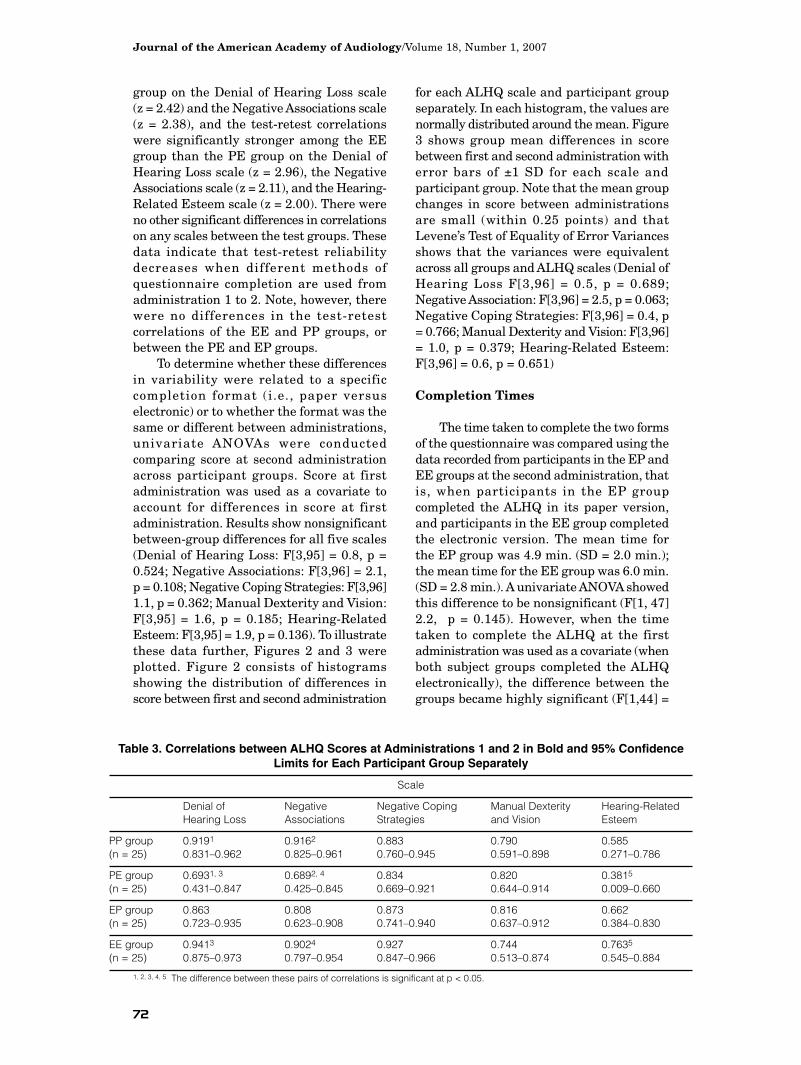
Pearson correlations were used todetermine the strength of the relationshipbetween ALHQ scores at administrations 1and 2 for each experimental group separately.These correlations essentially examine test-retest reliability and were conducted todetermine whether reliability differed acrosstype of questionnaire administration (i.e.,paper versus electronic). Confidence limits forthese correlations were also computed. Theresults are shown in Table 3.
There is an indication that correlationsdiffer across the participant groups. Ingeneral, the r-values for the PP and EEgroups are higher than those of the PE andEP groups. In order to determine whetherthese differences were significant, a Fisher-z transform was conducted for each pair ofcorrelations. If z > 1.96 for any comparison,then there is a significant difference betweenthe correlations. The results of thesecomputations are shown in Table 3 by thesuperscripted numbers 1 through 5. Thecorrelations marked with the samesuperscript differ significantly from oneanother. There are five between-groupdifferences: the correlations were significantlystronger among the PP group than the PE
Figure 1. Bar graph showing group mean ALHQ scores at administration 1 along with horizontal bars show-ing scores that differ significantly at p < 0.05 or less. Dark shaded bars show EE group data; white bars showEP group data; light shaded bars show PE group data; and hatched bars show PP group data.
Journal of the American Academy of Audiology/Volume 18, Number 1, 2007
72
group on the Denial of Hearing Loss scale (z = 2.42) and the Negative Associations scale(z = 2.38), and the test-retest correlationswere significantly stronger among the EEgroup than the PE group on the Denial ofHearing Loss scale (z = 2.96), the NegativeAssociations scale (z = 2.11), and the Hearing-Related Esteem scale (z = 2.00). There wereno other significant differences in correlationson any scales between the test groups. Thesedata indicate that test-retest reliabilitydecreases when different methods ofquestionnaire completion are used fromadministration 1 to 2. Note, however, therewere no differences in the test-retestcorrelations of the EE and PP groups, orbetween the PE and EP groups.
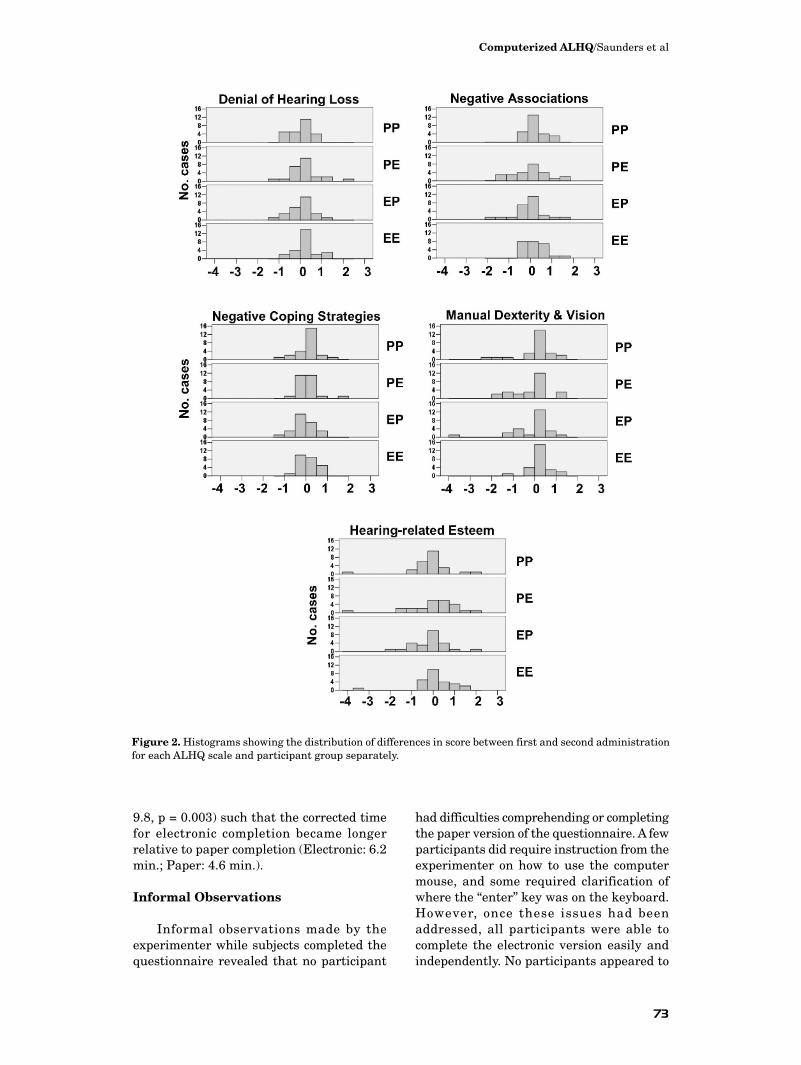
To determine whether these differencesin variability were related to a specificcompletion format (i.e., paper versuselectronic) or to whether the format was thesame or different between administrations,univariate ANOVAs were conductedcomparing score at second administrationacross participant groups. Score at firstadministration was used as a covariate toaccount for differences in score at firstadministration. Results show nonsignificantbetween-group differences for all five scales(Denial of Hearing Loss: F[3,95] = 0.8, p =0.524; Negative Associations: F[3,96] = 2.1,p = 0.108; Negative Coping Strategies: F[3,96]1.1, p = 0.362; Manual Dexterity and Vision:F[3,95] = 1.6, p = 0.185; Hearing-RelatedEsteem: F[3,95] = 1.9, p = 0.136). To illustratethese data further, Figures 2 and 3 wereplotted. Figure 2 consists of histogramsshowing the distribution of differences inscore between first and second administration
for each ALHQ scale and participant groupseparately. In each histogram, the values arenormally distributed around the mean. Figure3 shows group mean differences in scorebetween first and second administration witherror bars of ±1 SD for each scale andparticipant group. Note that the mean groupchanges in score between administrationsare small (within 0.25 points) and thatLevene’s Test of Equality of Error Variancesshows that the variances were equivalentacross all groups and ALHQ scales (Denial ofHearing Loss F[3,96] = 0.5, p = 0.689;Negative Association: F[3,96] = 2.5, p = 0.063;Negative Coping Strategies: F[3,96] = 0.4, p= 0.766; Manual Dexterity and Vision: F[3,96]= 1.0, p = 0.379; Hearing-Related Esteem:F[3,96] = 0.6, p = 0.651)
Completion Times
The time taken to complete the two formsof the questionnaire was compared using thedata recorded from participants in the EP andEE groups at the second administration, thatis, when participants in the EP groupcompleted the ALHQ in its paper version,and participants in the EE group completedthe electronic version. The mean time forthe EP group was 4.9 min. (SD = 2.0 min.);the mean time for the EE group was 6.0 min.(SD = 2.8 min.). A univariate ANOVA showedthis difference to be nonsignificant (F[1, 47]2.2, p = 0.145). However, when the timetaken to complete the ALHQ at the firstadministration was used as a covariate (whenboth subject groups completed the ALHQelectronically), the difference between thegroups became highly significant (F[1,44] =
Table 3. Correlations between ALHQ Scores at Administrations 1 and 2 in Bold and 95% ConfidenceLimits for Each Participant Group Separately
Scale
Denial of Negative Negative Coping Manual Dexterity Hearing-Related Hearing Loss Associations Strategies and Vision Esteem
PP group 0.9191 0.9162 0.883 0.790 0.585(n = 25) 0.831–0.962 0.825–0.961 0.760–0.945 0.591–0.898 0.271–0.786
PE group 0.6931, 3 0.6892, 4 0.834 0.820 0.3815
(n = 25) 0.431–0.847 0.425–0.845 0.669–0.921 0.644–0.914 0.009–0.660
EP group 0.863 0.808 0.873 0.816 0.662(n = 25) 0.723–0.935 0.623–0.908 0.741–0.940 0.637–0.912 0.384–0.830
EE group 0.9413 0.9024 0.927 0.744 0.7635
(n = 25) 0.875–0.973 0.797–0.954 0.847–0.966 0.513–0.874 0.545–0.884
1, 2, 3, 4, 5 The difference between these pairs of correlations is significant at p < 0.05.
Computerized ALHQ/Saunders et al
73
9.8, p = 0.003) such that the corrected timefor electronic completion became longerrelative to paper completion (Electronic: 6.2min.; Paper: 4.6 min.).
Informal Observations
Informal observations made by theexperimenter while subjects completed thequestionnaire revealed that no participant
had difficulties comprehending or completingthe paper version of the questionnaire. A fewparticipants did require instruction from theexperimenter on how to use the computermouse, and some required clarification ofwhere the “enter” key was on the keyboard.However, once these issues had beenaddressed, all participants were able tocomplete the electronic version easily andindependently. No participants appeared to
Figure 2. Histograms showing the distribution of differences in score between first and second administrationfor each ALHQ scale and participant group separately.

Journal of the American Academy of Audiology/Volume 18, Number 1, 2007
74
be anxious or stated that completion of eitherversion made them anxious. Some individualsspontaneously reported that completing thequestionnaire via a computer was moreinteresting than completing the paperversion.
DISCUSSION
The primary purpose of this study was todetermine whether completion of the
ALHQ in electronic format yielded the sameresponses as completion of the ALHQ in paperformat. In addition, completion time wasrecorded and informal observations weremade in order to examine whether electroniccompletion raised additional issues such asdifficulties handling a computer, additionaltime for completion, or anxiety with anontraditional format. As discussed in theintroduction, there are many advantages tohaving individuals complete questionnairesin an electronic form, but if by doing sodifferent responses arise, then interpretationof scores would have to be modified, and newnorms would have to be generated.
In order to examine the primary questionregarding equivalence of scores with the twocompletion formats, comparisons of thecorrelations between scores at the first andsecond administrations for each participantgroup were made. These correlations ranged
from r = 0.381 to r = 0.927, which is similarto correlations shown in other investigations(e.g., Pouwer et al, 1998; Bliven et al, 2001;Caro et al, 2001). The rationale for comparingcorrelations between scores at the first andsecond administrations is that thecorrelations for individuals in the PP andEE groups who completed the ALHQ usingthe same format each time are a function oftest-retest reliability only, whereas thecorrelations for individuals in the PE andEP groups who completed the ALHQ using adifferent format each time are a function oftest-retest reliability combined withvariability due to the change in responseformat. Thus, if the correlations for the PEand EP groups were significantly lower thanthose for the PP and EE groups, it wouldsuggest that completion format impactedresponses. The analyses revealed fivebetween-group differences. In each instancethe correlations that differed significantlywere those between participants in the PEgroup, and participants in either the PP orEE group. This implies that completionformat did impact response variability.Follow-up analyses were conducted todetermine whether this variability was dueto there being a difference in format betweenadministrations (PE and EP versus PP andEE) or whether it was due to a specific format(E versus P). Since there were no between-group differences in scores at the second
Figure 3. Bar graph of group mean differences in score between first and second administration for each scaleand participant group along with error bars showing ±1 SD. Dark shaded bars show EE group data; white barsshow EP group data; light shaded bars show PE group data; and hatched bars show PP group data.

Computerized ALHQ/Saunders et al
75
administration, it is concluded that thedifferences in correlations were due to therebeing a difference in format betweenadministrations rather than to the specificcompletion format. This should cautionresearchers and clinicians to ensure that thesame response format is used any time datafrom questionnaires are to be compared.
In terms of missing data, the electronicALHQ does not permit missing responses.Missing responses did occur with the paperversion; however, they were not specificallytracked. The experimenter simply examinedthe questionnaire after completion and hadthe participant complete the missing itemsat that time. We are thus unable to provideinformation as to whether missing responseswere question-specific or simply due toomission errors. Data regarding missingresponses from other questionnairescompleted in our laboratory are, however,available. We found that five of twenty-sevenparticipants who completed a questionnaireknown as the “Psychosocial Impact ofAssistive Devices Scale” (PIADS; Day andJutai, 1996) missed at least one question.This questionnaire is of particular relevancehere because it has a very similar format tothe paper version of the ALHQ. Further,across five different questionnaires completed(including the PIADS), nine of the twenty-seven participants missed at least onequestion. Thus, although these data are notquestionnaire specific, they suggest thatwhen completing questionnaires in paperformat, participants do accidentally missquestions.
Some of the participants in this studyrequired an explanation of how to use thecomputer mouse and keyboard. This might bebecause the population we used wererelatively elderly: 27 of the 75 participants(36%) that completed the electronic ALHQ(subjects in groups PE, EP, and EE) were 70years and older. Clearly, as the presence ofcomputers proliferates, there will be fewerindividuals unfamiliar with their use.Furthermore, once simple instruction lastingno more than two minutes had been provided,these individuals were able to use thecomputer program with ease.
The font size of the electronic versionwas considerably larger than the font in thepaper version. This is advantageous for usewith elderly visually impaired individuals.Moreover, because only one question at atime is shown in the electronic version, there
is no doubt that an individual is respondingto that specific question, and not accidentallymarking the wrong response line, as ispossible with the paper version. On the otherhand, as mentioned in the introduction, thereis the possibility that the pattern of responseswould differ because the participant cannotsee their prior responses.
As in some previous studies (Bliven et al,2001; Caro et al, 2001), completion time forthe paper version was faster than for theelectronic version by about one minute, or20%. However, this time difference iscompensated for by the time saved in theprinting of questionnaires, manual data entry,and manual scoring. Furthermore, automatedscoring decreases human scoring errors, andthe availability of instant printed reportsprovides clinicians with a valuable resourcenot otherwise available.
CONCLUSIONS
This study shows that changing theresponse format of the ALHQ, and
possibly other questionnaires, does affect thereliability of participant responses in thatcompletion of questionnaires in two differentmodes resulted in more variability ofresponses between administrations than didcompletion in the same mode both times.However, this variability was not specific tothe format of completion. Therefore, ifresponses from two or more administrationsof a questionnaire are being compared,researchers and clinicians should ensure thesame response format is used each time inorder to minimize test-retest variability.Ideally, when designing an electronic versionof a questionnaire, normative data shouldbe collected to confirm that responses arethe same as with the paper format. It issuggested that this extra work is worthwhilein light of the numerous advantages ofelectronic administration.
REFERENCES
American Psychological Association. (1986) Guidelinesfor Computer Based Tests and Interpretation.Washington, DC: American Psychological Association.
Bliven B, Kaufman S, Spertus J. (2001) Electroniccollection of health-related quality of life data: valid-ity, time, benefits and patient preference. Qual LifeRes 10:15–22.

Journal of the American Academy of Audiology/Volume 18, Number 1, 2007
76
Caro J, Caro I, Caro J, Wouters F, Juniper E. (2001)Does electronic implementation of questionnairesused in asthma alter responses compared to paperimplementation? Qual Life Res 10:683–691.
Cook A, Roberts D, Henderson M, Van Winkle L,Chastain D, Hammill-Ruth R. (2004) Electronic painquestionnaires: a randomized, crossover comparisonwith paper questionnaires for chronic pain assess-ment. Pain 110:310–317.
Cox R. (2003) Assessment of subjective outcome ofhearing aid fitting: getting the client’s point of view.Int J Audiol 42:S90–96.
Cox R, Alexander G. (1999) Measuring Satisfactionwith Amplification in Daily Life: the SADL Scale. EarHear 20:306–320.
Day H, Jutai J. (1996) Measuring the psychosocialimpact of assistive devices: the PIADS. Can J Rehabil9:159–168.
Dillon H, James A, Ginis J. (1997) The Client OrientedScale of Improvement (COSI) and its relationship toseveral other measures of benefit and satisfactionprovided by hearing aids. J Am Acad Audiol 8:27–43.
Drummond H, Ghosh S, Ferguson A, BrackenridgeD, Tiplady B. (1995) Electronic quality of life ques-tionnaires: a comparison of pen-based electronicquestionnaires with conventional paper in a gas-trointestinal study. Qual Life Res 4:21–26.
Hanscom B, Lurie J, Homa K, Weinstein J. (2002)Computerized questionnaires and the quality of surveydata. Spine 27:1797–1801.
Pouwer F, Snoek F, van der Ploeg H, Heine R, BrandA. (1998) A comparison of the standard and the com-puterized versions of the Well-being Questionnaire(WBQ) and the Diabetes Treatment SatisfactionQuestionnaire (DTSQ). Qual Life Res 7:33–38.
Ryan J, Corry J, Attewell R, Smithson M. (2002) Acomparison of an electronic version of the SF-36General Health Questionnaire to the standard paperversion. Qual Life Res 11:19–26.
Saunders G, Cienkowski K. (1996) Refinement andpsychometric evaluation of the Attitudes TowardsLoss of Hearing Questionnaire. Ear Hear 17:505–519.
Saunders G, Cienkowski K, Forsline A, Fausti S.(2005) Normative data for the Attitudes towards Lossof Hearing Questionnaire. J Am Acad Audiol16:637–652.
Velikova G, Wright E, Smith A, Cull A, Gould A,Forman D, Perren T, Stead M, Brown J, Shelby P.(1999) Automated collection of quality-of-life data: acomparison of paper and computer touch-screen ques-tionnaires. J Clin Oncol 17:998–1007.
Ventry I, Weinstein B. (1982) The Hearing HandicapInventory for the Elderly: a new tool. Ear Hear3:40–46.

Computerized ALHQ/Saunders et al
77
Appendix 1