the barnett shale as a model for unconventional shale gas...
TRANSCRIPT

Humble Geochemical Services
The Barnett Shale as a Model for Unconventional
Shale Gas Exploration©
Dan JarvieHumble Geochemical Services
Division of Humble Instruments & Services, Inc.
Copyright 2003 Humble Instruments & Services, Inc. All rights reserved.

Humble Geochemical Services
Humble, Texas(Houston is our largest suburb)

Humble Geochemical Services
Petroleum Geochemistry
• ExplorationHigh-grading plays/prospects for likelihood of hydrocarbon charge
– Source rocks– Oil typing– Correlations– Inversions
• Production
Assessing reservoirs and well plumbing
– Reservoir continuity– Commingled allocation– EOR assessment– Well plumbing
Exploration / ProductionFinding bypassed pay and predicting pre-test, pre-completion oil quality
Humble Geochemical Services
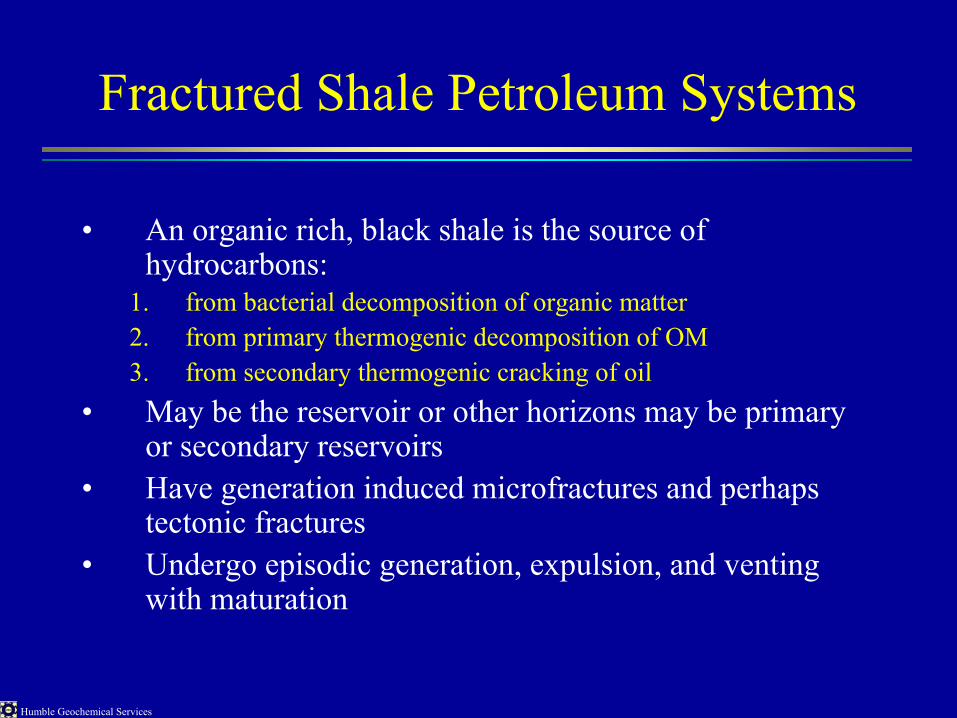
Fractured Shale Petroleum Systems
• An organic rich, black shale is the source of hydrocarbons:
1. from bacterial decomposition of organic matter2. from primary thermogenic decomposition of OM3. from secondary thermogenic cracking of oil
• May be the reservoir or other horizons may be primary or secondary reservoirs
• Have generation induced microfractures and perhaps tectonic fractures
• Undergo episodic generation, expulsion, and venting with maturation

Humble Geochemical Services
Fractured shales yield oil and gas in various basins:there exist numerous similarities and differences among these systems
Biogenic gas
Oil
Oil
OilOil and Gas
Gas
Gas and some oil
Oil
Oil and gasOil and gas
Oil and some gas
Ref: USGS
Oil and gas

Humble Geochemical Services
USGS Data on Gas Bearing Shales
nana1.6 - 1.91-2.5*LewisShale
San Juan
20**(min.)
3.4 - 100.6 - 1.6*1-12*Ave. 4.5
BarnettShale
Ft. Worth
86 - 1601.9 - 19.20.4 - 1.01-25NewAlbanyShale
Illinois
35 - 7611 - 190.4 - 0.61-20AntrimShale
Michigan
225 -24814.5 - 27.50.4 - 1.3%1-4.5*
Ohio Shale
Appalachian
Shale Gas
in place(Tcf)
EstimatedRecoverable
Shale Gas(Tcf)
Range ofMaturities
(%Ro)
T.O.C.(wt.%)
FormationBasin
* modified from USGS ** author’s estimate

Humble Geochemical Services
Gas Production from Fractured Shales
BarnettShale
est. 2002based on97 BCF
in first halfof 2002
Ref: Hill, 2000; Bowker, 2002
Humble Geochemical Services
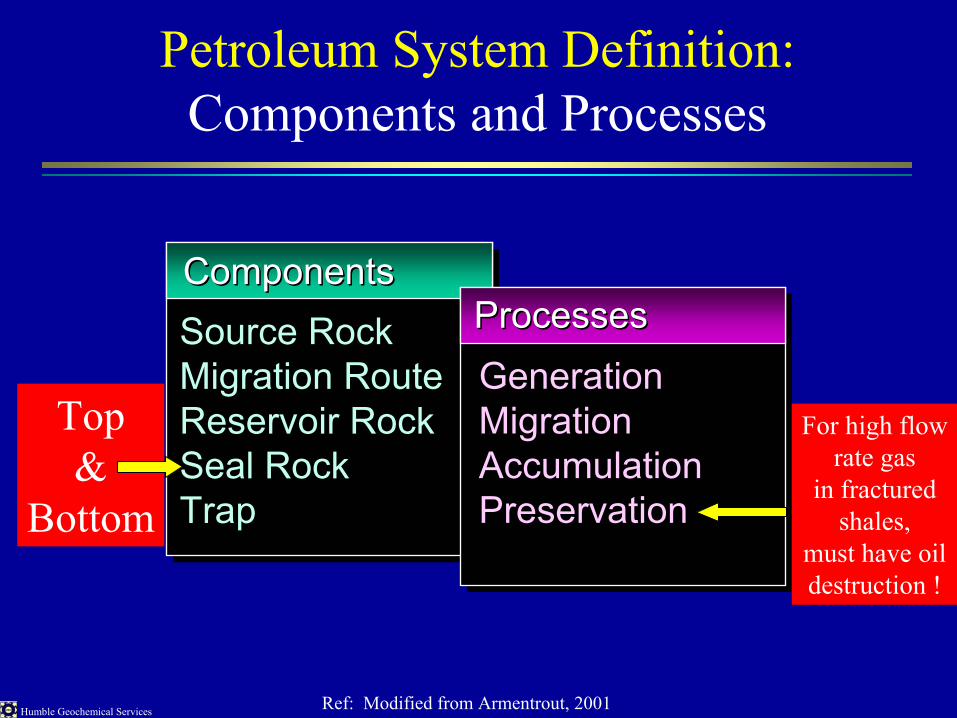
Petroleum System Definition:Components and Processes
Source RockSource RockMigration RouteMigration RouteReservoir RockReservoir RockSeal RockSeal RockTrapTrap
ComponentsComponents
GenerationGenerationMigrationMigrationAccumulationAccumulationPreservationPreservation
ProcessesProcesses
For high flow rate gas
in fracturedshales,
must have oildestruction !
Top&
Bottom
Ref: Modified from Armentrout, 2001

Humble Geochemical Services
Distribution of Organic Matter in Rock Sample (low maturity)
DispersedOrganicMatter:
the “source”of
oil + assoc. gas
Rock Sample
TOC
Live Carbon
Organic Matter (Kerogen)Oil
Gas
Total Organic Carbon (T.O.C.)
Dead Carbon
Dead Carbon
Oil Prone Gas ProneS2 (and Tmax)S1 S4
Ref: Jarvie, 1991
Humble Geochemical Services
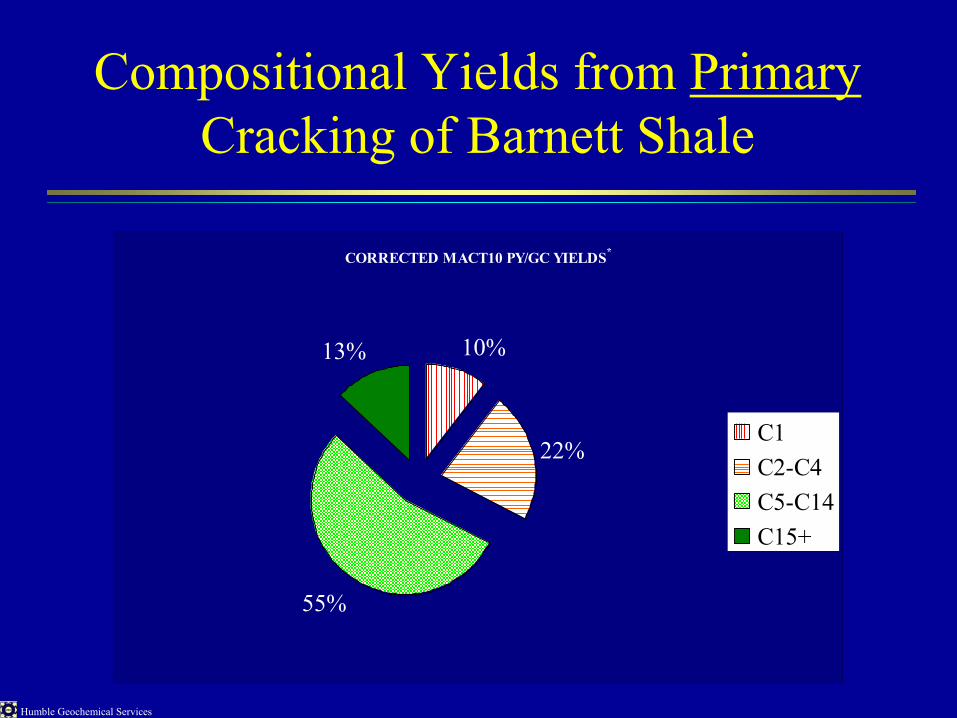
Compositional Yields from PrimaryCracking of Barnett Shale
CORRECTED MACT10 PY/GC YIELDS*
22%
55%
13% 10%
C1C2-C4C5-C14C15+
Humble Geochemical Services
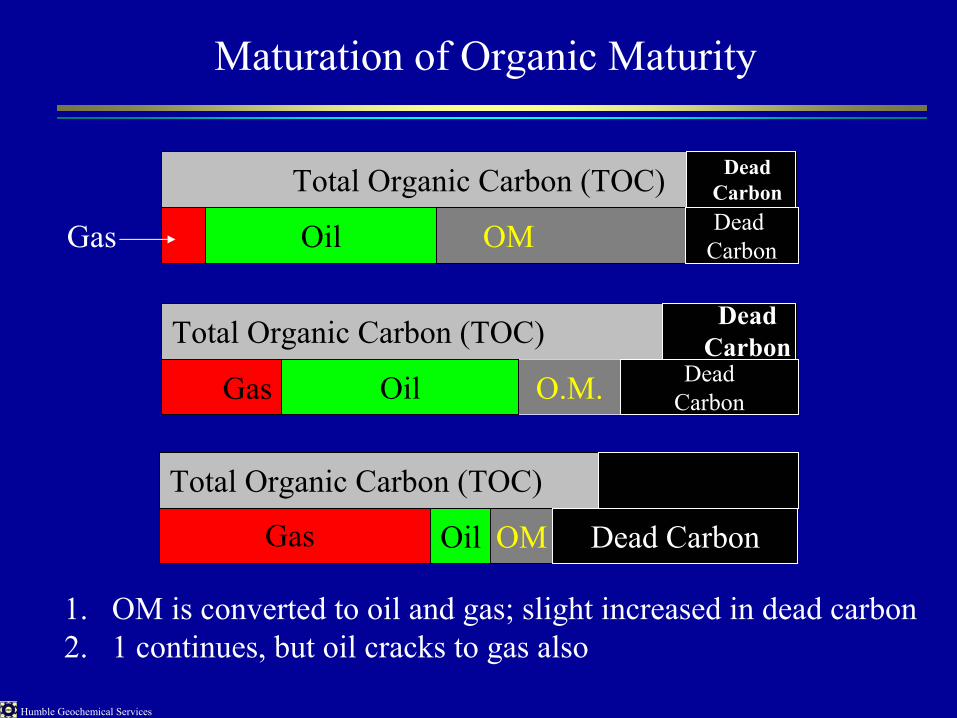
Total Organic Carbon (TOC)
OMOilGas
Maturation of Organic Maturity
Total Organic Carbon (TOC)
O.M.OilGas
DeadCarbon
DeadCarbon
Dead Carbon
Dead Carbon
DeadCarbon
1. OM is converted to oil and gas; slight increased in dead carbon2. 1 continues, but oil cracks to gas also
Total Organic Carbon (TOC)
OMOil Dead CarbonGas

Humble Geochemical Services
Episodic expulsion also changes the mix
Total Organic Carbon (TOC)
OMOilGas
Total Organic Carbon (TOC)
Dead CarbonOilGas
OilGas
Expulsion
Generation fracture
Dead Carbon
Dead Carbon
Dead Carbon
OM
TOC
OMOil
Residual oil, OM, and DC in rock
Dead Carbon

Humble Geochemical Services
Residual Oil and Residual OMare cracked to gas (if sufficient depth of burial)
TOC
OMOil Dead Carbon
Gas Gas wetness is controlledby thermal maturity andperhaps physico chemicalinteraction of oil with claysin Barnett
Initially: Wet Gas
Dry Gasat highmaturities
Humble Geochemical Services
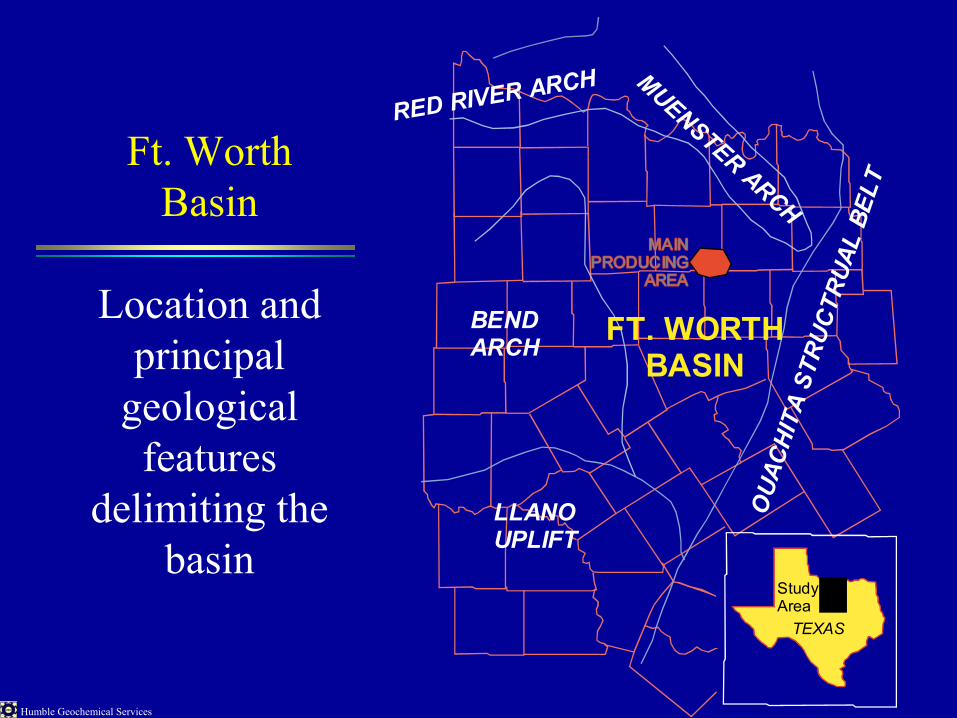
FT. WORTHBASIN
LLANOUPLIFT
MUENSTER ARCH
BENDARCH
RED RIVER ARCH
OU
ACHI
TA S
TRUC
TRUA
L BE
LT
TEXAS
StudyArea
Ft. Worth Basin
Location andprincipal
geologicalfeatures
delimiting thebasin
Humble Geochemical Services
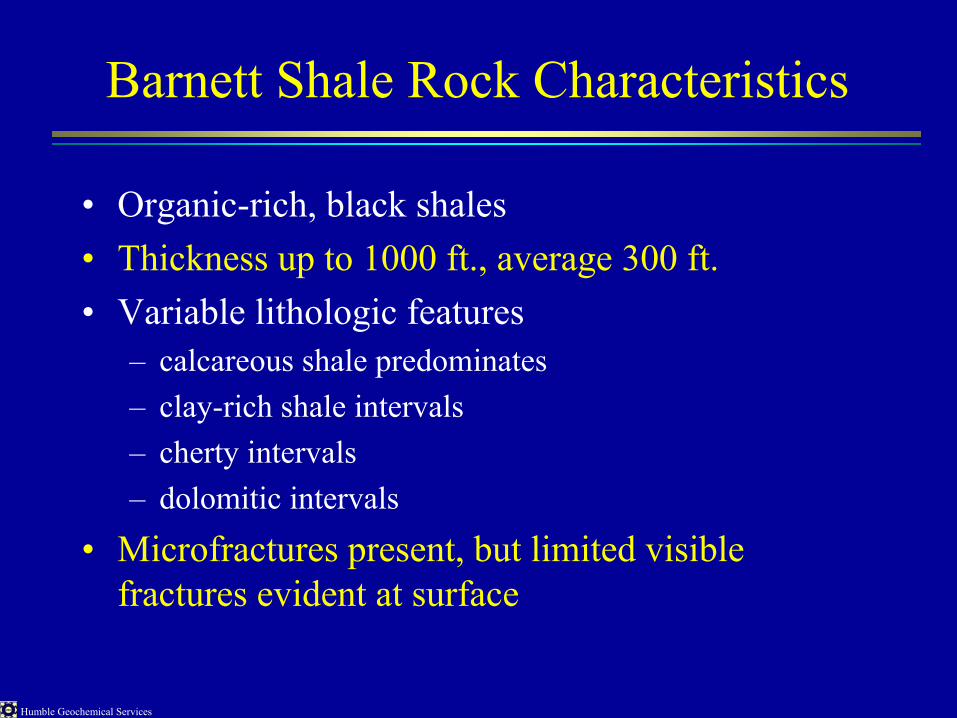
Barnett Shale Rock Characteristics
• Organic-rich, black shales• Thickness up to 1000 ft., average 300 ft.• Variable lithologic features
– calcareous shale predominates– clay-rich shale intervals– cherty intervals– dolomitic intervals
• Microfractures present, but limited visible fractures evident at surface

Humble Geochemical Services
Has expulsion of Barnett generated hydrocarbons into younger or older
formations occurred?
• Low maturity oils in the western basin are all Barnett (8 horizons fingerprinted including the deeper Ellenburger) and are very high quality for low maturity (ca. 40oAPI).
• Higher maturity oils in Wise County are also Barnett sourced oils with similar properties although color is slightly different.
Thus, expulsion is episodic (different times and maturities)
n.b. This also explains natural ground water contamination in the basin.

Humble Geochemical Services
In the Western Ft. WorthBasin, oils from the:•Barnett•Caddo•Canyon•Chester•Chappel•Conglomerate•Ellenburger•Flippen•Gardner•Harry Key Ls•Hodge Eagle•Hope•MoranAre all Barnett-sourcedoils (43) based on oilfingerprinting results(Ref: Jarvie et al, 2001)Stratigraphic Column: Courtesy of Rich Pollastro, USGS
Stratigraphic Column

Humble Geochemical Services
Barnett Shale:Petroleum Potential and Maturity Trend
0200400600800
100012001400
380 430 480 530 580
THERMAL MATURITY (Tmax in oC)
BO
/ A
F (b
ased
on
S2)
Kerogen transformationtrend line
Lampasasoutcrops !
Gas Window
If high TOCthese are also gas windowdespite low (unreliable)
Tmax values

Humble Geochemical Services
General Observations
• High TOC marine shales are more efficient expellers of hydrocarbons– 1% poor 3% fair 10% excellent
• High TOC and clay content aid retention of hydrocarbons by adsorption
• Episodic expellers, a.k.a. pressure cookers: Generate HCs, form vapor lock – critical pressure exceeded, vent, and reseal; repeated depending on burial history
Humble Geochemical Services
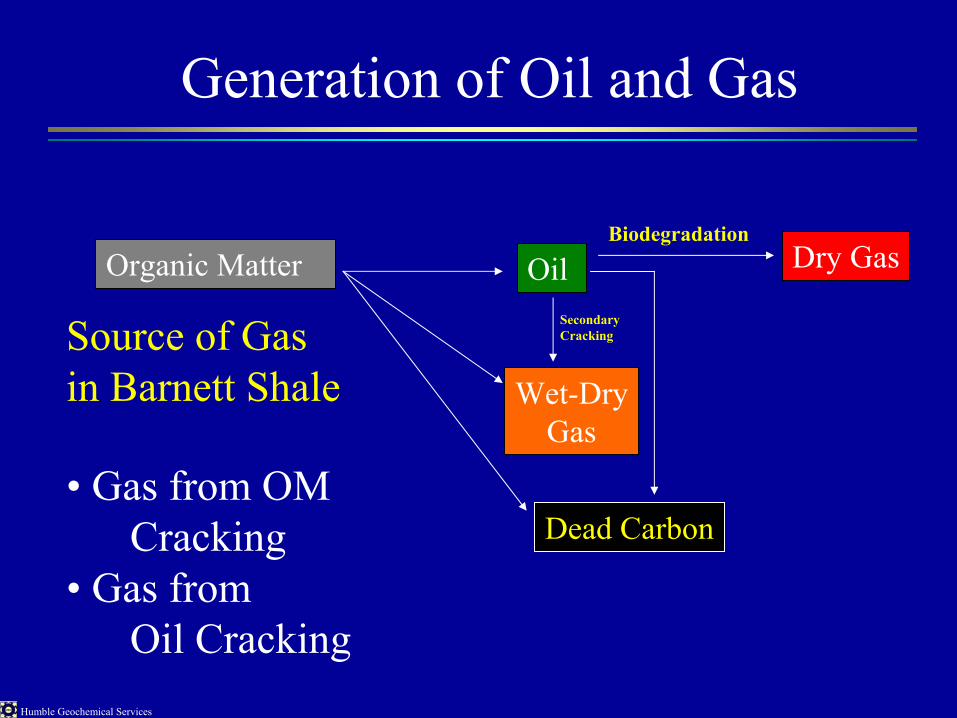
Generation of Oil and Gas
Organic Matter Oil
Wet-DryGas
Dead Carbon
Dry GasBiodegradation
SecondaryCrackingSource of Gas
in Barnett Shale
• Gas from OMCracking
• Gas fromOil Cracking

Humble Geochemical Services
0.00
0.10
0.20
0.30
0.40
0.50
0.60
0.70
0.80
0.90
1.00
0 50 100 150 200 250 300
TEMPERATURE (oC)
CA
L. T
RA
NSF
OR
MA
TIO
N R
ATI
O(T
R)
0.20
0.40
0.60
0.80
1.00
1.20
1.40
1.60
1.80
2.00
2.20
CA
L. V
ITR
INIT
E R
EFLE
CTA
NC
E (%
Ro)
KEROGEN-to-HYDROCARBONS HYDROCARBONS-to-GAS VITRINITE REFLECTANCE
CACULATED TRANSFORMATION RATESfor BARNET OM CRACKING and
OIL CRACKING to GAS
PrimaryKerogenCracking
SecondaryOil-to-GasCracking

Humble Geochemical Services
432Tmax TOC S2 HI
5.21 19.80 380435 4.53 13.45 297437 4.11 10.27 250443 3.77 5.88 156455 3.41 1.81 53470 3.32 1.36 41
CONVERSIONTO OIL and
GAS
INCREASINGTHERMALMATURITY
89%36%
TOCp / 0.64 = TOCo
Remainingpotentialdecreases
Tmax increases
TOC HIOriginal TOCs can be
back calculated on high maturity samples:
Experimental Conversion of Barnett Shale

Humble Geochemical Services
Barnett Shale - Ave. Values
• T. P. Sims #2 Newark East Field(n=46)– 4.45 TOC– 0.60 S2– 555 Tmax– 44 HI– 6 NOC– 13 BO/AF
6.95%TOCorig
30.9- or -
676 BO/AF0.9 BBO20 TCF
S2orig
If acrossNewark E.
Field

Humble Geochemical Services
Transformation Ratio
A measure of the extent of kerogen conversion
• to determine this with reasonable accuracy, the original potential of the soruce rock must be determined
• multiple formulasS2original – S2present / S2original
HIoriginal –HIpresent / HIoriginal

Humble Geochemical Services
Newark East FieldT.P. Sims #2: Transformation Ratio
Original HI = 445 Present day HI = 44
TR = (445-44) / 445 x 100 = 89%i.e., the Barnett Shale in the Sims well
has lost 89% of its original hydrocarbon potential
Note: HI = mg HC/g TOC
Humble Geochemical Services
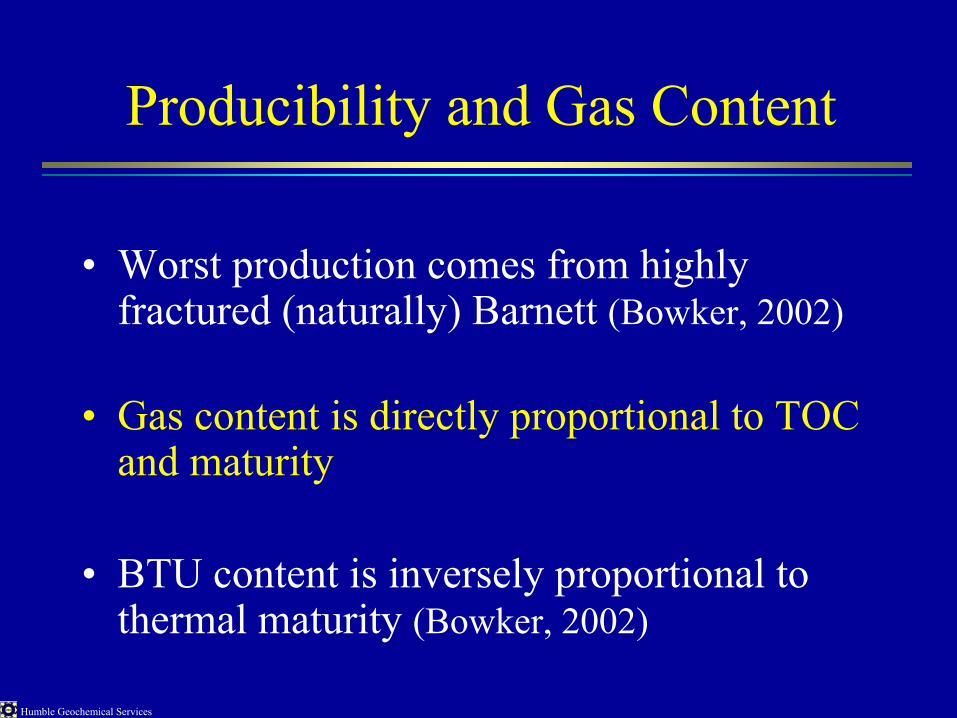
Producibility and Gas Content
• Worst production comes from highly fractured (naturally) Barnett (Bowker, 2002)
• Gas content is directly proportional to TOC and maturity
• BTU content is inversely proportional to thermal maturity (Bowker, 2002)

Humble Geochemical Services
Gas Yields Proportional to TOC values
y = 66.59x + 60.154R2 = 0.7642
0
100
200
300
400
500
600
700
800
0 2 4 6 8 10 12TOTAL ORGANC CARBON (TOC)
GAS
YIE
LD
Ref: Chattanooga Shale

Humble Geochemical Services
Volumetric Calculation Chart
1.E+06
1.E+07
1.E+08
1.E+09
1.E+10
1.E+11
1.E+12
1.E+13
1.E+09 1.E+10 1.E+11 1.E+12 1.E+13 1.E+14 1.E+15 1.E+16
MASS OF HYDROCARBONS (kg)
OIL
EQ
UIV
ALE
NT,
30o A
PI (b
bl)
1.E+11
1.E+12
1.E+13
1.E+14
1.E+15
1.E+16
1.E+17
GA
S EQ
UIV
ALE
NT
(ft3)
OIL EQUI.GAS EQUI.
Schmoker, 1994
Requires:
TOCHI originalHI presentSource thicknessSource areal extentSource density
Schmoker’s chart for conversionof hydrocarbon mass to volumes
of oil or gas equivalent
Humble Geochemical Services
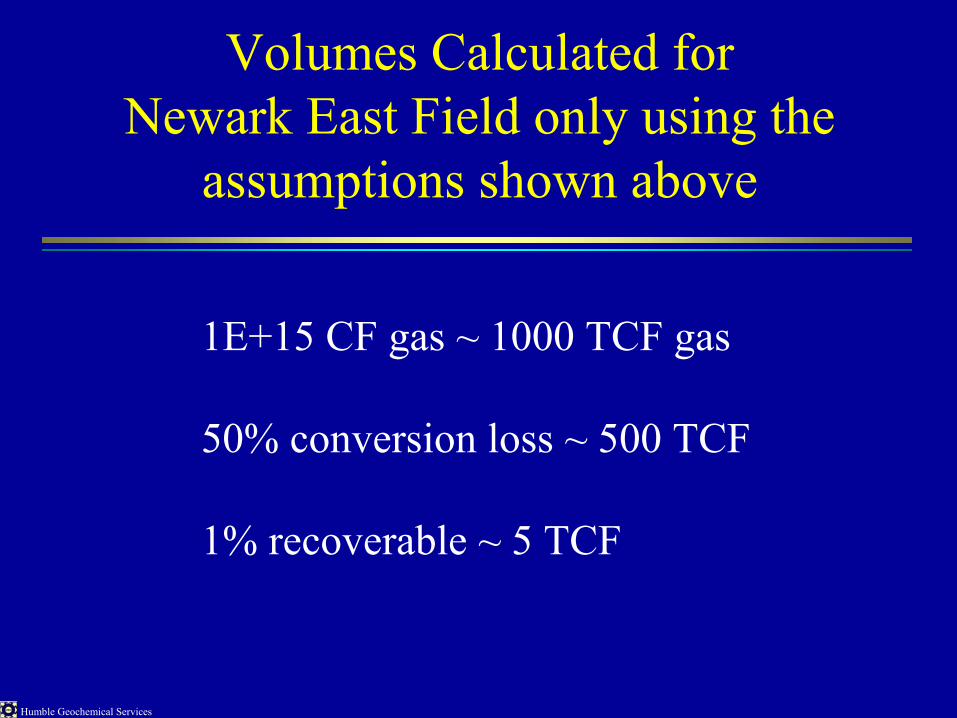
Volumes Calculated for Newark East Field only using the
assumptions shown above
1E+15 CF gas ~ 1000 TCF gas
50% conversion loss ~ 500 TCF
1% recoverable ~ 5 TCF

Humble Geochemical Services
JON ESF ISH ER
EA ST LA N DCA L LAH A N
BRO W N
CO M A NCH E
ER A TH
BO SQ UE
H IL L
M cL EN NA N
HO OD
SOM ER VILLE
JO HN SO N
TA RR AN TPA R KERPA LO P IN TOST EPH EN SSH AC K EL F OR D
THR OC KM O RTO N YO UN G
JA C K W ISE DEN TO N
M O NTA GUE
HA M IL TON
0 10 20 30Scale in Miles
N
Mills
San Saba Lampasas
Coryell
Ft. Worth Basin2000 PRODUCTION GORs by county
GOR=1000
GOR=3000
GOR=5000+
Source: TRRC
Gas Composition based on Production Results by County (ave.)
no production

Humble Geochemical Services
JON ESF ISH ER
EA ST LA N DCA L LAH A N
BRO W N
CO M A NCH E
ER A TH
BO SQ UE
H IL L
M cL EN NA N
HO OD
SOM ER VILLE
JO HN SO N
TA RR AN TPA R KERPA LO P IN TOST EPH EN SSH AC K EL F OR D
THR OC KM O RTO N YO UN G
JA C K W ISE DEN TO N
M O NTA GUE
HA M IL TON
0 10 20 30Scale in Miles
N
Mills
San Saba Lampasas
Coryell
Generalized Maturity Mapbased on TRCC production data (YTD 2000)
OilGas w/OilDry Gas
Humble Geochemical Services
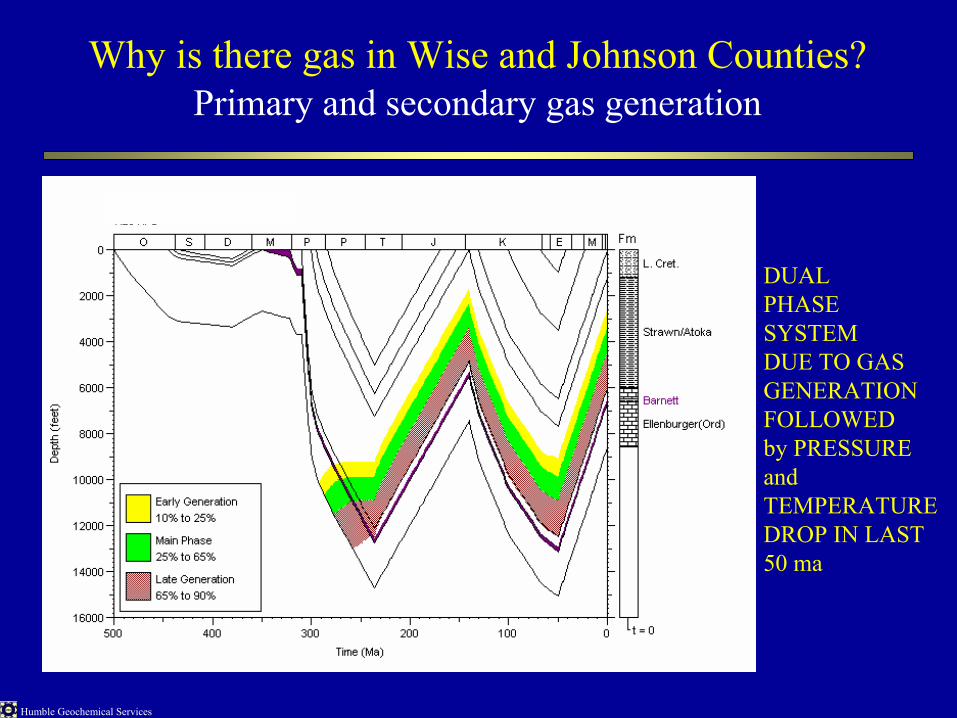
Why is there gas in Wise and Johnson Counties?Primary and secondary gas generation
DUALPHASESYSTEMDUE TO GASGENERATIONFOLLOWEDby PRESSUREandTEMPERATUREDROP IN LAST50 ma

Humble Geochemical Services
Johnson County: Calculated vs. Measured %Ro
Good matchbetween measured
and calculatedRo

Humble Geochemical Services
Why is there oil in Montague County?Burial History and Hydrocarbon Generation History
Maximumburialtemperaturesyield onlyoil

Humble Geochemical Services
Why wasn’t the ORYX GRANT #1 HORIZONTAL WELL COMMERCIAL FOR OIL?
0
50
100
150
200
7750 7800 7850 7900 7950 8000 8050
DEPTH (feet)
NO
RM
ALI
ZED
OIL
CO
NTE
NT
Productive Oil or Gas Intervals
Oil stains - shows
Lean - no production potential
Only 1 zone shows oil saturated Barnett

Humble Geochemical Services
Other wells have commercial oilthat is evident from simple tests
0
1 0 0 0
2 0 0 0
3 0 0 0
4 0 0 0
5 0 0 0
6 0 0 0
7 0 0 0
8 0 0 0
9 0 0 0
1 0 0 0 0
0 20 40 60 80 100 120 140 160 180 200NORMALIZED OIL CONTENT (mg oil/g TOC)
Reservoir ZonesShows(high maturity
source)
Lean Mod.oil
content
Zones yieldingabout 100 BO/day

Humble Geochemical Services
Eastland County: Also in gas zone,different burial history

Humble Geochemical Services
ViolaMarble Falls
Modified from Pallastro, 2002
The presence orabsence of top andbottom seals hasimpact on fracturing

Humble Geochemical Services
Risking Geochemical Data
• TOC – Quantity of Organic Matter– proportional to the amount of oil and gas
generated– impacts expulsion efficiency
0.0 to 1.0% : Poor risk for oil or gas> 1.0 % : Good risk for oil or gas
Remember in the gas window,TOC may be reduced 30-50%

Humble Geochemical Services
Risking Geochemical Data (cont.)
• Ro: 0.2%Ro to 4.0%Ro post mature
• 0.55%Ro = onset of oil generation• 0.90%Ro = peak oil generation• 1.10%Ro = wet gas generation window• 1.40%Ro = dry gas generation window• 2.10%Ro = dry gas only zone• > 2.10 %Ro = reservoir destruction,
CO2 risk
Poor Riskfor Gas
Good riskfor gas

Humble Geochemical Services
Risking Geochemical Data (cont.)
• TR: 0-100 % conversion of organic matter
– 0.0 to 50.0 % TR – primarily oil– 50.0 to 75.0% TR – mixed oil and gas– 75.0 to 90.0% TR – primarily gas– > 90.0% TR – primarily dry gas
Poor Riskfor Gas
Good riskfor gas

Humble Geochemical Services
Risking Geochemical Data (cont.)
• Gas yields: gas wetness ratios (0-100%)• gas flow gas yield• desorbed gas yield• macerated cuttings gas yield
– 0.00 to 50.0 : oil– 50.0 to 75.0 : mixed oil and gas– 75.0 to 90.0 : primarily gas– > 90.0 : dry gas
Poor Riskfor Gas
Good riskfor gas
Humble Geochemical Services
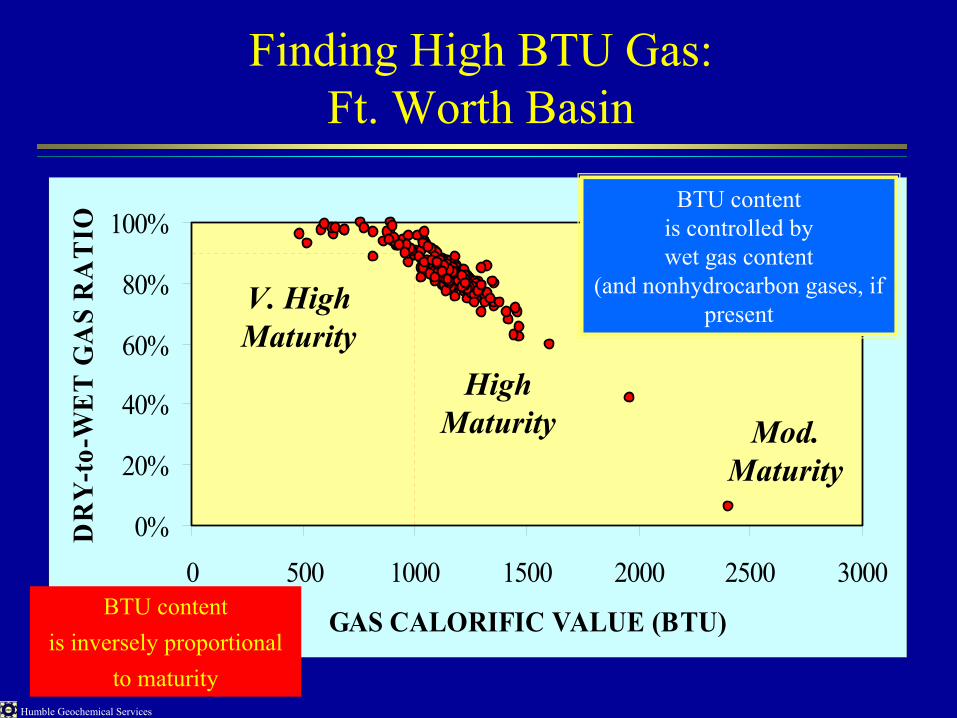
Finding High BTU Gas:Ft. Worth Basin
0%
20%
40%
60%
80%
100%
0 500 1000 1500 2000 2500 3000
GAS CALORIFIC VALUE (BTU)
DR
Y-t
o-W
ET
GA
S R
AT
IO
V. HighMaturity
HighMaturity Mod.
Maturity
BTU contentis controlled bywet gas content
(and nonhydrocarbon gases, if present
BTU contentis inversely proportional
to maturity

Humble Geochemical Services
Risking Geochemical Data (cont.)
• Seals
– Top seal (Marble Falls)– Middle seal (Forestburg)– Lower seal (Viola)
Poor Riskfor Gas
Good riskfor gas

Humble Geochemical Services
Risking Geochemical Data (cont.)
• Timing of expulsion / Uplift
– No charge build-up– Charge build-up and venting– Charge build-up and no venting
Poor Riskfor Gas
Good riskfor gas

Humble Geochemical Services
Risking Geochemical Data (cont.)
• Thickness of shale(must be considered jointly with TOC)
• Assume 4.5% TOC
– 10 ft.– 50 ft.– 100 ft.– 250 ft– 400 ft– 500+ ft
Poor Riskfor Gas
Good riskfor gas

Humble Geochemical Services
Shale Gas Evaluation Criteria:Geochemical Risk Factors
TOC [10]
Ro [2.2]
GAS [1000000]Tmax [600]
TR [1]
TOC < 1.00%
%Ro < 1.1
< 100,000 ppmheadspace gas
Tmax < 450
TR < 0.70
Minimum valuesfor gas prospects
Humble Geochemical Services
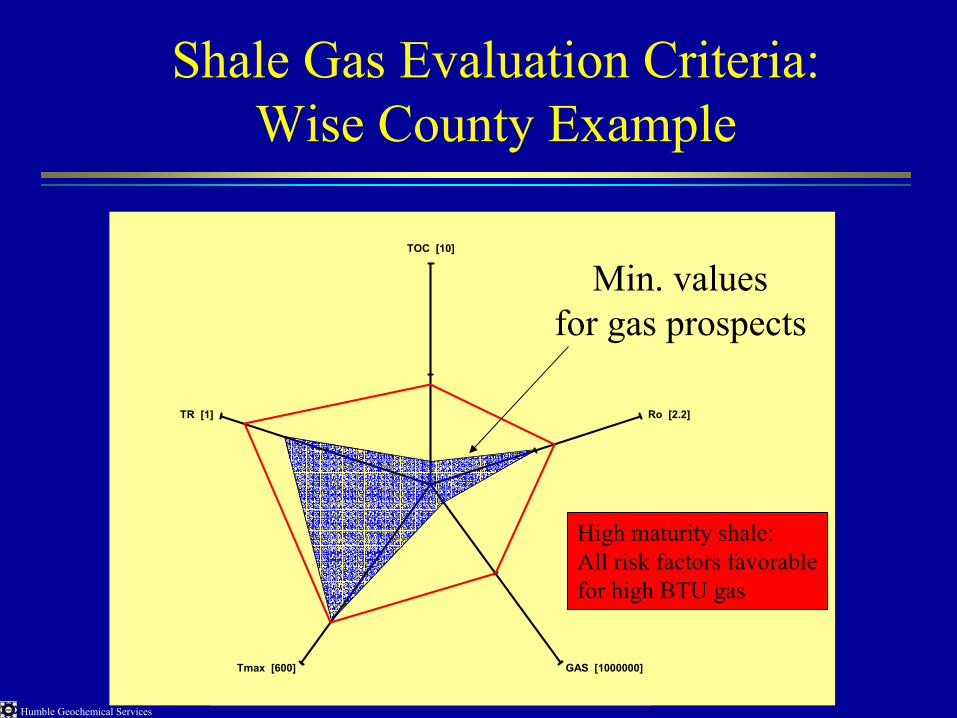
Shale Gas Evaluation Criteria:Wise County Example
TOC [10]
Ro [2.2]
GAS [1000000]Tmax [600]
TR [1]
High maturity shale:All risk factors favorablefor high BTU gas
Min. valuesfor gas prospects
Humble Geochemical Services
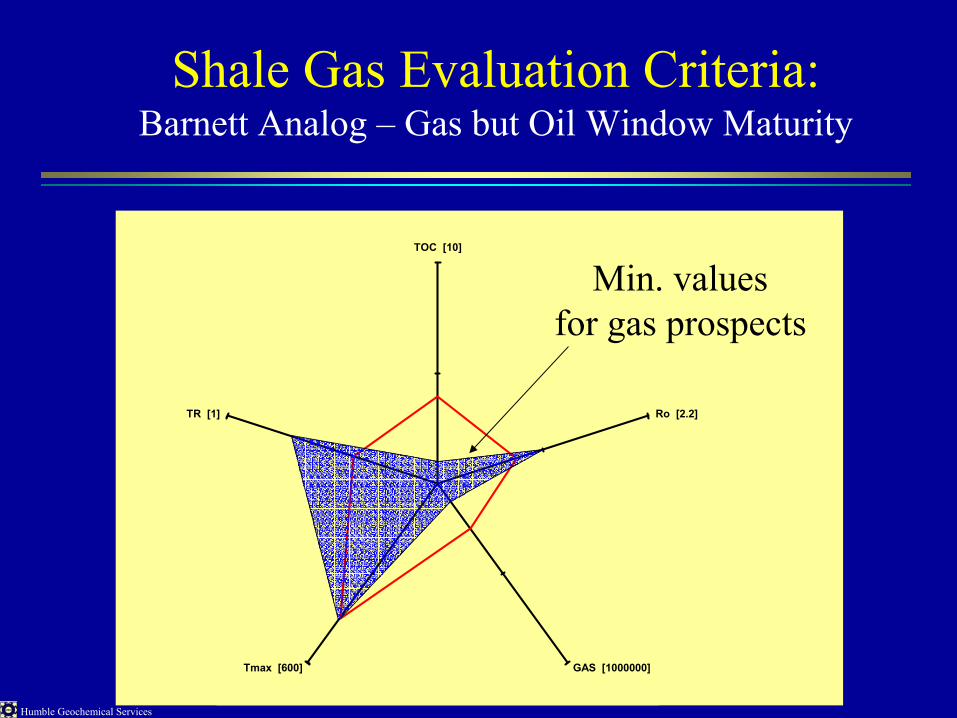
Shale Gas Evaluation Criteria:Barnett Analog – Gas but Oil Window Maturity
TOC [10]
Ro [2.2]
GAS [1000000]Tmax [600]
TR [1]
Min. valuesfor gas prospects

Humble Geochemical Services
Antrim Shale:Biogenic Petroleum System
TOC [10]
Ro [2.2]
GAS [1000000]Tmax [600]
TR [1]
Measured Antrim data
Min. valuesfor gas prospects
Humble Geochemical Services
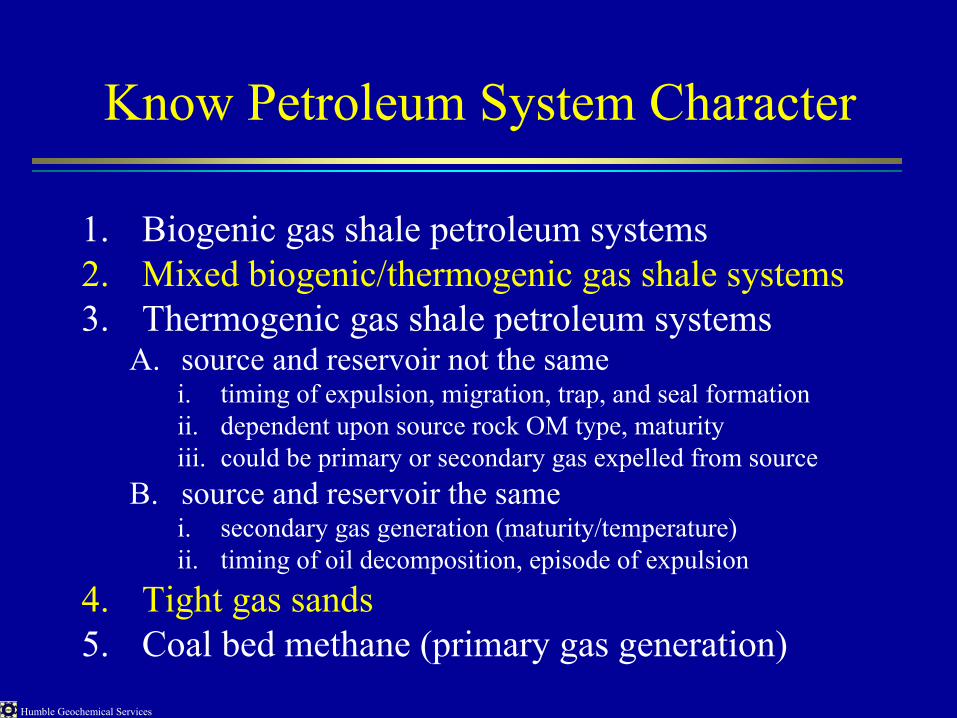
Know Petroleum System Character
1. Biogenic gas shale petroleum systems2. Mixed biogenic/thermogenic gas shale systems3. Thermogenic gas shale petroleum systems
A. source and reservoir not the samei. timing of expulsion, migration, trap, and seal formationii. dependent upon source rock OM type, maturityiii. could be primary or secondary gas expelled from source
B. source and reservoir the same i. secondary gas generation (maturity/temperature)ii. timing of oil decomposition, episode of expulsion
4. Tight gas sands5. Coal bed methane (primary gas generation)
Humble Geochemical Services
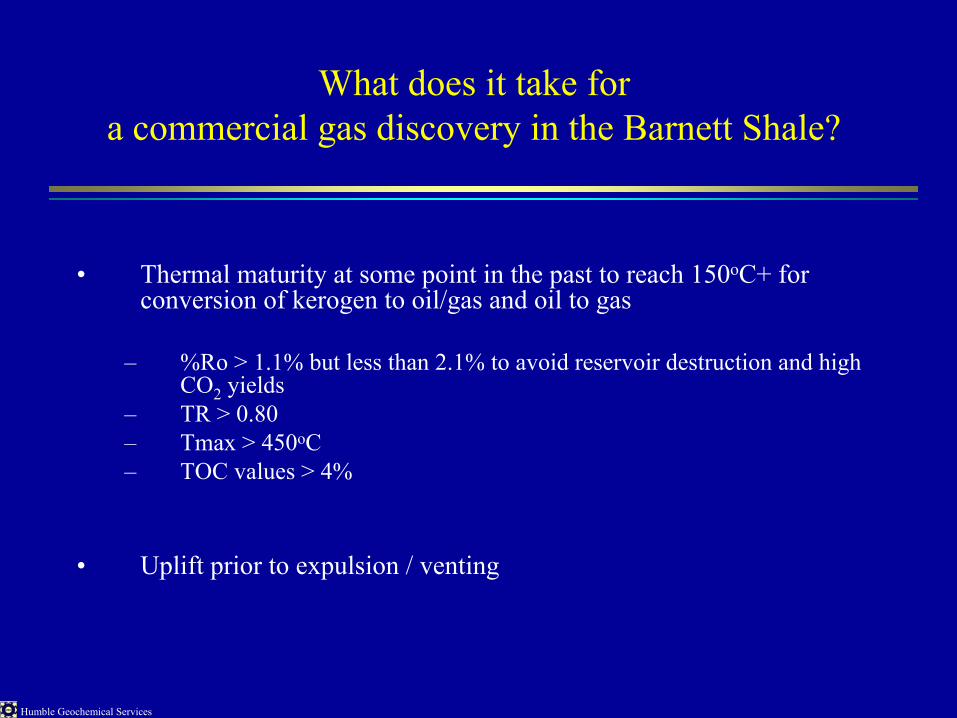
What does it take for a commercial gas discovery in the Barnett Shale?
• Thermal maturity at some point in the past to reach 150oC+ for conversion of kerogen to oil/gas and oil to gas
– %Ro > 1.1% but less than 2.1% to avoid reservoir destruction and high CO2 yields
– TR > 0.80– Tmax > 450oC– TOC values > 4%
• Uplift prior to expulsion / venting

Humble Geochemical Services
Evaluation of Gas Potentialwhile drilling – sweet spot identification
• Gas samples from gas flow line – new technique –an indication of “lost” gas (gas desorbed from the reservoir into the mud)
• Canned cuttings samples (desorbed gas) – the amount of gas (SCF/ton) that will be liberated from cuttings
• Cuttings gas analysis (gas liberated upon crushing cuttings – an indication of “frac” yields)
• TOC, Rock-Eval, TEGC, and vitrinite reflectance analyses (is it rich enough, converted enough (TR and Ro) to have generated commercial amounts of hydrocarbons)

Humble Geochemical Services
Using Gas Composition and Isotopesfor sweet spot and maturity assessments
-70.00
-65.00
-60.00
-55.00
-50.00
-45.00
-40.00
-35.00
-30.00
-25.00
-20.00-45.00 -40.00 -35.00 -30.00 -25.00 -20.00
δ 13C Ethane (ppt)
δ13C
Met
hane
, Pro
pane
(ppt
)
Methane vs. EthanePropane vs. Ethane
70%
50%
30%
20%
60%
40%
10%
Bact
eria
l Met
hane
3.00%
Ro=0.50%
1.20%
1.00%
0.70%
1.50%
2.00%
700
750
800
850
900
950
1000
1050
1100020406080100
GWR and LHR OVERLAY
GWRLHR
WellSweetSpots

Humble Geochemical Services
CONCLUSIONS
• Barnett Shale has world-class petroleum potential; limiting factors are – thermal maturity– episodic expulsion– seals (leaky through time due to venting)
• Other unconventional resources have similar characteristics, but also some unique twists
• Risks can be reduced by careful evaluation of thermal maturity (kerogen conversion) and timing of events (generation, expulsion)
Humble Geochemical Services
ReferencesArmentrout, John The Quest for Energy: Rewarding Careers in Petroleum Exploration, AAPG website slide set, February 2000 (http://www.aapg.org/slide_bank/armentrout_john/index.shtml).
Bowker, K.A., 2002, Recent development of the Barnett Shale play, Fort Worth Basin, RMAG Innovative Gas Exploration Concepts, Denver, CO October 1, 2002.
Burnham, A. K. and Robert L. Braun, 1990, Development of a detailed model of petroleum formation, destruction, and expulsion from lacustrine and marine source rocks, Advances in Organic Geochemistry 1989, Org. Geochem., Vol. 16, Nos. 1-3, pp. 27-39.
Claypool, G. E., and E. A. Mancini, 1989, Geochemical Relationships of Petroleum in Mesozoic Reservoirs to Carbonate Source Rocks of Jurassic Smackover Formation, Southwestern Alabama : AAPG Bulletin, v. 73, p. 904-924.
Demaison, G. and B. J. Huizina, 1994, Genetic Classification of Petroleum Systems Using Three Factors: Charge, Migration, and Entrapment, in: The Petroleum System – From Source to Trap, AAPG Memoir 60, L.B. Magoon and W.G. Dow, eds., AAPG, Tulsa, OK, 655 p.
Dembicki, Harry, 1986, Oil Show Detection by C5+ Hydrocarbon Mud Logging, SPE Formation Evaluation, pp. 331-334. Jarvie, Daniel M.,
Jarvie, Daniel M., Jack D. Burgess, Alex Morelos, Robert K. Olson, Phil A. Mariotti, and Robert Lindsey, 2001, Permian Basin Petroleum Systems Investigations: Inferences from Oil Geochemistry and Source Rocks, AAPG Mid-Continent Section Meeting, Amarillo, Texas, September 30-October 2, 2001, AAPG Bull. Vol. 85, No.9, pp. 1693-1694, oral presentation.
Jarvie, Daniel M., Brenda L. Claxton, Floyd "Bo" Henk,and John T. Breyer, 2001, Oil and Shale Gas from the Barnett Shale, Ft. Worth Basin, Texas, AAPG National Convention, June 3-6, 2001, Denver, CO, poster presentation.
Jarvie, Daniel M., 2001, Williston Basin Petroleum Systems: Inferences from Oil Geochemistry and Geology, The Mountain Geologist, Vol. 38, No. 1, pp. 19-41
Jarvie, Daniel M., Ron Hill, and Frank Mango, 2001, Effect of inorganic constituents on light hydrocarbon composition and compound distributions of crude oils, 20th International Meeting on Organic Geochemistry, Nancy, France, Sept. 10-14, 2001, abstract.
Jarvie, D.M., 1991, Total Organic Carbon (TOC) Analysis, in Treatise of Petroleum Geology, Handbook of Petroleum Geology, Source and Migration Processes and Evaluation Techniques, Ed. R.K. Merrill, AAPG Press, Tulsa, Ok.
Okui, A. and D. Waples, 1993, Relative permeabilities and hydrocarbon expulsion from source rocks, in: Basin Modelling: Advances and Applications, A.G. Dore et al, eds., NPF Special Publication No. 3, Elsevier, London, 675 p.
Schmoker, James., W., 1994, Volumetric Calculation of Hydrocarbons Generated, AAPG Memoir 60 The Petroleum System –From Source to Trap, L.B. Magoon and W.G. Dow, eds., pp. 323-326.

Humble Geochemical Services
Appendix
• Terms• Other graphics and maturity/TR/temp correlation
table• Barnett Shale: TOC and Rock-Eval values• Solution to Schmoker’s oil and gas volume
calculation• SPI calculations• Identifying sweet spots• Oil and water saturation curves for SS and Sh• Using geochemistry in unconventional gas plays

Humble Geochemical Services
Terms• TOC = total organic carbon (organic richness)• %Ro = vitrinite reflectance (thermal maturity indicator)• TR = transformation ratio (extent of conversion of kerogen where e.g.,
(HIo-Hip) / HIo• Rock-Eval S1 = free oil content in rock• Rock-Eval S2 = remaining kerogen content in rock• Rock-Eval Tmax = temperature at maximum S2 yield; an indication of
thermal maturity• Primary cracking kinetics = rate at which kerogen decomposes into
hydrocarbons (oil and gas)• Secondary cracking kinetics = rate at which oil decomposes into gas
Humble Geochemical Services
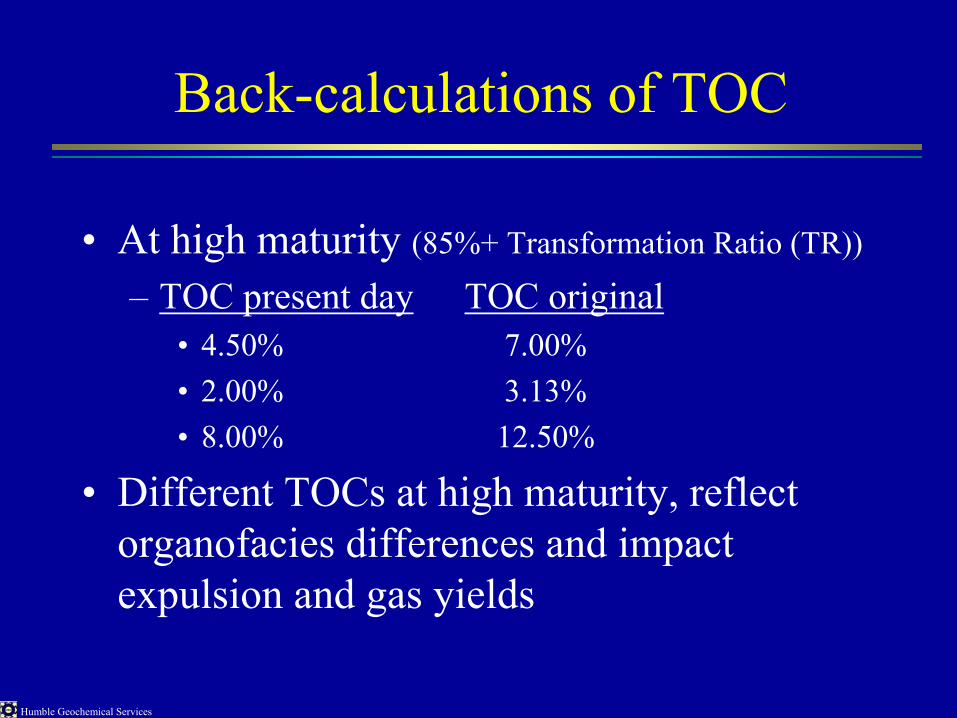
Back-calculations of TOC
• At high maturity (85%+ Transformation Ratio (TR))
– TOC present day TOC original• 4.50% 7.00%• 2.00% 3.13%• 8.00% 12.50%
• Different TOCs at high maturity, reflect organofacies differences and impact expulsion and gas yields

Humble Geochemical Services
Expulsion Efficiency is Related to TOC(but is dependent upon heating rate)
Temperature
Oil
Yie
ld (m
g O
il/g
TOC
) 10% TOC3% TOC1% TOC
Ref: Burnham and Braun, 1991
about 10oCseparation atlow heating
rates; decreases
with higherheating rates

Humble Geochemical Services
Derivation of HIoriginal
• From a database of samples of the same organofacies of low thermal maturity– average HI value
• From back calculation or estimation of original – estimate the original potential from HIpresent, visual
kerogen, Tmax, and Ro data
{Organofacies is a single, mappable unit of organic matter of the same type without regard to the inorganic matrix}

Humble Geochemical Services
BAKKEN CONVERSION WITH INCREASING DEPTH OF BURIAL
0
2000
4000
6000
8000
10000
12000
14000380 400 420 440 460 480 500
Rock-Eval Tmax
DEP
TH (f
t.)
Immature MainOil
Zone
WetGasZone
Dry
Gas
Zon
e
BakkenMaturityIncreases
with depth of burial
Price et al., 1984
Tmax showsa logarithmicincrease with
increasing depthof burial
Humble Geochemical Services
0
100
200
300
400
500
600
700
800
900
1000
330 380 430 480 530 580
Tmax (oC)
HYD
RO
GEN
IND
EX (m
g O
IL/g
TO
C)
Type IOil Prone
Type II (usu. marine)Oil Prone
Type IIIGas Prone
Type IV: Dry Gas Prone
Mixed Type II / IIIOil / Gas Prone
~0.60% Ro
~01.40% Ro
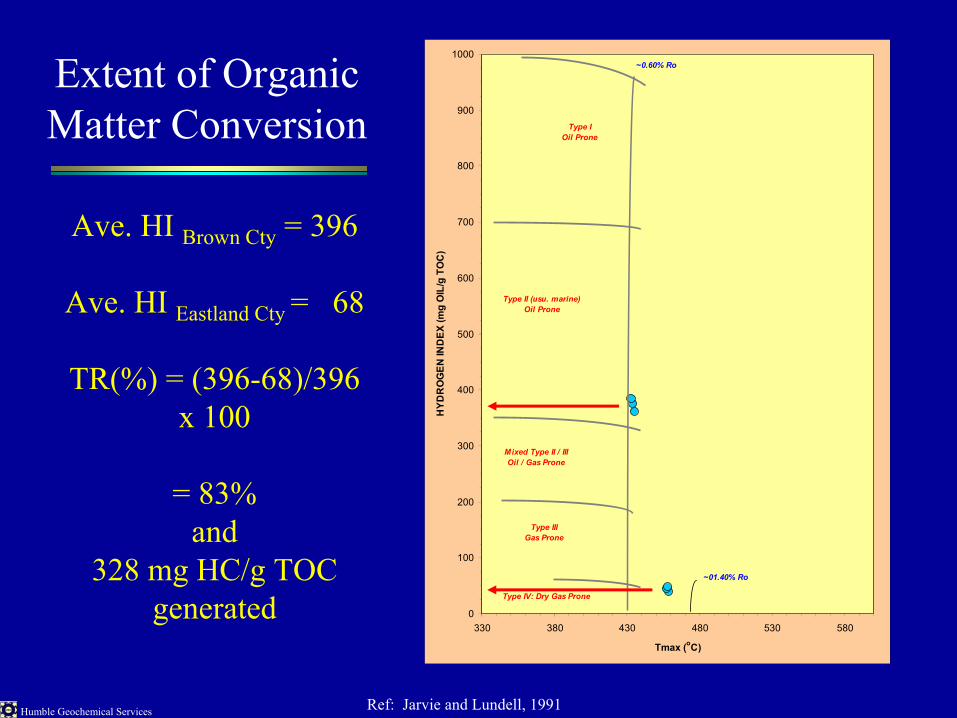
Ave. HI Brown Cty = 396
Ave. HI Eastland Cty = 68
TR(%) = (396-68)/396 x 100
= 83%and
328 mg HC/g TOCgenerated
Extent of OrganicMatter Conversion
Ref: Jarvie and Lundell, 1991

Humble Geochemical Services
Eastern Ft. Worth Basin:
NoRelationship
between depth of burial and
measured vitrinite
reflectance value
Immature Oil Zone Wet Gas Zone Dry Gas Zone
0.2 0.3 0.4 0.5 0.6 0.7 0.8 0.9 1.0 2.0
Ro (%)
-11000
-9900
-8800
-7700
-6600
-5500
-4400
-3300
-2200
-1100
0
Dep
th (f
eet)
Vitrinite Reflectance - Depth Plot
Humble Geochemical Services Division
Humble Geochemical Services
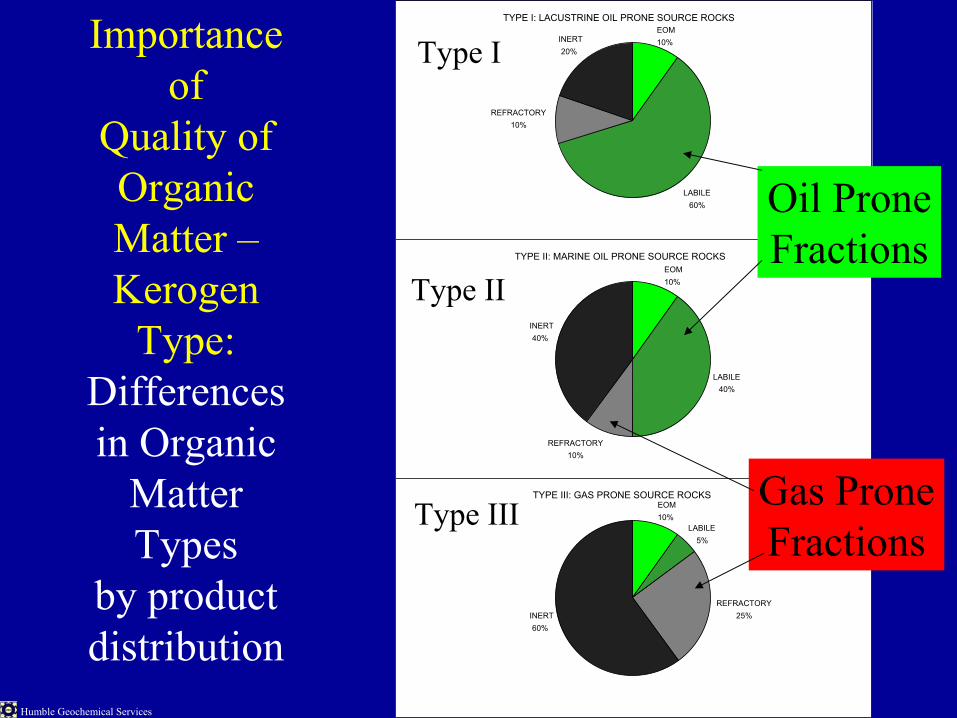
Importance of
Quality of Organic Matter –Kerogen
Type:Differences in Organic
Matter Types
by product distribution
TYPE I: LACUSTRINE OIL PRONE SOURCE ROCKS
LABILE60%
REFRACTORY10%
INERT20%
EOM10%
TYPE II: MARINE OIL PRONE SOURCE ROCKS
LABILE40%
REFRACTORY10%
INERT40%
EOM10%
TYPE III: GAS PRONE SOURCE ROCKS
REFRACTORY25%INERT
60%
LABILE5%
EOM10%
Oil ProneFractions
Gas ProneFractions
Type I
Type II
Type III

Humble Geochemical Services
Schematic Cross Section from Brown to Eastland County
Barnett Shale
Mitcham #1 A.E.A. Heirs #1
TOC=4.67%HI = 396Ro = 0.60%Tmax = 434
TOC=3.40%HI = 68Ro = 1.10%Tmax = 454
Bro
wn
Cty
East
land
Cty
Ref: Jarvie and Lundell, 1991

Humble Geochemical Services
Relative Correlation of Vitrinite Reflectance to Rock-Eval Tmax
0.2
0.4
0.6
0.8
1
1.2
1.4430 435 440 445 450 455 460 465 470
Rock-Eval Tmax (oC)
Vitr
inite
refle
ctan
ce (%
Ro)

Humble Geochemical Services
General Relationship betweenTransformation Ratio and %Ro
0.2
0.4
0.6
0.8
1
1.2
1.40 0.2 0.4 0.6 0.8 1
TRANSFORMATION RATIO (TR)
VITR
INIT
E R
EFLE
CTA
NC
E (%
Ro)

Humble Geochemical Services
Measured Oil Cracking in GOM at 3.0oC/my
y = 0.1196e0.0141x
R2 = 0.9997
0.2
0.4
0.6
0.8
1
1.2
1.4
1.6
1.8
2
2.2
100 120 140 160 180 200 220TEMPERATURE (oC)
VITR
INIT
E R
EFLE
CTA
NC
E (%
Ro)
0%
10%
20%
30%
40%
50%
60%
70%
80%
90%
100%Reservoir Temp.Fraction Oil Cracked
SecondaryCrackingof Oil to
Gas
Gulf ofMexico
CaseStudy
Claypooland Mancini,
1989

Humble Geochemical Services
Relative Flow Rates vs. Thermal Maturityin selected fields
0
200
400
600
800
1000
1200
1400
1600
1800
2000
0.2 0.7 1.2 1.7 2.2
VITRINITE REFLECTANCE (%Ro)
DA
ILY
RA
TE (M
CF)
For illustrationpurposes only:
too manyvariables to
be a universalequation
Humble Geochemical Services
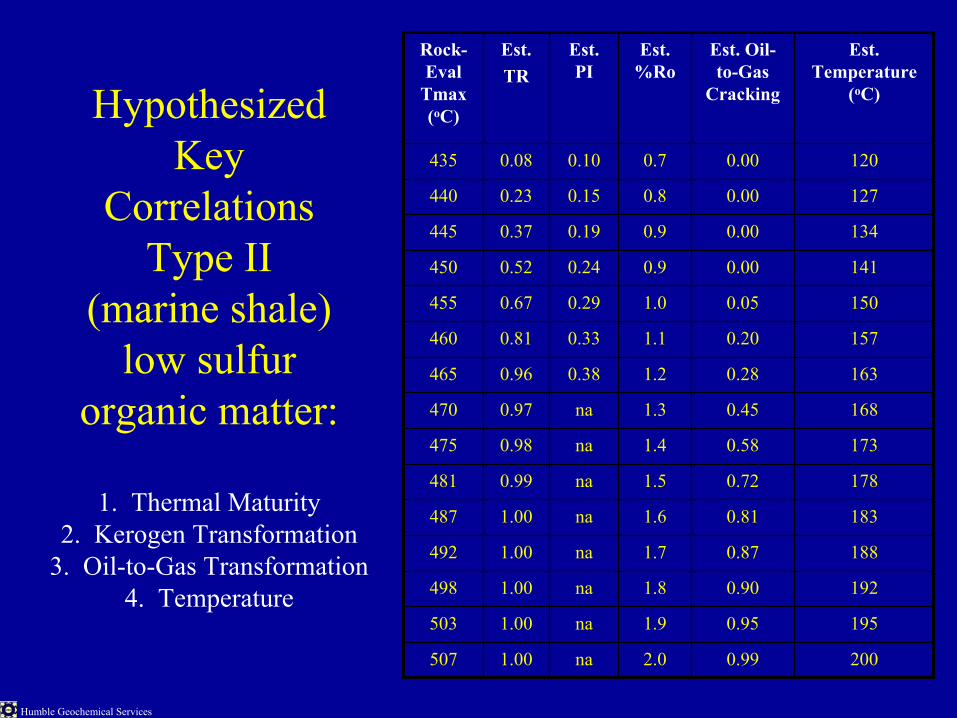
HypothesizedKey
CorrelationsType II
(marine shale)low sulfur
organic matter:
1. Thermal Maturity2. Kerogen Transformation
3. Oil-to-Gas Transformation4. Temperature
2000.992.0na1.00507
1950.951.9na1.00503
1920.901.8na1.00498
1880.871.7na1.00492
1830.811.6na1.00487
1780.721.5na0.99481
1730.581.4na0.98475
1680.451.3na0.97470
1630.281.20.380.96465
1570.201.10.330.81460
1500.051.00.290.67455
1410.000.90.240.52450
1340.000.90.190.37445
1270.000.80.150.23440
1200.000.70.100.08435
Est. Temperature
(oC)
Est. Oil-to-Gas
Cracking
Est. %Ro
Est. PI
Est.TR
Rock-Eval
Tmax (oC)

Humble Geochemical Services
Calculate Transformation Ratio
TR (mg HC/g TOC) = HIoriginal – HIpresent / HIoriginal
HIpresent = measured Hydrogen Index (HI) from sample at depth (mature) = 150
HIoriginal = measured Hydrogen Index (HI) from immature sample = 380
TR = (380-150) / 380 = 0.61 or 61% conversion

Humble Geochemical Services
Barnett Shale - Ave. Values
• All Barnett(n=540)– 3.16 TOC– 2.52 S2– 449 Tmax– 23 HI– 21 NOC– 55 BO/AF
• Low maturity Barnett(n=36)– 3.26 TOC– 7.87 S2– 432 Tmax– 165 HI– 33 NOC– 172 BO/AF
(in both cases primarily cuttings analysis)

Humble Geochemical Services
Barnett Shale - Ave. Values
• Lampasas Outcrops(n=3)– 11.82 TOC– 47.26 S2– 426 Tmax– 395 HI– 31 NOC– 1035 BO/AF
• Sims Core(n=46)– 4.45 TOC– 0.60 S2– 555 Tmax– 44 HI– 6 NOC– 13 BO/AF

Humble Geochemical Services
Barnett Shale: Petroleum Yields
0
200
400
600
800
1000
1200
1400
Oil (BO/AF)
Min.Ave.Max.

Humble Geochemical Services
Newark East FieldVolumetric Calculation
• Calculate mass of organic carbon• Assumptions
– 25 x 37 mi areal extent (2.395739e+13 cm2)– 450 ft. thick (U. and L. Barnett) (13,716 cm)– V = 3.2859956e+17 cm3
– density at 2.4 g/cm3
– TOCpresent = 4.50; TOCoriginal = 6.95– Mass (g TOC) = 3.6540271e+16 g TOC

Humble Geochemical Services
Calculation of Mass of HCs per gram of TOC
• M = HIo – HI p= 380 – 44= 336 mg hydrocarbons / g TOC

Humble Geochemical Services
Calculate Hydrocarbons Generated (HCG)
• HCG (kg HC) = R x M x 10-6 kg/mgR in mg HC/g TOCM in g TOC10-6 kg/mg is a conversion from mg to kg
HCG = 336 mg HC/g TOC x 3.6540271e+16 g TOCx 10-6 kg/mg
= 1.2277531e+13 kg HC

Humble Geochemical Services
Schmoker’s Volumetric Calculation Chart
1.E+06
1.E+07
1.E+08
1.E+09
1.E+10
1.E+11
1.E+12
1.E+13
1.E+09 1.E+10 1.E+11 1.E+12 1.E+13 1.E+14 1.E+15 1.E+16
MASS OF HYDROCARBONS (kg)
OIL
EQ
UIV
ALE
NT,
30o A
PI (b
bl)
1.E+11
1.E+12
1.E+13
1.E+14
1.E+15
1.E+16
1.E+17
GA
S EQ
UIV
ALE
NT
(ft3)
OIL EQUI.GAS EQUI.
Schmoker, 1994

Humble Geochemical Services
Source Potential Index (SPI)
• A measure of the potential of a source rock to generate hydrocarbons over a given areal extent
• SPI = h (S1+S2) p / 1000– where h = thickness of source rock– S1+S2 data from Rock-Eval (mg HC/g rock)– p = density, assume 2.5 t/m3
• Must also account for migration and entrapment styles
Ref: Demaison and Huizinga, 1994

Humble Geochemical Services
SPI – Barnett Shale, Wise County• Assumptions:
– h = 250 ft. or 76.2 m– S1+S2 = 20.00 t/kg rock– p = 2.50 t/m3
• SPI = 76.2 x 20 x 2.5 / 1000= 3.81 t / m2
• Add U. Barnett (150 ft.)= 6.10 t / m2
• Increase S1+S2 (27.79 ave. per unit TOC) based on Lampasas outcrop yields
= 8.34 t / m2
• Maximum S1+S2 at Lampasas = 47.75= 14.38 t / m2
Humble Geochemical Services
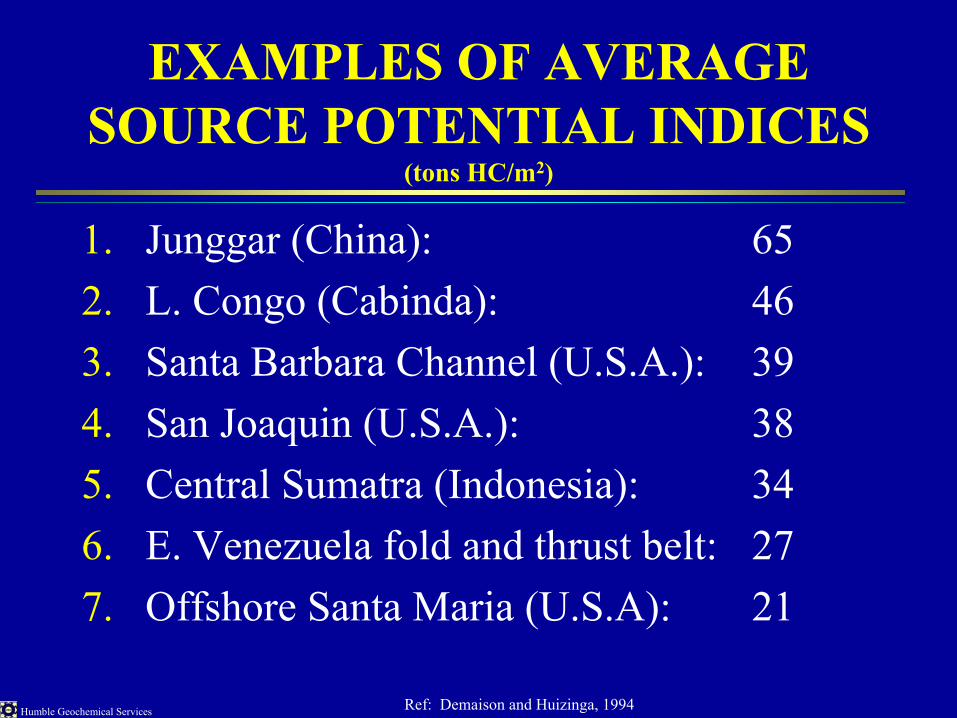
EXAMPLES OF AVERAGE SOURCE POTENTIAL INDICES
(tons HC/m2)
1. Junggar (China): 652. L. Congo (Cabinda): 463. Santa Barbara Channel (U.S.A.): 394. San Joaquin (U.S.A.): 385. Central Sumatra (Indonesia): 346. E. Venezuela fold and thrust belt: 277. Offshore Santa Maria (U.S.A): 21
Ref: Demaison and Huizinga, 1994
Humble Geochemical Services
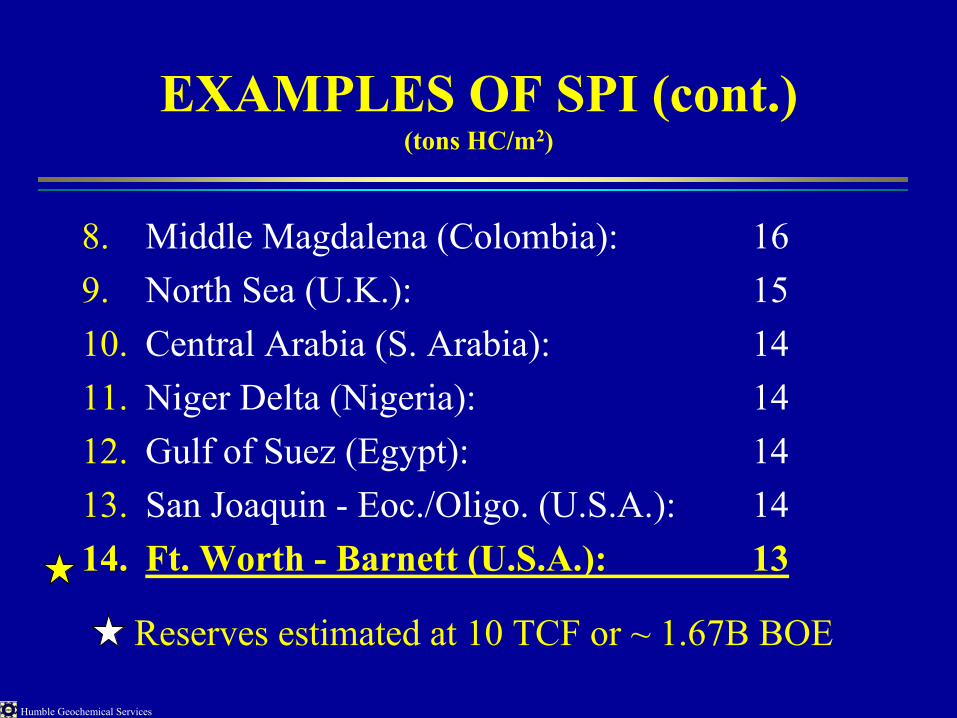
EXAMPLES OF SPI (cont.)(tons HC/m2)
8. Middle Magdalena (Colombia): 169. North Sea (U.K.): 1510. Central Arabia (S. Arabia): 1411. Niger Delta (Nigeria): 1412. Gulf of Suez (Egypt): 1413. San Joaquin - Eoc./Oligo. (U.S.A.): 1414. Ft. Worth - Barnett (U.S.A.): 13
Reserves estimated at 10 TCF or ~ 1.67B BOE
Humble Geochemical Services
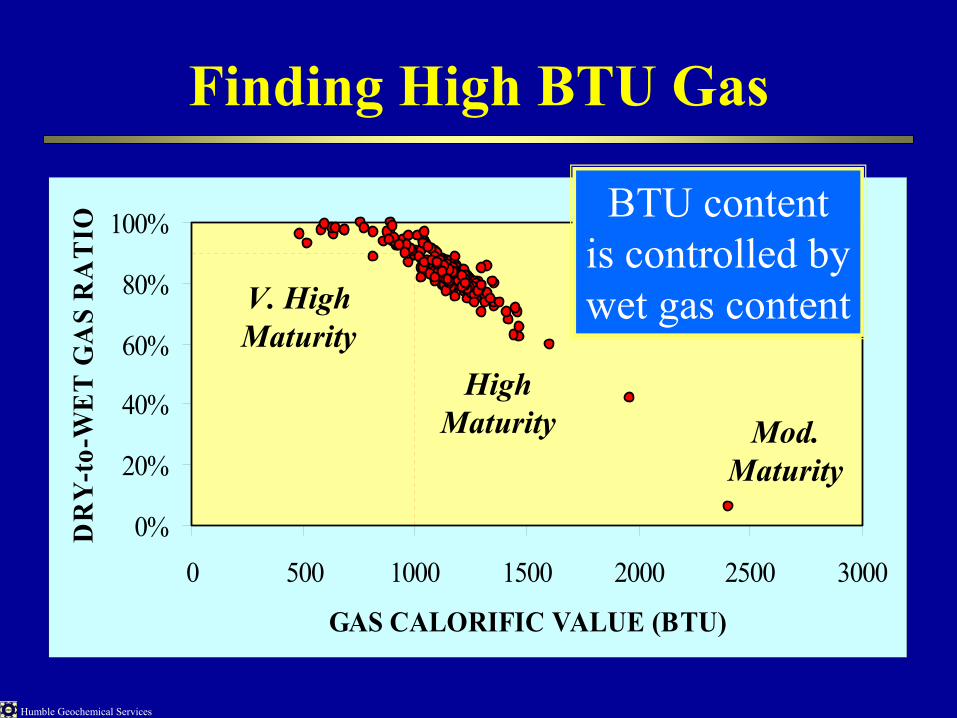
Finding High BTU Gas
0%
20%
40%
60%
80%
100%
0 500 1000 1500 2000 2500 3000
GAS CALORIFIC VALUE (BTU)
DR
Y-t
o-W
ET
GA
S R
AT
IO
V. HighMaturity
HighMaturity Mod.
Maturity
BTU contentis controlled bywet gas content

Humble Geochemical Services
Identification of oil, wet or
dry gasby
fingerprinting directly from
cuttings or core chips:
TEGCAlso useful
for GORprediction
Oil Prone
Gas Prone
min0 2 4 6 8 10 12 14 16
pA
0
100
200
300
400
500
FID1 A, (C:\PROJECTS\MEC\H00-11~1\TEGC\31220000.D)
C9
C10 C
11
C12
C13
C14
C15
C16
C17
C18
C19
C20
C21
C22
C23
C24
C25
C30
C35
min2 4 6 8 10 12 14 16 18
pA
0
50
100
150
200
250
300
350
400
450
FID1 A, (C:\PROJECTS\MEC\H00-11~2\H00-11~1\31560000.D)
C9
C10
C11
C12
C13 C
14
C15
C16
C17
C18
C19
C20

Humble Geochemical Services
C7-determined Generation Temperatures for Barnett Oils
1.00
1.20
1.40
1.60
1.80
2.00
2.20
80 90 100 110 120 130 140 150
A V ER A GE GEN ER A T ION TEM PER A T U R E ( o C )
SPEARFISH
TYLER
CHARLES - M. CANYON
LODGEPOLE
BAKKEN
NISKU
DUPEROW
DAWSON BAY
WINNIPEGOSIS
INTERLAKE
RED RIVER
WINNIPEG
DEADWOOD
Barnett Oilson trend linewith Bakken oils
IncreasingGOR

Humble Geochemical Services
GORs can be predicted with some degree of accuracy from both vitrinite reflectance and
oil/condensate light hydrocarbons
Oil
Wet Gas
DryGasR2 = 0.9233
010002000300040005000600070008000
0 0.5 1 1.5 2CAL. VITRINITE REFLECTANCE (%Ro)
CA
L. G
OR

Humble Geochemical Services
TYPICAL SANDSTONE RESERVOIR ROCK
WATER SATURATION (%)
REL
ATI
VE
PER
MEA
BIL
ITY
Kro
Krw
Kromax
Krwmax
Krx
Swirr Swx Swc
1.0
0.90.80.70.6
0.5
0.4
0.30.20.1
0.00 10 20 30 40 50 60 70 80 90 100

Humble Geochemical Services
TYPICAL SHALE RESERVOIR ROCKis quite different from a conventional reservoir
WATER SATURATION (%)REL
ATI
VE
PER
MEA
BIL
ITY
Kro
Krw
0 10 20 30 40 50 60 70 80 90 100
1.0
0.90.80.70.6
0.5
0.4
0.30.20.1
0.0
Ref: Okui and Waples, 2000

Humble Geochemical Services
Using Geochemistryin Unconventional Plays
• Construct maps• Organic facies (maceral) maps • Maturity and TR maps• Composition (GOR) maps• BTU maps
• Needs to construct maps• Geological/geophysical information• Geochemical data (TOC, RE, Ro, Compo.)

Humble Geochemical Services
Using Geochemistryin Unconventional Plays
• Construct well and basin models– Burial history curves– Timing of generation and expulsion
• Evaluate amounts expelled (reduces amount of oil to crack to gas)
• Timing of uplift impacts expulsion• Optimize models using geochemical data
such as TOC, Ro, TR