the benefits of multi-dimensional modelling
TRANSCRIPT

Benefits of a Multi-Dimensional Model An Oracle White Paper May 2006
Benefits of a Multi-Dimensional Model
Executive Overview.......................................................................................... 3 Introduction ....................................................................................................... 4 Multidimensional structures............................................................................. 5
Overview........................................................................................................ 5 Modeling the Business ................................................................................. 5 Dimensions.................................................................................................. 13
Levels ....................................................................................................... 13 Hierarchies............................................................................................... 14 Dimensional Queries Conditions......................................................... 17 Multi-Dimensional Queries .................................................................. 19
Validating Queries ...................................................................................... 19 Cubes .............................................................................................................. 8 Measures......................................................................................................... 8
Joins............................................................................................................ 9 Cube based Calculations........................................................................ 11
Conclusion........................................................................................................ 22
The Benefits of a Multi-Dimensional Model Page 2
Benefits of a Multi-Dimensional Model
EXECUTIVE OVERVIEW The challenge facing every organization today is the sheer quantity of data being captured, at monthly, week, daily and hourly levels. With advancement of technology, the issue of how to store this ever-growing volume of data becomes less of a concern than simply how to effectively analyze it.
Every organization knows they have the data to allow their users to generate competitive advantages, if only they could access it in the correct manner and format. The ability to understand the buying patterns within a customer base can make a huge difference to the corporate bottom line. However, for many users the ability to create situations that generate competitive advantages are constrained by the complexity of the underlying data model.
Users cannot, and do not wish, to understand these complexities. Many tools and products fail to protect users from the most difficult concepts such as table joins and sequencing. These complexities discourage users from exploring and analyzing their underlying schema and at worst, create queries that while syntactically correct return factually incorrect results.
One solution to this issue is to encapsulate a relational schema within business definitions and then encapsulate the query language and syntax around simple business related objects such as cubes, measures and dimensions. These objects are already pre-joined and pre-aggregated so users get consistent syntactically and factually correct results every time. This business-oriented environment is often referred to as Online Analytical Processing (OLAP).
OLAP environments provide powerful analytical data sources that users can interrogate to follow trends, patterns and anomalies within a cube across any dimension. Oracle OLAP provides analytical calculation options such as statistical, forecasting, planning and regression features that help users intelligently manage their business.
The aim of this paper is to explore how the use of multi-dimensional models within data warehouse environments provides users with the ability to create business driven queries that allow them to intelligently analyze their data.
The Benefits of a Multi-Dimensional Model Page 3

INTRODUCTION So why do users find the OLAP model so compelling? Users converse everyday using business language. They describe their environment in terms of sales, costs, distribution channels, customers, time, etc. The data supporting these business definitions is typically stored in relational tables. To create queries using these tables, users need to understand how the various tables within the database relate to one another. The nature and structure of the query language is forced on users, which in many cases is alien to them. Ideally, business users want to query their data using the same definitions and terms they use in the normal workplace interactions.
Many ad-hoc query tools provide their own structure, or metadata, layer to further enhance the end user experience. These additional metadata layers can be used to store more information about the relationship between tables and columns. In some cases, these additional structures provide other benefits to users, such as providing the ability to drill across related columns. However, this additional metadata is mostly used to control formatting and layout within a report.
The full potential of these additional structures is not fully exploited by general reporting tools. To get the full benefits of adding structure to a data warehouse schema it is necessary to move from a pure relational data model to a multi-dimensional data model.
Users expect their data to be structured around business entities (dimensions) and data items (cubes/measures). The following sections of this document explain the benefits of using the multi-dimensional model, which is based on three key concepts:
o Modeling business rules
o Cube and measures
o Dimensions
Within a reporting tool, these concepts allow users to create powerful and business focused queries quickly and easily that return consistent and valid analysis as the user extends the query during additional drill-down and pivot operations.
The Benefits of a Multi-Dimensional Model Page 4

MULTIDIMENSIONAL STRUCTURES
Overview The need for a deep understanding of query technology is not an ideal solution for all users within an organization. In relational analysis there is one basic storage structure, a flat table. This object takes on many different roles depending on how it relates, or joins, to other tables. In a star schema, fact tables and dimension tables describe the relationship between the various tables within the schema. The fact table is usually the main driver within the query.
In multi-dimensional analysis the same basic structures also exist. The fact table is referred to as a cube, and the columns within the table are referred to as measures. Each cube has additional structures over and beyond a simple table. The cube has edges, which are referred to as dimensions. Each dimension is a grouping of common or related columns from one or more tables into a single entity. For example a Product dimension could be based on a single or collection of tables containing columns that refer to categories, sub-categories, and products.
All these structures (cubes, measures and dimensions) interact with each other to provide an extremely powerful reporting environment. Each object adds new levels of interactivity when it is fully exploited.
The use of a multi-dimensional model does not exclude the use of SQL as the query language. It merely requires the supporting query products to understand and exploit the additional structural metadata, provided by the multi-dimensional environment. In fact, Oracle’s OLAP BI reporting products all use SQL to execute multi-dimensional queries although this is of no interest to end users who want to be insulated from any database semantics. Users want to interact with their data using business terms and objects without having to comprehend the underlying storage model. The abstraction of the physical storage model from the logical presentation model is key to the success of multi-dimensional models.
Figure 1 – Product Dimension
Modeling the Business Using a relational data model and mastering the concept of table joins is an easy task. Most ad-hoc query tools do a good job of protecting the user community from the basic relational concepts. Tables and views are usually mapped to concepts such as folders. An administrator creates all the required joins and adds additional metadata to enhance the relational objects by changing the names of columns and folder names.
The Benefits of a Multi-Dimensional Model Page 5
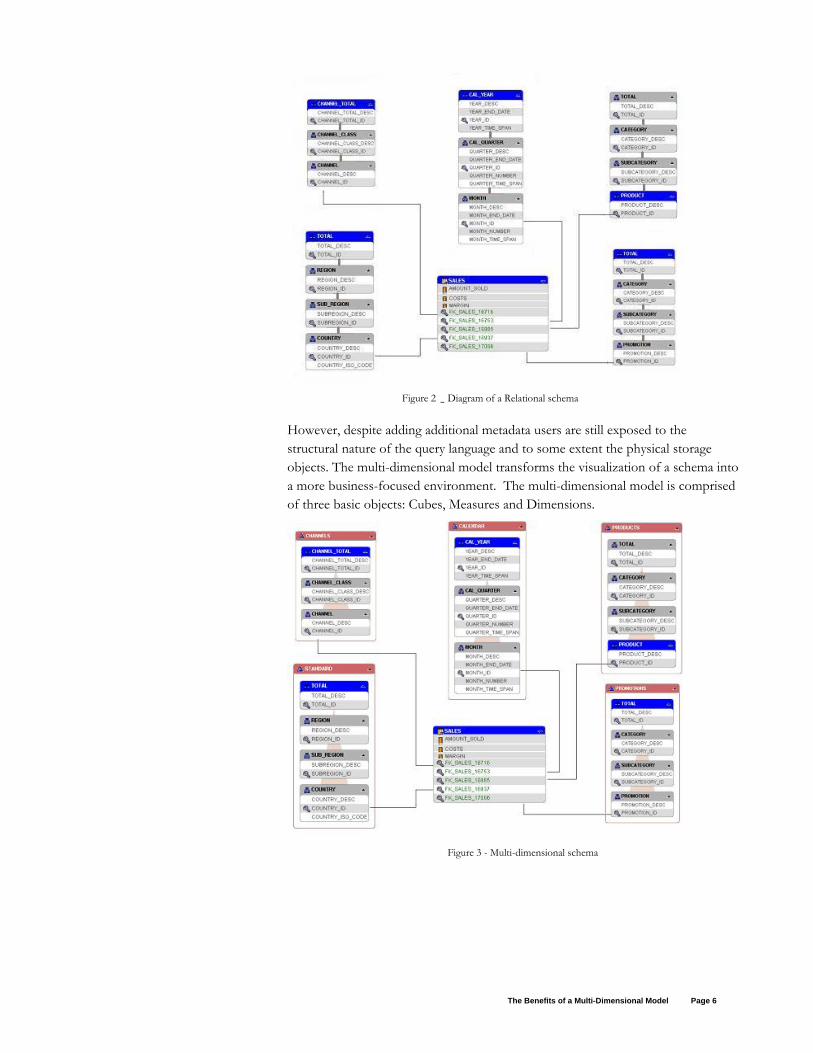
Figure 2 - Diagram of a Relational schema
However, despite adding additional metadata users are still exposed to the structural nature of the query language and to some extent the physical storage objects. The multi-dimensional model transforms the visualization of a schema into a more business-focused environment. The multi-dimensional model is comprised of three basic objects: Cubes, Measures and Dimensions.
Figure 3 - Multi-dimensional schema
The Benefits of a Multi-Dimensional Model Page 6

Cubes are extrapolated from fact tables. Cubes contain measures that share common dimensionality, and the measure is linked to a single column from the fact table. Each incorporates business rules directly within its definition.
When users select facts to include within a report they typically have to determine the type of aggregation to apply. This can be easy for simple facts such as revenue or costs. However, getting the correct answer with more complex facts such as headcount or stock can be problematic. As many business users know many facts have complex business rules that define how they can be aggregated. For example a fact such as stock does not typically need to be aggregated over time since its values represent a position at a given point in time. So although stock can be aggregated using a SUM() operator over products, over time the last value is required. To expect users to understand these business rules when writing queries is not reasonable. These rules should be encapsulated directly within the business model and not exposed to users. The multi-dimensional model uniquely provides this level of insulation; users are never prompted to select the type of aggregation to apply for a fact.
Figure 4 - Embedded Business Rules
Dimensions group multiple columns from one or more tables into one single entity organized around one or more hierarchies and ordered by levels. These objects can then be used to provide a very simple query interface as shown below.
The Benefits of a Multi-Dimensional Model Page 7

Figure 5 - Multi-dimensional Model
Cubes A cube is a logical organization of multidimensional data. A cube is derived from a fact table. Dimensions categorize a cube’s data and a cube contains measures that share the same dimensionality. Cubes are not usually exposed to end-users since they are more interested in the measure(s) contained within the cubes.
Measures Measures are just like arrays and are automatically associated to the physical fact table column and related dimension tables. This transformation from fact table column to measure insulates the user from the complexity of the underlying schema and from the need to understand how the various parts of the schema are joined together.
Measures can share dimensions. So for example price and cost would probably share the same dimensions: Product, Channel and Time. However, a measure such as quantity sold might be dimensioned by Product, Geography, Channel and Time. Within an OLAP environment, it is extremely easy to create new measures such as sales revenues and sales costs by simply multiplying quantity * price and quantity * unit cost respectively. The resulting variables are in fact dimensional and share the same structure as quantity, so the new measure are dimensioned by Product, Geography, Channel and Time.
When using Oracle’s multidimensional OLAP Query Builder, the user first selects the measure(s) they want to analyze. The selection of a measure or group of measures can be set to automatically select all the associated dimensions, so joins are automatically managed for the user.
The Benefits of a Multi-Dimensional Model Page 8

Joins
The relational data model is driven by the need to join various tables together. The complexity and number of these joins depends on the complexity of the schema. With the Oracle 10g Common Schema, the joins are relatively simple as this is modeled on a star schema.
Figure 6 - Oracle 10g Common Schema Star Schema Map
The star schema simplifies the data model for relational query tools. However, the user still needs to decide which tables and required columns to include within a query and which to ignore. The exclusion of columns/tables from a query materially affects the result and it is the responsibility of the user to understand the implications of excluding columns from the query.
End users can also quickly break through this simplistic layer into other more complex details as they attempt to interact with the data model by drilling and/or adding analytical calculations to their query. In contrast, the multidimensional environment insulates the user from the underlying schema because the query tool manages the join process for the user. The user can then concentrate on analyzing the data without worrying about the supporting schema structures.
This is one of the great advantages of the multi-dimensional model since it removes the need to join tables together to generate a result set and to understand the impact of making or not making a join to a specific table. The multidimensional model of the relational star schema is extremely simple, as shown below.
The Benefits of a Multi-Dimensional Model Page 9

Figure 7 - Oracle 10g Common Schema Multi-dimensional Model
The key to the power of measures within this model is based on providing a consistent view of information for all users. Since dimensions bound measures, various users can slice a cube differently to generate a personalized view of the measure(s). For example, brand managers study groups of products across many time periods and markets while financial analysts focus on the current and previous time period for all markets and all products. Regional sales reps examine all time periods and all products across selected markets. And strategic executives might focus on a subset of the corporation’s data, such as the current and next quarters for an innovative product being sold only in a specific region.
Users display and manipulate these different views of the same data without having to specify or understand the cube’s structure. In contrast, many relational based reporting environments require awkward self-join statements to create these kinds of multiple views.
Because multidimensional data is implicitly joined, the following types of queries tend to execute faster in a multi-dimensional model than in relational models:
o Reports that involve hierarchies. In multi-dimensional models, hierarchical relationships are explicit objects in the database. These relationships define the levels of the hierarchy and the members within each level. Thus, queries and reports reference these relationships instead of creating new relationships via joins. Users select which hierarchy they want to use then select which levels of the hierarchy to display.
The Benefits of a Multi-Dimensional Model Page 10

o Period-to-period comparisons. The multi-dimensional model accomplishes period-to-period comparisons by using matrix arithmetic. Matrix operations can perform calculations on both columns and rows of data.
Cube based Calculations
A multi-dimensional model is extensible. Users need to be able to add additional calculations quickly and easily. The creation of calculations needs to insulate the user from the structure of the associated cubes.
Figure 8 - Creating Calculated Measures
Oracle’s multi-dimensional Calculation Builder provides a simple easy to use interface for creating derived calculations or cubes. End-users define new metrics using templates, which eliminates the need to understand the underlying implementation details.
Most data warehouse implementations track revenue. From a reporting perspective revenue per-se is an important measure to monitor. However, most users would be more interested in tracking revenue growth. The multi-dimensional model contains a special type of dimension called Time. A time dimension contains important metadata that allows the multi-dimensional engine to understand time-based analysis. By understanding the structures or levels that define a time dimension, it is possible to create a single calculation, such as % growth based on prior period. The model is able to correctly determine the prior period for each level in the hierarchy, such that it knows Q1 is the prior period for Q2 and January is the prior period for February.
These calculations are all managed via templates. These templates are organized by type. In our example, the end-user selects the appropriate Time Series template to define the new measure.
This makes users self-sufficient in terms of extending the warehouse to include new measures. Most importantly these calculated measures are treated in exactly the same way as normal measures – they share exactly the same dimensionality as their source measures. Calculated measures can even be nested.
Oracle’s multi-dimensional tools provide the following calculation templates:
Group Name Calculation Name Basic Arithmetic Addition
Figure 9 – Calculation Builder
The Benefits of a Multi-Dimensional Model Page 11

Subtraction Multiplication Division Ratio
Advanced Arithmetic Cumulative total Index Percent Markup Percent Variance Rank Share Variance
Prior/Future Comparison
Prior Value Difference from Prior Period Percent Difference from Prior Period Future Value
Time Frame Moving Average Moving Maximum Moving Minimum Moving Total Year to Date
There are no restrictions on the usage of these calculated measures. Users can create conditional formats or traffic light reports based on a calculated measure. Dimensions can also be filtered based on a condition that is driven by a calculated measure.
The Benefits of a Multi-Dimensional Model Page 12

Dimensions Dimensions identify and categorize information relating to business entities. Dimension members are stored in a dimension table. Each column represents a particular level in a hierarchy. In a star schema, the columns are all in the same table; in a snowflake schema, the columns are in separate tables for each level. When OLAP tools present this information to an end user the members are presented as one long list of values. The OLAP engine transforms the columns in the relational table into one single column of dimension members. This transformation process is demonstrated below:
At a very basic level, dimensions provide users with the ability to expand and collapse a list of members. As can be seen in the image on the left side, the member ‘Channel Total’ has been expanded to show all the members below it. Various ad-hoc query-reporting tools also provide simple drill operations. However, these drill operations tend to be unstructured in their approach and do not truly extend the query capability for the user.
Levels
Levels provide order to the individual member values within a dimension. Levels are used to identify key groupings within a dimension. Levels allow users to quickly and easily select groups and/or a cluster of dimension members. Typically, this concept is not exposed within the relational data model. But it provides a very powerful feature to the multi-dimensional query model. It also allows users to create dynamic structure driven selections that are self-maintaining.
In many relational query models, users typically filter data based on facts or by manually selecting individual members/keys to create a query. For example, what
Figure 10 - Dimensional Model of a relational table
Figure 11 – Using Levels
The Benefits of a Multi-Dimensional Model Page 13

were the total sales for Cameras in the US, Europe and ‘Rest of the World’ regions for Week 24 in Year 2004?
In this example the user would select the dimension member ‘Cameras‘ and then select the required regions and time periods. However, this type of query generation is structurally static and prone to error. No data warehouse environment is static; companies regularly reorganize their schemas. So, if ‘Rest of the World’ were restructured into two new regions, Middle East and Oceania, the above query would fail. It is not structurally aware. Hence, users would view reports that would be structurally incorrect. They would need to rewrite their queries to include the two new regions.
A better solution would be for the queries to automatically rewrite themselves. The multi-dimensional model supports this rich feature. Users can create queries based on structural conditions, which interact directly with the structural components (levels) of the dimension.
So, we could rewrite the above query as follows:
What were the total sales for Cameras for the level Regions within the Geography dimension during the latest week in the Time dimension?
Now, as the structure of the data warehouse evolves the query will automatically update to include the two new regions of Middle East and Oceania. This also highlights another important feature of the multi-dimensional model, which is the creation of independent queries for each dimension. This concept will be explored in more detail later.
Hierarchies
A hierarchy provides order to the levels within a dimension. It also details the parent/child relationship between the dimension keys. Most hierarchies are typically defined as level-based where the structure is simple in terms of how each level relates to the next one in the hierarchy. For example, a level-based geography hierarchy might appear as follows:
All Regions
State
County
City
Account
However, many dimensions have more than one hierarchy and within Oracle OLAP, there is no limit to the number of hierarchies that can be assigned to a dimension.
The Benefits of a Multi-Dimensional Model Page 14

A typical multi-hierarchy scenario could be created within a Geography dimension as follows:
All Regions All Regions
State Sales Manager
County Sales Rep
City Account
Account
In this example, the two hierarchies share the same top level, All Regions, and the same leaf node, Account. Therefore, the total for all Sales Managers is exactly the same as the total for all States.
However, all hierarchies are not always as simple as the ones above. There are three other types of hierarchies which are common within most organizations but which are not typically available within purely relational reporting models.
o Value based
o Skip level
o Ragged
Value based
The value-based hierarchy is typical of most organizational hierarchies where organizing a dimension by levels is not possible. For example, in a typical organization the same job title could appear at more than one level.
King President
Blake Analyst
Allen Analyst
James Clerk
Clark Salesman
Ward Salesman
Turner Analyst
In this case there is no unique level “Salesman” this occurs at two separate levels, since Ward reports to Clark and both hold the position of “Salesmen”.
The Benefits of a Multi-Dimensional Model Page 15

Skip level
The Skip Level hierarchy is mostly found within consumer retail environments where a specific level has parents at multiple levels. For example within a product dimension some dimension keys within the Brand level may have parents at the Category level and others at the Sub-Category level. In most relational reporting products, the end user would have to understand this data model and know which brands reported to which parent level. Drilling can be very messy and difficult to understand.
In contrast, within a multi-dimensional environment, the user would simply drill through the hierarchy and the underlying logic would seamlessly manage the skip level issues. This is because the dimension, level, and hierarchy relationships are managed as a simple table containing just the dimension key and the parent key combinations. This makes traversing the skip levels extremely easy both for the application logic and as a result for the user as well.
Ragged
The Ragged hierarchy is one based on ragged levels, where data is loaded at different levels within the same hierarchy. Again the end user does want or need to understand this from the point of view of the schema. This type of schema is typical in financial type applications where budgets can be planned at different levels across various organizational or cost center structures.
Working with Hierarchies - Parents and Children
Since hierarchies can be implemented in different ways and data can be present at different levels, users need additional intelligent semantics to allow them to work with these hierarchical structures.
An additional structural concept that accrues from multi-dimensional hierarchies relates to parents and children. By constructing hierarchies within a dimension, additional metadata is created that allows users to select values using conditions based on relationships. The following terms can be used to create a dimensional selection:
Selection DescriptionParent Returns the dimension members from the next
level up in the hierarchy. In the previous example if the user asked for the parent of a City the query would return a County
Children Returns the dimension members from the next level down in the hierarchy. In the previous example if the user asked for the children of a County the query would return Cities
Siblings Returns all the dimension members from the same level in the hierarchy. In the previous example if the user asked for the siblings of a specific County
Figure 12 – Using Parentage Information
The Benefits of a Multi-Dimensional Model Page 16
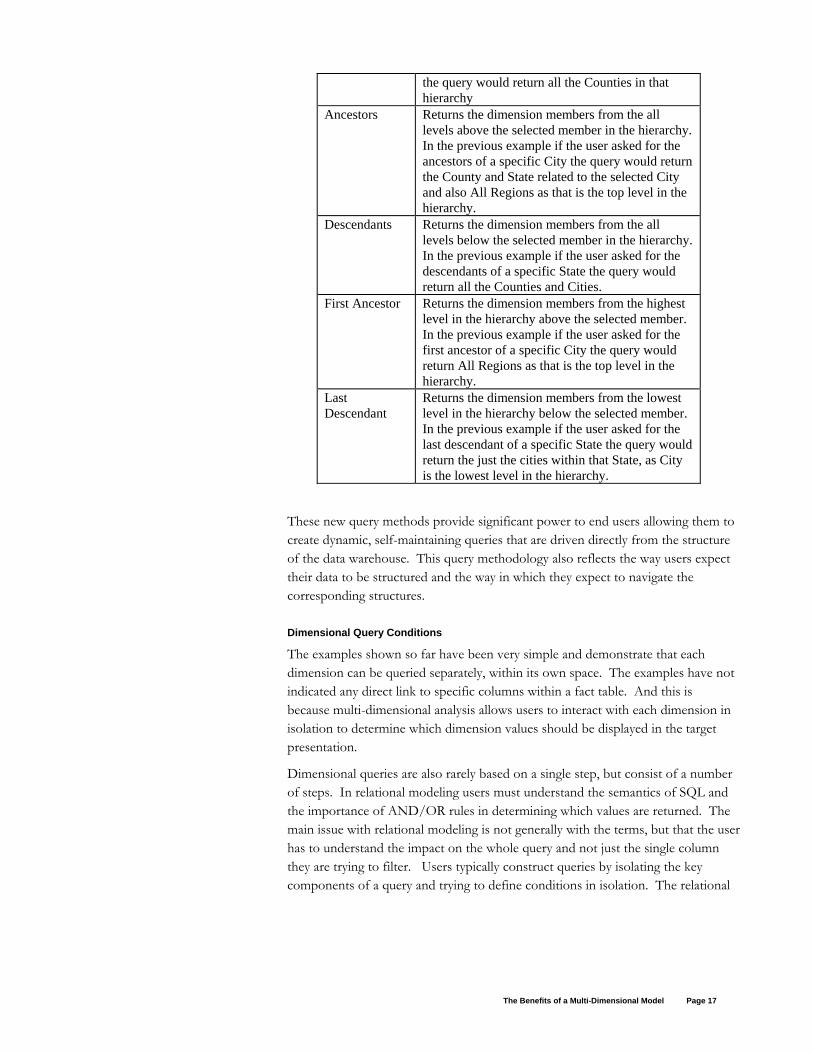
the query would return all the Counties in that hierarchy
Ancestors Returns the dimension members from the all levels above the selected member in the hierarchy. In the previous example if the user asked for the ancestors of a specific City the query would return the County and State related to the selected City and also All Regions as that is the top level in the hierarchy.
Descendants Returns the dimension members from the all levels below the selected member in the hierarchy. In the previous example if the user asked for the descendants of a specific State the query would return all the Counties and Cities.
First Ancestor Returns the dimension members from the highest level in the hierarchy above the selected member. In the previous example if the user asked for the first ancestor of a specific City the query would return All Regions as that is the top level in the hierarchy.
Last Descendant
Returns the dimension members from the lowest level in the hierarchy below the selected member. In the previous example if the user asked for the last descendant of a specific State the query would return the just the cities within that State, as City is the lowest level in the hierarchy.
These new query methods provide significant power to end users allowing them to create dynamic, self-maintaining queries that are driven directly from the structure of the data warehouse. This query methodology also reflects the way users expect their data to be structured and the way in which they expect to navigate the corresponding structures.
Dimensional Query Conditions
The examples shown so far have been very simple and demonstrate that each dimension can be queried separately, within its own space. The examples have not indicated any direct link to specific columns within a fact table. And this is because multi-dimensional analysis allows users to interact with each dimension in isolation to determine which dimension values should be displayed in the target presentation.
Dimensional queries are also rarely based on a single step, but consist of a number of steps. In relational modeling users must understand the semantics of SQL and the importance of AND/OR rules in determining which values are returned. The main issue with relational modeling is not generally with the terms, but that the user has to understand the impact on the whole query and not just the single column they are trying to filter. Users typically construct queries by isolating the key components of a query and trying to define conditions in isolation. The relational
The Benefits of a Multi-Dimensional Model Page 17

model forces users to manipulate all the elements as a whole, which tends to lead to confusion and unexpected result sets.
In contrast, the multi-dimensional model allows users to filter each dimension in isolation and uses more friendly terms such as Add, Keep and Remove. Users can quickly and easily create multi step queries, like the following:
Give me my top 5 performing cities in California, based on growth in margin based on prior year
Becomes a simple two-step query:
Start with California
Keep top 5 cities based on Margin % Growth Prior Year
Notice the syntax of the query closely mirrors the way a user would describe the query. To make the creation of queries as simple as possible, Oracle OLAP BI Dimensional Query Builder provides templates that guide the user through the process of creating analytical conditions.
Figure 13 – Creating Conditions
The following types of templates are provided to help users create both data driven queries and queries based on structural metadata:
Group Exception Type
Exception Sales Revenue > 1000 Sales Revenue > Costs Sales Revenue > Costs + 10 Sales Revenue > Costs - 10% Sales Revenue within 10 of Costs Sales Revenue not within 10% of Costs Sales Revenue between 5000 and 10000
Top/Bottom Top 10 based on Sales Revenue Top 10% based on Sales Revenue Making up the top 10% of Sales Revenue
Hierarchy Children of All Regions All Levels in California All Regions
Time/Ordinal Last/First States Match Name contains
The above list is displayed in the OLAP Query Builder wizard. The query templates allow the user to customize the query to exactly match their requirements. Each part of the query comprises a hyperlink to enable the user to modify the default statements. Within the Top/Bottom group, the user can easily create a Top 5 based query by using the first template in the group and simply changing the figure ten to the value five. Figure 14 – Creating a ‘Top’ Condition
The Benefits of a Multi-Dimensional Model Page 18

Multi-Dimensional Queries
Figure 15 – Creating intelligent Time based queries
The multi-dimensional query model has one significant advantage over the relational query model. Each dimension can be queried separately. This allows users to breakdown what would be a very complex query into simple manageable steps. For example consider the following query:
I want to analyze how my top 5 Brands in the US region based on sales revenue are selling in my top 5 Regions within Europe across my three main distribution channels.
This looks like a complex query and would be a complex query to construct using a pure relational analysis tool. The user would need to understand the interaction between the different conditions on each column and the affect on the overall result set. However, because of dimensional independence within the OLAP model, it is very easy to break this query down into simple steps:
1. Construct top 5 query on the Product dimension for the level Brand based on Sales Revenue
2. Construct a two-step query on the Geography dimension. Select the dimension value Europe´ then keep the top 5 Regions based on Sales Revenue
3. Select the level Distribution Channel within the Channel dimension.
4. Lastly, select the time periods either manually by selecting the relevant dimension members or by using the Query conditions to select the latest 3 Months or latest 3 Quarters etc.
The multi-dimensional model provides very powerful filtering as has been shown above. Additionally, it is possible to create conditions based on measures that are not part of the final report. Because the dimensional query is independent of the filters, it allows complete flexibility in determining the structure of the condition. For example a report could show:
o Sales Revenue o Sales Revenue % Change Based on Year Ago o Sales Revenue 6 Month Moving Average
However, it is possible to analyze how the top 5 Brands in the US region based on Margin % are selling in the top 5 Regions within Europe based on Margin % Growth across the three main distribution channels.
All these features allow user enormous flexibility. However, when creating complex queries, there is always the probability that no rows will be returned. Can the multi-dimensional model resolve this issue as well?
Validating Queries Creating queries that contain multiple steps creates the potential for returning no rows. For users of the relational data model this can be extremely frustrating as it is usually unclear which join, or condition is the culprit. At this point the user embarks on a voyage of discovery into the very heart of SQL semantics and the
The Benefits of a Multi-Dimensional Model Page 19

structure of the underlying schema. For most users this is not a pleasant experience.
Figure 16 - Users can check the status of their query using the Members feature
Dimensional queries are based around individual dimensional objects. Since each query is created in isolation, dimensional query tools allow users to quickly and easily check the result of executing an individual dimensional query. After constructing a series of query steps, a user can check if the query will return rows of data by viewing the outcome of the query steps using the Members panel of Query Wizard. Thus, users can check the result of the query to ensure the results returned are in line with their expectations, without having to generate a report or graph.
Time Dimensions There is one special type of dimension, ‘Time’, which requires some additional information about the members in terms of each member’s time span and end-date. With these additional attributes Oracle’s multi-dimensional model is able to provide some additional features compared to ‘normal’ dimensions.
Once a time dimension has been defined, additional calculation templates are provided. These templates use the time based attributes to intelligently manage time based calculations such as:
• Prior Value
• Difference from Prior Period
• Percent Difference from Prior Period
• Future Value
• Moving Average
• Moving Maximum
• Moving Minimum
• Moving Total
• Year to Date
These features automatically orientate themselves across all the time periods within a hierarchy. There is no need to define calculations that specifically create a calculation for Year values and another for Quarter values. Although the multi-dimensional model will allow users to do this, it will also automatically manage all this complexity. This allows one calculation to correctly compute across years, quarters, months, weeks and days.
Within the query model, users can create time intelligent steps, using the query templates. For example:
• 6 months starting from ‘Jan05’
The Benefits of a Multi-Dimensional Model Page 20

• Last 3 months
The Benefits of a Multi-Dimensional Model Page 21

CONCLUSION Every organization knows they have rapidly expanding amounts of data. The challenge for users is to transform the knowledge inside that data into competitive advantages. Many people know that information is power; the ability to understand the buying patterns within a customer base can make a huge difference to the corporate bottom line. However, that transformation process can only happen if users can access data in the correct manner and format.
To allow users to intelligently query and analyze information organizations spend large amounts of time and resources adding structure and order to their relational database schemas. This structure is intended to simplify the analysis process for end users. The zenith of this path to structure and order is the multi-dimensional model. It allows user to access a data warehouse schema and quickly, simply and easily transform data into quality information. It also makes users self-supporting as their interaction with the database is done using business orientated language and terminology they use every day in their place of work.
Oracle’s OLAP multi-dimensional model is unique in the market place.
The Benefits of a Multi-Dimensional Model Page 22

Benefits of a Multi-Dimensional Model May 2006 Keith Laker Principal Product Manager Oracle Corporation World Headquarters 500 Oracle Parkway Redwood Shores, CA 94065 U.S.A. Worldwide Inquiries: Phone: +1.650.506.7000 Fax: +1.650.506.7200 www.oracle.com Copyright © 2003, Oracle. All rights reserved. This document is provided for information purposes only and the contents hereof are subject to change without notice. This document is not warranted to be error-free, nor subject to any other warranties or conditions, whether expressed orally or implied in law, including implied warranties and conditions of merchantability or fitness for a particular purpose. We specifically disclaim any liability with respect to this document and no contractual obligations are formed either directly or indirectly by this document. This document may not be reproduced or transmitted in any form or by any means, electronic or mechanical, for any purpose, without our prior written permission. Oracle is a registered trademark of Oracle Corporation and/or its affiliates. Other names may be trademarks of their respective owners.