the biological value of proteins at different · the biological value of proteins at different ......
TRANSCRIPT

THE BIOLOGICAL VALUE OF PROTEINS AT DIFFERENT LEVELS OF INTAKE.
BY H. H. MITCHELL.
(From the Department of Animal Husbandry, University of Illinois, Urhanca.)
(Received for publication, November 19, 1923.)
The biological value of a protein, as defined and measured by the method developed in the preceding paper, can hardly be expected to remain constant under all conditions. It may be expected to vary with the use to which the protein is put in the body. The maintenance of the nitrogenous integrity of the tissues, the synthesis of new tissue in growth, and the synthesis of milk proteins in lactation may be expected to require different proportions of amino-acids, so that the nitrogen of a given protein may be expected to be more completely utilized in serving some one of these functions than in serving another. These differences in biological value are concerned with the amino-acid make-up of the protein as compared with the several distinct requirements for amino-acids.
It is generally believed, in fact, that the chemical constitution of a protein determines entirely its biological value. This belief tacitly assumes that the economy with which the cells utilize the amino-acids supplied to them is unaffected by the abundance of the supply, particularly by the rate at which the amino-acids are transported to the cells from the intestinal tract. It also assumes that the undigested fraction of a dietary protein is representative in its amino-acid make-up of the protein as consumed, so that factors influencing the digestibility of the protein would have no effect on the proportions of the different amino-acids absorbed into the blood. It must also assume that no great differences in the rate at which different amino-acids are liberated from a protein during digestion occur, or that if such differences do occur, the storage capacity of the tissues for absorbed amino-acids is sufhciently great to insure the presence there throughout the digestive period of optimum proportions for synthetic purposes of the several
905
by guest on July 5, 2018http://w
ww
.jbc.org/D
ownloaded from

906 Biological Value of Proteins-Results
amino-acids. It also assumes that until the demands of the body for protein are covered by the protein intake, amino-acids are not oxidized in the body except in so far as they are unavailable for synthetic purposes, and hence that factors affecting the intensity of the oxidation processes can have no effect on the utilization of amino-acids for structural purposes. These assumptions are either extremely improbable or highly debatable.
However, by conducting experiments with different proteins under the same experimental conditions, particularly with regard to the concentration of protein in the ration, it should be possible to obtain biological values indicating the relative utilization of the proteins in anabolism, and by changing experimental conditions, it should be possible to determine to what extent the assumptions enumerated in the preceding paragraph deviate from the truth.
With these purposes in mind a large number of metabolism studies on rats were undertaken in which a considerable variety of proteins was tested at different levels of intake. The methods of confining the rats and of making the collections of urine and feces have already been described in the preceding paper. The collec- tion periods were all of 1 week duration and were always preceded by a period of at least 3 days in length in which the same ration in approximately the same amounts was fed. Each rat used in these experiments was subjected to at least one period of non- protein feeding to determine the rate of the endogenous catabolism of nitrogenous substances as related to body weight, and the rate of endogenous losses of nitrogen through the digestive tract as related to the amount of food consumed. The values thus obtained were used in the estimation in periods of protein feeding, of the contribution by the body to the fecal and urinary nitrogen and, by difference, the waste of food nitrogen in digestion and metab- olism. The methods by which these estimates were made and their justification have already been fully discussed. The biolog- ical value of the protein, or more correctly of the total nitrogen in the ration, is finally expressed as the percentage of the absorbed nitrogen which is retained in the body.
In the first series of experiments the proteins or mixtures of proteins tested constituted approximately 5 per cent of the rations fed, all of which possessed approximately the same energy value. The results of these experiments are summarized in Tables I to VII inclusive.
by guest on July 5, 2018http://w
ww
.jbc.org/D
ownloaded from
H. H. Mitchell 907
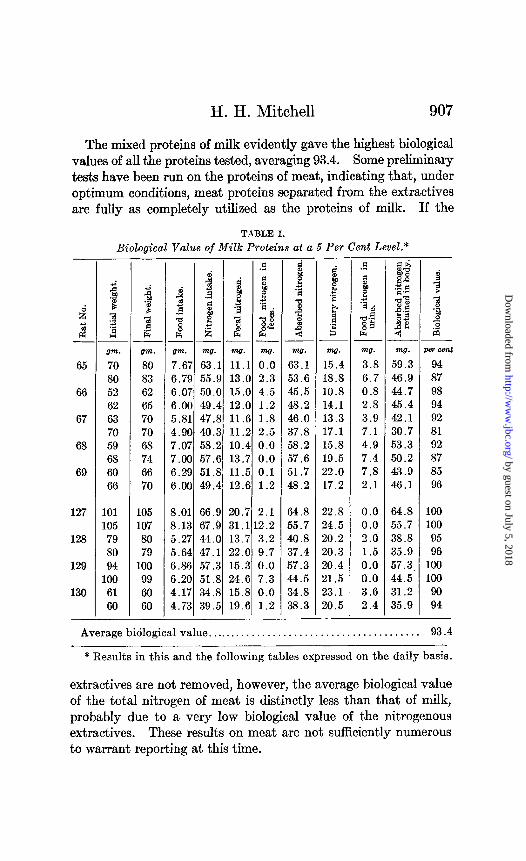
The mixed proteins of milk evidently gave the highest biological values of all the proteins tested, averaging 93.4. Some preliminary tests have been run on the proteins of meat, indicating that, under optimum conditions, meat proteins separated from the extractives are fully as completely utilized as the proteins of milk. If the
TABLE I.
Biological Value of Milk Proteins at a 6 Per Cent Level.* -
d 2 - 65
66
67
68
69
127
128
129
130
gn. om. 70 80 80 83 52 62 62 65 63 70 70 70 59 68 68 74 60 66 66 70
101 105 105 107 79 80 80 79 94 100
100 99 61 60 60 60
- -
7”: 6.7 6.0 6.01 5.8 4.91 7.c 7.0 6.2’ 6.0(
--
7 9 7 0 1 Q 7 ( Q 9 0
1 1 3 1 7 4 a ( 3 s 7 : -; 2 -
WT. 63 . : 55.! 5o.c 49.1 47.t 40.: 58.: 57.t 51.2 49.4
8.0 8.1: 5.2 5.6~ 6.8 6.2( 4.1’ t.73
66.: 67.5 44.c 47.1 57.: 51.2 34.1 19.5
- -
_-
1 3 : 1 : i : 3 : I : ? : j : 3 : L :
ml. 11.1 L3.C 15 .c L2.C L1.E 11.2 10.4 13.7 11.5 L2.E
) ‘ ‘ 3 : 1 ! I : i 1
1 ‘ ‘
1 I
1
10.7 $1 .l 13.7 z2.c 15.3 14.6 15.8 9.6
- .E! a I :! .z
$
- mg. 0.0 2.3 4.5 1.2 1.8 2.5 0.0 0.0 0.1 1.2
-
prig. ntg. mg. WT. w cenl
63.1 15.4 3.8 59.3 94 53.6 18.8 6.7 46.9 87 45.5 10.8 0.8 44.7 98 48.2 14.1 2.8 45.4 94 46.0 13.3 3.9 42.1 92 37.8 17.1 7.1 30.7 81 58.2 15.8 4.9 63.3 92 57.6 19.5 7.4 50.2 87 51.7 22.0 7.8 43.9 85 48.2 17.2 2.1 46.1 96
2.1 64.8 22.8 0.0 64.8 100 .2.2 65.7 24.5 0.0 55.7 100 3.2 40.8 20.2 2.0 38.8 95 9.7 37.4 20.3 1.5 35.9 96 0.0 57.3 20.4 0.0 57.3 loo 7.3 44.5 21.5 0.0 44.5 100 0.0 34.8 23.1 3.6 31.2 90 1.2 38.3 ?0.5 2.4 36.9 94
- Average bidlogical value. . . . . . . . . . . . . . . . . . . . . . . . . . . . . . . . 93.4
* Results in this and the following tables expressed on the daily basis.
extractives are not removed, however, the average biological value of the total nitrogen of meat is distinctly less than that of milk, probably due to a very low biological value of the nitrogenous extractives. These results on meat are not sufficiently numerous to warrant reporting at this time.
by guest on July 5, 2018http://w
ww
.jbc.org/D
ownloaded from

908 Biological Value of Proteins-Results
The main protein of milk, as other investigations have shown, is distinctly less efficient in nutrition than the mixed proteins of milk. The average biological value obtained for casein was 70.8. At a 5 per cent level of intake, casein, in fact, seems to be no higher in biological value than the proteins of corn, for which an average value of 72.0 was obtained.
TABLE II.
Biological Value of Casein at a 5 Per Cent Level. -
i? 2 - 20 21 22
23
27
15
16 65 66 67 68 69
-
-
of= 61 72 64 64 81 80
144 149 113 118 110 58 45 56 56 56
-
;i 3 ; 3 2 _.- - _
om. 65 76 64 64 80 81
149 165 1 119 124 120 64 47 59 58 56
-
om. 4.61 4.91 3.% 3.8i 3.7: 4.7: 7.6; 0.5t 9.4 9.0< 9.0! 6.lt 3.81 5.11 4.5( 4.94
4 .
.? B 2
$ .2
P 4 $2 2 __ .__ mg. mu. 45.611.5 48.2 11.4 36.1 8.2 36.5 6.8 34.8 8.2 44.7 9.2 70.121.4 96.523.0 86.320.3 80.1/24.1 83.123.2 54.3, 8.9 33.9 6.1 45.1 8.2 39.7 9.0 43.61 7.3
mo. 3.5 3.0 1.6 0.2 0.5 0.0 8.9 5.8 1.8 6.3 6.2 0.0 0.0 0.6 2.0 0.0 - -
mg. no. mo. mo. $2.1 28.8 14.4 27.7 45.2 30.1 15.6 29.6 34.5 24.2 9.7 24.8 36.3 24.9 10.4 25.9 34.3 27.7 9.1 25.2 $4.7 32.0 13.4 31.3 61.2 43.5 17.2 44.0 90.7 50.3 21.7 69.0 34.5 50.0 26.6 57.9 73.8 43.0 18.6 55.2 76.9 33.8 16.9 60.0 54.3 23.6 13.8 40.5 33.9 17.7 10.0 23.9 44.5 20.8 12.6 31.9 37.7 22.9 12.7 25.0 43.6 27.0 14.1 29.5
-
4: leTcent
66 66 72 71 73 70 71 76 69 75 72 75 71 72 66 68
Average biological value. . . . . . . . . . . . . . . . , . . . . . . . . . . . . . . . . . . . . . . 70.8
The biological values of the mixed proteins of the three cereals examined, corn, oats, and whole rice, show rather distinct dif- ferences, the average values being 72.0 for corn, 78.6 for oats, and 86.1 for rice at a 5 per cent level. These differences seem to be fairly distinct. Of the four rats on which tests both of corn and oat proteins were run, three gave distinctly higher values for oat protein than for corn protein, while one gave concordant
by guest on July 5, 2018http://w
ww
.jbc.org/D
ownloaded from

H. H. Mitchell 909
values for both cereals. Of the two rats on which tests both of oat and of rice proteins were made, both gave higher values for rice
6
i -
60
61
62 63
65
66
67
68
69
15
16
20
21
--
TABLE III.
Biological Value of Corn Proteins at a 6 Per Cent Level:
om. om. om. ml. w. nag. mg. w?.
232 230 .0.94 87329.3 8.1 79.7 65.2 250 249 .O.lO 81.127.0 8.3 72.8 63.3 249 241 9.23 74.126.4 9.3 64.8 60.2 244 245 0.56 84.827.4 0.3 74.5 63.5 240 243 1.03 88.630.1 1.1 77.5 59.1
115 109 5.94 47.7 13.6 5.2 42.5 30.9 109 108 5.54 44.5 10.8 1.4 43.1 28.2 93 88 5.66 45.410.5 0.0 45.4 28.1 88 88 5.60 45.0 11.3 0.0 45.0 26.8
100 98 5.83 46.813.3 1.8 45.0 27.8 98 98 4.67 37.5 9.4 0.0 37.5 22.9
105 98 6.19 49.7 16.7 2.8 46.9 35.0 98 94 4.97 39.912.1 0.2 39.7 27.2 98 98 6.67 53.615.6 1.9 51.7 40.1 98 95 6.83 54.8 15.4 0.8 54.0 33.2
111 109 109 110 109 106 106 106 69 72 72 72 87 88 88 87
8.29 75.020.5 8.49 75.520.5 7.47 67.6118.5 8.11 72.1 16.6 5.33 49.413.2 5.23 47.3 13.6 5.74 53.215.3 6.20 56.1 14.4
4.3 70.7 39.8 3.9 71.6 39.7 4.5 63.1 39.4 1.4 70.7 39.5 3.9 45.5 25.9 4.5 42.8 26.2 5.4 47,.8 29.2 3.7 52.4 32.3
_-
-
w. w. Per cent 23.9 55.8 70 18.0 54.8 76 15.6 49.2 76 18.2 56.3 76 22.2 55.3 71
12.6 29.9 70 12.9 30.2 70 11.2 34.2 75 9.9 35.1 78
13.6 31.4 70 8.9 28.6 76
18.3 28.6 61 11.7 28.0 70 18.9 32.8 63 12.4 41.6 77
17.6 53.1 17.7 53.9 23.7 39.4 23.9 46.8 9.9 35.6 9.8 33.0
12.1 35.7 15.2 37.2
75 75 62 66 78 77 75 71
_-
Average biological value.. . . . . . . . . . . . . . . . . . . . . . . . . . . . . . . . . . . . . . . . 72
The proteins of yeast, at this low level of intake, also seem to be very completely utilized, as indicated by an average biological value of 85.5. The average biological value for potatoes, 68.5, was the
by guest on July 5, 2018http://w
ww
.jbc.org/D
ownloaded from

910 Biological Value of Proteins-Results
15
16
20
21
TABLE IV.
Biological Value of Oat Protein at a 6 Per Cent Level.
2. $9 k 3 .3
Y gm. 96
100 94 96 70 70 85 85
-
-
om.
100 105 96 99 70 77 85 90
-
-
-
#m. mo. w.
6.83 60.7 19.7 7.30 64.9 18.7 5.29 47.0 14.6 6.54 58.117.8 5.35 47.613.9 6.36 55.6 15.4 5.87 52.2 14.8 6.49 56.816.4
-
-
w.
6.3 4.4 4.8 5.6 4.6 4.3 4.7 5.2 -
8 3 .$
j
3 - w.
54.4 60.5 42.2 52.5 43.0 51.3 47.5 51.6
-
T
-- w. mg. w.
30.4 10.6 43.8 31.0 10.4 50.1 24.9 11 .o 31.2 28.2 13.9 38.6 25.1 9.1 33.9 27.3 10.7 40.6 26.0 9.3 38.2 27.2 10.1 41.5
-
z
-
x.7Gmt 80 83 74 74 79 79 80 80
Average biological value.. . . . . . . . . . . . . . . . . . . . . . . . . . . . . . . . . . . . . . . . 78.6
TABLE V.
Biological Value of Rice Protein at a 6 Per Cent Level.
2 .9
d $
i d E
-~ m.
22 68 23 90 24 92 25 56 20 79
82 21 95
101
I I I
-. --- om. 07% ?a#. m#.
76 7.79 67.6 14.9 94 7.64 66.3 17.1 93 6.96 60.415.1 58 5.29 45.912.1 82 6.37 55.412.4 87 6.04 52.511.7
101 8.21 71.316.4 108 7.13 62.0 15.3
- .a
g .% “6 -88 8-” R - mo. 1.7 1.4 3.6 2.8 1.3 1.2 2.3 3.0 -
mg. me. m0.
65.9 25.6 9.3 64.9 28.5 7.2 56.8 30.1 9.4 43.1 22.8 5.2 54.1 26.6 8.4 51.3 25.2 6.0 69.0 31.9 12.7 59.0 26.9 6.5
- f ah
82 .s.a
23
${ -
mo. 1
56.6 57.7 47.4 37.9 45.7 45.3 56.3 52.5
-
k?raee9%6 86 89 83 88 84 88 82 89
Average biological value . . . . . . . . . . . . . . . . . . . . . . . . . . . . . . . . . . . . . . . . . 86.1
by guest on July 5, 2018http://w
ww
.jbc.org/D
ownloaded from

H. H. Mitchell 911
TABLE VI.
Biological Value of Potato Nitrogen at a 6 Per Cent Level. T
- I
-- 0m. om.
140 141 141 144 126 125 125 127 140 140 140 141 153 154 154 152 161 156 156 159
0m.
9.4 9.0 8.5 8.2 8.3 8.9 .1.8 9.8 8.4 9.7
1 4 6 3 2 7 21 4 8 0
ai $j ki
F
li .i .d 8 E --
w. w7. 82.240.2 79.035.2 74.8 28.5 71.9 26.6 72.722.3 78.430.7 03.324.1 86.036.9 74.129.3 84.837.6
nag. w. m0.
21.7 60.5 45.6 18.0 61.0 44.0 16.9 57.9 39.8 15.7 56.2 39.9 9.3 63.4 46.1
17.4 61 .O 46.6 0.9 02.4 55.6
19.1 66.9 54.5 15.7 58.4 53.2 33.3 61.5 55.8
Der c%nt 70 71 70 67 75 68 77 63 64 60
.!!
I Y tics 7.” g mg.
18.2 17.6 17.2 18.5 16.1 19.2 23.9 24.8 21 .o 24.7
m0.
42.3 43.4 40.7 37.7 47.3 41.8 78.5 42.1 37.4 36.8
140
141
142
143
144
Average biological value.. . . . . . . . . . . . . , . . . . . . . . . . . . . . . . . . . . . . . . . . 68.5
TABLE VII.
Biological Value of Yeast Nitrogen at a 6 Per Cent Level. T
w. m0. pm cm1
7.6 34.8 82 5.5 37.2 87 4.9 38.4 89 6.4 29.6 82 4.2 27.2 87 4.4 27.5 86
24
25
0m. ~ gm. ?n#. rn#. tn#. m0. m0.
87 6.16 57.325.1 14.9 42.4 26.9 88 6.10 56.724.1 14.0 42.7 25.1 89 6.34 59.026.2 15.7 43.3 24.7 52 5.10 47.520.5 11.5 36.0 22.4 52 4.81 44.721.8 13.3 31.4 20.2 51 4.54 42.3,18.4 10.4 31.9 20.1
0m.
86 87 88 53 52 52
Average biological value.. . . . . . . . . . . . . . . . . . . . . . . . . . . . . . . . . . . . . . . . 85.5
by guest on July 5, 2018http://w
ww
.jbc.org/D
ownloaded from


H. H. Mitchell 913
value of the absorbed nitrogen, can within small limits of error be taken as representative of the biological value of their mixed proteins.
The second series of experiments was performed on rations containing approximately 10 per cent of protein (N X 6.25). While
TABLE IX.
Biological Value c d the Proteins of Corn at a IO Per Cent Level. -7
2 .bo 5 II .2
22 gm.
131 146 103 119 120 141 113 130 110 120
om. gm. 131 5.2i 147 7.04 102 $.2C 121 ( 3.6E 119 %.5S 142 ( 3.45 111 %.8F 134 7.31 106 %.8( 120 ( 3.3t
222 223 11 D.6f 223 223 5.7< 241 242 t 9.5t 242 244 , 9.2: 245 250 1 1.4f 250 250 , 9.21
190 202 213 191 201 212 192 207 218 193 204 220 194 208 220
mg. 82.: 110.: 65.t ,04.: 71.: 101.: 76.1 114.! 75.f 99.f
L66.! 137.: 149 .: 144.! 179.! 144.'
136.; 13G.! 136.: 136.5 136.5
--
d 0 :: .s
3 rz
m7.
6.0 5.4 4.4 5.6 3.9 6.0 6.0 3.9 6.7 5.7
3.2 3.6 0.9 1.1 6.4 8.6
2.4 0.3 0.8 3.0 7.8
-
_- ml. ml. w. nag.
76.3 51.2 31.8 44.5 34.8 72.4 8.4 57.4 x.2 44.8 22.6 38.6 38.7 64.5 34.4 64.3 37.8 44.1 25.3 42.5 95.3 64.7 38.3 57.0 70.4 44.6 25.7 44.7 10.6 67.2 41.7 68.9 68.3 48.2 24.7 43.6 93.9 64.0 36.4 57.5
-
2 mcent 58 55 63 65 62 60 63 62 64 61
53.7 22.4 82.7 71.0 46 24.1 06.3 66.4 57.7 46 38.8 12.3 68.4 70.4 51 33.4 02.1 57.9 75.5 57 63.1 23.5 77.8 85.3 52 26.1 95.5 49.3 76.8 61
34.1 81.3 48.6 85.5 64 36.2 74.3 45.3 90.9 67 35.7 80.9 42.3 93.4 69 33.5 82.6 41.9 91.6 69 28.7 81.4 48.0 80.7 63
Average biological value.. . . . . . . . . . . . . . . . . . . . . .
- . .
-
. . . . . . . . . . . 59.6
-
1t ( ,
I ,
1 I ,
1, 1’ 1. 1 1, 1
1 1 1 1 1
_-
-
I
Ll ) il t ‘I )
i I
i
il ,'I
;I:
jl
11
w7.
16.: 21.: 13.4 19.F $4.1 20.4 1s.t 23.1 17.: 18.4
33.c 30.i 28.f 2s.: 35.1 33.f
20.! 23.C 21 .: 22.1 23.t
65
66
67
68
69
60
61
62
in the former series, the dietary protein was used mainly for the maintenance of the tissues, in this series some growth was also obtained. The experimental results are summarized in Tables VIII to XI, inclusive.
by guest on July 5, 2018http://w
ww
.jbc.org/D
ownloaded from
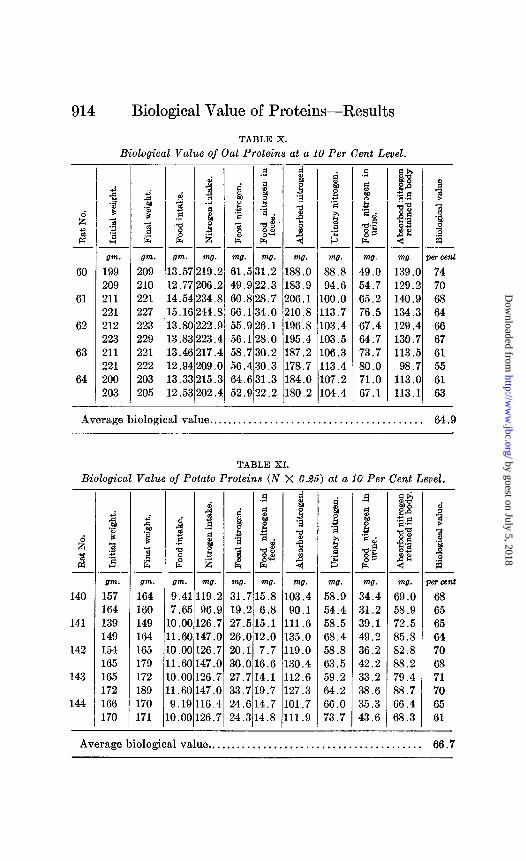
914 Biological Value of Proteins-Results
TABLE X.
Biological Value of Oat Proteins at a 10 Per Cent Level.
ntg. 61.: 49.E 60.E 66.1 55.E 56.1 58.i 56.4 64.f 52.C
w. 11.2 !2.3
‘ C3.7 Pi.0 I !
Z6.1 28.0 , iO.2 so.3 $1.3 !2.2
-
d
i
60
61
62
63
64
-7 T
nzg. N9.Z !O6.: !34.1 !41.! !22 .! 123.4 !17 .” !09.( !15 .: !02 .’
w. w. pm cent
49.0 139.c 74 54.7 129.: 70 65.2 140.: 68 76.5 134.: 64 67.4 129.4 66 64.7 130.i 67 73.7 113.t 61 80.0 98.i 55 71.0 113 .( 61 67.1 113.1 63
. . . . . . . . . . 64.9
d .M ; 3 .z !4
om. om. om.
199 209 13.55 209 210 12.77 211 221 14.54 221 227 15.N 212 223 13.8C 223 229 13.82 211 221 13.4f 221 222 12.94 200 203 13.31 203 205 12.51
w. nzg. 188.0 88.8 183.9 94.6 206.1 100 .o 210.8 113.7 196.8 103.4 195.4 103.5 187.2 106.3 178.7 113.4 184.0 107.2 180.2 104.4
,
/ /
- . .
- Average biological value.. . . . . . . . . . . . . . . . . . . . , . . . .
TABLE XI.
Biological Value of Potato Proteins (N X 6.85) at a IO Per Cent Level. - - -- ;43 .M rj 2
-
-_
-
2 1 .a -d 8 F
.a
j
‘a8 -do ga Fr - w.
-5.8 6.8 .5.1 .2.0 7.7 .6.6 4.1 9.7 4.7 4.8
140
141
142
143
144
om.
157 164 139 149 154 165 165 172 166 170
om.
164 160 149 164 165 179 172 189 170 171
om. 9.4. 7.6! lO.O( 11.6( .O.CM -1.H .O.O( .1.6( 9.lC .O.O(
11 5 ! I 1: 1 1, 1 1: I 1‘ 1 1: 1 1‘ 3 1: I/l:
_- w7. mo. 19.2 31.7 96.9 19.2 26.7 27.5 47.0 26.0 26.7 20.1 $7.0 30.0 26.7 27.7 $7.0 33.7 16.4 24.6 26.7 24.3
‘I 1
il
II
I1
‘1
‘1 I1 ;/I -
mo.
103.4 90.1
111.6 135.0 119.0 130.4 112.6 127.3 101.7 111.9
mg. mo. 58.9 34.4 54.4 31.2 58.5 39.1 68.4 49.2 58.8 36.2 63.5 42.2 59.2 33.2 64.2 38.6 66.0 35.3 73.7 43.6
w. z 69.0 58.9 72.5 85.8 82.8 88.2 79.4 88.7 66.4 68.3
-
ST cent
68 65 65 64 70 68 71 70 65 61
Average biologicalvalue......................................... 66.7
by guest on July 5, 2018http://w
ww
.jbc.org/D
ownloaded from

H. H. Mitchell 915
As might be expected, the increase in the level of protein feeding has lowered the biological value of the protein. With the mixed proteins of milk this decrease is not great, the biological value falling from 93.4 at the 5 per cent level to 84.7 at the 10 per cent level. It seems, however, to be distinct. Comparing the values for Rats 65 to 69, inclusive, at both levels (Tables I and VIII), it will be seen that four of these five rats gave distinctly lower values at the higher level. Rat 67 gave such discordant values at the 5 per cent level, that no conclusion one way or the other is justi- fied in this case.
Corn proteins show a more distinct drop in biological value, from 72.0 to 59.6. The reality of such a reduction in value is strengthened by the fact that eight of the rats receiving the 10 per cent ration (Table IX) had in closely adjacent periods received a 5 per cent ration of corn proteins (Table III) and in each case the experimental results indicated a distinct drop in the biological value of the protein. The lowest values at the 10 per cent level were obtained with a group of four rats weighing close to 250 gm. Possibly these exceptionally low values were due in part to an excess of protein in the diet relative to the protein requirements of the animals. Against this possibility may be cited the results obtained by Nevens working in this laboratory (1) on a group of three rats weighing 108 to 118 gm. On a ration containing approximately 10 per cent of corn protein, biological values of 48, 49, and 52 were obtained. On the other hand, in another investigation in this laboratory (2) an average biological value of 72 was obtained on three rats on a 5 per cent ration of corn protein, checking exactly the average value for Table III. Occasionally, due either to d.ifferences in the physiological economy of rats or to differences in the character of the protein in a given food, such discordant values are obtained.
With oat proteins also, a drop in biological value with an increase in the protein concentration of the ration occurred, from 78.6 (Table IV) to 64.9 (Table X). The superiority in biological value of oat proteins over corn proteins seems just as marked at the higher level as at the lower level. This is particularly clear on comparing the data for Rats 60, 61, and 62, on which both foods were tested.
by guest on July 5, 2018http://w
ww
.jbc.org/D
ownloaded from

916 Biological Value of Proteins-Results
On the other hand, the nitrogen of potato shows practically the same biological value at a 10 per cent as at a 5 per cent level of intake, the average for the former being 66.7 (Table XI), and for the latter 68.5 (Table VI). The same group of five rats was fed both rations in adjacent periods.
In a previous publication from this laboratory already referred to (2) data were obtained indicating a marked decrease in the biological value of the proteins of the coconut from an average of 77 for a 5 per cent ration to an average of 58 for a 10 per cent ration. In a repoti on the growth-promoting value of la&albumin and of casein, Osborne, Mendel, and Ferry have shown that, with rats fed rations in which the amount of these proteins was the only factor limiting growth, the gains in weight per gram of protein consumed, increased to a maximum and then decreased rapidly as the protein concentration of the ration increased continuously (3). If these data are recalculated, using data previously reported by the same investigators on the maintenance requirement of rats for la&albumin and casein, to obtain the gains in weight per gram of protein consumed above maintenance, a continuous decrease in this value is shown for lactalbumin as the protein concentration of the ration is increased. For casein a similar decrease was obtained except for the ration containing the lowest percentage of this protein. In a later report on the nutritive value of the cereal proteins at different levels of intake (4), similar results were obtained. These experimental results confirm our results in indicating a reduction in the biological value of proteins as their concentration in the ration is increased.
It is noteworthy that this decrease in biological value of the proteins of foods is related to the protein concentration of the ration, not to the protein intake. For example, in Tables II, III, and VIII, particularly, marked differences in nitrogen intake, due to a varying consumption of rations containing the same concen- tration of a given protein mixture, seem to have no effect on the biological value of the protein.
The decrease in the utilization of protein in anabolism as the level of intake increases is probably due in part to a lower utili- zation for growth than for maintenance and to the increasing ratio of the absorbed nitrogen used for growth to that used for maintenance as the rate of growth increases. However, there is
by guest on July 5, 2018http://w
ww
.jbc.org/D
ownloaded from

H. H. Mitchell 917
remon for supposing that this factor cannot account for all of this decrease. Our data on this point are incomplete, probably only indicative. For example, we have found that milk proteins consumed in amounts comparable to the endogenous catabolism of nitrogen have apparently a biologial value of 100, since no increase in the urinary nitrogen occurs above the excretion on a nitrogen-free diet (see preceding paper, Table XI). We may, therefore, assume that in covering the maintenance requirement, at this level of intake at least, these proteins are completely utilized in metabolism. It is interesting, therefore, to analyze the balance data obtained on feeding these proteins at higher levels. We may utilize the average data for Rats 65 to 69, inclusive, given in Tables I and VIII. On a ration containing approximately 5 per cent of milk proteins these rats consumed on an average 51.5 mg. of absorbed nitrogen per day, using 90.7 per cent of this amount for maintenance and growth. Estimating the maintenance requirement from the excretion of urinary nitrogen on a nitrogen- free diet, 11.7 mg. were used for this purpose and 34.6 mg. were used for growth. Assuming that the utilization of milk nitrogen at this level is still 100, it is evident that 51.5 - 11.7 = 39.8 mg. of the absorbed nitrogen were used for growth. The growth secured, however, was equivalent to only 34.6 mg., so that the utilization for growth was 34.6 + 39.8 = 87.0percent. On a ration, containing approximately 10 per cent of milk proteins, the average daily intake of absorbed nitrogen was 129.7 mg., with an average biological value of 84.8. The average mainte- nance requirement in these experiments was 17.6 mg. per rat per day, and the growth secured was equivalent to 92.4 mg. Assuming again that the utilization of milk nitrogen for mainte- nance at this higher level is still 100, the utilization of nitrogen for growth would equal 92.4 f (129.7 - 17.6) = 82.4. This is lower than the estimated utilization of milk protein for growth at a 5 per cent level of intake (87.0), indicating that other factors are operating in the lowering of the biological value of milk proteins at higher levels of intake, than a mere difference in the proportion of the absorbed nitrogen used for maintenance.
The first explanation that might occur, is that the greater the rate of influx of amino-acids to the tissues from the digestive tract the less the economy with which they are handled. If this were
by guest on July 5, 2018http://w
ww
.jbc.org/D
ownloaded from

918 Biological Value of Proteins-Results
true, however, it would be expected that the utilization of dietary nitrogen in metabolism would be increased, at certain levels of intake at least, by increasing the number of feedings and thus assuring a more constant and less rapid influx of amino-acids to the tissues. However, Chanutin and Mendel (5) have recently shown that with dogs the utilization of casein, at a low and a high level of intake, is unaffected by the manner of feeding; i.e., whether all the day’s food is taken in a single feeding or in fractional feed-
TABLE XII.
Nitrogenous Metabolism of Ruts as Affected by Single and Fractional Feeding.
8 P e % a 3 El 1 2
per+= 2.992
1.531
1.643
i ‘C 8 3 27 !I
dqis 5 5 5
5 5 5
5 5 5 5 4
-
-
-
--
-
--
1 3 1
w. T7. m7. 209* 185 30 209* 178 48 209* 193 39
1 115 95 25 3 115 88 28 1 115 81 32
1 78 51 22 3 78 50 23 1 78 49 22 6 78 51 26 1 78 45 31
Rat 1. Average weight 210 gm.
7.50 gm. food daily.
- -
Rat 2. Average weight 250 gm.
8.70 gm. food daily.
-
/:
m7. fw. 260 179 260 168 260 197
133 133 133
91 91 91 91 91
-
87 39 88 29 80 39
66 51 51 45 47
-
- B i? .a
B 'i ?
-
.-
-
- -
.ij
2 & _- mg. 60 52 62
25 34 36 35 34
- -
Rat 3. Average weight 60 gm.
3.60 gm. food daily. -
d s 2
B Y !z - w. 108 108 108
55 55 55
37 37 37 37 37
-
- - B k .z
P .a 6 - .- m7. 60 57 59
30 30 23
21 20 18 19 18
- -
fw. 19 20 22
12 11 15
10 13 12 11 12
* The food intake of Rat 1 was 7.0 gm. per day in these three periods.
ings. We have obtained similar data on six rats, agreeing with Chanutin and Mendel at low levels of intake, the percentage of nitrogen in our low protein rations being considerably less than that in the low protein rations of Chanutin and Mendel. With our high protein rations, however, containing a percentage of nitrogen much smaller than the high protein rations of Chanutin and Mendel, all six rats showed a higher utilization of nitrogen in
by guest on July 5, 2018http://w
ww
.jbc.org/D
ownloaded from

H. H. Mitchell 919
metabolism in the period of fractional feeding as indicated by the urinary excretion than in the preceding and following periods in which the day’s food was consumed in one feeding. The data of this experiment are summarized in Tables XII and XIII.
In this experiment the protein mixture fed was the same qual- itatively in all periods, being furnished by a mixture of corn and tankage in the ratio of 85 to 15. The first ration used, containing 2.992 per cent of nitrogen, contained only this mixture of feeds.
TABLE XIII.
Nitrogenous Metabolism of Rats as A$ected by Single and Fractional Feeding.
8 ‘i: k? %
3 2 8 3 2 8
pm cm
2.992
1.531
1.043
T
1 3 1
mv. w?. ml. ml. m7. w7. m7. WT. 179 110 32 179 101 33 179 104 179 105 33 179 93 39 179 99 179 113 25 179 111 37 179 123
1 92 55 23 92 49 26 92 3 92 55 22 92 47 24 92 1 92 50 23 92 50 27 92
1 63 36 20 63 32 19 63 3 63 32 20 63 34 18 63 1 63 35 14 63 33 18 63 6 63 34 17 63 39 20 63 1 63 35 19 63 33 20 63
- Rat 3. Average weight 147 gm.
Rat 4. Average weight 138 gm.
Rat 5. Average
6.00 gm. food daily. 6.00 gm. food daily. weight 140
6.00 gm. food gm; daly.
-
- -
--
-
‘1 3 & - w. 28 38 35
49 22 52 23
32 32 32 32 32
-
17 22 23 19 24
The rations with smaller percentages of nitrogen were obtained by mixing with the first ration varying amounts of a synthetic non- protein ration, containing adequate amounts of minerals and vitamins. In all periods, each rat received the same amount of feed, with the one exception noted in the table, this amount being just sufficient, as determined in a preliminary period of several weeks duration, to maintain the rat at constant weight. On the days in which only one feeding was given, the entire amount was
by guest on July 5, 2018http://w
ww
.jbc.org/D
ownloaded from

920 Biological Value of Proteins-Results
invariably consumed within 30 minutes, generally in a much shorter time. On the other days, the fractional feedings were distributed throughout the day as evenly as practicable, excepting for the period from 11 p.m. to 6 a.m. Following a reduction in the nitrogen content of the ration, collection of urine and feces was interrupted for at least 3 days.
Since our 5 and 10 per cent protein rations contained only 0.8 to 1.6 per cent of nitrogen, the data in Tables XII and XIII afford no grounds for suspecting that the rate of absorption of a given amount of protein affected in any way the economy of its utilization in metabolism. Another factor that may plausibly operate in reducing the biological value of a given protein or protein mixture as its concentration in the ration increases, is an inevitable wastage of amino-acids in the oxidative processes of the cells. It seems unreasonable to suppose that amino-acids of dietary origin are totally immune to oxidation, or are oxidized only in so far as they are not used in anabolism, even though enough non-protein material is being consumed to cover, or more than cover, the energy demands of the body. If they are not thus totally immune to oxidation, the extent of their oxidation will depend upon their concentration in the cellular fluids with respect to the concen- tration of non-nitrogenous nutrients, which would in turn be largely dependent on the percentage of protein in the ration. If this wastage of amino-acids by oxidation increases more rapidly than the protein intake, a greater percentage loss of absorbed nitrogen, due to inevitable oxidation, will result with rations containing higher percentages of protein. A greater proportional specific dynamic effect of protein at moderate than at low levels of intake would result in this situation. This explanation, therefore, ascribes the increase in the biological value of protein as the level of intake decreases to a true protein-sparing effect of carbohydrate.
It is interesting to note in this connection that the one food for which a constant biological value of its nitrogen was obtained, was the potato, containing from 40 to 60 per cent of its nitrogen in non-protein forms.
The opinion of Martin and Robison, expressed in their recent paper on the biological value of proteins (6), that the “validity of the method adopted by Thomas for the determination of the biological values of proteins depends in the first place on the uni-
by guest on July 5, 2018http://w
ww
.jbc.org/D
ownloaded from


922 Biological Value of Proteins-Results
In Tables XIV and XV are given the metabolism data on the proteins of the navy bean (after steam-cooking) and the proteins, of the packing house by-product known as tankage. These protein mixtures are the lowest in biological value of any that we have thus far tested.
SU?vIMARY.
The biological values of the proteins (total nitrogen) of milk, corn, oats, rice, yeast, potatoes, navy beans, and the packing house by-product tankage, have been determined by a modified Thomas method described and defended in the preceding paper.
With the proteins of corn, milk, oats, and potatoes, this deter- mination was made with rations containing approximately 5 and approximately 10 per cent of protein (N X 6.25) and, with the exception of potatoes, the biological values were smaller at the higher level. The probable factors responsible for this reduction in biological value are discussed on the basis of available experi- mental data.
BIBLIOGRAPHY.
1. Nevens, W. B., J. Dairy SC., 1921, iv, 552. 2. Mitchell, H. H., and Villegas, V., J. Dairy SC., 1923, vi, 222. 3. Osborne, T. B., Mendel, L. B., and Ferry, E. L., J. Bid. Chem., 1919,
xxxvii, 223. 4. Osborne, T. B., and Mendel, L. B., J. Biol. Chem., 1920, xli, 275. 5. Chanutin, A., and Mendel, L. B., J. Metabol. Research, 1922, i, 481. 6. Martin, C. J., and Robison, R., Biochem. J., 1922, xvi, 414,446.
by guest on July 5, 2018http://w
ww
.jbc.org/D
ownloaded from

H. H. MitchellINTAKE
PROTEINS AT DIFFERENT LEVELS OF THE BIOLOGICAL VALUE OF
1924, 58:905-922.J. Biol. Chem.
http://www.jbc.org/content/58/3/905.citation
Access the most updated version of this article at
Alerts:
When a correction for this article is posted•
When this article is cited•
alerts to choose from all of JBC's e-mailClick here
ml#ref-list-1
http://www.jbc.org/content/58/3/905.citation.full.htaccessed free atThis article cites 0 references, 0 of which can be
by guest on July 5, 2018http://w
ww
.jbc.org/D
ownloaded from