the blue book - algorism book 20160825.pdfthe blue book legislator's resource book the success,...
TRANSCRIPT

Adult Education Services
THE BLUE BOOK
Legislator's Resource
Book
The Success, the Impact
and the Need
July 2016
2014-2015
PREPARED BY:
NATIONAL COUNCIL OF STATE DIRECTORS OF ADULT EDUCATION
444 NORTH CAPITOL STREET, NW
SUITE 422
WASHINGTON, DC 20001
202.624.5250 PHONE 202.624-1497 FAX
WWW.NCSDAE.ORG

Fundamentals of Adult Education
Adult education programs serve 1.5 million of the 93 million who could benefit from services. There are waiting lists in most states.
Often, undereducated adults are challenged with learning disabilities, some diagnosed and some undiagnosed. Thus, they may have average or above intelligence, but just process information differently. That might explain why they were not successful in school as children.
Forty-four percent (44%) of current adult education students are English language learners. Twelve percent (12%) are adult secondary students seeking their high school diploma or equivalent. Another Forty-four percent (44%) are native speakers below the ninth grade level. They come to adult education to leave public assistance, to qualify for employment, to help their children with homework, to become more involved in their communities, and to achieve citizenship skills.
Classes are held in public schools, community colleges, community based organizations, faith-based organizations, universities, libraries and others. That diversity links adult education with a number of other support services in the community and at work.
Eighty percent (80%) of the 46,500 adult education teachers are part-time -- mainly because most of our students can commit only part of their day to learning. Part-time teachers bring a richness from their other professions but they also require significant professional development to provide them with the skills they need to respond to the learning needs and levels of adult learners.
Two thirds ($1Billion) of the annual funding is from State and Local sources while one third ($496K) is from Federal WIOA funds.
Adult education programs are successful in meeting their performance measures as identified in the federal law and negotiated each year with the Department of Education. Those measures include: educational gains in reading, math, and/or English; completion of secondary education; transition to postsecondary education; employment; and retaining employment. The Office of Management and Budget (OMB) has rated adult education as an "Effective" program-- one of only six Department of Education programs to receive this highest rating.
The following pages provide a snapshot with charts and graphs that depict demographics and impact for the nation and for your state. The Participant data was taken directly from the NRS. Specifically, enrollment data was taken from NRS 2014-2015 Table 1; data on participant status at the time of program entry was taken
Blue Book Introduction
1
2
3
4
5
6
7
1
------------------------------------------------------------------------
8
9
National Assessment of Adult Literacy
2 NCSDAE, Adult Student Waiting List Survey 2009-2012,
http://www.ncsdae.org/2010%20Adult%20Education%20Waiting%20List%20Report.pdf
3 Vogel, Susan A. and Reeder, Stephen (Eds.), 1998, Learning Disabilities, Literacy, and Adult Education.
4 National Reporting System (NRS), Office of Vocational and Adult Education, aggregate report, table 3
5 NRS aggregate report, table 11
6 NRS report, aggregate table 14
7 NRS report, aggregate table 7
8 NRS aggregate reports, tables 4 and 7
9 http://georgewbush-whitehouse.archives.gov/omb/expectmore/summary/10000180.2006.html
July 2016
National Council of State Directors of Adult Education

Blue Book Introduction
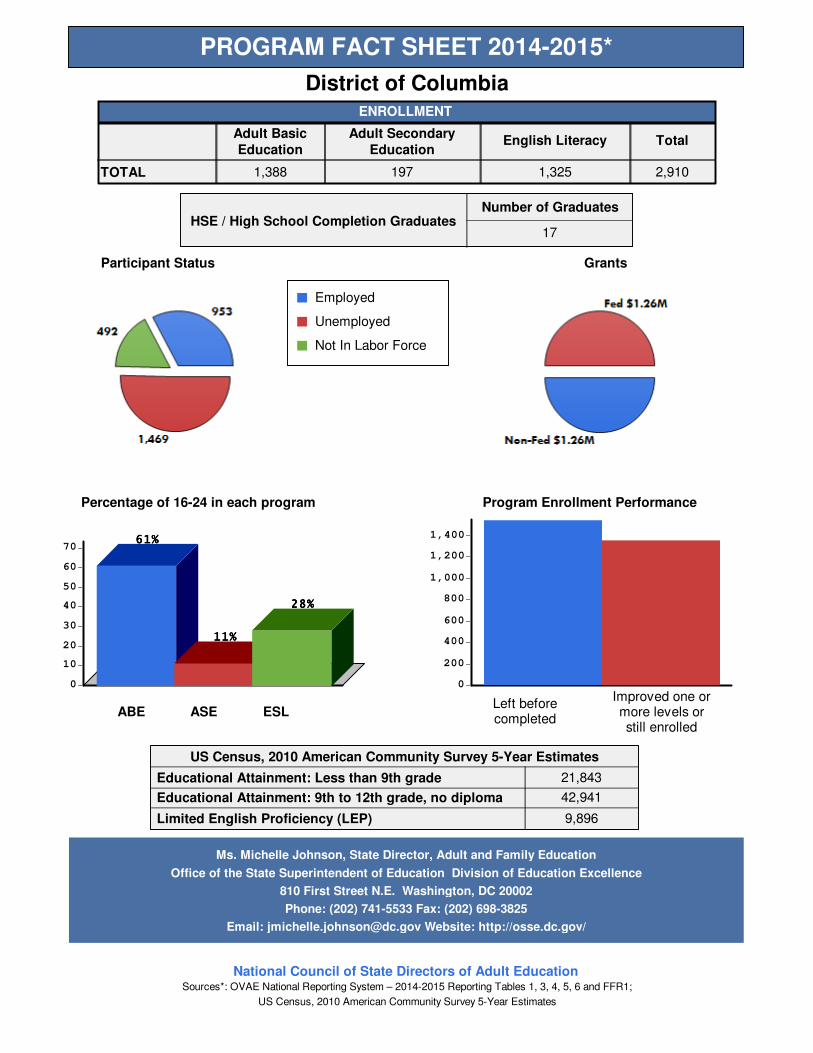
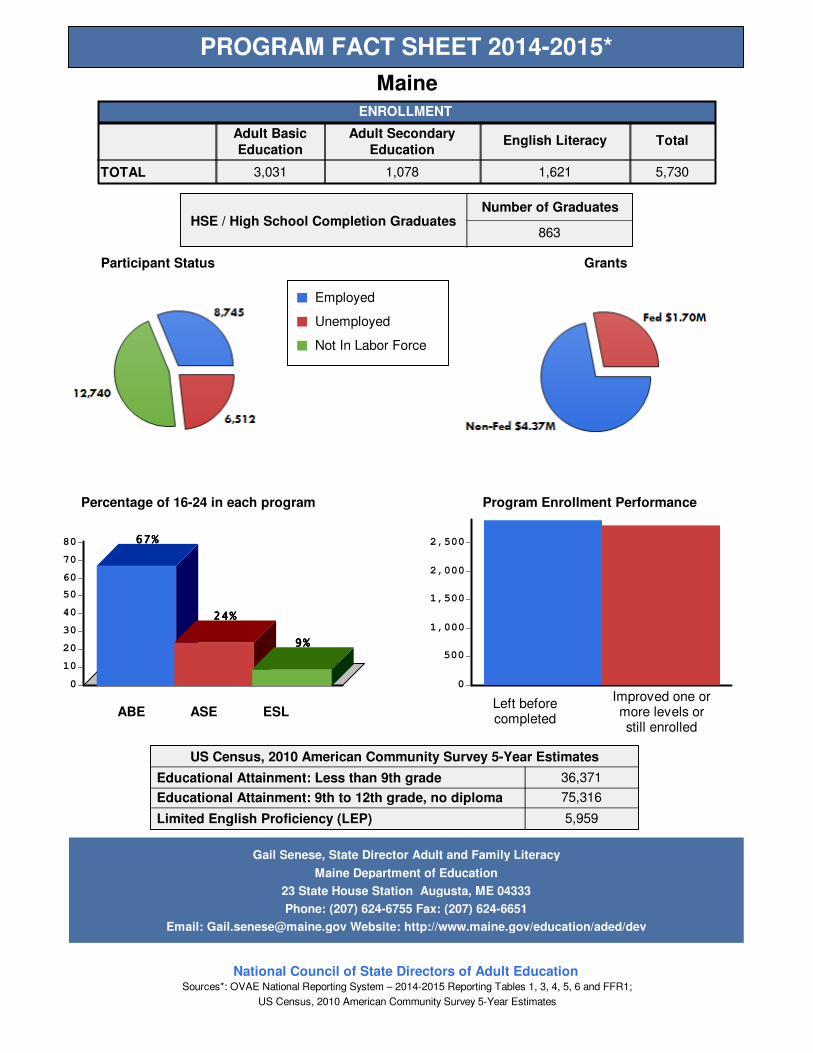
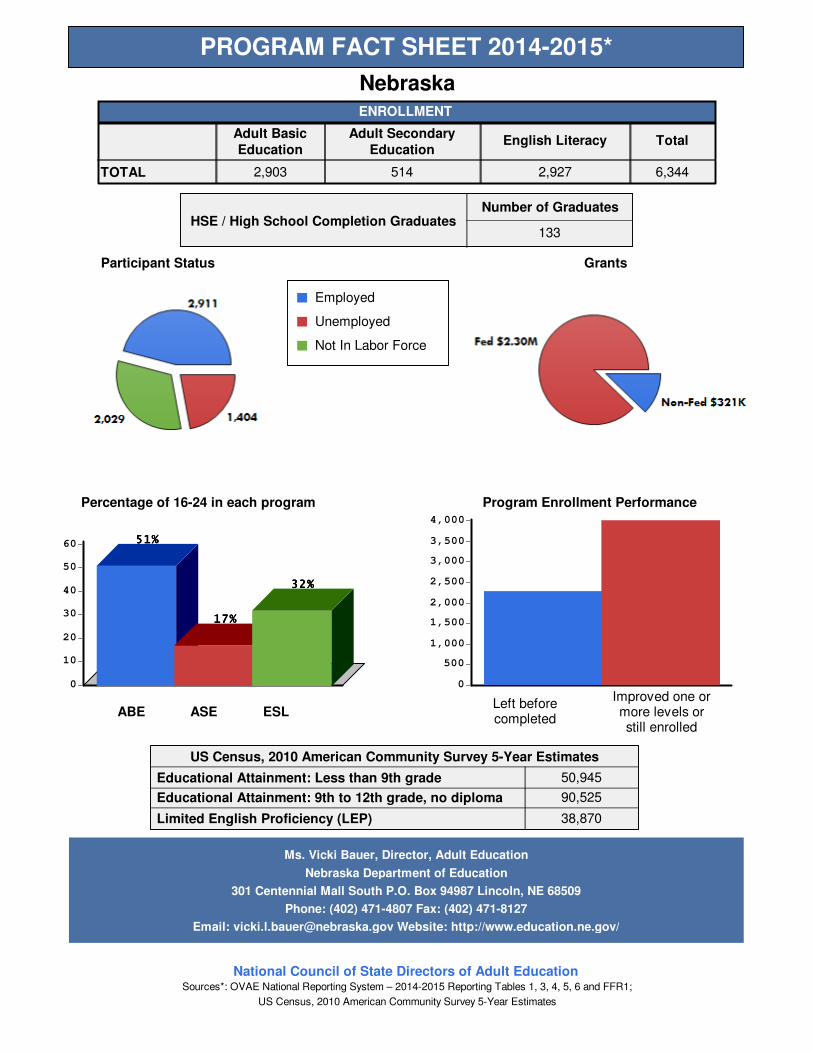
from NRS Table 6; program percentages from NRS Table 3; program performance data from NRS Table 4; GED/HS completion data from NRS Table 5; non federal funding and the federal grant from OVAE from NRS 2014-2015 Financial Status Report 1 (FSR 1). The chart at the bottom of each page shows educational levels and self-reported English language proficiency of all adults in the state, ages 25 and over; this information was taken from the U.S. Census, American Community Survey 2010 five-year projections.
The bar chart detailing younger participants, under the age of 25, shows the distribution of those learners among the three program elements: adult basic education (ABE), adult secondary education (ASE), and English as a Second Language (ESL).
Please feel free to contact your adult education state director listed at the bottom of your state’s page to say "Thank You" for a job well done and for more details on adult learning needs, opportunities, and successes in your state.
July 2016
National Council of State Directors of Adult Education

PROGRAM FACT SHEET 2014-2015*
AlaskaENROLLMENT
TOTAL
Adult Basic
Education
Adult Secondary
EducationEnglish Literacy Total
981 180 814
70
60
50
40
30
20
10
0
63%63%63%63%
16%16%16%16%21%21%21%21%
Participant Status
Employed
Unemployed
Not In Labor Force
Grants
Percentage of 16-24 in each program Program Enrollment Performance
1,200
1,000
800
600
400
200
0
Left beforecompleted
Improved one ormore levels orstill enrolled
Ms. Amy Iutzi, ABE State Director
Employment Security Division Department of Labor and Workforce Development
PO Box 115509 Juneau, AK 99811-5509
Phone: (907) 465-8714 Fax: (907) 465-4186
Email: [email protected] Website: http://labor.state.ak.us/esd/home.htm
1,975
ABE ASE ESL
98
Number of Graduates
13,027
37,868
16,287
US Census, 2010 American Community Survey 5-Year Estimates
Educational Attainment: Less than 9th grade
Educational Attainment: 9th to 12th grade, no diploma
Limited English Proficiency (LEP)
HSE / High School Completion Graduates
National Council of State Directors of Adult EducationSources*: OVAE National Reporting System – 2014-2015 Reporting Tables 1, 3, 4, 5, 6 and FFR1;
US Census, 2010 American Community Survey 5-Year Estimates

PROGRAM FACT SHEET 2014-2015*
AlabamaENROLLMENT
TOTAL
Adult Basic
Education
Adult Secondary
EducationEnglish Literacy Total
13,775 3,791 2,155
80
70
60
50
40
30
20
10
0
72%72%72%72%
22%22%22%22%
6%6%6%6%
Participant Status
Employed
Unemployed
Not In Labor Force
Grants
Percentage of 16-24 in each program Program Enrollment Performance
10,000
9,000
8,000
7,000
6,000
5,000
4,000
3,000
2,000
1,000
0
Left beforecompleted
Improved one ormore levels orstill enrolled
David Walters, State Director
Alabama Department of Postsecondary Education
135 South Union Street Room 140 Montgomery, AL 36104-4340
Phone: (334) 293-4500 Fax: (334) 293-4565
Email: [email protected] Website: http://www.accs.cc/
19,721
ABE ASE ESL
1,143
Number of Graduates
58,680
467,130
208,343
US Census, 2010 American Community Survey 5-Year Estimates
Educational Attainment: Less than 9th grade
Educational Attainment: 9th to 12th grade, no diploma
Limited English Proficiency (LEP)
HSE / High School Completion Graduates
National Council of State Directors of Adult EducationSources*: OVAE National Reporting System – 2014-2015 Reporting Tables 1, 3, 4, 5, 6 and FFR1;
US Census, 2010 American Community Survey 5-Year Estimates

PROGRAM FACT SHEET 2014-2015*
ArkansasENROLLMENT
TOTAL
Adult Basic
Education
Adult Secondary
EducationEnglish Literacy Total
9,882 3,400 3,664
70
60
50
40
30
20
10
0
63%63%63%63%
29%29%29%29%
8%8%8%8%
Participant Status
Employed
Unemployed
Not In Labor Force
Grants
Percentage of 16-24 in each program Program Enrollment Performance
8,000
7,000
6,000
5,000
4,000
3,000
2,000
1,000
0
Left beforecompleted
Improved one ormore levels orstill enrolled
Trenia Mile, State Director, Adult Education Division
Department of Workforce Education
Luther S. Hardin Building #3 Capitol Mall Little Rock, AR 72201-1083
Phone: (501) 682-1970 Fax: (501) 682-1706
Email: [email protected] Website: http://ace.arkansas.gov/adultEducation
16,946
ABE ASE ESL
1,359
Number of Graduates
44,318
255,287
136,353
US Census, 2010 American Community Survey 5-Year Estimates
Educational Attainment: Less than 9th grade
Educational Attainment: 9th to 12th grade, no diploma
Limited English Proficiency (LEP)
HSE / High School Completion Graduates
National Council of State Directors of Adult EducationSources*: OVAE National Reporting System – 2014-2015 Reporting Tables 1, 3, 4, 5, 6 and FFR1;
US Census, 2010 American Community Survey 5-Year Estimates

PROGRAM FACT SHEET 2014-2015*
American SamoaENROLLMENT
TOTAL
Adult Basic
Education
Adult Secondary
EducationEnglish Literacy Total
0 49 144
70
60
50
40
30
20
10
0
0%0%0%0%
38%38%38%38%
62%62%62%62%
Participant Status
Employed
Unemployed
Not In Labor Force
Grants
Percentage of 16-24 in each program Program Enrollment Performance
160
140
120
100
80
60
40
20
0
Left beforecompleted
Improved one ormore levels orstill enrolled
Dr. Jacinta Galea'i, Director of Education
Adult Education Literacy & Extended Learning Department of Education
Mapusaga Campus P.O. Box 2609 Pago Pago, AS 96799
Phone: (684) 699-1582 Fax: (684) 699-8793
Email: [email protected] Website: http://www.doe.as/
193
ABE ASE ESL
+
Number of Graduates
+
+
+
US Census, 2010 American Community Survey 5-Year Estimates
Educational Attainment: Less than 9th grade
Educational Attainment: 9th to 12th grade, no diploma
Limited English Proficiency (LEP)
HSE / High School Completion Graduates
National Council of State Directors of Adult EducationSources*: OVAE National Reporting System – 2014-2015 Reporting Tables 1, 3, 4, 5, 6 and FFR1;
US Census, 2010 American Community Survey 5-Year Estimates
+ Value within statistical margin of error or unknown.

PROGRAM FACT SHEET 2014-2015*
ArizonaENROLLMENT
TOTAL
Adult Basic
Education
Adult Secondary
EducationEnglish Literacy Total
7,322 917 5,261
90
80
70
60
50
40
30
20
10
0
75%75%75%75%
12%12%12%12% 13%13%13%13%
Participant Status
Employed
Unemployed
Not In Labor Force
Grants
Percentage of 16-24 in each program Program Enrollment Performance
8,000
7,000
6,000
5,000
4,000
3,000
2,000
1,000
0
Left beforecompleted
Improved one ormore levels orstill enrolled
Sheryl Hart, State Director Adult Education Services
Adult Education Services Arizona Department of Education
1535 West Jefferson Street Bin 26 Phoenix, AZ 85007
Phone: (602) 258-2410 Fax: (602) 258-4986
Email: [email protected] Website: http://www.ade.state.az.us/Adult-Ed/
13,500
ABE ASE ESL
392
Number of Graduates
340,545
447,247
288,254
US Census, 2010 American Community Survey 5-Year Estimates
Educational Attainment: Less than 9th grade
Educational Attainment: 9th to 12th grade, no diploma
Limited English Proficiency (LEP)
HSE / High School Completion Graduates
National Council of State Directors of Adult EducationSources*: OVAE National Reporting System – 2014-2015 Reporting Tables 1, 3, 4, 5, 6 and FFR1;
US Census, 2010 American Community Survey 5-Year Estimates

PROGRAM FACT SHEET 2014-2015*
CaliforniaENROLLMENT
TOTAL
Adult Basic
Education
Adult Secondary
EducationEnglish Literacy Total
79,741 43,164 181,926
40
35
30
25
20
15
10
5
0
37%37%37%37%
27%27%27%27%
36%36%36%36%
Participant Status
Employed
Unemployed
Not In Labor Force
Grants
Percentage of 16-24 in each program Program Enrollment Performance
250,000
200,000
150,000
100,000
50,000
0
Left beforecompleted
Improved one ormore levels orstill enrolled
Chris Nelson, Administrator, Adult Education Office
California Department of Education
1430 N Street Suite 6408 Sacramento, CA 95814
Phone: (888) 542-2231 Fax: (866) 941-5129
Email: [email protected] Website: http://www.cde.ca.gov/sp/ae/
304,831
ABE ASE ESL
9,480
Number of Graduates
3,627,942
2,652,542
2,573,757
US Census, 2010 American Community Survey 5-Year Estimates
Educational Attainment: Less than 9th grade
Educational Attainment: 9th to 12th grade, no diploma
Limited English Proficiency (LEP)
HSE / High School Completion Graduates
National Council of State Directors of Adult EducationSources*: OVAE National Reporting System – 2014-2015 Reporting Tables 1, 3, 4, 5, 6 and FFR1;
US Census, 2010 American Community Survey 5-Year Estimates

PROGRAM FACT SHEET 2014-2015*
ColoradoENROLLMENT
TOTAL
Adult Basic
Education
Adult Secondary
EducationEnglish Literacy Total
3,310 837 5,098
60
50
40
30
20
10
0
51%51%51%51%
20%20%20%20%
29%29%29%29%
Participant Status
Employed
Unemployed
Not In Labor Force
Grants
Percentage of 16-24 in each program Program Enrollment Performance
5,000
4,500
4,000
3,500
3,000
2,500
2,000
1,500
1,000
500
0
Left beforecompleted
Improved one ormore levels orstill enrolled
Tricia Johnson, Director of Adult Education Initiatives
Adult Education and Family Literacy Office
201 East Colfax Avenue Room 300C Denver, CO 80203
Phone: (303) 866-6640 Fax: (303) 866-6599
Email: [email protected] Website: http://www.cde.state.co.us/index_adult.htm
9,245
ABE ASE ESL
1,036
Number of Graduates
164,677
273,394
150,975
US Census, 2010 American Community Survey 5-Year Estimates
Educational Attainment: Less than 9th grade
Educational Attainment: 9th to 12th grade, no diploma
Limited English Proficiency (LEP)
HSE / High School Completion Graduates
National Council of State Directors of Adult EducationSources*: OVAE National Reporting System – 2014-2015 Reporting Tables 1, 3, 4, 5, 6 and FFR1;
US Census, 2010 American Community Survey 5-Year Estimates

PROGRAM FACT SHEET 2014-2015*
ConnecticutENROLLMENT
TOTAL
Adult Basic
Education
Adult Secondary
EducationEnglish Literacy Total
5,193 4,525 10,494
50
40
30
20
10
0
28%28%28%28%
45%45%45%45%
27%27%27%27%
Participant Status
Employed
Unemployed
Not In Labor Force
Grants
Percentage of 16-24 in each program Program Enrollment Performance
11,000
10,000
9,000
8,000
7,000
6,000
5,000
4,000
3,000
2,000
1,000
0
Left beforecompleted
Improved one ormore levels orstill enrolled
Susan A. Pierson, Education Consultant/State Adult Education Director
Bureau of Health/Nutrition, Family Services and Adult Education CT Department of Education
25 Industrial Park Road Middletown, CT 06457-1543
Phone: (860) 807-2121 Fax: (860) 807-2062
Email: [email protected] Website: http://www.state.ct.us/sde/deps/adult/index.htm
20,212
ABE ASE ESL
2,107
Number of Graduates
120,195
204,219
118,015
US Census, 2010 American Community Survey 5-Year Estimates
Educational Attainment: Less than 9th grade
Educational Attainment: 9th to 12th grade, no diploma
Limited English Proficiency (LEP)
HSE / High School Completion Graduates
National Council of State Directors of Adult EducationSources*: OVAE National Reporting System – 2014-2015 Reporting Tables 1, 3, 4, 5, 6 and FFR1;
US Census, 2010 American Community Survey 5-Year Estimates
PROGRAM FACT SHEET 2014-2015*
District of ColumbiaENROLLMENT
TOTAL
Adult Basic
Education
Adult Secondary
EducationEnglish Literacy Total
1,388 197 1,325
70
60
50
40
30
20
10
0
61%61%61%61%
11%11%11%11%
28%28%28%28%
Participant Status
Employed
Unemployed
Not In Labor Force
Grants
Percentage of 16-24 in each program Program Enrollment Performance
1,400
1,200
1,000
800
600
400
200
0
Left beforecompleted
Improved one ormore levels orstill enrolled
Ms. Michelle Johnson, State Director, Adult and Family Education
Office of the State Superintendent of Education Division of Education Excellence
810 First Street N.E. Washington, DC 20002
Phone: (202) 741-5533 Fax: (202) 698-3825
Email: [email protected] Website: http://osse.dc.gov/
2,910
ABE ASE ESL
17
Number of Graduates
9,896
42,941
21,843
US Census, 2010 American Community Survey 5-Year Estimates
Educational Attainment: Less than 9th grade
Educational Attainment: 9th to 12th grade, no diploma
Limited English Proficiency (LEP)
HSE / High School Completion Graduates
National Council of State Directors of Adult EducationSources*: OVAE National Reporting System – 2014-2015 Reporting Tables 1, 3, 4, 5, 6 and FFR1;
US Census, 2010 American Community Survey 5-Year Estimates

PROGRAM FACT SHEET 2014-2015*
DelawareENROLLMENT
TOTAL
Adult Basic
Education
Adult Secondary
EducationEnglish Literacy Total
2,433 386 1,304
80
70
60
50
40
30
20
10
0
74%74%74%74%
11%11%11%11%15%15%15%15%
Participant Status
Employed
Unemployed
Not In Labor Force
Grants
Percentage of 16-24 in each program Program Enrollment Performance
2,500
2,000
1,500
1,000
500
0
Left beforecompleted
Improved one ormore levels orstill enrolled
Ms. Maureen Whelan, State Director of Adult and Prison Education Resources
Delaware Department of Education
John W. Collette Education Resource Center 35 Commerce Way - Suite 1 Dover, DE 19904
Phone: (302) 857-3340 Fax: (302) 739-1770
Email: [email protected] Website: http://www.doe.k12.de.us/
4,123
ABE ASE ESL
80
Number of Graduates
18,024
64,918
27,008
US Census, 2010 American Community Survey 5-Year Estimates
Educational Attainment: Less than 9th grade
Educational Attainment: 9th to 12th grade, no diploma
Limited English Proficiency (LEP)
HSE / High School Completion Graduates
National Council of State Directors of Adult EducationSources*: OVAE National Reporting System – 2014-2015 Reporting Tables 1, 3, 4, 5, 6 and FFR1;
US Census, 2010 American Community Survey 5-Year Estimates

PROGRAM FACT SHEET 2014-2015*
FloridaENROLLMENT
TOTAL
Adult Basic
Education
Adult Secondary
EducationEnglish Literacy Total
69,982 15,031 86,103
60
50
40
30
20
10
0
53%53%53%53%
19%19%19%19%
28%28%28%28%
Participant Status
Employed
Unemployed
Not In Labor Force
Grants
Percentage of 16-24 in each program Program Enrollment Performance
90,000
80,000
70,000
60,000
50,000
40,000
30,000
20,000
10,000
0
Left beforecompleted
Improved one ormore levels orstill enrolled
Zelda Rogers, Director
Division of Career and Adult Education Florida Department of Education
325 West Gaines Street Suite 754 Tallahassee, FL 32399-0400
Phone: (850) 245-9906 Fax: (850) 245-9010
Email: [email protected] Website: http://www.fldoe.org/workforce/
171,116
ABE ASE ESL
3,758
Number of Graduates
1,094,203
1,426,527
778,067
US Census, 2010 American Community Survey 5-Year Estimates
Educational Attainment: Less than 9th grade
Educational Attainment: 9th to 12th grade, no diploma
Limited English Proficiency (LEP)
HSE / High School Completion Graduates
National Council of State Directors of Adult EducationSources*: OVAE National Reporting System – 2014-2015 Reporting Tables 1, 3, 4, 5, 6 and FFR1;
US Census, 2010 American Community Survey 5-Year Estimates

PROGRAM FACT SHEET 2014-2015*
GeorgiaENROLLMENT
TOTAL
Adult Basic
Education
Adult Secondary
EducationEnglish Literacy Total
31,111 3,206 9,908
90
80
70
60
50
40
30
20
10
0
82%82%82%82%
11%11%11%11%7%7%7%7%
Participant Status
Employed
Unemployed
Not In Labor Force
Grants
Percentage of 16-24 in each program Program Enrollment Performance
25,000
20,000
15,000
10,000
5,000
0
Left beforecompleted
Improved one ormore levels orstill enrolled
Beverly E. Smith, M.Ed., Assistant Commissioner Office of Adult Education
Technical College System of Georgia
1800 Century Place NE Suite 300 Atlanta, GA 30345
Phone: (404) 679-1635
Email: [email protected] Website: https://tcsg.edu/
44,225
ABE ASE ESL
2,174
Number of Graduates
274,135
804,533
399,769
US Census, 2010 American Community Survey 5-Year Estimates
Educational Attainment: Less than 9th grade
Educational Attainment: 9th to 12th grade, no diploma
Limited English Proficiency (LEP)
HSE / High School Completion Graduates
National Council of State Directors of Adult EducationSources*: OVAE National Reporting System – 2014-2015 Reporting Tables 1, 3, 4, 5, 6 and FFR1;
US Census, 2010 American Community Survey 5-Year Estimates

PROGRAM FACT SHEET 2014-2015*
GuamENROLLMENT
TOTAL
Adult Basic
Education
Adult Secondary
EducationEnglish Literacy Total
418 25 52
100
80
60
40
20
0
93%93%93%93%
7%7%7%7%0%0%0%0%
Participant Status
Employed
Unemployed
Not In Labor Force
Grants
Percentage of 16-24 in each program Program Enrollment Performance
400
350
300
250
200
150
100
50
0
Left beforecompleted
Improved one ormore levels orstill enrolled
Mary A. Y. Okada, Ed.D., President/State Director of Adult and Vocational Education
Guam Community College
P.O. Box 23069 GFM, GU 96921
Phone: (671) 735-5700 Fax: (671) 734-1003
Email: [email protected] Website: http://www.guamcc.edu/
495
ABE ASE ESL
14
Number of Graduates
14,342
11,862
+
US Census, 2010 American Community Survey 5-Year Estimates
Educational Attainment: Less than 9th grade
Educational Attainment: 9th to 12th grade, no diploma
Limited English Proficiency (LEP)
HSE / High School Completion Graduates
National Council of State Directors of Adult EducationSources*: OVAE National Reporting System – 2014-2015 Reporting Tables 1, 3, 4, 5, 6 and FFR1;
US Census, 2010 American Community Survey 5-Year Estimates
+ Value within statistical margin of error or unknown.

PROGRAM FACT SHEET 2014-2015*
HawaiiENROLLMENT
TOTAL
Adult Basic
Education
Adult Secondary
EducationEnglish Literacy Total
2,900 1,332 1,834
70
60
50
40
30
20
10
0
66%66%66%66%
27%27%27%27%
7%7%7%7%
Participant Status
Employed
Unemployed
Not In Labor Force
Grants
Percentage of 16-24 in each program Program Enrollment Performance
3,500
3,000
2,500
2,000
1,500
1,000
500
0
Left beforecompleted
Improved one ormore levels orstill enrolled
Deborah Miyao, Acting Director for Adult Basic Education
Office of Curriculum, Instruction, and Student Support/Community Education Hawaii Department of Education
475 22nd Avenue Room 202 Honolulu, HI 96816
Phone: (808) 305-9777 Fax: (808) 733-9154
Email: [email protected] Website: http://Hawaiipublicschools.org
6,066
ABE ASE ESL
1,221
Number of Graduates
54,643
59,122
44,986
US Census, 2010 American Community Survey 5-Year Estimates
Educational Attainment: Less than 9th grade
Educational Attainment: 9th to 12th grade, no diploma
Limited English Proficiency (LEP)
HSE / High School Completion Graduates
National Council of State Directors of Adult EducationSources*: OVAE National Reporting System – 2014-2015 Reporting Tables 1, 3, 4, 5, 6 and FFR1;
US Census, 2010 American Community Survey 5-Year Estimates

PROGRAM FACT SHEET 2014-2015*
IowaENROLLMENT
TOTAL
Adult Basic
Education
Adult Secondary
EducationEnglish Literacy Total
5,859 1,445 4,899
70
60
50
40
30
20
10
0
63%63%63%63%
17%17%17%17%20%20%20%20%
Participant Status
Employed
Unemployed
Not In Labor Force
Grants
Percentage of 16-24 in each program Program Enrollment Performance
7,000
6,000
5,000
4,000
3,000
2,000
1,000
0
Left beforecompleted
Improved one ormore levels orstill enrolled
Mr. Alex Harris, State Director of Adult Education
Iowa Department of Education
Grimes State Office Building 400 East 14th Street Des Moines, IA 50319-0146
Phone: (515) 281-3640 Fax: (515) 242-5988
Email: [email protected] Website: http://educateiowa.gov/
12,203
ABE ASE ESL
1,142
Number of Graduates
38,387
154,236
83,437
US Census, 2010 American Community Survey 5-Year Estimates
Educational Attainment: Less than 9th grade
Educational Attainment: 9th to 12th grade, no diploma
Limited English Proficiency (LEP)
HSE / High School Completion Graduates
National Council of State Directors of Adult EducationSources*: OVAE National Reporting System – 2014-2015 Reporting Tables 1, 3, 4, 5, 6 and FFR1;
US Census, 2010 American Community Survey 5-Year Estimates

PROGRAM FACT SHEET 2014-2015*
IdahoENROLLMENT
TOTAL
Adult Basic
Education
Adult Secondary
EducationEnglish Literacy Total
2,752 480 1,821
80
70
60
50
40
30
20
10
0
71%71%71%71%
16%16%16%16%13%13%13%13%
Participant Status
Employed
Unemployed
Not In Labor Force
Grants
Percentage of 16-24 in each program Program Enrollment Performance
2,500
2,000
1,500
1,000
500
0
Left beforecompleted
Improved one ormore levels orstill enrolled
Amelia Valasek, ABE/GED Coordinator
State Division of Professional-Technical Education
P.O. Box 83720 Boise, ID 83720-0095
Phone: (208) 334-3216 Fax: (208) 334-2365
Email: [email protected] Website: http://www.pte.idaho.gov/ABE/Home.html
5,053
ABE ASE ESL
202
Number of Graduates
28,712
93,375
44,595
US Census, 2010 American Community Survey 5-Year Estimates
Educational Attainment: Less than 9th grade
Educational Attainment: 9th to 12th grade, no diploma
Limited English Proficiency (LEP)
HSE / High School Completion Graduates
National Council of State Directors of Adult EducationSources*: OVAE National Reporting System – 2014-2015 Reporting Tables 1, 3, 4, 5, 6 and FFR1;
US Census, 2010 American Community Survey 5-Year Estimates

PROGRAM FACT SHEET 2014-2015*
IllinoisENROLLMENT
TOTAL
Adult Basic
Education
Adult Secondary
EducationEnglish Literacy Total
25,859 6,446 42,008
60
50
40
30
20
10
0
57%57%57%57%
19%19%19%19%
24%24%24%24%
Participant Status
Employed
Unemployed
Not In Labor Force
Grants
Percentage of 16-24 in each program Program Enrollment Performance
45,000
40,000
35,000
30,000
25,000
20,000
15,000
10,000
5,000
0
Left beforecompleted
Improved one ormore levels orstill enrolled
Jennifer K. Foster, Vice President Adult Education and Workforce Development
Illinois Community College Board
401 East Capitol Avenue Springfield, IL 62701-1711
Phone: (217) 785-0171 Fax: (217) 558-6700
Email: [email protected] Website: http://www.iccb.org/index.html
74,313
ABE ASE ESL
1,249
Number of Graduates
549,179
817,957
530,454
US Census, 2010 American Community Survey 5-Year Estimates
Educational Attainment: Less than 9th grade
Educational Attainment: 9th to 12th grade, no diploma
Limited English Proficiency (LEP)
HSE / High School Completion Graduates
National Council of State Directors of Adult EducationSources*: OVAE National Reporting System – 2014-2015 Reporting Tables 1, 3, 4, 5, 6 and FFR1;
US Census, 2010 American Community Survey 5-Year Estimates

PROGRAM FACT SHEET 2014-2015*
IndianaENROLLMENT
TOTAL
Adult Basic
Education
Adult Secondary
EducationEnglish Literacy Total
18,872 4,182 5,053
80
70
60
50
40
30
20
10
0
73%73%73%73%
20%20%20%20%
7%7%7%7%
Participant Status
Employed
Unemployed
Not In Labor Force
Grants
Percentage of 16-24 in each program Program Enrollment Performance
14,000
12,000
10,000
8,000
6,000
4,000
2,000
0
Left beforecompleted
Improved one ormore levels orstill enrolled
Maryln Pitzulo, Director of Adult Education
Department of Workforce Development
10 N. Senate Avenue Indianapolis, IN 46204
Phone: (317) 233-6792 Fax: (317) 233-1670
Email: [email protected] Website: http://www.in.gov/dwd/adulted.htm
28,107
ABE ASE ESL
5,408
Number of Graduates
83,483
502,349
197,827
US Census, 2010 American Community Survey 5-Year Estimates
Educational Attainment: Less than 9th grade
Educational Attainment: 9th to 12th grade, no diploma
Limited English Proficiency (LEP)
HSE / High School Completion Graduates
National Council of State Directors of Adult EducationSources*: OVAE National Reporting System – 2014-2015 Reporting Tables 1, 3, 4, 5, 6 and FFR1;
US Census, 2010 American Community Survey 5-Year Estimates

PROGRAM FACT SHEET 2014-2015*
KansasENROLLMENT
TOTAL
Adult Basic
Education
Adult Secondary
EducationEnglish Literacy Total
3,373 844 2,966
70
60
50
40
30
20
10
0
60%60%60%60%
21%21%21%21% 19%19%19%19%
Participant Status
Employed
Unemployed
Not In Labor Force
Grants
Percentage of 16-24 in each program Program Enrollment Performance
4,000
3,500
3,000
2,500
2,000
1,500
1,000
500
0
Left beforecompleted
Improved one ormore levels orstill enrolled
Dr. Susan Fish, State Director of Adult Education
Kansas Board of Regents
1000 Southwest Jackson Suite 520 Topeka, KS 66612
Phone: (785) 296-7159 Fax: (785) 296-0983
Email: [email protected] Website: http://www.kansasregents.org
7,183
ABE ASE ESL
599
Number of Graduates
60,499
156,320
80,590
US Census, 2010 American Community Survey 5-Year Estimates
Educational Attainment: Less than 9th grade
Educational Attainment: 9th to 12th grade, no diploma
Limited English Proficiency (LEP)
HSE / High School Completion Graduates
National Council of State Directors of Adult EducationSources*: OVAE National Reporting System – 2014-2015 Reporting Tables 1, 3, 4, 5, 6 and FFR1;
US Census, 2010 American Community Survey 5-Year Estimates

PROGRAM FACT SHEET 2014-2015*
KentuckyENROLLMENT
TOTAL
Adult Basic
Education
Adult Secondary
EducationEnglish Literacy Total
17,363 7,158 4,155
70
60
50
40
30
20
10
0
62%62%62%62%
30%30%30%30%
8%8%8%8%
Participant Status
Employed
Unemployed
Not In Labor Force
Grants
Percentage of 16-24 in each program Program Enrollment Performance
18,000
16,000
14,000
12,000
10,000
8,000
6,000
4,000
2,000
0
Left beforecompleted
Improved one ormore levels orstill enrolled
Mr. Reecie Stagnolia, Vice President
Council on Postsecondary Education
1024 Capital Center Drive Suite 250 Frankfort, KY 40601
Phone: (502) 573-5114 Fax: (502) 573-5436
Email: [email protected] Website: http://adulted.state.ky.us
28,676
ABE ASE ESL
1,055
Number of Graduates
37,839
370,427
243,770
US Census, 2010 American Community Survey 5-Year Estimates
Educational Attainment: Less than 9th grade
Educational Attainment: 9th to 12th grade, no diploma
Limited English Proficiency (LEP)
HSE / High School Completion Graduates
National Council of State Directors of Adult EducationSources*: OVAE National Reporting System – 2014-2015 Reporting Tables 1, 3, 4, 5, 6 and FFR1;
US Census, 2010 American Community Survey 5-Year Estimates

PROGRAM FACT SHEET 2014-2015*
LouisianaENROLLMENT
TOTAL
Adult Basic
Education
Adult Secondary
EducationEnglish Literacy Total
17,223 2,276 2,906
90
80
70
60
50
40
30
20
10
0
81%81%81%81%
14%14%14%14%
5%5%5%5%
Participant Status
Employed
Unemployed
Not In Labor Force
Grants
Percentage of 16-24 in each program Program Enrollment Performance
12,000
10,000
8,000
6,000
4,000
2,000
0
Left beforecompleted
Improved one ormore levels orstill enrolled
Raye Nell Spillman, Director of Adult Education Services
Louisiana Community and Technical College System
265 South Foster Drive Baton Rouge, LA 70806
Phone: (225) 308-4393 Fax: (225) 922-1185
Email: [email protected] Website: http://www.lctcs.edu
22,405
ABE ASE ESL
2,741
Number of Graduates
49,138
434,100
210,466
US Census, 2010 American Community Survey 5-Year Estimates
Educational Attainment: Less than 9th grade
Educational Attainment: 9th to 12th grade, no diploma
Limited English Proficiency (LEP)
HSE / High School Completion Graduates
National Council of State Directors of Adult EducationSources*: OVAE National Reporting System – 2014-2015 Reporting Tables 1, 3, 4, 5, 6 and FFR1;
US Census, 2010 American Community Survey 5-Year Estimates

PROGRAM FACT SHEET 2014-2015*
MassachusettsENROLLMENT
TOTAL
Adult Basic
Education
Adult Secondary
EducationEnglish Literacy Total
4,521 3,094 11,620
45
40
35
30
25
20
15
10
5
0
29%29%29%29%31%31%31%31%
40%40%40%40%
Participant Status
Employed
Unemployed
Not In Labor Force
Grants
Percentage of 16-24 in each program Program Enrollment Performance
14,000
12,000
10,000
8,000
6,000
4,000
2,000
0
Left beforecompleted
Improved one ormore levels orstill enrolled
Jolanta Conway, Interim State ABE Director
Department of Elementary and Secondary Education Massachusetts Department of Education
75 Pleasant Street Malden, MA 02148
Phone: (781) 338-3853 Fax: (781) 338-3394
Email: [email protected] Website: http://www.doe.mass.edu/acls/
19,235
ABE ASE ESL
472
Number of Graduates
249,823
351,030
224,135
US Census, 2010 American Community Survey 5-Year Estimates
Educational Attainment: Less than 9th grade
Educational Attainment: 9th to 12th grade, no diploma
Limited English Proficiency (LEP)
HSE / High School Completion Graduates
National Council of State Directors of Adult EducationSources*: OVAE National Reporting System – 2014-2015 Reporting Tables 1, 3, 4, 5, 6 and FFR1;
US Census, 2010 American Community Survey 5-Year Estimates

PROGRAM FACT SHEET 2014-2015*
MarylandENROLLMENT
TOTAL
Adult Basic
Education
Adult Secondary
EducationEnglish Literacy Total
11,318 2,764 13,915
60
50
40
30
20
10
0
56%56%56%56%
12%12%12%12%
32%32%32%32%
Participant Status
Employed
Unemployed
Not In Labor Force
Grants
Percentage of 16-24 in each program Program Enrollment Performance
16,000
14,000
12,000
10,000
8,000
6,000
4,000
2,000
0
Left beforecompleted
Improved one ormore levels orstill enrolled
Ms. Patricia Tyler, Deputy Assistant Secretary for Adult Education
Division of Workforce Development and Adult Learning Department of Labor, Licensing and Regulation
1100 North Eutaw Street Room 120 Baltimore, MD 21201
Phone: (410) 767-1008 Fax: (410) 333-2099
Email: [email protected] Website: http://dllr.maryland.gov/gedmd/
27,997
ABE ASE ESL
1,161
Number of Graduates
148,514
360,485
182,240
US Census, 2010 American Community Survey 5-Year Estimates
Educational Attainment: Less than 9th grade
Educational Attainment: 9th to 12th grade, no diploma
Limited English Proficiency (LEP)
HSE / High School Completion Graduates
National Council of State Directors of Adult EducationSources*: OVAE National Reporting System – 2014-2015 Reporting Tables 1, 3, 4, 5, 6 and FFR1;
US Census, 2010 American Community Survey 5-Year Estimates
PROGRAM FACT SHEET 2014-2015*
MaineENROLLMENT
TOTAL
Adult Basic
Education
Adult Secondary
EducationEnglish Literacy Total
3,031 1,078 1,621
80
70
60
50
40
30
20
10
0
67%67%67%67%
24%24%24%24%
9%9%9%9%
Participant Status
Employed
Unemployed
Not In Labor Force
Grants
Percentage of 16-24 in each program Program Enrollment Performance
2,500
2,000
1,500
1,000
500
0
Left beforecompleted
Improved one ormore levels orstill enrolled
Gail Senese, State Director Adult and Family Literacy
Maine Department of Education
23 State House Station Augusta, ME 04333
Phone: (207) 624-6755 Fax: (207) 624-6651
Email: [email protected] Website: http://www.maine.gov/education/aded/dev
5,730
ABE ASE ESL
863
Number of Graduates
5,959
75,316
36,371
US Census, 2010 American Community Survey 5-Year Estimates
Educational Attainment: Less than 9th grade
Educational Attainment: 9th to 12th grade, no diploma
Limited English Proficiency (LEP)
HSE / High School Completion Graduates
National Council of State Directors of Adult EducationSources*: OVAE National Reporting System – 2014-2015 Reporting Tables 1, 3, 4, 5, 6 and FFR1;
US Census, 2010 American Community Survey 5-Year Estimates

PROGRAM FACT SHEET 2014-2015*
MichiganENROLLMENT
TOTAL
Adult Basic
Education
Adult Secondary
EducationEnglish Literacy Total
16,644 2,235 8,564
90
80
70
60
50
40
30
20
10
0
75%75%75%75%
12%12%12%12% 13%13%13%13%
Participant Status
Employed
Unemployed
Not In Labor Force
Grants
Percentage of 16-24 in each program Program Enrollment Performance
14,000
12,000
10,000
8,000
6,000
4,000
2,000
0
Left beforecompleted
Improved one ormore levels orstill enrolled
Sean Lively, Director, Education and Career Success
Talent Investment Agency Michigan Department of Career Development
201 N. Washington Square Lansing, MI 48913
Phone: (517) 373-3430 Fax: (517) 335-3630
Email: [email protected] Website: http://www.michigan.gov/wda
27,443
ABE ASE ESL
2,299
Number of Graduates
124,667
689,022
247,045
US Census, 2010 American Community Survey 5-Year Estimates
Educational Attainment: Less than 9th grade
Educational Attainment: 9th to 12th grade, no diploma
Limited English Proficiency (LEP)
HSE / High School Completion Graduates
National Council of State Directors of Adult EducationSources*: OVAE National Reporting System – 2014-2015 Reporting Tables 1, 3, 4, 5, 6 and FFR1;
US Census, 2010 American Community Survey 5-Year Estimates

PROGRAM FACT SHEET 2014-2015*
MinnesotaENROLLMENT
TOTAL
Adult Basic
Education
Adult Secondary
EducationEnglish Literacy Total
14,804 6,185 17,623
50
40
30
20
10
0
44%44%44%44%
26%26%26%26%
30%30%30%30%
Participant Status
Employed
Unemployed
Not In Labor Force
Grants
Percentage of 16-24 in each program Program Enrollment Performance20,000
18,000
16,000
14,000
12,000
10,000
8,000
6,000
4,000
2,000
0
Left beforecompleted
Improved one ormore levels orstill enrolled
Todd Wagner, Director of ABE
Adult Basic Education Minnesota Department of Education
1500 Highway 36 West Roseville, MN 55113-4266
Phone: (651) 582-8442 Fax: (651) 634-5154
Email: [email protected] Website: http://mnabe.org/
38,612
ABE ASE ESL
686
Number of Graduates
90,290
238,582
129,996
US Census, 2010 American Community Survey 5-Year Estimates
Educational Attainment: Less than 9th grade
Educational Attainment: 9th to 12th grade, no diploma
Limited English Proficiency (LEP)
HSE / High School Completion Graduates
National Council of State Directors of Adult EducationSources*: OVAE National Reporting System – 2014-2015 Reporting Tables 1, 3, 4, 5, 6 and FFR1;
US Census, 2010 American Community Survey 5-Year Estimates

PROGRAM FACT SHEET 2014-2015*
MissouriENROLLMENT
TOTAL
Adult Basic
Education
Adult Secondary
EducationEnglish Literacy Total
12,994 1,548 5,023
90
80
70
60
50
40
30
20
10
0
76%76%76%76%
13%13%13%13%11%11%11%11%
Participant Status
Employed
Unemployed
Not In Labor Force
Grants
Percentage of 16-24 in each program Program Enrollment Performance
14,000
12,000
10,000
8,000
6,000
4,000
2,000
0
Left beforecompleted
Improved one ormore levels orstill enrolled
Elaine Bryan, State Director of Adult Education
Department of Elementary and Secondary Education
205 Jefferson Road P.O. Box 480 Jefferson City, MO 65102
Phone: (573) 526-4823 Fax: (573) 526-5710
Email: [email protected] Website: http://www.ael.mo.gov
19,565
ABE ASE ESL
2,442
Number of Graduates
52,949
447,066
193,166
US Census, 2010 American Community Survey 5-Year Estimates
Educational Attainment: Less than 9th grade
Educational Attainment: 9th to 12th grade, no diploma
Limited English Proficiency (LEP)
HSE / High School Completion Graduates
National Council of State Directors of Adult EducationSources*: OVAE National Reporting System – 2014-2015 Reporting Tables 1, 3, 4, 5, 6 and FFR1;
US Census, 2010 American Community Survey 5-Year Estimates

PROGRAM FACT SHEET 2014-2015*
Northern Mariana IslandsENROLLMENT
TOTAL
Adult Basic
Education
Adult Secondary
EducationEnglish Literacy Total
150 71 15
70
60
50
40
30
20
10
0
64%64%64%64%
36%36%36%36%
0%0%0%0%
Participant Status
Employed
Unemployed
Not In Labor Force
Grants
Percentage of 16-24 in each program Program Enrollment Performance
120
100
80
60
40
20
0
Left beforecompleted
Improved one ormore levels orstill enrolled
Ms. Fe Y. Calixterio, Director, Adult Basic Education
Northern Marianas College Commonwealth of the Northern Mariana Islands
PO Box 501250 - As Teriaje Campus Saipan, MP 96950
Phone: (670) 234-5498 Fax: (670) 235-4940
Email: [email protected] Website: http://www.nmcnet.edu
236
ABE ASE ESL
41
Number of Graduates
+
+
+
US Census, 2010 American Community Survey 5-Year Estimates
Educational Attainment: Less than 9th grade
Educational Attainment: 9th to 12th grade, no diploma
Limited English Proficiency (LEP)
HSE / High School Completion Graduates
National Council of State Directors of Adult EducationSources*: OVAE National Reporting System – 2014-2015 Reporting Tables 1, 3, 4, 5, 6 and FFR1;
US Census, 2010 American Community Survey 5-Year Estimates
+ Value within statistical margin of error or unknown.

PROGRAM FACT SHEET 2014-2015*
MississippiENROLLMENT
TOTAL
Adult Basic
Education
Adult Secondary
EducationEnglish Literacy Total
9,464 1,088 233
100
90
80
70
60
50
40
30
20
10
0
87%87%87%87%
12%12%12%12%
1%1%1%1%
Participant Status
Employed
Unemployed
Not In Labor Force
Grants
Percentage of 16-24 in each program Program Enrollment Performance
7,000
6,000
5,000
4,000
3,000
2,000
1,000
0
Left beforecompleted
Improved one ormore levels orstill enrolled
Sandy Crist, Director of Adult Literacy
Division of Adult Education Mississippi Community College Board
3825 Ridgewood Road Jackson, MS 39211
Phone: (601) 432-6338 Fax: (601) 432-6890
Email: [email protected] Website: http://www.mccb.edu
10,785
ABE ASE ESL
575
Number of Graduates
23,196
304,780
142,456
US Census, 2010 American Community Survey 5-Year Estimates
Educational Attainment: Less than 9th grade
Educational Attainment: 9th to 12th grade, no diploma
Limited English Proficiency (LEP)
HSE / High School Completion Graduates
National Council of State Directors of Adult EducationSources*: OVAE National Reporting System – 2014-2015 Reporting Tables 1, 3, 4, 5, 6 and FFR1;
US Census, 2010 American Community Survey 5-Year Estimates

PROGRAM FACT SHEET 2014-2015*
MontanaENROLLMENT
TOTAL
Adult Basic
Education
Adult Secondary
EducationEnglish Literacy Total
1,490 376 153
80
70
60
50
40
30
20
10
0
74%74%74%74%
23%23%23%23%
3%3%3%3%
Participant Status
Employed
Unemployed
Not In Labor Force
Grants
Percentage of 16-24 in each program Program Enrollment Performance
1,000
900
800
700
600
500
400
300
200
100
0
Left beforecompleted
Improved one ormore levels orstill enrolled
Ms. Margaret Bowles, Adult Basic and Literacy Education Specialist
Montana Office of Public Instruction
PO Box 202501 1300 11th Avenue Helena, MT 59620-2501
Phone: (406) 444-4443 Fax: (406) 444-1373
Email: [email protected] Website: http://www.nwlincs.org/mtlincs/index.htm
2,019
ABE ASE ESL
503
Number of Graduates
2,241
53,539
20,999
US Census, 2010 American Community Survey 5-Year Estimates
Educational Attainment: Less than 9th grade
Educational Attainment: 9th to 12th grade, no diploma
Limited English Proficiency (LEP)
HSE / High School Completion Graduates
National Council of State Directors of Adult EducationSources*: OVAE National Reporting System – 2014-2015 Reporting Tables 1, 3, 4, 5, 6 and FFR1;
US Census, 2010 American Community Survey 5-Year Estimates

PROGRAM FACT SHEET 2014-2015*
North CarolinaENROLLMENT
TOTAL
Adult Basic
Education
Adult Secondary
EducationEnglish Literacy Total
43,169 12,006 21,917
70
60
50
40
30
20
10
0
64%64%64%64%
24%24%24%24%
12%12%12%12%
Participant Status
Employed
Unemployed
Not In Labor Force
Grants
Percentage of 16-24 in each program Program Enrollment Performance50,000
45,000
40,000
35,000
30,000
25,000
20,000
15,000
10,000
5,000
0
Left beforecompleted
Improved one ormore levels orstill enrolled
Gilda Rubio-Festa, Associate Vice President of College and Career Readiness
North Carolina Community College System
5016 Mail Service Center Raleigh, NC 27699-5016
Phone: (919) 807-7132 Fax: (919) 807-7173
Email: [email protected] Website: http://www.nccommunitycolleges.edu/
77,092
ABE ASE ESL
3,393
Number of Graduates
231,284
767,123
403,696
US Census, 2010 American Community Survey 5-Year Estimates
Educational Attainment: Less than 9th grade
Educational Attainment: 9th to 12th grade, no diploma
Limited English Proficiency (LEP)
HSE / High School Completion Graduates
National Council of State Directors of Adult EducationSources*: OVAE National Reporting System – 2014-2015 Reporting Tables 1, 3, 4, 5, 6 and FFR1;
US Census, 2010 American Community Survey 5-Year Estimates

PROGRAM FACT SHEET 2014-2015*
North DakotaENROLLMENT
TOTAL
Adult Basic
Education
Adult Secondary
EducationEnglish Literacy Total
765 298 526
60
50
40
30
20
10
0
55%55%55%55%
34%34%34%34%
11%11%11%11%
Participant Status
Employed
Unemployed
Not In Labor Force
Grants
Percentage of 16-24 in each program Program Enrollment Performance
800
700
600
500
400
300
200
100
0
Left beforecompleted
Improved one ormore levels orstill enrolled
Valerie Fischer, Director
Adult Education and Family Literacy ND Department of Public Instruction
600 East Blvd. State Capitol Bismarck, ND 58505-0440
Phone: (701) 328-2393 Fax: (701) 328-4770
Email: [email protected] Website: http://www.dpi.state.nd.us/adulted/index.shtm
1,589
ABE ASE ESL
179
Number of Graduates
3,083
28,552
24,540
US Census, 2010 American Community Survey 5-Year Estimates
Educational Attainment: Less than 9th grade
Educational Attainment: 9th to 12th grade, no diploma
Limited English Proficiency (LEP)
HSE / High School Completion Graduates
National Council of State Directors of Adult EducationSources*: OVAE National Reporting System – 2014-2015 Reporting Tables 1, 3, 4, 5, 6 and FFR1;
US Census, 2010 American Community Survey 5-Year Estimates
PROGRAM FACT SHEET 2014-2015*
NebraskaENROLLMENT
TOTAL
Adult Basic
Education
Adult Secondary
EducationEnglish Literacy Total
2,903 514 2,927
60
50
40
30
20
10
0
51%51%51%51%
17%17%17%17%
32%32%32%32%
Participant Status
Employed
Unemployed
Not In Labor Force
Grants
Percentage of 16-24 in each program Program Enrollment Performance4,000
3,500
3,000
2,500
2,000
1,500
1,000
500
0
Left beforecompleted
Improved one ormore levels orstill enrolled
Ms. Vicki Bauer, Director, Adult Education
Nebraska Department of Education
301 Centennial Mall South P.O. Box 94987 Lincoln, NE 68509
Phone: (402) 471-4807 Fax: (402) 471-8127
Email: [email protected] Website: http://www.education.ne.gov/
6,344
ABE ASE ESL
133
Number of Graduates
38,870
90,525
50,945
US Census, 2010 American Community Survey 5-Year Estimates
Educational Attainment: Less than 9th grade
Educational Attainment: 9th to 12th grade, no diploma
Limited English Proficiency (LEP)
HSE / High School Completion Graduates
National Council of State Directors of Adult EducationSources*: OVAE National Reporting System – 2014-2015 Reporting Tables 1, 3, 4, 5, 6 and FFR1;
US Census, 2010 American Community Survey 5-Year Estimates

PROGRAM FACT SHEET 2014-2015*
New HampshireENROLLMENT
TOTAL
Adult Basic
Education
Adult Secondary
EducationEnglish Literacy Total
1,119 1,013 2,126
60
50
40
30
20
10
0
24%24%24%24%
56%56%56%56%
20%20%20%20%
Participant Status
Employed
Unemployed
Not In Labor Force
Grants
Percentage of 16-24 in each program Program Enrollment Performance
3,500
3,000
2,500
2,000
1,500
1,000
500
0
Left beforecompleted
Improved one ormore levels orstill enrolled
Mr. Art Ellison, Administrator
Bureau of Adult Education New Hampshire Department of Education
21 South Fruit Street Suite #20 Concord, NH 03301
Phone: (603) 271-6698 Fax: (603) 271-3454
Email: [email protected] Website: http://www.nhadulted.org/
4,258
ABE ASE ESL
447
Number of Graduates
10,413
70,009
26,884
US Census, 2010 American Community Survey 5-Year Estimates
Educational Attainment: Less than 9th grade
Educational Attainment: 9th to 12th grade, no diploma
Limited English Proficiency (LEP)
HSE / High School Completion Graduates
National Council of State Directors of Adult EducationSources*: OVAE National Reporting System – 2014-2015 Reporting Tables 1, 3, 4, 5, 6 and FFR1;
US Census, 2010 American Community Survey 5-Year Estimates

PROGRAM FACT SHEET 2014-2015*
New JerseyENROLLMENT
TOTAL
Adult Basic
Education
Adult Secondary
EducationEnglish Literacy Total
8,507 1,126 12,061
60
50
40
30
20
10
0
55%55%55%55%
9%9%9%9%
36%36%36%36%
Participant Status
Employed
Unemployed
Not In Labor Force
Grants
Percentage of 16-24 in each program Program Enrollment Performance
11,000
10,000
9,000
8,000
7,000
6,000
5,000
4,000
3,000
2,000
1,000
0
Left beforecompleted
Improved one ormore levels orstill enrolled
Howard K. Miller Jr., Chief
New Jersey Department of Labor and Workforce Development Office of Customized & Literacy Training
POB 055, Seventh Floor Trenton, NJ 08625-0055
Phone: (609) 984-4437 Fax: (609) 984-3562
Email: [email protected] Website: http://lwd.dol.state.nj.us/labor/
21,694
ABE ASE ESL
1,151
Number of Graduates
482,454
513,750
344,957
US Census, 2010 American Community Survey 5-Year Estimates
Educational Attainment: Less than 9th grade
Educational Attainment: 9th to 12th grade, no diploma
Limited English Proficiency (LEP)
HSE / High School Completion Graduates
National Council of State Directors of Adult EducationSources*: OVAE National Reporting System – 2014-2015 Reporting Tables 1, 3, 4, 5, 6 and FFR1;
US Census, 2010 American Community Survey 5-Year Estimates

PROGRAM FACT SHEET 2014-2015*
New MexicoENROLLMENT
TOTAL
Adult Basic
Education
Adult Secondary
EducationEnglish Literacy Total
8,422 1,089 5,842
90
80
70
60
50
40
30
20
10
0
76%76%76%76%
11%11%11%11%13%13%13%13%
Participant Status
Employed
Unemployed
Not In Labor Force
Grants
Percentage of 16-24 in each program Program Enrollment Performance
8,000
7,000
6,000
5,000
4,000
3,000
2,000
1,000
0
Left beforecompleted
Improved one ormore levels orstill enrolled
Frances Bannowsky, Director, Adult Basic Education
New Mexico Higher Education Department
1068 Cerrillos Road Santa Fe, NM 87501
Phone: (505) 476-8440 Fax: (505) 476-6558
Email: [email protected] Website: http://hed.state.nm.us
15,353
ABE ASE ESL
686
Number of Graduates
86,739
163,641
106,795
US Census, 2010 American Community Survey 5-Year Estimates
Educational Attainment: Less than 9th grade
Educational Attainment: 9th to 12th grade, no diploma
Limited English Proficiency (LEP)
HSE / High School Completion Graduates
National Council of State Directors of Adult EducationSources*: OVAE National Reporting System – 2014-2015 Reporting Tables 1, 3, 4, 5, 6 and FFR1;
US Census, 2010 American Community Survey 5-Year Estimates

PROGRAM FACT SHEET 2014-2015*
NevadaENROLLMENT
TOTAL
Adult Basic
Education
Adult Secondary
EducationEnglish Literacy Total
2,063 174 6,598
50
40
30
20
10
0
49%49%49%49%
5%5%5%5%
46%46%46%46%
Participant Status
Employed
Unemployed
Not In Labor Force
Grants
Percentage of 16-24 in each program Program Enrollment Performance
4,500
4,000
3,500
3,000
2,500
2,000
1,500
1,000
500
0
Left beforecompleted
Improved one ormore levels orstill enrolled
Mr. Brad Deeds, Adult Education Director & State HSE Administrator
Nevada Department of Education
755 North Roop St. Suite 201 Carson City, NV 89701
Phone: (775) 687-7289 Fax: (775) 687-8636
Email: [email protected] Website: http://www.nevadaadulteducation.org
8,835
ABE ASE ESL
441
Number of Graduates
152,409
209,573
118,612
US Census, 2010 American Community Survey 5-Year Estimates
Educational Attainment: Less than 9th grade
Educational Attainment: 9th to 12th grade, no diploma
Limited English Proficiency (LEP)
HSE / High School Completion Graduates
National Council of State Directors of Adult EducationSources*: OVAE National Reporting System – 2014-2015 Reporting Tables 1, 3, 4, 5, 6 and FFR1;
US Census, 2010 American Community Survey 5-Year Estimates

PROGRAM FACT SHEET 2014-2015*
New YorkENROLLMENT
TOTAL
Adult Basic
Education
Adult Secondary
EducationEnglish Literacy Total
38,893 4,736 59,155
60
50
40
30
20
10
0
51%51%51%51%
8%8%8%8%
41%41%41%41%
Participant Status
Employed
Unemployed
Not In Labor Force
Grants
Percentage of 16-24 in each program Program Enrollment Performance
80,000
70,000
60,000
50,000
40,000
30,000
20,000
10,000
0
Left beforecompleted
Improved one ormore levels orstill enrolled
Robert Purga, Director
Adult Education Programs and Policy Adult Career and Continuing Education Services
One Commerce Plaza 16th Floor Albany, NY 12234
Phone: (518) 474-8940 Fax: (518) 474-0319
Email: [email protected] Website: www.acces.nysed.gov/
102,784
ABE ASE ESL
4,009
Number of Graduates
1,205,949
1,359,162
951,859
US Census, 2010 American Community Survey 5-Year Estimates
Educational Attainment: Less than 9th grade
Educational Attainment: 9th to 12th grade, no diploma
Limited English Proficiency (LEP)
HSE / High School Completion Graduates
National Council of State Directors of Adult EducationSources*: OVAE National Reporting System – 2014-2015 Reporting Tables 1, 3, 4, 5, 6 and FFR1;
US Census, 2010 American Community Survey 5-Year Estimates

PROGRAM FACT SHEET 2014-2015*
OhioENROLLMENT
TOTAL
Adult Basic
Education
Adult Secondary
EducationEnglish Literacy Total
19,658 3,194 6,899
90
80
70
60
50
40
30
20
10
0
75%75%75%75%
15%15%15%15%10%10%10%10%
Participant Status
Employed
Unemployed
Not In Labor Force
Grants
Percentage of 16-24 in each program Program Enrollment Performance
20,000
15,000
10,000
5,000
0
Left beforecompleted
Improved one ormore levels orstill enrolled
Donna Albanese, State ABLE Director
Ohio Board of Regents University System of Ohio
25 South Front Street 2nd Floor Columbus, OH 43215
Phone: (614) 466-6204 Fax: (614) 752-5903
Email: [email protected] Website: http://www.ohiohighered.org
29,751
ABE ASE ESL
1,386
Number of Graduates
89,313
857,739
281,928
US Census, 2010 American Community Survey 5-Year Estimates
Educational Attainment: Less than 9th grade
Educational Attainment: 9th to 12th grade, no diploma
Limited English Proficiency (LEP)
HSE / High School Completion Graduates
National Council of State Directors of Adult EducationSources*: OVAE National Reporting System – 2014-2015 Reporting Tables 1, 3, 4, 5, 6 and FFR1;
US Census, 2010 American Community Survey 5-Year Estimates

PROGRAM FACT SHEET 2014-2015*
OklahomaENROLLMENT
TOTAL
Adult Basic
Education
Adult Secondary
EducationEnglish Literacy Total
9,083 1,193 4,281
90
80
70
60
50
40
30
20
10
0
75%75%75%75%
12%12%12%12% 13%13%13%13%
Participant Status
Employed
Unemployed
Not In Labor Force
Grants
Percentage of 16-24 in each program Program Enrollment Performance
8,000
7,000
6,000
5,000
4,000
3,000
2,000
1,000
0
Left beforecompleted
Improved one ormore levels orstill enrolled
Joe Ely, Executive Director, Lifelong Learning
Educational Support Division Oklahoma State Department of Education
Oliver Hodge Memorial Education Building 2500 North Lincoln Boulevard - Room 115 Oklahoma City, OK 73105-4599
Phone: (405) 564-4648 Fax: (405) 522-5394
Email: [email protected] Website: http://www.ok.gov/sde/
14,557
ABE ASE ESL
782
Number of Graduates
66,198
295,628
124,785
US Census, 2010 American Community Survey 5-Year Estimates
Educational Attainment: Less than 9th grade
Educational Attainment: 9th to 12th grade, no diploma
Limited English Proficiency (LEP)
HSE / High School Completion Graduates
National Council of State Directors of Adult EducationSources*: OVAE National Reporting System – 2014-2015 Reporting Tables 1, 3, 4, 5, 6 and FFR1;
US Census, 2010 American Community Survey 5-Year Estimates

PROGRAM FACT SHEET 2014-2015*
OregonENROLLMENT
TOTAL
Adult Basic
Education
Adult Secondary
EducationEnglish Literacy Total
6,000 2,040 5,767
70
60
50
40
30
20
10
0
60%60%60%60%
19%19%19%19% 21%21%21%21%
Participant Status
Employed
Unemployed
Not In Labor Force
Grants
Percentage of 16-24 in each program Program Enrollment Performance
7,000
6,000
5,000
4,000
3,000
2,000
1,000
0
Left beforecompleted
Improved one ormore levels orstill enrolled
David Moore, Adult Basic Skills State Director
Department of Community Colleges and Workforce Development
255 Capitol Street NE/PSB Salem, OR 97310
Phone: (503) 947-2448 Fax: (503) 378-3365
Email: [email protected] Website: http://cms.oregon.gov/CCWD
13,807
ABE ASE ESL
318
Number of Graduates
115,994
235,185
116,560
US Census, 2010 American Community Survey 5-Year Estimates
Educational Attainment: Less than 9th grade
Educational Attainment: 9th to 12th grade, no diploma
Limited English Proficiency (LEP)
HSE / High School Completion Graduates
National Council of State Directors of Adult EducationSources*: OVAE National Reporting System – 2014-2015 Reporting Tables 1, 3, 4, 5, 6 and FFR1;
US Census, 2010 American Community Survey 5-Year Estimates

PROGRAM FACT SHEET 2014-2015*
PennsylvaniaENROLLMENT
TOTAL
Adult Basic
Education
Adult Secondary
EducationEnglish Literacy Total
12,618 2,316 6,950
80
70
60
50
40
30
20
10
0
68%68%68%68%
17%17%17%17%15%15%15%15%
Participant Status
Employed
Unemployed
Not In Labor Force
Grants
Percentage of 16-24 in each program Program Enrollment Performance11,000
10,000
9,000
8,000
7,000
6,000
5,000
4,000
3,000
2,000
1,000
0
Left beforecompleted
Improved one ormore levels orstill enrolled
Amanda Harrison, Division Chief
Bureau of Postsecondary and Adult Education Department of Education
333 Market Street, 12th Floor Harrisburg, PA 17126-0333
Phone: (717) 772-3739 Fax: (717) 783-0583
Email: [email protected] Website: http://www.education.pa.gov
21,884
ABE ASE ESL
884
Number of Graduates
187,708
887,132
358,442
US Census, 2010 American Community Survey 5-Year Estimates
Educational Attainment: Less than 9th grade
Educational Attainment: 9th to 12th grade, no diploma
Limited English Proficiency (LEP)
HSE / High School Completion Graduates
National Council of State Directors of Adult EducationSources*: OVAE National Reporting System – 2014-2015 Reporting Tables 1, 3, 4, 5, 6 and FFR1;
US Census, 2010 American Community Survey 5-Year Estimates

PROGRAM FACT SHEET 2014-2015*
Puerto RicoENROLLMENT
TOTAL
Adult Basic
Education
Adult Secondary
EducationEnglish Literacy Total
2,160 9,800 3,146
100
90
80
70
60
50
40
30
20
10
0
11%11%11%11%
85%85%85%85%
4%4%4%4%
Participant Status
Employed
Unemployed
Not In Labor Force
Grants
Percentage of 16-24 in each program Program Enrollment Performance
14,000
12,000
10,000
8,000
6,000
4,000
2,000
0
Left beforecompleted
Improved one ormore levels orstill enrolled
Anayantzie Altieri, State Director of Adult Education Program
Puerto Rico Department of Education
P.O.Box 190759 San Juan, PR 00919
Phone: (787) 773-3474 Fax: (787) 758-6898
Email: [email protected] Website: http://www.de.gobierno.pr/
15,106
ABE ASE ESL
2,073
Number of Graduates
1,831,259
316,998
543,241
US Census, 2010 American Community Survey 5-Year Estimates
Educational Attainment: Less than 9th grade
Educational Attainment: 9th to 12th grade, no diploma
Limited English Proficiency (LEP)
HSE / High School Completion Graduates
National Council of State Directors of Adult EducationSources*: OVAE National Reporting System – 2014-2015 Reporting Tables 1, 3, 4, 5, 6 and FFR1;
US Census, 2010 American Community Survey 5-Year Estimates

PROGRAM FACT SHEET 2014-2015*
Rhode IslandENROLLMENT
TOTAL
Adult Basic
Education
Adult Secondary
EducationEnglish Literacy Total
1,794 269 2,861
60
50
40
30
20
10
0
58%58%58%58%
10%10%10%10%
32%32%32%32%
Participant Status
Employed
Unemployed
Not In Labor Force
Grants
Percentage of 16-24 in each program Program Enrollment Performance
2,500
2,000
1,500
1,000
500
0
Left beforecompleted
Improved one ormore levels orstill enrolled
Dr. Philip Less, Administrator, Adult Basic Education and GED Programs
Office of Multiple Pathways Department of Elementary and Secondary Education
255 Westminster Street Providence, RI 02903
Phone: (401) 222-8949 Fax: (401) 222-4979
Email: [email protected] Website: http://www.ride.ri.gov
4,924
ABE ASE ESL
192
Number of Graduates
45,582
78,023
51,945
US Census, 2010 American Community Survey 5-Year Estimates
Educational Attainment: Less than 9th grade
Educational Attainment: 9th to 12th grade, no diploma
Limited English Proficiency (LEP)
HSE / High School Completion Graduates
National Council of State Directors of Adult EducationSources*: OVAE National Reporting System – 2014-2015 Reporting Tables 1, 3, 4, 5, 6 and FFR1;
US Census, 2010 American Community Survey 5-Year Estimates

PROGRAM FACT SHEET 2014-2015*
South CarolinaENROLLMENT
TOTAL
Adult Basic
Education
Adult Secondary
EducationEnglish Literacy Total
20,403 6,335 4,903
70
60
50
40
30
20
10
0
66%66%66%66%
28%28%28%28%
6%6%6%6%
Participant Status
Employed
Unemployed
Not In Labor Force
Grants
Percentage of 16-24 in each program Program Enrollment Performance
16,000
14,000
12,000
10,000
8,000
6,000
4,000
2,000
0
Left beforecompleted
Improved one ormore levels orstill enrolled
Dr. David Stout, Director
Office of Adult Education & State GED Administrator Department of Education
Rutledge Building, Room 908-A 1429 Senate Street Columbia, SC 29201
Phone: (803) 734-8348 Fax: (803) 734-3643
Email: [email protected] Website: www.ed.sc.gov
31,641
ABE ASE ESL
2,389
Number of Graduates
67,833
404,705
187,827
US Census, 2010 American Community Survey 5-Year Estimates
Educational Attainment: Less than 9th grade
Educational Attainment: 9th to 12th grade, no diploma
Limited English Proficiency (LEP)
HSE / High School Completion Graduates
National Council of State Directors of Adult EducationSources*: OVAE National Reporting System – 2014-2015 Reporting Tables 1, 3, 4, 5, 6 and FFR1;
US Census, 2010 American Community Survey 5-Year Estimates

PROGRAM FACT SHEET 2014-2015*
South DakotaENROLLMENT
TOTAL
Adult Basic
Education
Adult Secondary
EducationEnglish Literacy Total
1,086 302 672
70
60
50
40
30
20
10
0
60%60%60%60%
27%27%27%27%
13%13%13%13%
Participant Status
Employed
Unemployed
Not In Labor Force
Grants
Percentage of 16-24 in each program Program Enrollment Performance
1,100
1,000
900
800
700
600
500
400
300
200
100
0
Left beforecompleted
Improved one ormore levels orstill enrolled
John Anderson, Cabinet Secretary
South Dakota Department of Labor and Regulation
700 Governors Drive Pierre, SD 57501-2291
Phone: (605) 773-3101 Fax: (605) 773-6184
Email: [email protected] Website: http://dlr.sd.gov/
2,060
ABE ASE ESL
184
Number of Graduates
5,109
42,482
27,378
US Census, 2010 American Community Survey 5-Year Estimates
Educational Attainment: Less than 9th grade
Educational Attainment: 9th to 12th grade, no diploma
Limited English Proficiency (LEP)
HSE / High School Completion Graduates
National Council of State Directors of Adult EducationSources*: OVAE National Reporting System – 2014-2015 Reporting Tables 1, 3, 4, 5, 6 and FFR1;
US Census, 2010 American Community Survey 5-Year Estimates

PROGRAM FACT SHEET 2014-2015*
TennesseeENROLLMENT
TOTAL
Adult Basic
Education
Adult Secondary
EducationEnglish Literacy Total
15,845 2,207 4,659
90
80
70
60
50
40
30
20
10
0
76%76%76%76%
15%15%15%15%9%9%9%9%
Participant Status
Employed
Unemployed
Not In Labor Force
Grants
Percentage of 16-24 in each program Program Enrollment Performance
12,000
10,000
8,000
6,000
4,000
2,000
0
Left beforecompleted
Improved one ormore levels orstill enrolled
Jason Beard, Administrator of Adult Education
Tennessee Department of Labor and Workforce Development
220 French Landing Drive Nashville, TN 37243
Phone: (615) 741-7054 Fax: (615) 532-4899
Email: [email protected] Website: http://www.state.tn.us/labor-wfd/AE/
22,711
ABE ASE ESL
6,055
Number of Graduates
83,060
533,101
296,422
US Census, 2010 American Community Survey 5-Year Estimates
Educational Attainment: Less than 9th grade
Educational Attainment: 9th to 12th grade, no diploma
Limited English Proficiency (LEP)
HSE / High School Completion Graduates
National Council of State Directors of Adult EducationSources*: OVAE National Reporting System – 2014-2015 Reporting Tables 1, 3, 4, 5, 6 and FFR1;
US Census, 2010 American Community Survey 5-Year Estimates

PROGRAM FACT SHEET 2014-2015*
TexasENROLLMENT
TOTAL
Adult Basic
Education
Adult Secondary
EducationEnglish Literacy Total
40,674 2,612 40,248
80
70
60
50
40
30
20
10
0
70%70%70%70%
6%6%6%6%
24%24%24%24%
Participant Status
Employed
Unemployed
Not In Labor Force
Grants
Percentage of 16-24 in each program Program Enrollment Performance
70,000
60,000
50,000
40,000
30,000
20,000
10,000
0
Left beforecompleted
Improved one ormore levels orstill enrolled
Anson Green, State Director, Adult Education and Literacy
Texas Workforce Commission
101 E. 15th Street, Room 416t. Austin, TX 78778
Phone: (512) 463-7419 Fax: (512) 936-3420
Email: [email protected] Website: http://www.twc.state.tx.us/svcs/adultlit/adult-basic-education.html
83,534
ABE ASE ESL
1,720
Number of Graduates
1,707,243
1,942,845
1,596,309
US Census, 2010 American Community Survey 5-Year Estimates
Educational Attainment: Less than 9th grade
Educational Attainment: 9th to 12th grade, no diploma
Limited English Proficiency (LEP)
HSE / High School Completion Graduates
National Council of State Directors of Adult EducationSources*: OVAE National Reporting System – 2014-2015 Reporting Tables 1, 3, 4, 5, 6 and FFR1;
US Census, 2010 American Community Survey 5-Year Estimates
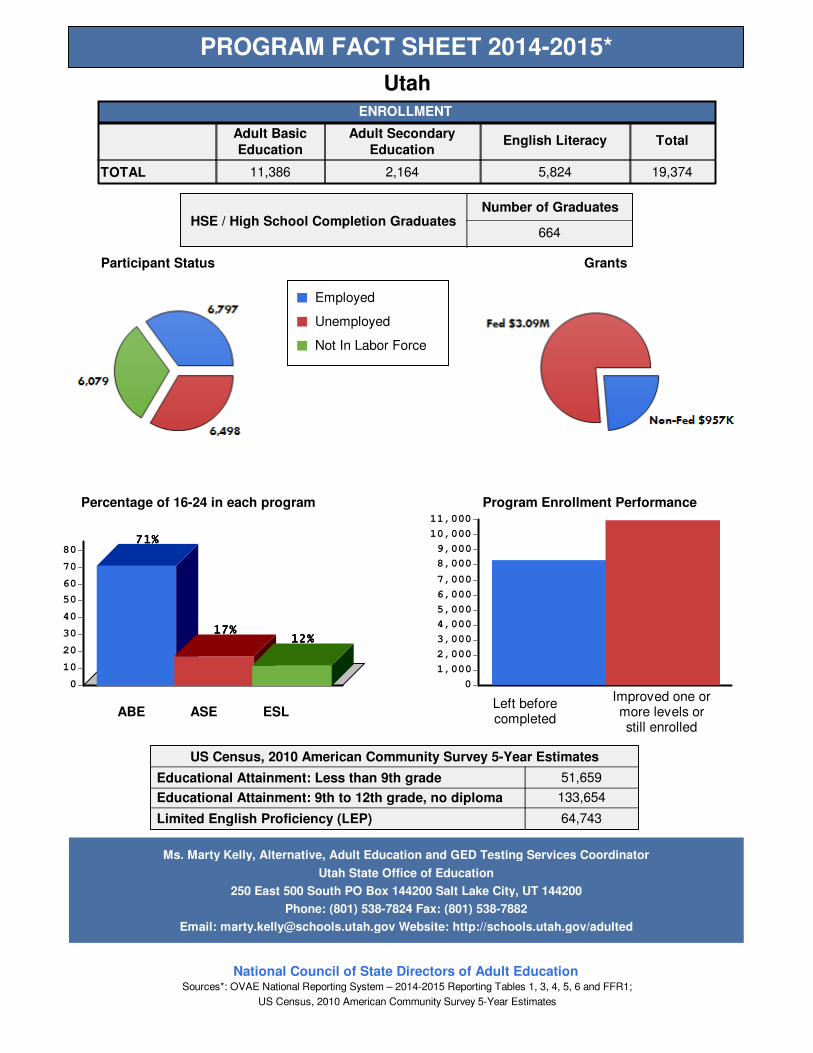
PROGRAM FACT SHEET 2014-2015*
UtahENROLLMENT
TOTAL
Adult Basic
Education
Adult Secondary
EducationEnglish Literacy Total
11,386 2,164 5,824
80
70
60
50
40
30
20
10
0
71%71%71%71%
17%17%17%17%12%12%12%12%
Participant Status
Employed
Unemployed
Not In Labor Force
Grants
Percentage of 16-24 in each program Program Enrollment Performance11,000
10,000
9,000
8,000
7,000
6,000
5,000
4,000
3,000
2,000
1,000
0
Left beforecompleted
Improved one ormore levels orstill enrolled
Ms. Marty Kelly, Alternative, Adult Education and GED Testing Services Coordinator
Utah State Office of Education
250 East 500 South PO Box 144200 Salt Lake City, UT 144200
Phone: (801) 538-7824 Fax: (801) 538-7882
Email: [email protected] Website: http://schools.utah.gov/adulted
19,374
ABE ASE ESL
664
Number of Graduates
64,743
133,654
51,659
US Census, 2010 American Community Survey 5-Year Estimates
Educational Attainment: Less than 9th grade
Educational Attainment: 9th to 12th grade, no diploma
Limited English Proficiency (LEP)
HSE / High School Completion Graduates
National Council of State Directors of Adult EducationSources*: OVAE National Reporting System – 2014-2015 Reporting Tables 1, 3, 4, 5, 6 and FFR1;
US Census, 2010 American Community Survey 5-Year Estimates

PROGRAM FACT SHEET 2014-2015*
VirginiaENROLLMENT
TOTAL
Adult Basic
Education
Adult Secondary
EducationEnglish Literacy Total
7,563 1,503 11,532
50
40
30
20
10
0
48%48%48%48%
13%13%13%13%
39%39%39%39%
Participant Status
Employed
Unemployed
Not In Labor Force
Grants
Percentage of 16-24 in each program Program Enrollment Performance
14,000
12,000
10,000
8,000
6,000
4,000
2,000
0
Left beforecompleted
Improved one ormore levels orstill enrolled
Dr. Susan M. Clair, Director
Office of Adult Education & Literacy Virginia Department of Education
101 North 14th Street James Monroe Building, 21st Floor Richmond, VA 23219-2120
Phone: (804) 786-3347 Fax: (804) 225-3352
Email: [email protected] Website: http://www.doe.virginia.gov/instruction/adulted
20,598
ABE ASE ESL
418
Number of Graduates
186,670
529,173
301,866
US Census, 2010 American Community Survey 5-Year Estimates
Educational Attainment: Less than 9th grade
Educational Attainment: 9th to 12th grade, no diploma
Limited English Proficiency (LEP)
HSE / High School Completion Graduates
National Council of State Directors of Adult EducationSources*: OVAE National Reporting System – 2014-2015 Reporting Tables 1, 3, 4, 5, 6 and FFR1;
US Census, 2010 American Community Survey 5-Year Estimates

PROGRAM FACT SHEET 2014-2015*
Virgin IslandsENROLLMENT
TOTAL
Adult Basic
Education
Adult Secondary
EducationEnglish Literacy Total
497 0 0
120
100
80
60
40
20
0
100%100%100%100%
0%0%0%0% 0%0%0%0%
Participant Status
Employed
Unemployed
Not In Labor Force
Grants
Percentage of 16-24 in each program Program Enrollment Performance
450
400
350
300
250
200
150
100
50
0
Left beforecompleted
Improved one ormore levels orstill enrolled
Mr. Eduardo J. Corneiro, State Director, Career, Technical, and Adult Education/GED Administrator
Virgin Islands Department of Education
1834 Kongens Gade St. Thomas, VI 00801
Phone: (340) 776-3484 Fax: (340) 776-3488
Email: [email protected] Website: http://www.doe.vi
497
ABE ASE ESL
+
Number of Graduates
+
+
+
US Census, 2010 American Community Survey 5-Year Estimates
Educational Attainment: Less than 9th grade
Educational Attainment: 9th to 12th grade, no diploma
Limited English Proficiency (LEP)
HSE / High School Completion Graduates
Data not available at time of printing
National Council of State Directors of Adult EducationSources*: OVAE National Reporting System – 2014-2015 Reporting Tables 1, 3, 4, 5, 6 and FFR1;
US Census, 2010 American Community Survey 5-Year Estimates
+ Value within statistical margin of error or unknown.

PROGRAM FACT SHEET 2014-2015*
VermontENROLLMENT
TOTAL
Adult Basic
Education
Adult Secondary
EducationEnglish Literacy Total
911 809 353
60
50
40
30
20
10
0
42%42%42%42%
53%53%53%53%
5%5%5%5%
Participant Status
Employed
Unemployed
Not In Labor Force
Grants
Percentage of 16-24 in each program Program Enrollment Performance
1,400
1,200
1,000
800
600
400
200
0
Left beforecompleted
Improved one ormore levels orstill enrolled
Robin Castle, State Director of Adult Education and Literacy
Vermont Agency of Education
219 North Main Street Suite 402 Barre, VT 05641
Phone: (802) 479-1279 Fax: (802) 479-1829
Email: [email protected] Website: http://www.education.vt.gov/
2,073
ABE ASE ESL
203
Number of Graduates
3,193
32,254
14,340
US Census, 2010 American Community Survey 5-Year Estimates
Educational Attainment: Less than 9th grade
Educational Attainment: 9th to 12th grade, no diploma
Limited English Proficiency (LEP)
HSE / High School Completion Graduates
National Council of State Directors of Adult EducationSources*: OVAE National Reporting System – 2014-2015 Reporting Tables 1, 3, 4, 5, 6 and FFR1;
US Census, 2010 American Community Survey 5-Year Estimates

PROGRAM FACT SHEET 2014-2015*
WashingtonENROLLMENT
TOTAL
Adult Basic
Education
Adult Secondary
EducationEnglish Literacy Total
18,706 3,183 23,673
70
60
50
40
30
20
10
0
63%63%63%63%
10%10%10%10%
27%27%27%27%
Participant Status
Employed
Unemployed
Not In Labor Force
Grants
Percentage of 16-24 in each program Program Enrollment Performance
30,000
25,000
20,000
15,000
10,000
5,000
0
Left beforecompleted
Improved one ormore levels orstill enrolled
Jon Kerr, Director
Adult Basic Education Office Washington State Board for Community and Technical Colleges
1300 Quince Street SE Olympia, WA 98504-2495
Phone: (360) 704-4326 Fax: (360) 704-4419
Email: [email protected] Website: http://www.sbctc.ctc.edu/college/e_abe.aspx
45,562
ABE ASE ESL
1,201
Number of Graduates
223,653
374,485
191,535
US Census, 2010 American Community Survey 5-Year Estimates
Educational Attainment: Less than 9th grade
Educational Attainment: 9th to 12th grade, no diploma
Limited English Proficiency (LEP)
HSE / High School Completion Graduates
National Council of State Directors of Adult EducationSources*: OVAE National Reporting System – 2014-2015 Reporting Tables 1, 3, 4, 5, 6 and FFR1;
US Census, 2010 American Community Survey 5-Year Estimates

PROGRAM FACT SHEET 2014-2015*
WisconsinENROLLMENT
TOTAL
Adult Basic
Education
Adult Secondary
EducationEnglish Literacy Total
7,473 2,277 4,461
70
60
50
40
30
20
10
0
64%64%64%64%
21%21%21%21%
15%15%15%15%
Participant Status
Employed
Unemployed
Not In Labor Force
Grants
Percentage of 16-24 in each program Program Enrollment Performance
7,000
6,000
5,000
4,000
3,000
2,000
1,000
0
Left beforecompleted
Improved one ormore levels orstill enrolled
Ms. Willa Panzer, State Director
Office of Student Development and Assessment Wisconsin Technical College System Office
4622 University Avenue PO Box 7874 Madison, WI 53707-7874
Phone: (608) 267-9065 Fax: (608) 266-1690
Email: [email protected] Website: http://www.wtcsystem.edu/
14,211
ABE ASE ESL
623
Number of Graduates
73,799
323,057
146,074
US Census, 2010 American Community Survey 5-Year Estimates
Educational Attainment: Less than 9th grade
Educational Attainment: 9th to 12th grade, no diploma
Limited English Proficiency (LEP)
HSE / High School Completion Graduates
National Council of State Directors of Adult EducationSources*: OVAE National Reporting System – 2014-2015 Reporting Tables 1, 3, 4, 5, 6 and FFR1;
US Census, 2010 American Community Survey 5-Year Estimates
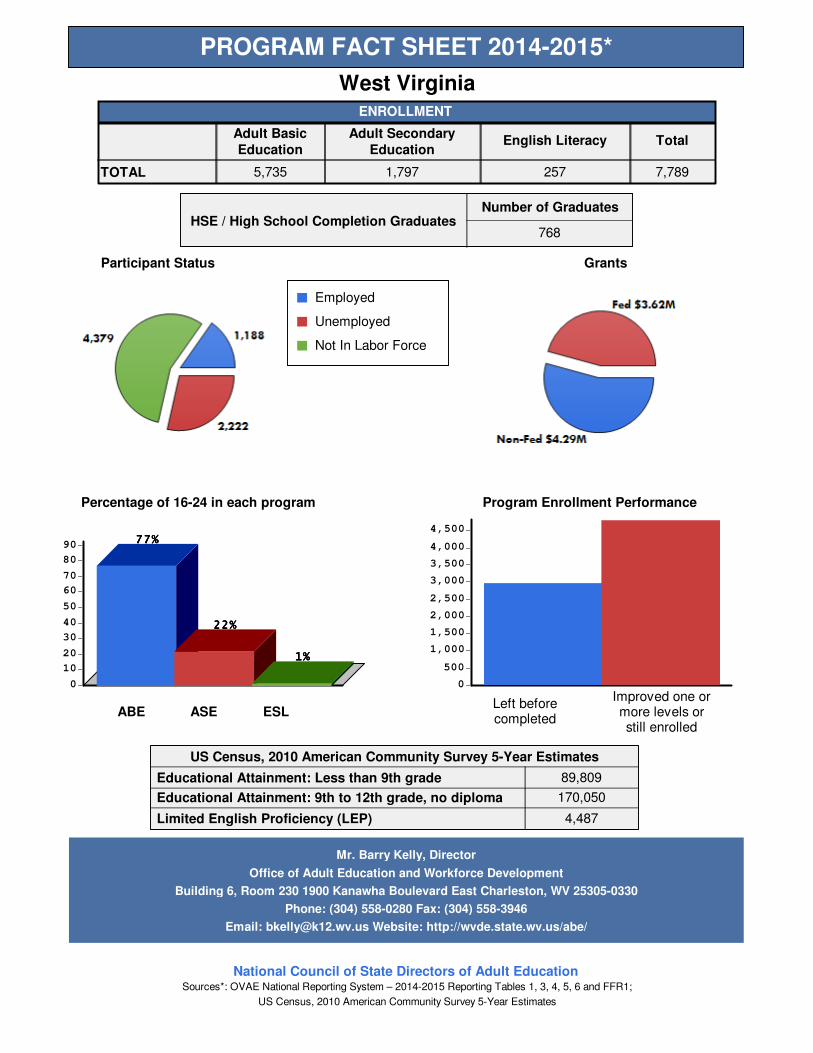
PROGRAM FACT SHEET 2014-2015*
West VirginiaENROLLMENT
TOTAL
Adult Basic
Education
Adult Secondary
EducationEnglish Literacy Total
5,735 1,797 257
90
80
70
60
50
40
30
20
10
0
77%77%77%77%
22%22%22%22%
1%1%1%1%
Participant Status
Employed
Unemployed
Not In Labor Force
Grants
Percentage of 16-24 in each program Program Enrollment Performance
4,500
4,000
3,500
3,000
2,500
2,000
1,500
1,000
500
0
Left beforecompleted
Improved one ormore levels orstill enrolled
Mr. Barry Kelly, Director
Office of Adult Education and Workforce Development
Building 6, Room 230 1900 Kanawha Boulevard East Charleston, WV 25305-0330
Phone: (304) 558-0280 Fax: (304) 558-3946
Email: [email protected] Website: http://wvde.state.wv.us/abe/
7,789
ABE ASE ESL
768
Number of Graduates
4,487
170,050
89,809
US Census, 2010 American Community Survey 5-Year Estimates
Educational Attainment: Less than 9th grade
Educational Attainment: 9th to 12th grade, no diploma
Limited English Proficiency (LEP)
HSE / High School Completion Graduates
National Council of State Directors of Adult EducationSources*: OVAE National Reporting System – 2014-2015 Reporting Tables 1, 3, 4, 5, 6 and FFR1;
US Census, 2010 American Community Survey 5-Year Estimates

PROGRAM FACT SHEET 2014-2015*
WyomingENROLLMENT
TOTAL
Adult Basic
Education
Adult Secondary
EducationEnglish Literacy Total
947 374 572
70
60
50
40
30
20
10
0
60%60%60%60%
31%31%31%31%
9%9%9%9%
Participant Status
Employed
Unemployed
Not In Labor Force
Grants
Percentage of 16-24 in each program Program Enrollment Performance
1,000
900
800
700
600
500
400
300
200
100
0
Left beforecompleted
Improved one ormore levels orstill enrolled
Ms. Marcia Hess, ABE State Director
Wyoming Community College Commission
2300 Capitol Ave, 5th Floor Suite B Cheyenne, WY 82002
Phone: (307) 777-7885 Fax: (307) 777-6567
Email: [email protected] Website: http://www.communitycolleges.wy.edu
1,893
ABE ASE ESL
428
Number of Graduates
4,786
29,017
10,332
US Census, 2010 American Community Survey 5-Year Estimates
Educational Attainment: Less than 9th grade
Educational Attainment: 9th to 12th grade, no diploma
Limited English Proficiency (LEP)
HSE / High School Completion Graduates
National Council of State Directors of Adult EducationSources*: OVAE National Reporting System – 2014-2015 Reporting Tables 1, 3, 4, 5, 6 and FFR1;
US Census, 2010 American Community Survey 5-Year Estimates

PROGRAM FACT SHEET 2014-2015*
U.S. TotalsENROLLMENT
TOTAL
Adult Basic
Education
Adult Secondary
EducationEnglish Literacy Total
682,533 181,641 670,867
60
50
40
30
20
10
0
58%58%58%58%
20%20%20%20%22%22%22%22%
Participant Status
Employed
Unemployed
Not In Labor Force
Grants
Percentage of 16-24 in each program Program Enrollment Performance
1,000,000
900,000
800,000
700,000
600,000
500,000
400,000
300,000
200,000
100,000
0
Left beforecompleted
Improved one ormore levels orstill enrolled
Office of Career, Technical and Adult Education U.S. Department of Education
400 Maryland Avenue, SW Washington, DC, US 20202-7100
Email: [email protected] Website: http://www.ed.gov/ovae
1,535,041
ABE ASE ESL
75,053
Number of Graduates
14,351,331
22,184,034
13,749,940
US Census, 2010 American Community Survey 5-Year Estimates
Educational Attainment: Less than 9th grade
Educational Attainment: 9th to 12th grade, no diploma
Limited English Proficiency (LEP)
HSE / High School Completion Graduates
National Council of State Directors of Adult EducationSources*: OVAE National Reporting System – 2014-2015 Reporting Tables 1, 3, 4, 5, 6 and FFR1;
US Census, 2010 American Community Survey 5-Year Estimates

Blue Book Epilogue
For further information, contact our D.C. Staff….
Dr. Lennox L. McLendonExecutive Director
Dr. Eugene SoferGovernment Relations Director
444 North Capitol Street, NWSuite 422
Washington, DC 20001
Or our Policy Chair….Art Ellison
Sources
National Assessment of Adult Literacyhttp://nces.ed.gov/naal/index.asp
National Reporting System (NRS)http://wdcrobcolp01.ed.gov/CFAPPS/OVAE/NRS/login.cfm
Office of Vocational and Adult Education (OVAE)http://www2.ed.gov/about/offices/list/ovae/index.html
July 2016
National Council of State Directors of Adult Education
Produced in cooperation with The Scherb Group, LLC
770.655.5578Student Data Reporting Solutions