the built environment in bc status, trends and … built environment in bc...the built environment...
TRANSCRIPT
THE BUILT ENVIRONMENT IN BC Status, Trends and Future Prospects Discussion Paper Date: October 13, 2015 Written by: Modus Planning, Design and Engagement Inc. Written for: The Real Estate Foundation of BC

ii
[page intentionally left blank for double‐sided printing]
iii
Contents
1 Executive Summary .................................................................... 1
2 Introduction .............................................................................. 10 2.1 The Built Environment as a System ...................................................... 10
2.2 The Sustainable Built Environment Movement ................................... 12
2.3 Scope and Limitations .......................................................................... 12
2.4 Structure of the Report ........................................................................ 13
2.5 Background .......................................................................................... 13
3 Review of the State of the Built Environment ........................... 14 3.1 Integrated Communities ...................................................................... 14
3.2 Housing ................................................................................................ 22
3.3 Buildings, Infrastructure & Energy ....................................................... 28
3.4 Transportation ..................................................................................... 37
3.5 First Nations ......................................................................................... 42
4 Appendix A: Resources Referenced ........................................... 46
1
1 Executive Summary
INTRODUCTION
The Real Estate Foundation of BC’s (REFBC) mission is to transform land use attitudes and practices through innovation, stewardship, and learning – with one identified focus area being the built environment. Through grant funding and other programs, REFBC helps make changes that lead to a more sustainable built environment in BC. REFBC is interested in furthering understanding of the state of the built environment movement in BC, learning how positive change towards a more sustainable built environment occurs, and using this understanding to refine its programs and collaborative efforts.
This report is the first part of a multi‐phase research study that aims to understand the state of BC’s Built Environment movement through literature research, interviews and focus groups, articulate a theory of how change happens in the built environment and then generate strategic recommendations for where and how REFBC and others can intervene most effectively in the Built Environment system to accelerate change.
This report tells a complex story that includes frustratingly slow progress in some areas, pockets of incredible innovation and progress, and some hopeful signs that attitudes and practices are changing for the better. The key question emerging from the research is whether our efforts so far are too little, too late or whether we can achieve sustainability in time to assure prosperity and a great quality of life for generations to come. As one interviewee put it, “We need to translate public dialogues (about climate resilience and affordability for example) into something viable and game changing.”
1 Sightline Institute, 2001. Sprawl and Smart Growth in Greater Vancouver.
STATUS & TRENDS
Overall, local and Provincial government policy shows good intent to support the sustainable built environment. However, there is a wide gap between intent and action with performance in some areas being poor. Generally, the level of understanding of sustainability among policy makers, professionals, and the general public is broader and deeper than 15 years ago. However, progress has stalled as policy makers and professionals have struggled to “connect the dots” with the public and at the political level, in order to implement changes that have significant impacts.
While BC is much like the rest of North America, we have a strong history of leadership in sustainability.
BC is similar to most other parts of North America in many respects. Broadly, BC shares a similar culture, economic system, technology, and high level of development and urbanization. But the province is also unusual in its history and leadership on sustainability. Perhaps the most important land use decision in BC was the establishment of the Agricultural Land Reserve (ALR), which strictly limited non‐agricultural development in large areas of otherwise prime developable land. This has not only protected valuable farmland but shaped more compact communities in BC as compared to those in neighbouring Washington and Alberta.1 This vision of compact, complete communities linked by frequent transit networks, surrounded by protected green space has been a hallmark of planning in BC and has consistently translated into successive regional growth plans with strong urban containment boundaries in many areas.
More recently, former Premier Gordon Campbell’s leadership on climate change led to the creation of BC’s Carbon Tax and a score of related initiatives, which have together helped shape a leadership position for the Province on climate
2
mitigation. In addition, “Vancouverism”2 has been promoted to cities around the world as a way to develop efficiently while maintaining high quality of life for families.
Despite this history and leadership, BC continues to face challenges in making progress towards a sustainable built environment.
The information collected as part of this research tells a clear story. While there has been some notable, albeit uneven, progress, thirty years into the “age of sustainable development,” BC continues to face the same challenges that many other jurisdictions in North America face. There are many examples:
BC residents and businesses continue to emit far more greenhouse gases than can be sustained if we are to keep global average temperature increases below 2 degrees Celsius.
BC residents use well over 300 litres/person/day of precious drinking water, well above the Canadian national average.
Transportation authorities have not been able to make real progress in shifting people into transit and active modes of transport, away from driving. With major Provincial investments in new road infrastructure and the failure of the recent transit referendum to secure additional stable transit funding, there is a danger that BC’s leadership position on sustainable land use and transportation planning is eroding.
Housing affordability is often described in crisis terms in major centres. Improving energy performance of existing buildings has been slow and
will not achieve necessary targets without strong interventions.
Even the energy‐ and carbon‐efficiency improvements of new buildings is being questioned, and the financial sustainability of our basic infrastructure is a major concern as local government investment has fallen behind, especially in smaller
2 “Vancouverism” is characterized by mixed‐use developments, typically mid‐rise buildings with a commercial podium topped by narrow residential towers on a fine‐grained block pattern with mid‐block lanes. This creates the urban density to support mass public transit, and a livable urban
communities. Last but certainly not least, the much‐lauded leadership position of Metro Vancouver (vs. other Pacific Northwest centres) in terms of land use density is slipping, according to Sightline’s most recent report.3
Fortunately, the news is not all bad.
Interest in and knowledge of climate mitigation and adaptation are strong and growing, particularly among professionals, where provincial planning and engineering associations and others have woven it into professional practice standards and positions. Although green building does not yet dominate the market, it is growing rapidly due to a coordinated effort on the part of advocates and industry leaders. The Province recently raised the bar for new construction by incorporating much higher standards into the most recent Building Code. Similarly, cross‐disciplinary efforts to drive “active transportation” from health, GHG emissions, cost, and other perspectives have led to policy changes. These changes are occurring in many communities, at the provincial level, and in health authorities, where the links between the built environment and health are now much better recognized. Higher levels of awareness and knowledge, coupled with improved coordination among major players, suggests that in many sectors the foundations may be in place to support an accelerated shift towards sustainability.
There are some particularly bright spots…
The City of Vancouver and parts of many other cities have seen gains in active transportation, mix and density of use, green building, and infrastructure. They have also leveraged development to support investments in community infrastructure like improved parks and open spaces and affordable housing. It can be argued that residents of these “smart growth” or “compact” communities have a higher quality of life, lower environmental impacts, and
environment is supported by a variety of park spaces, view corridors, and family‐oriented housing. 3 Ibid.
3
can live lower‐cost lifestyles as lower cost transportation helps balance higher housing costs. While other jurisdictions may be reluctant to acknowledge “the Vancouver model,” plenty of lessons can be learned from its leadership and its successes.
With the adoption of Greater Vancouver’s Livable Region Strategic Plan (1996), which proposed compact centres connected by transportation corridors, BC found itself a leader in linking land use and transportation policy. Following on that movement, Smart Growth BC’s leadership in the 1990s and 2000s, together with efforts of universities and a host of other organizations, accelerated knowledge and understanding of smart growth benefits and tools, leading to more sustainable community plans and policies.
Water sustainability in the built environment, climate adaptation, and green buildings are also bright spots, due to leadership and coordinated action spanning government, academia, industry, and non‐profit sectors. The rapid adoption of integrated stormwater management planning and the success of the LEED program in driving green building are strong evidence of positive, if not completely successful, approaches from which to learn.
It is encouraging that the Province recently began work on its Climate Leadership Plan 2.0, and that discussions are already underway to create a voluntary “stretch code” for local governments wanting to improve energy efficiency of buildings.
In some cases where governments are struggling to make progress alone, 'third sector' (mission driven organizations) are emerging to fill the gaps not addressed by government or business. In spite of (and perhaps because of) funding shortfalls, these organizations are adapting and becoming more entrepreneurial, and are building up their board and member capacity to withstand shocks and create more resilient communities.
Finally, technological changes in renewable energy and electric vehicles internationally may offer a way to reduce carbon emissions from transportation and avoid the need for more major electrical generation projects over the next few decades. It remains to be seen if these technologies will fulfill their promise.
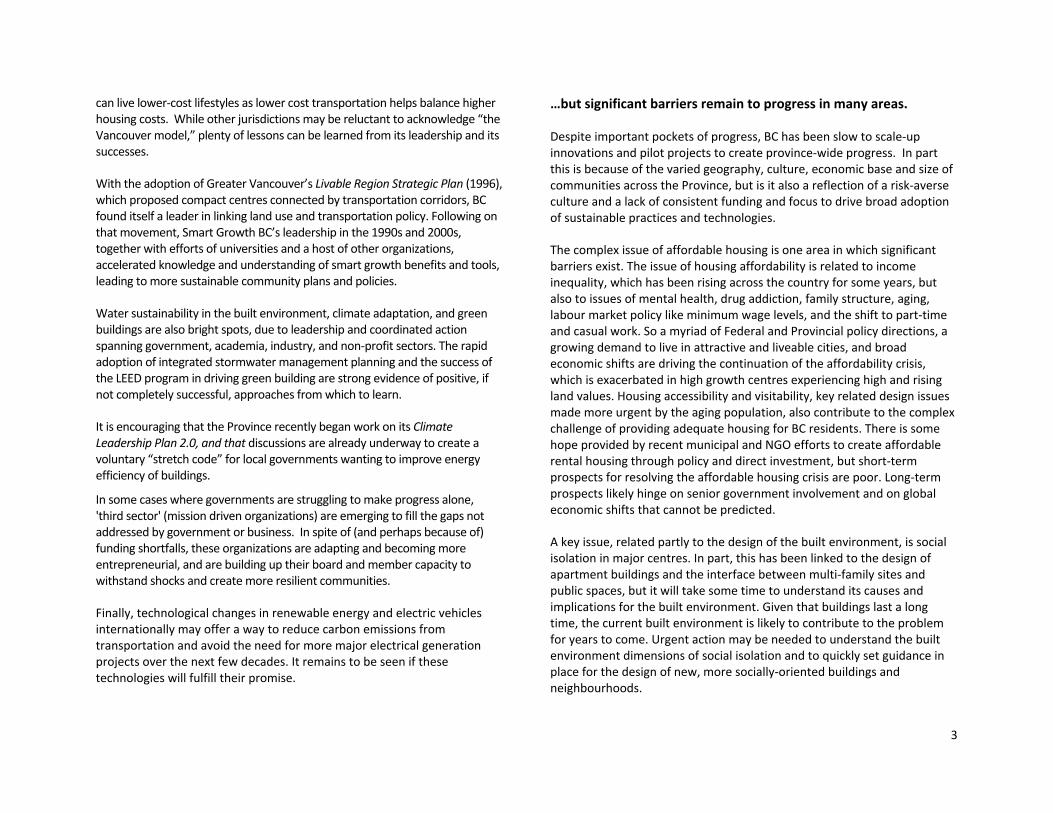
…but significant barriers remain to progress in many areas.
Despite important pockets of progress, BC has been slow to scale‐up innovations and pilot projects to create province‐wide progress. In part this is because of the varied geography, culture, economic base and size of communities across the Province, but is it also a reflection of a risk‐averse culture and a lack of consistent funding and focus to drive broad adoption of sustainable practices and technologies.
The complex issue of affordable housing is one area in which significant barriers exist. The issue of housing affordability is related to income inequality, which has been rising across the country for some years, but also to issues of mental health, drug addiction, family structure, aging, labour market policy like minimum wage levels, and the shift to part‐time and casual work. So a myriad of Federal and Provincial policy directions, a growing demand to live in attractive and liveable cities, and broad economic shifts are driving the continuation of the affordability crisis, which is exacerbated in high growth centres experiencing high and rising land values. Housing accessibility and visitability, key related design issues made more urgent by the aging population, also contribute to the complex challenge of providing adequate housing for BC residents. There is some hope provided by recent municipal and NGO efforts to create affordable rental housing through policy and direct investment, but short‐term prospects for resolving the affordable housing crisis are poor. Long‐term prospects likely hinge on senior government involvement and on global economic shifts that cannot be predicted.
A key issue, related partly to the design of the built environment, is social isolation in major centres. In part, this has been linked to the design of apartment buildings and the interface between multi‐family sites and public spaces, but it will take some time to understand its causes and implications for the built environment. Given that buildings last a long time, the current built environment is likely to contribute to the problem for years to come. Urgent action may be needed to understand the built environment dimensions of social isolation and to quickly set guidance in place for the design of new, more socially‐oriented buildings and neighbourhoods.

4
Existing buildings are a key challenge from an energy perspective as well. Without rapid, sustained, and fairly extreme interventions at a policy and practice level, energy use and GHG emission related to BC’s building stock will remain at unsustainable levels. A rapid scaling up of action is called for, together with a host of supporting efforts to create the financial, human, and cultural capital needed for success.
An increased emphasis on public engagement has had both positive and negative implications.
In BC, as elsewhere across North America, the trend towards more and better community involvement in local government decision‐making continues, much of which affects the built environment. This is improving some decisions, while slowing some processes due to NIMBY responses. In addition, social media and online tools have become a critical element in public engagement. Online tools extend the reach of engagement processes; demand more resources, skills, and capacity from organizers and participants; and, offer new ways for communities to organize and influence decisions, sometimes for the better and sometimes for the worse for sustainability. This suggests that new approaches are needed for community engagement if we are to develop new and varied forms of housing in existing communities.
Small communities face similar issues as large communities, but with different priorities and opportunities and constraints for action.
Small communities face many of the same issues as larger communities – infrastructure deficits, high water use, poor energy performance, transportation dominated by single occupant vehicles for example. However, many small communities are shrinking while larger ones are growing, leaving small communities with fewer levers for change.
4 The Fraser Basin Council in a 2014 study identified small town priorities for the built environment as higher density suitable for a small town, protection of drinking water and protection of agricultural land, but also found that many small town staff
Economic stability and resilience are key goals for rural and small communities in BC with a history of boom‐bust cycles driven by international commodity markets and business models which extract resources over a single generation.4
While challenges remain, First Nations are emerging as a powerful force in shaping the built environment.
There is strong alignment between First Nations traditions and sustainability, potentially a strong foundation for a sustainable built environment for First Nations. However, colonization, residential schools, the federal Indian Act and subsequent legislation have left most communities severely stretched, struggling to meet basic needs and often lacking adequate basic infrastructure. With limited resources, their priorities often focus on mental and physical health, leaving little space for other concerns. Peri‐urban and urban communities are in the best shape, but the built environment for many Nations is in poor condition, a problem only made worse as population growth puts pressure on reserve infrastructure and buildings.
Despite the colonial history, First Nations are emerging as a powerful force in shaping the built environment. Empowered by recent legal recognition of rights and title, the signing of significant modern day treaties such as those with the Nisga’a and Tsawwassen, and the relatively new ability to create their own land codes, First Nations are beginning to shape the built environment to fit with their own powerful visions of sustainability.
There is a lack of coherent information about what is going on.
Compiling this report was challenging, in part because of the complexity of the topic but also because there is a lack of reliable, consistent reporting on a set of sustainability metrics across the Province. The demise of the
and elected officials surveyed thought that addressing these priorities was not very realistic.

5
long‐form census and lack of funding for organizations such as Statistics BC means that we just don’t know how well (or poorly) we are doing in many key areas.
While larger jurisdictions like Metro Vancouver have put in a place a comprehensive monitoring and reporting system for sustainability, and the Community Energy and Emissions Inventory contains some useful secondary indicators, there is a lack of readily available reporting for the rest of the Province, especially for smaller communities.
6
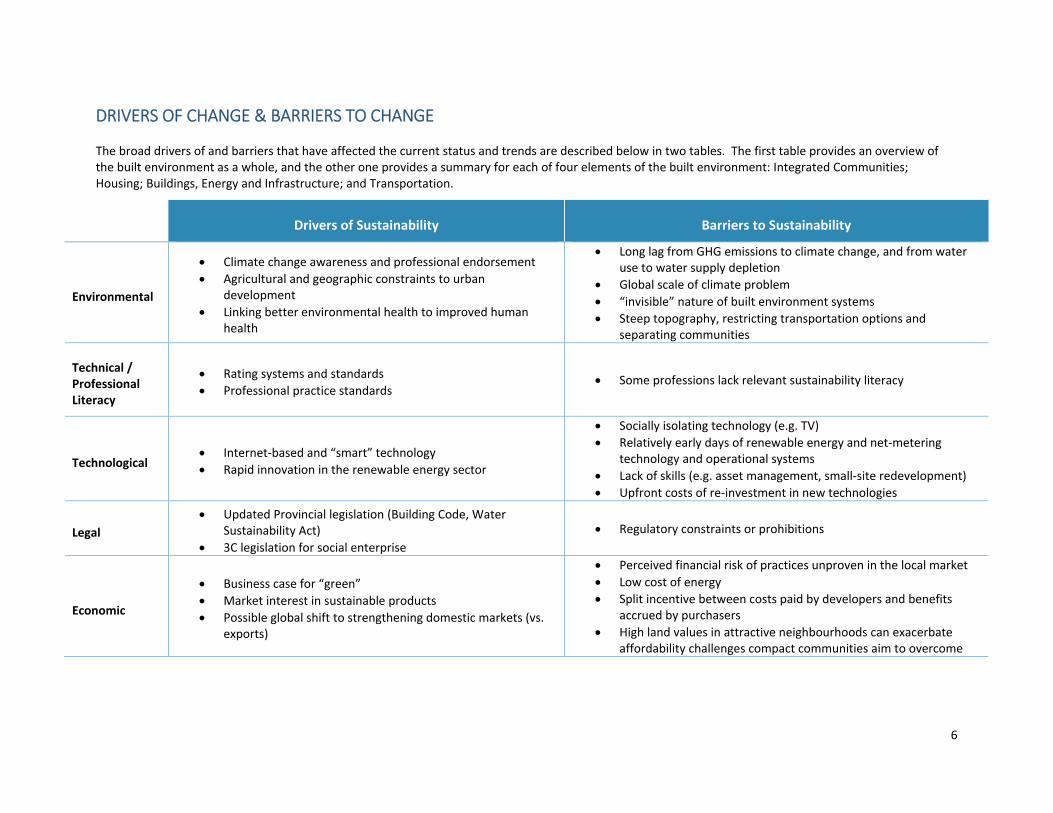
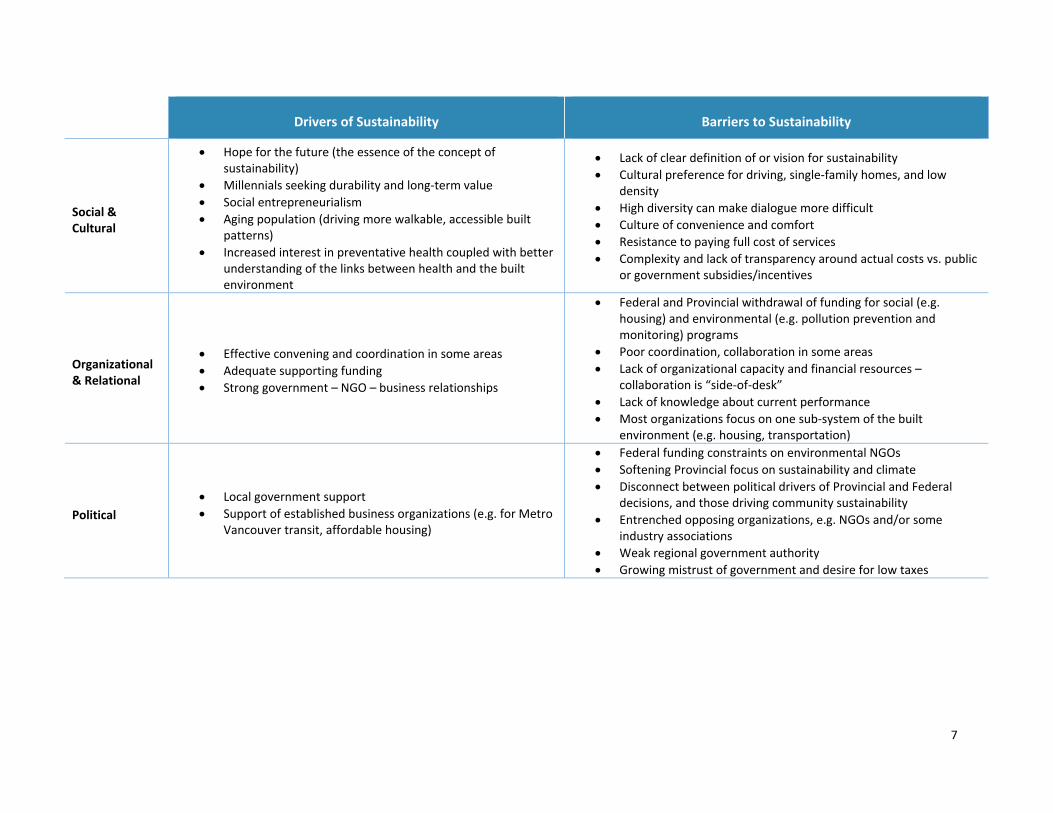
DRIVERS OF CHANGE & BARRIERS TO CHANGE
The broad drivers of and barriers that have affected the current status and trends are described below in two tables. The first table provides an overview of the built environment as a whole, and the other one provides a summary for each of four elements of the built environment: Integrated Communities; Housing; Buildings, Energy and Infrastructure; and Transportation.
Drivers of Sustainability Barriers to Sustainability
Environmental
Climate change awareness and professional endorsement Agricultural and geographic constraints to urban
development Linking better environmental health to improved human
health
Long lag from GHG emissions to climate change, and from water use to water supply depletion
Global scale of climate problem “invisible” nature of built environment systems Steep topography, restricting transportation options and
separating communities
Technical / Professional Literacy
Rating systems and standards Professional practice standards
Some professions lack relevant sustainability literacy
Technological Internet‐based and “smart” technology Rapid innovation in the renewable energy sector
Socially isolating technology (e.g. TV) Relatively early days of renewable energy and net‐metering
technology and operational systems Lack of skills (e.g. asset management, small‐site redevelopment) Upfront costs of re‐investment in new technologies
Legal Updated Provincial legislation (Building Code, Water
Sustainability Act) 3C legislation for social enterprise
Regulatory constraints or prohibitions
Economic
Business case for “green” Market interest in sustainable products Possible global shift to strengthening domestic markets (vs.
exports)
Perceived financial risk of practices unproven in the local market Low cost of energy Split incentive between costs paid by developers and benefits
accrued by purchasers High land values in attractive neighbourhoods can exacerbate
affordability challenges compact communities aim to overcome
7
Drivers of Sustainability Barriers to Sustainability
Social & Cultural
Hope for the future (the essence of the concept of sustainability)
Millennials seeking durability and long‐term value Social entrepreneurialism Aging population (driving more walkable, accessible built
patterns) Increased interest in preventative health coupled with better
understanding of the links between health and the built environment
Lack of clear definition of or vision for sustainability Cultural preference for driving, single‐family homes, and low
density High diversity can make dialogue more difficult Culture of convenience and comfort Resistance to paying full cost of services Complexity and lack of transparency around actual costs vs. public
or government subsidies/incentives
Organizational & Relational
Effective convening and coordination in some areas Adequate supporting funding Strong government – NGO – business relationships
Federal and Provincial withdrawal of funding for social (e.g. housing) and environmental (e.g. pollution prevention and monitoring) programs
Poor coordination, collaboration in some areas Lack of organizational capacity and financial resources –
collaboration is “side‐of‐desk” Lack of knowledge about current performance Most organizations focus on one sub‐system of the built
environment (e.g. housing, transportation)
Political Local government support Support of established business organizations (e.g. for Metro
Vancouver transit, affordable housing)
Federal funding constraints on environmental NGOs Softening Provincial focus on sustainability and climate Disconnect between political drivers of Provincial and Federal
decisions, and those driving community sustainability Entrenched opposing organizations, e.g. NGOs and/or some
industry associations Weak regional government authority Growing mistrust of government and desire for low taxes
8
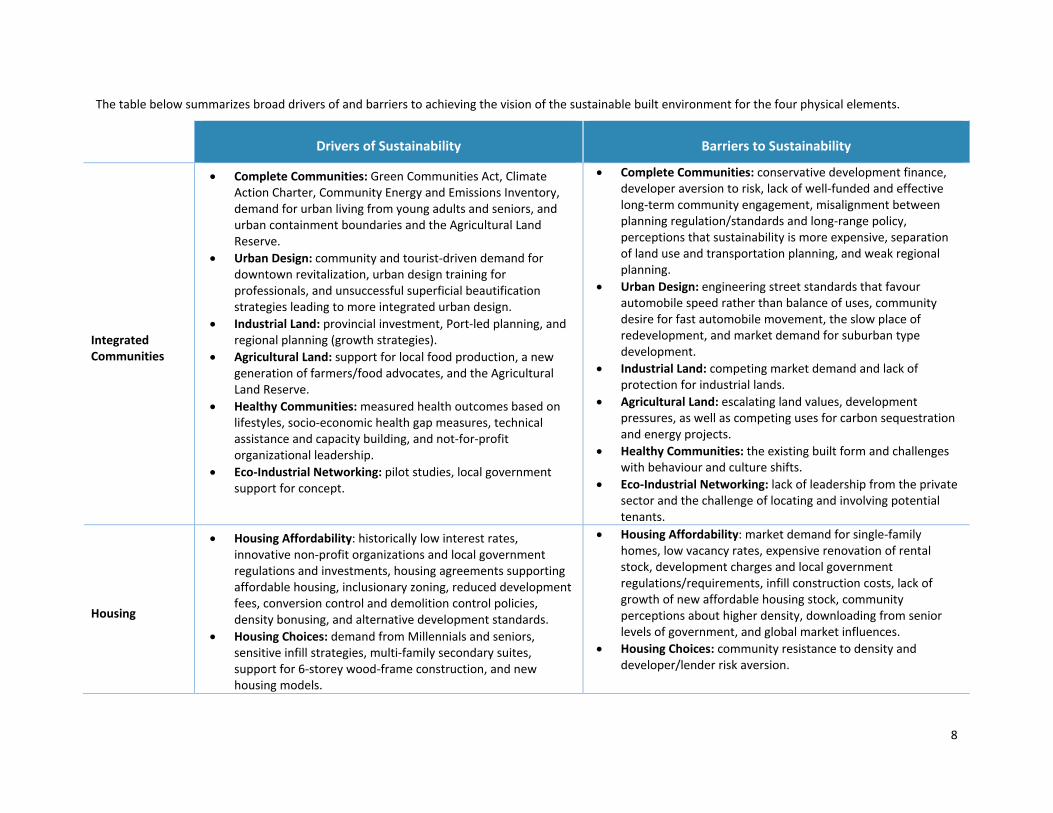
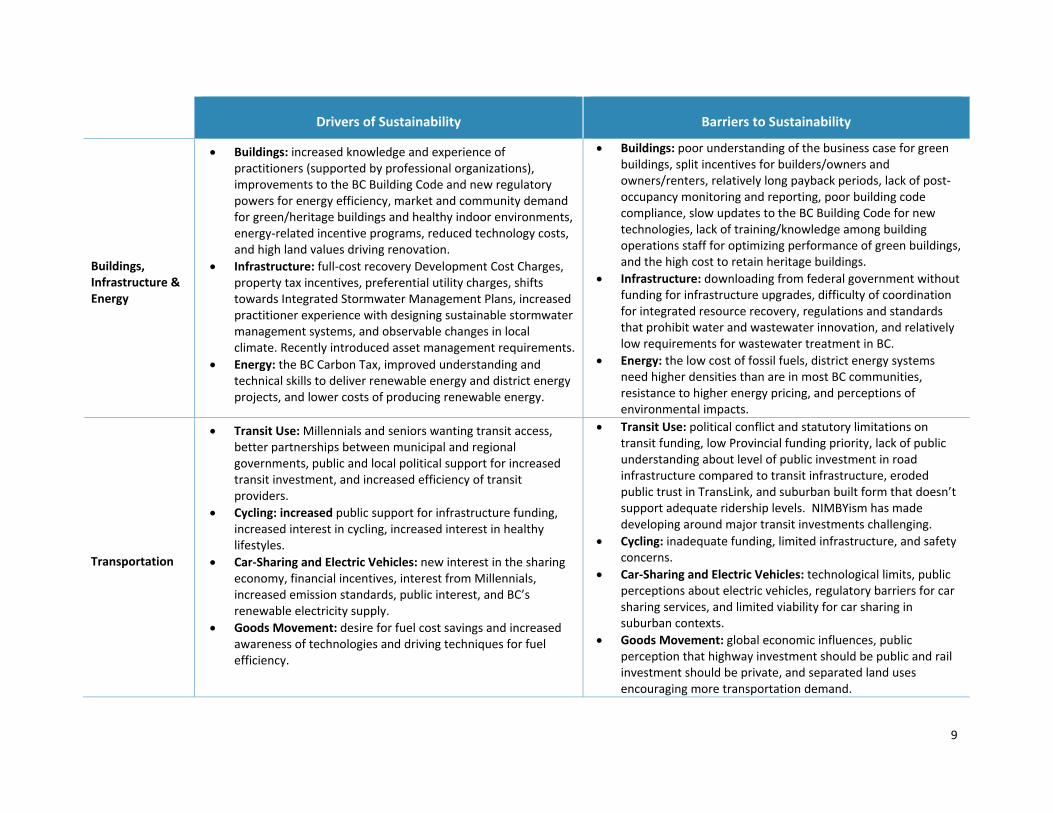
The table below summarizes broad drivers of and barriers to achieving the vision of the sustainable built environment for the four physical elements.
Drivers of Sustainability Barriers to Sustainability
Integrated Communities
Complete Communities: Green Communities Act, Climate Action Charter, Community Energy and Emissions Inventory, demand for urban living from young adults and seniors, and urban containment boundaries and the Agricultural Land Reserve.
Urban Design: community and tourist‐driven demand for downtown revitalization, urban design training for professionals, and unsuccessful superficial beautification strategies leading to more integrated urban design.
Industrial Land: provincial investment, Port‐led planning, and regional planning (growth strategies).
Agricultural Land: support for local food production, a new generation of farmers/food advocates, and the Agricultural Land Reserve.
Healthy Communities: measured health outcomes based on lifestyles, socio‐economic health gap measures, technical assistance and capacity building, and not‐for‐profit organizational leadership.
Eco‐Industrial Networking: pilot studies, local government support for concept.
Complete Communities: conservative development finance, developer aversion to risk, lack of well‐funded and effective long‐term community engagement, misalignment between planning regulation/standards and long‐range policy, perceptions that sustainability is more expensive, separation of land use and transportation planning, and weak regional planning.
Urban Design: engineering street standards that favour automobile speed rather than balance of uses, community desire for fast automobile movement, the slow place of redevelopment, and market demand for suburban type development.
Industrial Land: competing market demand and lack of protection for industrial lands.
Agricultural Land: escalating land values, development pressures, as well as competing uses for carbon sequestration and energy projects.
Healthy Communities: the existing built form and challenges with behaviour and culture shifts.
Eco‐Industrial Networking: lack of leadership from the private sector and the challenge of locating and involving potential tenants.
Housing
Housing Affordability: historically low interest rates, innovative non‐profit organizations and local government regulations and investments, housing agreements supporting affordable housing, inclusionary zoning, reduced development fees, conversion control and demolition control policies, density bonusing, and alternative development standards.
Housing Choices: demand from Millennials and seniors, sensitive infill strategies, multi‐family secondary suites, support for 6‐storey wood‐frame construction, and new housing models.
Housing Affordability: market demand for single‐family homes, low vacancy rates, expensive renovation of rental stock, development charges and local government regulations/requirements, infill construction costs, lack of growth of new affordable housing stock, community perceptions about higher density, downloading from senior levels of government, and global market influences.
Housing Choices: community resistance to density and developer/lender risk aversion.
9
Drivers of Sustainability Barriers to Sustainability
Buildings, Infrastructure & Energy
Buildings: increased knowledge and experience of practitioners (supported by professional organizations), improvements to the BC Building Code and new regulatory powers for energy efficiency, market and community demand for green/heritage buildings and healthy indoor environments, energy‐related incentive programs, reduced technology costs, and high land values driving renovation.
Infrastructure: full‐cost recovery Development Cost Charges, property tax incentives, preferential utility charges, shifts towards Integrated Stormwater Management Plans, increased practitioner experience with designing sustainable stormwater management systems, and observable changes in local climate. Recently introduced asset management requirements.
Energy: the BC Carbon Tax, improved understanding and technical skills to deliver renewable energy and district energy projects, and lower costs of producing renewable energy.
Buildings: poor understanding of the business case for green buildings, split incentives for builders/owners and owners/renters, relatively long payback periods, lack of post‐occupancy monitoring and reporting, poor building code compliance, slow updates to the BC Building Code for new technologies, lack of training/knowledge among building operations staff for optimizing performance of green buildings, and the high cost to retain heritage buildings.
Infrastructure: downloading from federal government without funding for infrastructure upgrades, difficulty of coordination for integrated resource recovery, regulations and standards that prohibit water and wastewater innovation, and relatively low requirements for wastewater treatment in BC.
Energy: the low cost of fossil fuels, district energy systems need higher densities than are in most BC communities, resistance to higher energy pricing, and perceptions of environmental impacts.
Transportation
Transit Use: Millennials and seniors wanting transit access, better partnerships between municipal and regional governments, public and local political support for increased transit investment, and increased efficiency of transit providers.
Cycling: increased public support for infrastructure funding, increased interest in cycling, increased interest in healthy lifestyles.
Car‐Sharing and Electric Vehicles: new interest in the sharing economy, financial incentives, interest from Millennials, increased emission standards, public interest, and BC’s renewable electricity supply.
Goods Movement: desire for fuel cost savings and increased awareness of technologies and driving techniques for fuel efficiency.
Transit Use: political conflict and statutory limitations on transit funding, low Provincial funding priority, lack of public understanding about level of public investment in road infrastructure compared to transit infrastructure, eroded public trust in TransLink, and suburban built form that doesn’t support adequate ridership levels. NIMBYism has made developing around major transit investments challenging.
Cycling: inadequate funding, limited infrastructure, and safety concerns.
Car‐Sharing and Electric Vehicles: technological limits, public perceptions about electric vehicles, regulatory barriers for car sharing services, and limited viability for car sharing in suburban contexts.
Goods Movement: global economic influences, public perception that highway investment should be public and rail investment should be private, and separated land uses encouraging more transportation demand.

10
2 Introduction The Real Estate Foundation of BC (REFBC) has a mandate “to undertake and carry out real estate public and professional education, real estate law reform, real estate research, and other projects intended for the public or professional good in relation to real estate activities” where real estate is defined as property consisting of land, and the buildings, structures, and natural resources on it. Within this mandate REFBC’s mission is to transform land use attitudes and practices through innovation, stewardship, and learning – with one identified focus area being the built environment. Through grant funding and other programs, REFBC helps make changes that lead to a more sustainable built environment in BC. REFBC is interested in furthering understanding of the state of the built environment movement in BC, learning how positive change towards a more sustainable built environment occurs, and using this understanding to refine its programs and collaborative efforts.
Modus Planning, Design & Engagement Inc. was hired to assist with research that aims to understand progress towards a sustainable built environment movement in BC, including current status, trends, drivers of change, and barriers to progress. This project involved:
Literature review of the state of the sustainable built environment movement in BC;
Focus groups, interviews, and questionnaires with expert practitioners to explore the state of the sustainable built environment; and,
Development of initial strategic recommendations for REFBC and other partners.
In parallel with this project, REFBC is conducting public opinion research to better understand attitudes and beliefs about the built environment amongst the general public. As a whole, the research will result in a report of findings that includes strategic recommendations for REFBC that can be used to guide program refinements and strategic planning and respond to the Foundation’s mandate and mission.
2.1 The Built Environment as a System
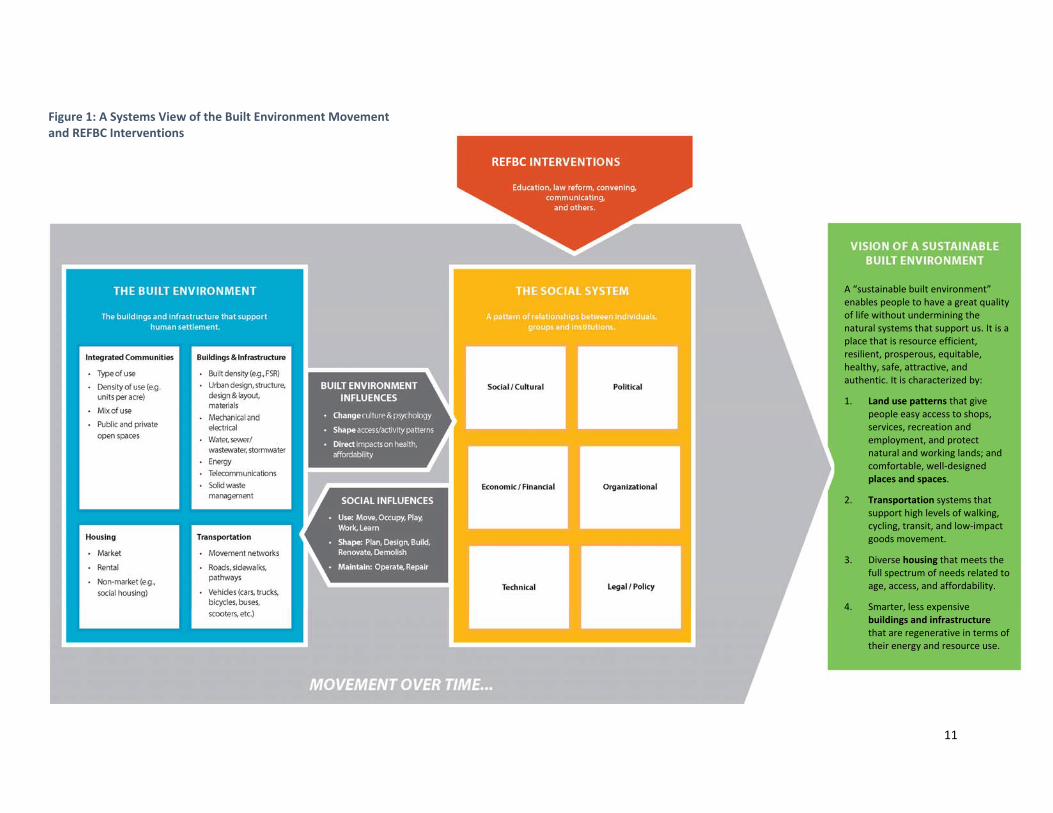
The built environment encompasses the places and spaces created or modified by people for human habitation and use, including public spaces, housing, workplaces, roads, and other infrastructure that support human settlement and daily life. For this study we have divided the built environment into four linked sub‐systems (see systems diagram on following page):
Integrated Communities (land use, public space, density, etc.) Housing (market, rental, non‐market, etc.) Buildings, Infrastructure & Energy (water/sewer/stormwater
infrastructure, energy infrastructure, building design, etc.) Transportation (movement networks, roads, sidewalks, paths,
vehicles, etc.)
The performance of the built environment – and its sustainability – rests in large part on how people use, shape, and maintain it. People:
Use the built environment by moving, occupying, playing, learning, and working;
Shape the built environment by planning, designing, building, renovating, and demolishing; and,
Maintain the built environment by operating and repairing components.
Finally, the built environment shapes beliefs and patterns of behaviour, shaping the social system.
11
A “sustainable built environment” enables people to have a great quality of life without undermining the natural systems that support us. It is a place that is resource efficient, resilient, prosperous, equitable, healthy, safe, attractive, and authentic. It is characterized by:
1. Land use patterns that give people easy access to shops, services, recreation and employment, and protect natural and working lands; and comfortable, well‐designed places and spaces.
2. Transportation systems that support high levels of walking, cycling, transit, and low‐impact goods movement.
3. Diverse housing that meets the full spectrum of needs related to age, access, and affordability.
4. Smarter, less expensive buildings and infrastructure that are regenerative in terms of their energy and resource use.
REFBC
Figure 1: A Systems View of the Built Environment Movement and REFBC Interventions
12
2.2 The Sustainable Built Environment Movement
The sustainable built environment movement describes the combination of a) shifts taking place in the built environment that work towards a “sustainable” vision of the future, and b) the process by which they are prompted and reinforced through the interventions of various actors in the system. This research considers interventions that can be made in the built environment system by an organization such as REFBC, its partners, and/or its grantees. Such interventions can include:
education, capacity‐building, and cultural change initiatives; regulatory, policy, or governance changes; awareness raising and dissemination of information; research and development; funding of projects and assets; financial incentives/penalties; and, collaboration and coordination with other organizations Including
government, industry, professional associations, and NGOs.
2.3 Scope and Limitations
This report is based on readily available literature about the state of the built environment in BC, as well as information gathered from focus groups, expert interviews, and a survey.
To produce the report, the authors:
Obtained reports recommended by REFBC staff; Brainstormed topics, issues, and organizations related to BC’s
sustainable built environment; Gathered potentially useful documents from identified
organizations, and others identified in the course of document gathering, primarily from internet sources but supplemented through requests to the authors’ network of contacts;
Scanned documents for information about current status, trends, drivers, and barriers;
Conducted focus group and interviews with a total of 51 BC experts, and surveyed another 61; and,
Developed a narrative on the basis of this information.
In general, sources and information were preferred if they: related directly to BC and/or were indicative of performance that could be expected across the province; offered a strategic perspective and credible data/information about the state of affairs in BC; and, if they represented a fair perspective. Top‐line statistical information was used, where available, to paint a picture of current status and trends, acknowledging that the selection of this data is value‐laden. Many of the source documents describe in far greater detail the status, trends, barriers, and drivers of change which may be useful in future to REFBC and other audiences. Given time and space constraints, it was not possible to reflect that level of detail in this report. Readers are encouraged to consult the list of references (Appendix B) and review source documents for more information.
The topic of the sustainable built environment movement in BC is huge. Given the breadth of this scope, this document is, of course, not a complete picture of the state of the Built Environment in BC. However, the authors hope it provides enough information to encourage further reflection and discussion that can be used to build up a more complete picture over time.
13
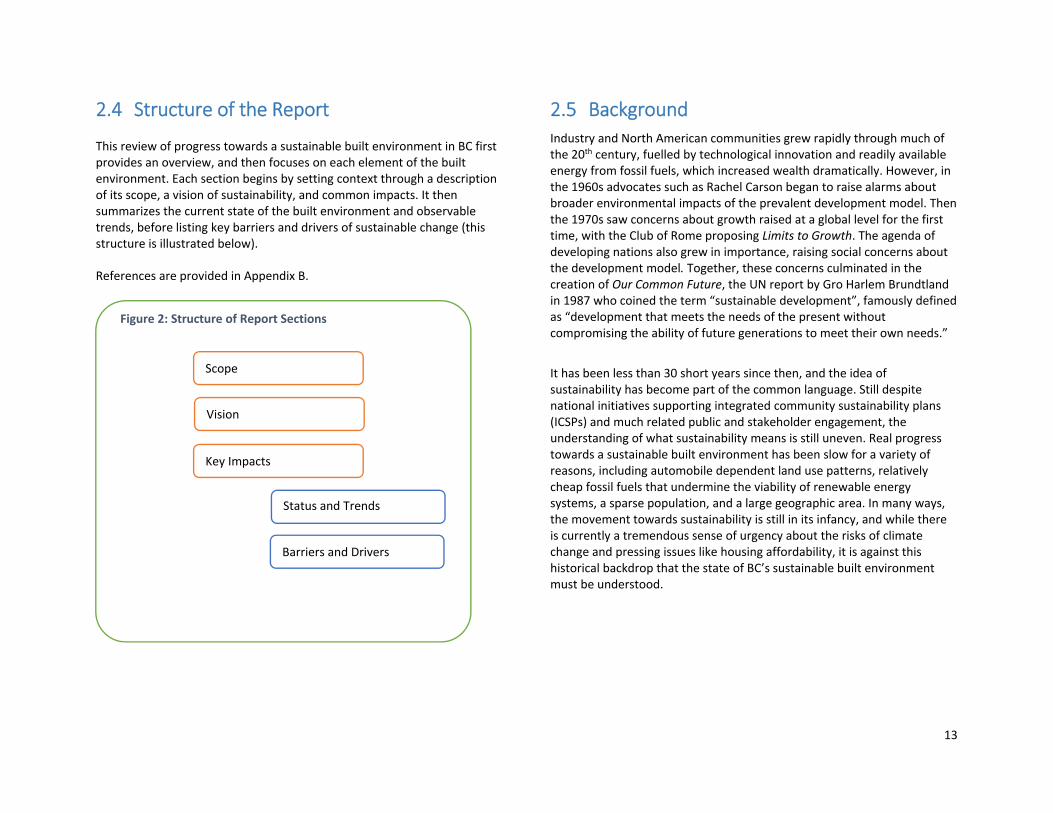
2.4 Structure of the Report
This review of progress towards a sustainable built environment in BC first provides an overview, and then focuses on each element of the built environment. Each section begins by setting context through a description of its scope, a vision of sustainability, and common impacts. It then summarizes the current state of the built environment and observable trends, before listing key barriers and drivers of sustainable change (this structure is illustrated below).
References are provided in Appendix B.
2.5 Background Industry and North American communities grew rapidly through much of the 20th century, fuelled by technological innovation and readily available energy from fossil fuels, which increased wealth dramatically. However, in the 1960s advocates such as Rachel Carson began to raise alarms about broader environmental impacts of the prevalent development model. Then the 1970s saw concerns about growth raised at a global level for the first time, with the Club of Rome proposing Limits to Growth. The agenda of developing nations also grew in importance, raising social concerns about the development model. Together, these concerns culminated in the creation of Our Common Future, the UN report by Gro Harlem Brundtland in 1987 who coined the term “sustainable development”, famously defined as “development that meets the needs of the present without compromising the ability of future generations to meet their own needs.”
It has been less than 30 short years since then, and the idea of sustainability has become part of the common language. Still despite national initiatives supporting integrated community sustainability plans (ICSPs) and much related public and stakeholder engagement, the understanding of what sustainability means is still uneven. Real progress towards a sustainable built environment has been slow for a variety of reasons, including automobile dependent land use patterns, relatively cheap fossil fuels that undermine the viability of renewable energy systems, a sparse population, and a large geographic area. In many ways, the movement towards sustainability is still in its infancy, and while there is currently a tremendous sense of urgency about the risks of climate change and pressing issues like housing affordability, it is against this historical backdrop that the state of BC’s sustainable built environment must be understood.
Figure 2: Structure of Report Sections
Scope
Vision
Key Impacts
Status and Trends
Barriers and Drivers
14
3 Review of the State of the Built Environment
This chapter focuses on defining the scope and key impacts for the four elements of the sustainable built environment (Integrated Communities; Housing; Buildings, Energy, & Infrastructure; and Transportation). It then identifies the status and trends for each element, including key barriers to and drivers of change, to achieve the vision for a sustainable built environment in BC.
3.1 Integrated Communities
SCOPE
Integrated Communities refers to inter‐related “land uses” and “open space.” Land use refers to the type of development on private and public land. Open spaces include the streets, plazas, and parks located “between the buildings” that connect these land uses together.
This study includes on greenfield, greyfield, infill, and brownfield development in rural communities, suburban, and urban areas with the lenses of transit‐oriented development; compact, complete, and mixed‐use communities; eco‐industrial networking; land use intensification; and, growth management.
VISION
Compact, complete communities where infrastructure, transportation, density, building forms, and social infrastructure interconnect to create
5 Litman, Todd. 2015. “Analysis of Public Policies That Unintentionally Encourage and Subsidize Urban Sprawl.” Supporting paper commissioned by LSE on behalf of the Global Commission on the Economy and Climate.
inspirational, affordable places where people can enjoy a high quality of life with minimal environmental impacts while protecting surrounding natural and working lands.
KEY IMPACTS
Health and safety historically connected to land use
Historically, health and safety has been a core tenet of land use decisions. Community planning considers public health through the creation of green space to promote physical activity, social integration, and better mental health; by preventing infectious diseases with community infrastructure, such as drinking water and sewage systems; and, by protecting people from hazardous industrial exposures and injury, by separating uses, or mitigating their effects through other interventions.
Low‐density, auto‐oriented, single purpose land use has negative health and economic outcomes
Conventional land use practices over the past 50 years have separated homes, jobs, and shops from each other in low‐density, auto‐oriented formats. Compared with compact, mixed‐use development, sprawl typically increases per capita land consumption 60‐80% and motor vehicle travel by 20‐60%.5
Land use decisions affect infrastructure construction, operations, maintenance & replacement costs
Drinking water treatment, sewage infrastructure, policing, fire services, recycling and garbage pick‐up, and other local government services sit quietly at the centre of people’s daily lives. Research indicates that suburban and exurban communities pay much higher per capita land
15
development costs than more compact communities.6 In addition, low‐density development puts pressure on agricultural and ecological lands.
“Urban” places are more attractive in the new economy
Communities that succeed in the new, knowledge‐driven economy have qualities attractive to the “creative class” or “knowledge workers.” These qualities include a strong sense of place, a healthy environment, high quality recreational amenities, diverse housing and shopping choices, multi‐modal transportation choices, high speed internet access, cultural and social diversity, and a rich arts and entertainment scene. Generally, more “urban” places offer these economically attractive features.
Integrated regional planning leads to more sustainable outcomes
Coordination of planning at a regional scale can offer solutions to common problems of “leapfrog development” and rural‐ and semi‐rural sprawl. Although political regional boundaries rarely line up with bioregional areas (i.e. to facilitate watershed planning), comprehensive regional land use and resource planning can set long‐term expectations about the balance between protection, conservation, and development.
Environmentally sensitive, agricultural, and industrial lands need need protection from development and encroachment
Environmentally‐sensitive and agriculturally productive lands must be protected from development and encroachment. The population of BC grows by approximately 60,000 people annually.7 Much of this growth
6 Ibid. 7 Curran, Deborah. 2012. “Implementing Regional Sustainability Strategies.” Maintaining Natural BC for Our Children: Selected Law Reform Proposals.
occurs in our most ecologically sensitive and agriculturally productive areas. A 2008 comprehensive assessment of the province’s natural environment concluded that ecosystem resilience is decreasing due to the cumulative impacts of human activities, including ecosystem degradation from forestry, oil and gas development, and transportation and utility corridors.8 Climate change is also reducing ecosystem resiliency.
Furthermore, 80% of BC’s population and 80% of the most productive farmland are in the same two‐percent of the province’s land base – the Lower Mainland.9 Additionally, most BC rural communities are located in valleys that contain the most fertile, relatively flat land. Once developed, future remediation and restoration of farmland is unlikely and costly. The Agricultural Land Reserve (ALR), established in 1973, created a reserve of 4.7 million hectares of agricultural land to help prevent the loss of arable lands and it has been incredibly successful at doing this as well as shaping land use patterns and density increases.
Industry has historically been located near ports, rivers, and raw materials, attracting workers from many locations. While industrial uses often complete for the same land as conservation and agricultural lands, all three types of land uses are facing residential encroachment in BC. In fact, in the past 30 years, local governments have rezoned 3,000 hectares of industrial land, and as of 2013 Metro Vancouver had only an estimated 20‐year supply of industrial land remaining.10
8 Biodiversity BC. 2008. Taking Nature’s Pulse: The Status of Biodiversity in British Columbia. 9 Curran, 2012. 10 BC Chamber of Commerce. 2013. “Protection of Industrial Lands for Future Prosperity.”

16
Civic Engagement and Democracy are supported by free access to public space
Public streets and squares have been historically used as sites for political expression. Highly visible and open gathering places, public spaces are sites for demonstrations, marches, commercial activity, and social interaction. In the last three decades, public space has also become contested space for the poor and the homeless. Law enforcement to remove panhandlers and temporary shelters from streets and public places targets vulnerable groups for behaviours that result from poverty, homelessness, and mental health issues.
STATUS & TRENDS
Complete communities
As a result of historic planning policies often supported low‐density, auto‐oriented land use, BC is now seeing suburban sprawl outpacing the rate of growth in city centres by more than 160%.11 In many BC communities, local governments are developing community‐scale plans (OCPs and ICSPs) and local area plans that support compact, mixed‐use, and walkable communities. Many of these are supported by the Province’s Smart Planning program.
The Green Communities Act (2008) provided local governments with additional tools to reduce community greenhouse gas emissions, conserve water and energy, and work towards more compact and sustainable communities through long‐range planning, development cost charge flexibility, and expanded Development Permit Area authority. As of 2015, about half of BC local governments have a plan to reduce energy and emissions in their community.
11 Thompson, David. 2013. Suburban Sprawl: Exposing hidden costs, identifying solutions. Sustainable Prosperity.
Some BC communities have taken advantage of the expanded Development Permit Areas authority since 2008, including:
Resort Municipality of Whistler City of Fort St. John District of Lake Country District of Sooke District of North Vancouver City of Richmond
Local governments are also using Development Cost Charges (DCCs) to promote more compact development. Small dwelling units of less than 29 square metres can be exempt from DCCs, encouraging this form of small‐unit affordable housing. Local governments can also reduce DCCs for small lots. Such policies are being used in Maple Ridge, Kelowna, Penticton, Sooke, and City of Surrey.
Creating complete communities, either through new construction or infill, is helping local governments reduce long‐term infrastructure maintenance and replacement costs. For example, the Regional District of Nanaimo, the Capital Regional District, District of Saanich, and Fraser Valley Regional District are using urban containment boundaries to prevent municipal sewer and water services from extending outside of urban areas.
Drivers of complete communities
Legislation and Funding: The Green Communities Act, Local Government Climate Action Charter, and Climate Action Revenue Incentive Program encourage local governments to plan for more sustainable communities. Development Permit Areas have been more successful in growing communities where the development industry is brought into the conversation early and there is public support for climate action.
17
Technical Assistance and Research: The Community energy and Emissions Inventory (CEEI) Program gives local governments information to measure their community‐wide greenhouse gas emissions, and then plan for reductions.
Professional associations have adopted new standards and guidelines to assist and guide planners, designers, and engineers towards more sustainable decisions.
Demographics and the real estate market: Young adults and retirees alike are looking to live in compact communities.
Urban Containment Boundaries and ALR: By defining which land is available for development, growth boundaries and the Agricultural Land Reserve promote infill and denser development.
Barriers to complete communities
Financing: Banks are more likely to finance existing, proven development forms.
Risk Aversion: Developers, especially in smaller communities, may find it challenging to try infill, redevelopment, and/or multifamily forms if those forms are new to the developer or a community.
Community Resistance to Change: Concerns remain that increased density in existing neighbourhoods will negatively change the character of a neighbourhood and bring in undesirables. There is also a lack of community support for climate action in some communities.
Market preference for large homes: large lot and estate homes are popular among some buyers, and this market drives low‐density sub‐urban and ex‐urban development.
Misalignment between regulations, incentives, and policies: Zoning and DCC structures in many communities support traditional development patterns but rezoning is often required for smart growth or higher density development. There is a need to align regulations and incentives with policy.
Time lag before policies have impact: the impact of policy changes may take decades, because regulations do not have to be updated to be consistent with policy. As a result, development may go ahead under old zoning, although it may not be supported by current policy.
Perception that sustainability is more expensive: Perceptions from the development community that sustainability‐focused land use policy, building codes, and development guidelines will increase the cost of development. This is especially a concern in smaller communities that want to encourage development and economic growth. More research and case studies are needed.
Poor experience with stratas: there is a widely held dislike for the stratas based on the need to be involved in group decision‐making and a lack of trust of strata councils to consistently make good decisions.
Separation of transit planning agencies and land use planning agencies make integration of the two more challenging.
There appears to be an orientation to development of large‐scale, high density sites over small and medium scale developments that might fit better with existing neighbourhoods.
There is a lot of Institutional inertia in government and the development industry. While this is natural for any industry, it slows widespread adoption of new approaches.
Possible backlash against sustainable communities because they are in high demand and short supply, making them more expensive and possibly driving a perception that they are elitist.
Public conversations about integrated land use and transportation, complete with good information about benefits, trade‐offs, etc. may be inadequate to build strong support for complete communities.
Weak regional planning. The province’s regional planning legislation not only makes regional sustainability planning optional, but there are also no minimum requirements for regional sustainability strategies or targets and no tools for regional districts to enforce their plans if member municipalities choose to ignore them. Such strategies are needed to ensure that growth is managed and coordinated.
Urban Design
The quality of urban design in BC, as in many other parts of North America, appears to be improving. This is especially true in downtowns, where
18
existing street and building patterns are amenable to pedestrian‐oriented design. Through the adoption of more clear and direct Development Permit Guidelines, and greater involvement of design professionals through mechanisms such as Development Permit Review Boards, local governments have the tools to implement better design. Local governments, business owners, and developers are also seeing the economic development value of investing in downtowns beyond beautification projects. Results on the ground can be frustratingly slow if the pace of redevelopment is slow, but in general the direction of change appears to be the right one.
In residential neighbourhoods, the trend is more mixed, with some areas seeing smaller front setbacks, front porches, and/or other features that help make streets more friendly and increase the potential for social interaction, while other areas continue to see large front garages, lack of sidewalks, and other auto‐oriented, isolating features.
Probably the most challenging area for urban design improvements has been along major streets. These streets are designed to engineering standards designed primarily for speed and management of vehicle safety, while not strongly considering the convenience, safety, and comfort needs of people walking or on bikes. Strip malls, “big‐box” stores and the like dominate adjacent land uses, putting large demands on the supporting transportation system and reinforcing car culture.
Drivers
Community desire for downtown revitalization. Increased influence of tourism, driving “authentic” small town
heritage experience. Lack of success of downtown beautification strategies without a
comprehensive urban design approach (e.g. flower baskets and sidewalk materials).
Urban design training for professionals. Market demand for neo‐traditional and New Urbanist design. Adoption of improved form and character Development Permit
Area guidelines for commercial, residential, and mixed‐use areas.
Barriers
Existing built form in many communities is low density with separated uses. Finding the political support and financing to retrofit communities in a slow growth environment is challenging.
Engineering street standards, especially for arterial and collector streets.
Community desire for fast automobile movement through communities.
Slow pace of downtown (re)development. Market demand for highway commercial, big box, and strip mall
development. Market desire for large lot homes with front garage access and
plenty of parking.
Regional Planning
BC’s 27 regional districts provide region‐wide services (i.e. regional parks, 9‐1‐1 services, water, and wastewater services), inter‐municipal and sub‐regional services (i.e. recreational facilities), and local government services for unincorporated areas.
Currently, ten regional districts have implemented Regional Growth Strategies, 20‐year plans for housing, transportation, servicing, parks, economic development, and greenhouse gas reductions. Because municipal Official Community Plans need to align with Regional Growth Strategies, these plans provide the framework for coordinated planning.
The specific roles of regional districts in the province vary from region to region, and the power of regional districts has varied over the past three decades. Regional planning legislation was introduced between the 1940s and 1970s in response to rapid growth and development. In the 1970s and 1980s regional district planning powers were rescinded due to a changing political climate. In the face of increasing urban growth and resource management challenges in the 1990s, regional planning was strengthened again, but not to previous levels. In 2015, the Township of Langley challenged the Metro Vancouver Regional Growth Strategy, with the BC
19
Supreme Court ruling that the Township has the final say over development planning – not the regional authority. Although Metro Vancouver is appealing this decision, it has created uncertainty about the role of regional districts in shaping regional land use.
The changing landscape of regional planning in BC impacts province‐wide environmental protection, as well as the protection of agricultural lands and strategic industrial lands from residential encroachment.
Industrial Land
Industry has historically been located near ports, rivers, and raw materials, attracting workers from many locations. Quality of life impacts, such as clean air, green space, culture, were often not strongly considered for these working communities. In the Lower Mainland, port lands are also desirable residential areas, given the land’s good access, low prices, and beautiful views. In fact, in the past 30 years, local governments have rezoned 3,000 hectares of industrial land, and as of 2013 Metro Vancouver had only an estimated 20‐year supply of industrial land remaining. Although intensifying industrial land use supports compact community development, it also increases the cost of doing business in BC and can negatively impact the employment market. Co‐locating industrial and residential uses can also lead to quality of life conflicts over noise, smells, views, sound, and air quality.
Port lands located near agricultural lands are another source of conflict as port uses expand, creating the need for storage, distribution, and trans‐shipping facilities. The controversial purchase of two ALR parcels by Port Metro Vancouver in Delta and Richmond is an example of this conflict.
In rural BC, small towns historically established as resource communities have experienced a boom and bust economy. Many small towns seek to replace resource jobs with tourism and technology/knowledge jobs, not only to recover from economic decline but also to improve economic diversity that can build resiliency for the future. This is changing the nature of and demand for industrial lands in rural BC.
Drivers Protecting Industrial Land from Development
Provincial programs: Provincial investment, such as the Gateway Program, has supported industrial development.
Port Metro Vancouver: In 2012, Port Metro Vancouver called for an “industrial land bank” similar to the Agricultural Land Reserve to protect industrial land, particularly in the Lower Mainland.
Regional Land Use Planning has supported a coordinated approach to maintaining large industrial parcels.
Barriers to Protecting Industrial Land from Development
Market Demand: Commercial and residential land uses compete for land with industrial uses, and are often more profitable. Suburban development form, resistance to urban infill, and brownfield redevelopment are all contributing to the change in use of industrial lands.
Lack of protection for industrial lands.
Agricultural Land
Agricultural land is critically important to the built environment in BC. The Agricultural Land Reserve (ALR), established in 1973, created a reserve of 4.7 million hectares of agricultural land (5% of provincial land) to help prevent the loss of arable lands. Agricultural Land Reserve lands are governed by the Agricultural Land Commission (ALC), an independent body that makes decisions on applications to include and exclude land from the ALR, subdivision, and non‐farm use.
Before the ALR’s creation, up to 6,000 hectares of agricultural land was lost to urban use each year. Now, the ALC is charged with “no net loss” of farmland in BC, though 10% of land can be removed to meet “community need.” However, since the ALR’s creation, the Lower Mainland, Vancouver Island, and Okanagan have experienced a net loss of more than 35,000 hectares – balanced by less productive land added in northern BC.
In 2014, the province changed Agricultural Land Commission powers, creating two zones for ALR land and creating six local decision‐making
20
panels. In Zone 1, located mostly in the Lower Mainland and Okanagan, the rules for ALR lands have not changed. However in Zone 2, the Kootenays, and Northeast, updated rules make removal of lands from the ALR easier, which is of specific concern for the productive farmlands in the Peace region. Advocates for the ALR have expressed concern that putting land use decisions into the hands of local panels will make it harder for those panels to make good but tough long‐term decisions.
Drivers Protecting Agricultural Land from Development
Support for local food production. Generation of new farmers, supported by a not‐for‐profit
advocacy network. The ALR has slowed the encroachment of non‐agricultural uses on
agricultural lands.
Barriers to Protecting Agricultural Land from Development
Farm operations continue to be affected by escalating land values, complaints by residential neighbours, and urban runoff.
Foreign companies are purchasing farmland in Prince George, Williams Lake, and other communities to plant trees for carbon sequestration and offsets.
Pressure on agricultural land for energy‐related projects such as Site C dam, oil and gas development.
Healthy Communities
The Healthy Cities movement, which began in Europe and the United States during the 1980s, now includes projects in approximately 1,000 cities. Land use planning for healthy communities is also a growing movement in BC. BC Healthy Communities is a province‐wide not‐for‐profit organization established in 2005 that facilitates the ongoing development of healthy, thriving, and resilient communities. BC Healthy Living Alliance, established in 2003, supports health promotion in BC. The Provincial Health Services Authority also supports healthy communities in BC through research and technical assistance.
Technical assistance and capacity building funds from the province and the Union of BC Municipalities are available to BC local governments.
By the end of 2014, over 135 local governments from across BC have received at least one Age‐Friendly grant, and over 225 projects have been funded. In 2015, eighteen local governments are using their grants to conduct age‐friendly community assessments and develop action plans. These are required steps to achieve recognition as an age‐friendly B.C. community.
In 2011, the province launched a $68 million Healthy Families BC Strategy. The program focuses on Healthy Lifestyles, Healthy Eating, Healthy Start, and Healthy Communities. Local governments are included in the 4th area ‐ Healthy Communities.
The Provincial Health Services Authority and UBCM work together on the Healthy Built Environment Alliance.
Drivers of healthy communities
Measured health outcomes, like the increase in obesity, diabetes, and respiratory health, have been linked to sedentary lifestyles and poor food choices. To reduce healthcare costs and support healthier communities, planners and health authorities are working together to support walkable community design, promote transit use, encourage social interaction, and enhance local food systems.
Since 2013 the health gap between those with low and high socio‐economic status has continued to grow.
Technical assistance and capacity‐building to local governments supports them in creating policy to encourage social connectedness and belonging, age‐friendly design, and active lifestyles,
Not‐for‐profit organizational leadership helps educate residents, local governments, and partners on why healthy communities matter and what resources are available to support healthy community‐focused projects and policies.

21
Barriers to healthy communities
The existing built form in many BC communities tends to be dominated by low density residential forms with little land use mix and few travel alternatives to driving. Retrofitting suburban and exurban land use patterns to create the mix of uses and densities required to support active transportation lifestyles can take decades.
Behaviour and culture change is challenging. A comprehensive strategy in schools, workplaces, and communities is needed to enshrine policies, programs, and environments that support healthy, active lifestyles.
Eco‐Industrial Networking (EIN)
Eco‐Industrial Networking aims to improve economic and environmental performance through collaborative, efficient, and effective resource use. Businesses co‐locate to cycle wastes and share infrastructure systems.
In the early 2000s, communities in the Lower Mainland investigated Eco‐Industrial Networking pilot projects. Although the following projects have made some progress since inception, not much progress has been made in BC since 2005 to promote new eco‐industrial networking projects:
Tillbury, Corporation of Delta: The Tillbury Eco‐Industrial Partnership is a multi‐stakeholder process that identified potential savings in electricity, natural gas, and water consumption; wastewater generation; truck trips; and, greenhouse gas emissions. The plan was finalized in 2003.
Maplewood, District of North Vancouver: An Eco‐Industrial system concept was created for Maplewood to coordinate energy management between businesses, use biofuels and bio‐lubricants
12 Western Economic Diversification, Environment Canada, and the Fraser Basin Council funded a study in 2002 to identify pilot eco‐industrial projects in BC communities. Selected communities included Abbotsford, Cache Creek,
for vehicles, reuse stormwater for industrial processes, support value‐added recycling‐based manufacturing, and collocate businesses to improve logistics efficiency. The plan was finalized in 2005.
City of Richmond. The City developed an Eco‐Industrial Program and evaluated options between 2002 and 2005.
Vancouver’s proposed redevelopment of False Creek Flats as a centre for green jobs offers new potential to apply the principles of EIN to a comprehensive planning exercise.
Drivers of EIN
Pilot project funding.12
Barriers to EIN
Local government, rather than the private sector, has advanced eco‐industrial activity, resulting in progress in terms of plans, but limited on‐the‐ground implementation.
Finding and involving potential tenants in the planning process is challenging.
Comox Valley, Logan Lake, Mount Waddington Regional District, Revelstoke, Richmond, Smithers, Tofino, and the West Kootenay Boundary Region.
22
3.2 Housing
SCOPE
Housing relates to the building stock, tenure, cost, security, amenities, and density of where people live. There is a spectrum of housing options that include emergency, supportive, transitional, non‐market rental, market rental, and ownership housing, with a need to emphasize full spectrum options for households with a total income that is at the median income level and below. Constitutionally, housing is primarily a provincial responsibility although there is a long history of active federal involvement since the mid‐1940s.
This study of BC’s Sustainable Built Environment focuses on rural, urban, and suburban housing in BC communities for a variety of incomes, stages of life, and abilities, both physical and mental.
VISION
Housing choices, built with simple, passive, and resilient systems to radically reduce energy demands, are available for the full spectrum of needs related to age, access, and affordability and are located close to employment and community services.
KEY IMPACTS
From a sustainability perspective, the location, construction standards, tenure, and variety of options of housing choices affect: individual, family, and community well‐being; make small direct and larger indirect impacts on community greenhouse gas emissions and stormwater runoff; and, support
13 Provincial Health Services Authority. 2014. Healthy Built Environment Linkages: A toolkit for design, planning, health.
individual, family, and community‐wide resiliency for changing economic circumstances.
Housing costs and access affect well‐being.
Access to affordable housing decreases how often people move, which reduces individual and family stress.13
Adequate housing also helps individuals and families feel safer with better community connections. For example, access to safe housing for homeless people helps keep people safe from violence, injury, and communicable diseases.
Certain housing forms, like apartments in high rises, can contribute to people feeling socially isolated.
Visitable and accessible housing also helps reduce social isolation for seniors and supports aging in place.
Affordability is a composite of housing costs, transportation costs, and access to employment opportunities, meaning that living in the urban core may be as or more financially‐viable for some individuals and families.14
Housing choices support economic vitality and resiliency.
Housing needs vary throughout a person’s life. The cost of housing affects how much disposable income
individuals and families have, which affects their access to healthy food, medications, and more.
Lives can be unpredictable, and anyone is susceptible to financial, physical, and mental illness emergencies that can rapidly deplete incomes and make finding suitable housing a challenge.
Access to safe, affordable, and supportive housing improves quality of life for people with physical and mental illness needs.
14 Metro Vancouver. 2015. Housing and Transportation Cost Burden Study: A New Way of Looking at Affordability.
23
Housing form and tenure choices help people find suitable housing in convenient locations, when they are in the midst of relocation or life transition, and for other reasons.
Businesses benefit from affordable housing in locations with easy access to workplaces – a lack of affordable housing is a risk to business and economic development.
STATUS & TRENDS
Housing is becoming less affordable.
Over 14,000 families and individuals in BC are on affordable housing wait lists. More than 20% of homeowners and almost half of renters in BC are paying more than 30% of their income on shelter, which is more than they can afford according to CMHC guidelines.15 In BC housing prices are increasing faster than incomes, the construction of rental housing is not keeping up with demand (vacancy rate of less than 2%), and federal and provincial social housing programs are being downloaded to local governments.
This housing pinch is being felt in many communities across BC – in Metro Vancouver, in small towns, and in northern BC – though in some areas housing prices have declined since 2008. In Metro Vancouver in particular, housing affordability is acute: 16
Outer Metro Vancouver: More than 80% of working households can afford a wood‐frame or concrete re‐sale condo. However, only about half of these households can afford a single‐family home.
15 Federation of Canadian Municipalities. 2013. Fixing Canada’s Housing Crunch; Affordable Housing: What is the common definition of affordability?". Canada Mortgage and Housing Corporation. 2011 16 CMHC. Q1 2015. Housing Market Outlook – BC Region Highlights.
Inner Metro Vancouver: Between 60‐70% of working households can afford a re‐sale condo, and less than 25% can afford a single‐family home.
Vancouver: Less than half of working households can afford a re‐sale condo, and less than 10% can afford a single‐family home at current prices. The average resale price in Vancouver was over $860,000 in 2014 (compared to an average of $580,000 in BC – a 15‐year high).
For all three areas, new single‐family homes are selling for similar prices as resale homes. New condominiums and townhomes are about 5‐10% more expensive than resale homes.
In 2014, single‐family homes continue to be about 1/3 of new construction starts in BC, with condominiums comprising about one‐half of construction starts. The share of new starts for semi‐detached and row housing lags behind; however, CMHC forecasts that there is a shift towards more multi‐family development in BC’s urban centres (areas with population greater than 10,000). Single family home construction is expected to decline over the next 2 years. In areas of the province with less than 10,000 people, new home starts in 2014 were higher than the year before.17
Over the past 40 years, federal housing responsibilities have moved to the province, and in turn, to local governments. Federal and provincial social housing cuts have not been matched by local government spending. 18 In the 1970s, 1,000 to 1,500 new social housing units were constructed each year in BC. Homelessness was not a significant issue in Vancouver until the mid‐1980s when the deepest federal cuts were enacted. The federal government stopped building new housing in 1993, and provincial construction declined from 2001 to 2005. Since 2006, an average of about
17 CMHC. Housing Market Outlook – Vancouver and Abbotsford CMAs Fall 2014. 18 Duffy, Robert, Gaetan Royer, and Charley Beresford. 2014. Who’s Picking Up the Tab? Federal and Provincial downloading onto local governments. Columbia Institute and Centre for Civic Governance.
24
400 social housing units have been added each year. The federal government provides subsidies to 68,050 households in BC worth $170 million annually through federal social housing agreements.19 These subsidies are expiring, and the future of one‐third of these units is at risk.
Since 2001, the number of permanent year‐round Emergency Shelter beds has doubled, to over 1,800 beds across BC.
BC’s Transition Houses provides a network of over 800 beds across the province, shelter to approximately 18,000 women and children each year.
The province has partnerships with eight communities to create more than 2,100 new units of supportive housing for people who are homeless or at risk of homelessness.
The non‐profit housing sector in BC manages over 90% of the social housing stock.
Capital Regional District was one of the first in BC to create a regional Housing Trust Fund in partnerships with local governments to implement the Regional Housing Affordability Strategy. Since 2005, $5.9 million has been granted towards housing for over 150 families and 300 singles – a $78 million capital investment.
BC Rental Assistance Program. Since the program’s inception in 2006, over 21,000 families have benefitted from the program, which helps make private market rental housing more affordable.
The province’s First Time Home Buyers’ Program exempts British Columbians from the Property Transfer Tax on homes valued up to $425,000.
The Home Owner Grant helps reduce the amount of residential property tax British Columbians pay through a maximum reduction in residential property taxes of $570 — or up to $845 if the homeowner is 65 or older in the calendar year, permanently disabled, or an eligible veteran.
19 Federation of Canadian Municipalities, 2013.
Drivers to support Affordable Housing
Widespread recognition of affordability problem. The public, media, elected officials, and professionals are all well‐aware of the problem and there is significant pressure to address it.
Provincial Housing Strategy in place. Updated in 2014, the Province’s Housing Strategy includes a shift to a “flexible, responsive, and balanced regulatory system,” greater housing stability, and continued strategic partnerships.
Historically low interest rates are not expected to change until late 2015, with projected gradual increases in 2016 and beyond.
Housing Agreements can enable affordable market and non‐market rental housing development. Developers and the local government contractually agree to set aside a percentage of units for rental or non‐market housing in a new housing development.
Inclusionary Zoning is zoning regulations that encourage or require affordable housing units in new developments. Options include units within the planned development, off‐site units, and cash‐in‐lieu. In City of Langford, developers must build affordable units first before the rest of the site. City of Burnaby’s Non‐Market Housing Policy requires 20% non‐market housing on publicly‐owned large development sites.
Reducing or waiving development fees can encourage the development of certain housing forms, such as multi‐family housing over single‐family housing. City of Kelowna, for example, charges lower DCCs for apartments compared to single‐family homes.
Conversion control policies protect existing rental housing stock from being converted into other uses (i.e. commercial use or change in tenure).
Demolition control policies prevent the destruction of rental policies.
Density bonusing (also known as amenity zoning) is used by more urban local governments to encourage developers to include
25
affordable housing units or other amenities like environmental protection technologies, in exchange for higher density over what may be allowed in the original zoning. City of North Vancouver was the first local government in BC to use density bonusing to encourage energy efficiency and emissions reductions. Resort Municipality of Whistler uses density bonusing in certain zones to support employee housing.
Alternative Development Standards, such as planning standards (reduced set‐backs, narrow lot sizes, etc.) and engineering (reduced road allowances, reduced parking requirements, etc.) can reduce the per‐unit cost of development. A variety of communities in the Capital Region District, like Central Saanich, Langford, Sooke, and Victoria, have adopted such policies as have the City of Surrey, City of Richmond, City of Abbotsford and the Garrison Crossing project in Chilliwack.
Depreciation reports for strata buildings support building maintenance and renewal (noting this is less effective in the current seller’s market).
Public engagement and dialogue is supporting better designed developments and helps community members better evaluate trade‐offs.
Barriers to Affordable Housing
Market Demand: Demand for single‐family homes comes from potential residents, as well as investors and developers (seeking to assemble land for multi‐family development). The high levels of employment and increasing population (in‐migration) are the two key drivers behind housing demand in Metro Vancouver, according to CMHC.
Low vacancy rates for rentals (below 2% in 2014) Expensive renovation of rental stock. As rental stock is
renovated, building owners add condominium‐like finishes that increase the cost of such units.
Infill: Most new housing construction in Metro Vancouver is occurring on infill properties, which requires the acquisition and demolition of existing structures.
Lack of growth in new, affordable housing stock. The supply‐side solution to affordability is not working.
Speculation: Housing and land speculation is driving up costs and reducing available rental properties.
Financing: Banks are more likely to finance typical development, rather than cohousing, cooperative housing, and other unusual development models, including developments with below‐market housing.
Community perceptions about safety and property values create a challenging environment for developers proposing multi‐family development, especially with affordable housing components. Land costs and community perceptions are leading to affordable housing being built in locations far from jobs and services.
History of challenges for making critical repairs and supporting redevelopment of strata housing.
Shifting of federal and provincial funding/programs to local government and non‐profit sector.
Competing investment priorities driving higher land values: Metro Vancouver, in particular, is an internationally‐significant location for real estate investment.
Tax policy promotes home ownership and needs to be balanced with interventions to support rental housing and shared tenure.
Residents are demanding more housing choice.
The resident‐owned single‐family home remains the stalwart of the BC housing market. However, with the current housing affordability challenges and a higher share of the population approaching retirement, residents are seeking more choices for housing type and tenure. Housing must meet needs for people in all stages of life, like families with young children, single young adults, couples without children, single parents, empty nesters, and seniors in a continuum of care.
“Housing choices” means that people can choose to rent or buy, can choose homes that are visitable and accessible for people with mobility challenges, and find options for people in all stages of their lives. Aging in place is a priority for many BC communities. Seniors housing can provide a
26
variety of supports, from independent living, supportive housing, and assisted living to residential care and hospice.
More than 21,300 seniors live in independent social housing in communities across British Columbia.
More than 300 households have completed renovations through the Home Adaptations for Independence program, which provides financial assistance of up to $20,000 to help low‐income seniors and people with disabilities finance home modifications for accessible, safe and independent living.
Since 2001, more than 1,200 units of affordable rental housing for seniors and people with disabilities were completed. In the last decade, more than 5,000 assisted living and supportive seniors’ housing units have been created to help seniors remain independent and stay in their home communities, close to family and friends.
BC’s subsidized assisted living program for low‐income seniors bridges the gap between independent housing and residential care. There are 4,376 subsidized Assisted Living units available.
A third of households in BC rent (over 50 per cent in the City of Vancouver), and the vacancy rate is less than 2%. BC’s aging building stock requires repair, and protection from redevelopment in urban centres experiencing growth pressure. Much of the existing affordable rental stock for lower‐income renters, including single‐family dwellings converted into rooming houses and suites within single‐family dwellings, is non‐compliant with local government bylaws.
About one quarter of all BC residents now live in strata properties. This number is growing for many reasons, including a trend toward smaller household sizes; an aging population; emphasis on more compact, transit friendly neighbourhoods; the increase in strata units as investment/rental suites; and the greater affordability of some strata housing relative to other housing types.
Drivers of housing choice
Demographics – both “Millennials” and retirees are looking for affordable homes in complete, compact, walkable neighbourhoods.
“Eco‐density” and “sensitive infill” are strategies that involve tactics like secondary suites and laneway housing to support more affordable housing options while retaining existing neighbourhood character. For example in City of Vancouver, for every 10 new single‐family homes constructed in 2014, 8 of those homes included a “mortgage helper” like a laneway home or accessory suite. City of Vancouver began allowing small homes to be built in laneways in 2009 in all residential zones – about 97% of single family neighbourhoods. Laneway homes are between 500‐900 square feet, no more than 1 ½ storeys, and a parking space must be provided on site.
Secondary suites can also be incorporated into apartments and strata townhouses, an approach pioneered at UniverCity in Burnaby.
Building Code. British Columbia was the first province to allow 6‐storey residential wood‐frame buildings which has helped lower development costs and encourage increased density.
New models of housing such as co‐housing, land leases and community land trusts have emerged in recent years.
Barriers to housing choice
Community resistance to infill development and denser housing forms (NIMBY).
Developer and lender reluctance to build housing forms not already present in the local market. Not all builders, planners, architects, or developers are early adopters of new technologies, techniques, or tenures.
Lack of medium density choices between single family homes and low‐rise multifamily. Few tenure and form choices for small groups (3 to 4 families or 3‐10 units) to live in a small, manageable collective living environment.

27
28
3.3 Buildings, Infrastructure & Energy
SCOPE
Buildings and infrastructure together are the underpinning for cities and the bulk of the built environment. Our environmental support systems – energy, water, stormwater management, materials, and waste – run through infrastructure and buildings: their design is critical to the environmental performance of the built environment. Much of modern life takes place indoors, so our social and physical health similarly depends in large part on the design and function of both homes and workplaces. On the cultural side, heritage is an important part of the identity of our communities, and is closely tied to building renewal and redevelopment. Finally, from a fiscal perspective, infrastructure is a huge proportion of the capital assets of our communities, and its maintenance and renewal is critical to our financial health.
VISION
Smarter, less expensive buildings and infrastructure that support renewable use of resources and healthy, connected communities.
KEY IMPACTS
Buildings and infrastructure have significant impacts, for example:
Buildings are responsible for 45‐50% of community GHG emissions in BC
Quality of working environments has a significant impact on employee productivity and therefore economic performance and business competitiveness
20 a major concern raised by the Vancouver Foundation in 2011
Social isolation20 can be worsened by building design that does not encourage neighbourly interaction – in both office and home environments
Run‐off from streets and roofs contains contaminants from asphalt, car exhaust, brakes, etc. that can accumulate and contaminate water bodies over time.
Energy used to heat and light buildings and for appliances, tools, computers, etc. is produced primarily through hydro‐electric dams in BC, but a growing proportion is imported electricity produced from coal, resulting in growing GHG emissions.
Energy efficient and other sustainable building features can reduce the long‐term occupation costs for residents.
Sustainable building construction can also improve health through better indoor air quality, temperature control, and reduced exposure to harmful chemicals.
STATUS & TRENDS
Buildings
We discuss three aspects of sustainability related to buildings: environmental performance, social performance, and heritage preservation.
Green building growth is substantial, but existing stock lags new construction and dramatic scaling up is necessary.
There has been a strong and broad industry shift towards an understanding of green buildings. For example, the Real Property Association of Canada (REALpac) adopted an ambitious target of 20ekWh/ft2/year energy use in office buildings by 2015, and commissioned a 2009 study assessing how to achieve it. This interest has translated into results: the Canadian Green Building Council recently described the green building market as “vigorous
29
and growing” with estimated market share of 30‐40% anticipated growth to 40‐50% by 2016.21
Green buildings are now encouraged/incented in many jurisdictions, and are required by the Province and some local governments for public buildings. Higher performance requirements have been incorporated into the most recent (“Green”) BC Building Code, cementing some elements of environmental performance but limiting some flexibility for innovation. This represents strong movement in the new construction sector, which continues to be driven at the leading edge as academics and non‐profits explore the boundaries of what is desirable (e.g. regenerative buildings and neighbourhoods) and possible (e.g. Living Building Challenge).
However, the focus has been on new buildings and there has been less progress on existing buildings, in part because the challenge is more complex. For example, UBC’s Collaborative for Advanced Landscape Planning (CALP) assessed options for achieving 80% reduction in building‐related GHG emissions in three existing BC neighbourhoods by 2050. They found that while this reduction was technically feasible, current policy would only achieve 35‐50% reductions. Success would require substantial change: building envelope upgrades of almost all residences, standard installation of solar hot water, reductions in electricity use, redevelopment to multi‐unit buildings, and new construction to net‐zero or Passivhaus standards. Turning to the industry as a whole, the Canadian Commercial Real Estate Sustainability Performance Report22 found that major Canadian real estate companies lagged substantially behind international leaders in corporate sustainability performance, with environmental performance worse than social or governance performance. Much greater effort across the board is needed to make progress on existing buildings.
21 Canada Green Building Trends: Benefits driving the new and retrofit market (2014) 22 REALpac. 2010. Canadian Commercial Real Estate Sustainability Performance Report.
A contributing factor to material and energy consumption is the growth in built space per person. North American housing sizes have been increasing since the 1940s, but are beginning to decrease again. In 1945, the average home was 800 square feet, increasing to 1050 square feet in 1975. By 2005, the average home had reached 2300 square feet, a number that is down to 1900 square feet in 2013.23
On the energy side, progress is being made, but dramatic scaling up is necessary. While the Community Energy Association’s 2014 Community‐based Renewable Energy in BC: A Snapshot study estimated greater than 300 grid‐tied Solar Photovoltaic (PV) residential installations and greater than 550 residential solar hot water systems, this remains a drop in the bucket of BC’s energy supply. Similarly, home energy retrofits have ebbed and flowed with the availability of incentive funding but have not taken hold without the incentive support which the public may now expect.
Drivers of green building24
National efforts of the Canadian Green Building Council through the LEED program, driving knowledge and a networked community of professionals, as well as market adoption of new practice.
Institutional client demand for green buildings, driven by awareness of the importance of sustainability.
The desire of practitioners to “do the right thing.” Leading‐edge practitioners in BC have been involved in green building for decades and continue to be involved in pushing the limits – including Canada Green Building Council, UBC’s School of Architecture and Landscape Architecture and the International Living Future Institute and Cascadia Green Building Council, supported by numerous architecture firms and other consultants.
Market demand for greater health and well‐being for building occupants.
23 CMHC. 2013. “Canadian Housing Observer.” 24 Canadian Green Building Council, Canada Green Building Trends: Benefits driving the new and retrofit market (2014)
30
Growing awareness of the business case for green buildings. Industry certification systems such as BOMA Go Green. Political support and leadership initiatives in some major cities, e.g.
Vancouver. Incentive programs for energy retrofits. Interest of impact investors in green building, along with the growth
of C3 companies and social entrepreneurs in the building sector. Cost of on‐site renewable energy technology is dropping rapidly (e.g.
solar PV). Energy programs such as BC Hydro’s net metering program for
generation of up to 100 kW. Enhancements to the BC Building Code. New regulatory powers for Development Permit Areas to support
increased building energy and water efficiency using Development Permit Guidelines.
Greater awareness about climate change and the importance of designing buildings for mitigation‐related performance and resilience.
Barriers to green building
The business case for green buildings remains less well known than it could be – which is a focus of communications by organizations such as the Canadian Green Building Council.
Split incentive between builders (who pay for higher capital costs) and owners (who reap rewards of energy efficiency), and similar split incentive between owners and renters.
Relatively long payback periods for home energy retrofits due to low energy prices.
Poor building code compliance. Building inspectors and other approving officers lack either knowledge about assessing environmental performance of buildings, or lack the tools/mandate to assess and ensure high performance.
Lack of post‐occupancy monitoring and reporting of effects of regulatory change, leading to slow “learning” process for regulatory authorities.
Slow response of the BC Building Code to new building technologies, such as Passivhaus construction materials and standards, which could further increase building sustainability.
Challenging to retrofit existing buildings. Some green building requirements have led to complex and
expensive to operate systems, making them less affordable and reducing performance.
Lack of collaboration across planning, design, building, infrastructure, transportation, and financing means missing opportunities
More research is needed on defining social impacts of buildings.
Beyond questions of urban design covered elsewhere in this report, there has been relatively less attention paid to the social impacts of building design than environmental impacts, and less rigorous research on the topic. While some guidelines exist addressing specific concerns such as family‐supportive multi‐unit housing (e.g. City of Vancouver guidelines), some studies of high‐rise apartments suggest that they may provide less equitable access to green space and engender more social isolation, related to the broader issue of social isolation raised by the Vancouver Foundation in its 2012 Connections and Engagement study. A 2007 book titled Building Community in Buildings explored the art of creating workplace environments supportive of community‐building, health and productivity. More research is needed to understand the social implications of building design.
Heritage efforts appear consistent in recent years but trends are not clear.
Heritage protection measures are available to local governments and used by many of them. The BC Heritage Branch’s annual survey of local governments suggests a fairly consistent level of activity over the last 15 years, but province‐wide trends about heritage protection and supporting efforts cannot be ascertained from currently available data. The importance and success of heritage protection varies from community to community. A number of non‐profits are active in this area, funded by the Provincial government through the Heritage Legacy Fund.
31
Drivers to heritage preservation
Interest from green building advocates: heritage preservation has been shown to reduce energy and materials use significantly over demolition and replacement (Vancouver Heritage Foundation, New Life for Old Buildings, 2009?)
Interest and community support.
Barriers to heritage preservation
High land values driving redevelopment and intensification. Cost to retain heritage buildings. Cultural orientation to “new” purchases.
Infrastructure
Infrastructure includes roads, bridges, water supply and treatment, wastewater collection and treatment, and stormwater management, as well as energy infrastructure. This discussion does not focus on roads and bridges specifically, as they form part of the transportation system and are beyond the scope of this study; they are addressed here in that issues that apply to all aspects of infrastructure, listed below, apply to them as well. The key current trends and issues affecting all aspects of infrastructure are listed below.
Drivers supporting infrastructure upgrades
Full‐Cost Recovery Development Cost Charges. Development charges generally do not recover the full cost of new infrastructure in suburban developments, in effect passing them on to taxpayers. Some communities have added up these costs and have restructured charges to developers to more closely match the real costs of servicing new buildings and neighbourhoods. City of Kelowna is attempting full‐cost recovery for new development infrastructure through DCCs.
Property Tax Incentives. The property tax system in many cities encourages low value development on the fringes, instead of in underutilized areas closer to the core. To correct this, Canadian local governments give special rebates to developers who revitalize old buildings or areas. Some jurisdictions have modified
their taxation system so land is taxed at a higher rate than improvements, incentivizing redevelopment.
Utility Charges. Operating and maintaining water and wastewater service can cost twice as much in the suburbs as in high‐density areas. Because suburban properties require longer water and sewer lines, local governments can investigate using late‐comer fees or assessment areas to recover this additional cost.
The availability of sustainability rating tools (e.g. the Envision Rating System) is improving understanding of life‐cycle costs of infrastructure and helping local governments and others make well informed decisions.
Barriers to infrastructure upgrades
Dependence on senior government grants for infrastructure renewal, combined with changing federal regulations that create new standards and requirements with no funding to support.
Climate change adaptation is a lower priority for the Province. Lack of asset management with deferred maintenance, investment.
Requirements for asset management seen as both a driver and barrier as the cost and time to do so can be prohibitive.
Price signals drive behaviour change, but there is a lack of public support for full‐cost pricing.
Municipal engineering departments (and others) are often very risk averse so introducing innovations is challenging. Additionally, much of the work happens in siloes and lacks the integration necessary to generate meaningful solutions.
Engineering education tends to be quite traditional and focused on financial bottom line evaluation although this is changing.
Financial sustainability of Infrastructure is a major issue.
A 2012 infrastructure report card for Canada showed that significant amounts of local government roads, wastewater infrastructure, drinking water infrastructure, and stormwater systems rank between “fair” and “very poor,” a
32
total replacement cost of $171.8 billion nationwide.25 The BC Water and Waste Association released a report in March 2015 assessing this issue and highlighting four key issues:26 (1) water and sewer fees are not covering operating costs, maintenance costs, or end‐of‐life replacement; (2) local governments lack reserve savings to respond quickly to unexpected needs; (3) small communities are least prepared; and (4) about $13 billion is required in capital expenditures to renew and replace current infrastructure, exclusive of meeting new senior government standards, meeting growth needs, and upgrading to address climate change impacts.
Local governments are learning about and coming to terms with their infrastructure debt; however, the urgency is not well recognized.
Downloading from senior governments is making matters worse.
To manage senior government budgets, responsibility has been transferred to local governments in a number of areas, typically without a matching increase in funding:
Roads: Transfer of responsibility for roads and highways from provincial to local governments has been an ongoing cost for B.C. local governments. Many of these transfers occurred in 1998, when the provincial government ‘declassified’ hundreds of kilometres of secondary highways.
Wastewater: Changes to federal and provincial wastewater regulations, compounded by failures to reinvest in infrastructure during the 1980s and 1990s, are driving huge current and future expenditures on wastewater treatment plants by local governments. The Federal and Provincial governments are contributing to these projects; however, the scale of investment needed is higher than anything faced by earlier local governments.
25 Canadian Construction Association et. al. 2012. Infrastructure Report Card. 26 BC Water and Waste Association. 2015. Are our Water Systems at Risk 27 BCWWA Position Statement on Asset Management, 9 Mar 2015 DRAFT)
Drinking Water: Changes to provincial drinking water regulations and standards are triggering millions of dollars in mandatory infrastructure construction and upgrades, with most of these costs borne by local governments. The issue is particularly acute for rural and small local governments.
Flood management: In 2004 most responsibilities related to diking and land use management in flood hazard areas shifted to local governments under the Flood Hazard Statutes Amendment Act. Flood Protection Programs were initially funded entirely by senior levels of government, and costs have shifted to 33% each, federal/provincial/local today. A 2012 report estimates that sea level rise adaptation costs could reach $9.5 billion for Metro Vancouver alone.
Growing interest in and adoption of asset management practices.
There is growing interest in and adoption of asset management practices, driven by recently upgraded accounting requirements (Public Service Accounting Board standards) for infrastructure. Until recently, local governments did not need to depreciate infrastructure, so financial statements reflected new infrastructure in perfect condition while in reality infrastructure was gradually degrading over time. Furthermore, engineering and operational plans have been poorly integrated with budget and community plans, and 5‐year capital plans do not adequately address planning for assets with a 50‐100 year life.27 In attempting to assess the state of Canadian infrastructure, the 2014 Canadian Infrastructure Report Card found that few local governments had good quality data about their assets. Trained staff resources are limited for asset management initiatives, and cross‐departmental coordination needed for implementation of integrated asset management systems is another challenge.28 Progress is being made, however, with Asset Management BC
28 The State of Asset Management in British Columbia, 2010 (Asset Management BC)
33
(AMBC) researching needs and promoting change and recent Provincial Initiatives such as the “Sustainable Development Toolkit.”29 AMBC issued a report titled The State of Asset Management in BC in 2010, and found that the state of asset management varied widely, but most local governments in BC were in the early stages of asset management.
Growing interest in Integrated Resource Recovery (IRR) but few concrete initiatives.
IRR is a leading‐edge approach to infrastructure that links infrastructure systems together and that identifies resources available from infrastructure systems (e.g. energy recovery from pressure reducing valves in water supply systems or from sewage; fertilizer recovery from wastewater treatment). While the concept is ancient, it is rarely practiced in modern communities. There is growing interest in IRR and a few concrete initiatives (e.g. UBC’s Centre for Interactive Research on Sustainability (CIRS) and UBC Okanagan’s current study taking an integrated systems approach to infrastructure planning). In its 2008 guidebook titled Resources From Waste: A Guidebook to Integrated Resource Recovery, the BC Ministry of Community Development (BCMCD) notes a number of barriers to IRR: lack of staff capacity; conservatism and risk management; poorly coordinated regulations; lack of community acceptance; and poor coordination among organizations that need to be involved for success.
Decentralized infrastructure presents opportunities for urban areas.
There is on‐going discussion of the sustainability of on‐site or neighbourhood‐scale systems. It is clear that small, on‐site systems are more relevant to rural applications, but a case is being argued for their application in more urban contexts either in place of or in tandem with centralized systems. Building‐scale renewable energy production, neighbourhood‐scale energy utilities, and integrated stormwater
29 (http://www.cscd.gov.bc.ca/lgd/greencommunities/ sustainable_development.htm, accessed May 5, 2015).
management, which uses practices at the site, block, neighbourhood, and watershed level to manage stormwater, are three examples.
Climate adaptation and sea level rise is widely‐recognized and driving changes to practice.
Anticipated changes due to climate change are now being integrated into engineering design and standards for infrastructure. Flood construction levels, floodplain mapping, and stormwater design flows are key examples of climate impacts. Risks to water supplies from lower snow packs and hotter summers are another major climate‐related risk to infrastructure. The Association of Professional Engineers and Geoscientists of BC (APEGBC) has set up a committee focused entirely on this issue, in recognition of its importance; the organization directs APEGBC registrants to assess resiliency of designs to a range of potential future climate patterns, keep up‐to‐date on climatic changes and their implications, and addressing both extreme events and repeated climatic stresses.30
Water Infrastructure (water, wastewater, and stormwater)
Water infrastructure includes water supply and use, wastewater collection and treatment, and stormwater management. The three are integrated in that water flows between them and the natural environment, and may flow between one system or another – or indeed be combined as in combined storm and sewage systems. Water supply is primarily drawn from surface water sources, with groundwater the other major source; stormwater and wastewater are returned, with varying levels of treatment, to those natural systems. Therefore the treatment of stormwater and wastewater is a critical concern for the protection of drinking water quality. Another critical concern is regulations for the protection and sharing of water resources: the management of the quantity of drinking water. In BC, groundwater removals are not regulated and the allocation of surface water rights is being renegotiated as part of the new Water Sustainability Act. As the water
30 (APEG BC Climate Change Position Paper 2014)

34
resource becomes a more scarce and important commodity with a rising and more concentrated population and impacts from a warming climate, management of water will become an even more critical issue.
Acknowledging REFBC’s focus area on Water Sustainability, this report focuses only on water infrastructure within the built environment.
Significant progress on stormwater, more to come.
Significant progress is being made in BC on stormwater management, but the picture is less clear for water and wastewater management, based on available information. Through the combined efforts of partners in the Convening for Action initiative, good practice in stormwater management has progressed from a traditional management regime focused on flood control and flow management towards widespread adoption of watershed‐based “integrated rainwater management.” This transition has been driven by education leading to a gradual cultural change; while this shift is in progress, Integrated Stormwater Management Plans (ISMPs) are now common across the province and low‐impact development approaches are moving beyond pilot projects into the mainstream.
Ambitious targets but poor performance in water conservation.
Water conservation has not progressed substantially, with BC average daily per capita residential consumption at 353 Litres in 2009,31 above the Canadian average of 274 for the same year. Based on limited data Environment Canada reports a possible Canada‐wide drop in municipal and residential water use from 2001‐2009.32 Recent adoption of the Water Sustainability Act may herald continued improvement, and the Province has set a target of 33% improved water conservation by 2020. This target will be supported by on‐going implementation such as newer BC Building Code requirements for low‐flow/flush fixtures, and improved asset
31 Environment Canada. 2011 Municipal Water Use Report 32 Environment Canada. 2011 Municipal Water Use Report
management practices that may improve the condition of existing infrastructure and strengthen focus on municipal leak detection.
Wastewater treatment lags other provinces.
On the wastewater side, Canada‐wide data is available to suggest that residents served by secondary or better treatment remains fairly consistent at 79%, but that residents of BC’s communities have worse treatment on average, with only 55‐60% having that level of treatment. Performance varies widely among provinces, due presumably to differing provincial regulatory approaches.33
Drivers for water sustainability
Convening for Action partnership and education initiative, coupled with top‐down, bottom‐up approach to implementation.34
Cultural shift among practitioners of stormwater management. Initiatives sharing success stories / case studies. Periodic drought conditions (potentially exacerbated by climate
change).
Barriers to water sustainability
Lack of long‐term experience with low‐impact stormwater management approaches.
Regulations and standards that limit ability to use new techniques and technologies.
Lack of metering in some jurisdictions means there is little leverage to encourage conservation.
Relatively low requirements for wastewater treatment in BC.
33 Environment Canada. 2011. Municipal Water Use Report 34 Province of BC. 2010. Beyond the Guidebook
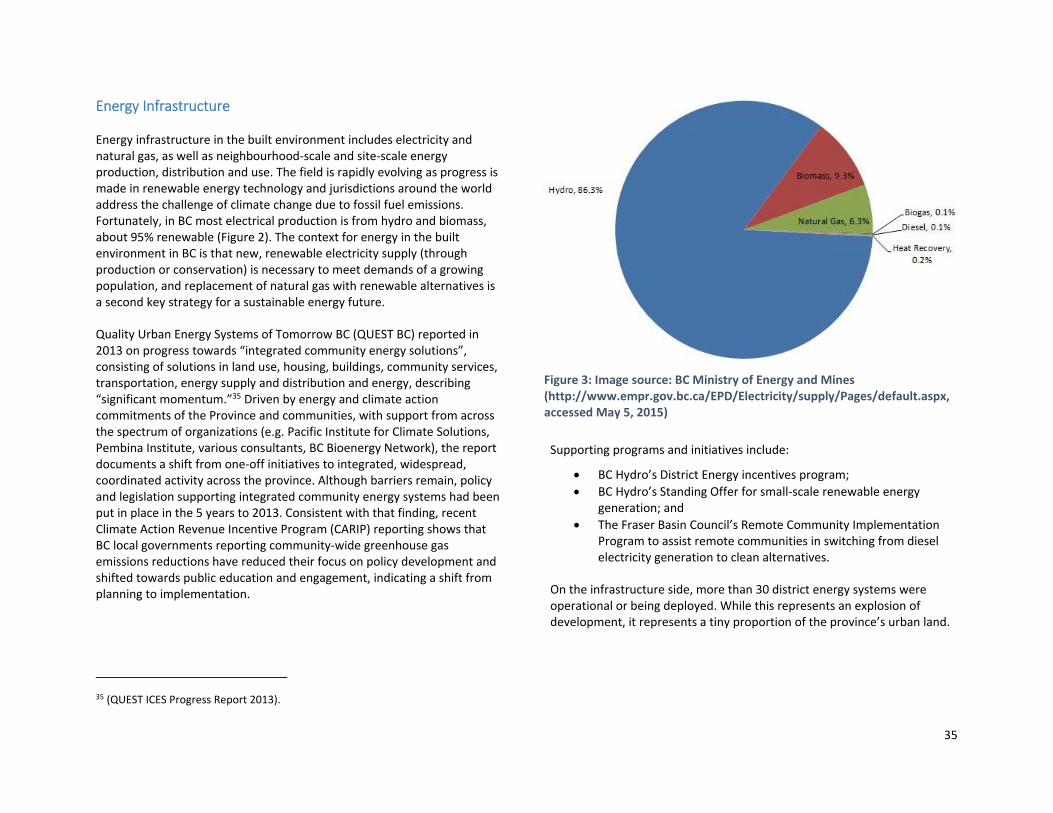
35
Energy Infrastructure
Energy infrastructure in the built environment includes electricity and natural gas, as well as neighbourhood‐scale and site‐scale energy production, distribution and use. The field is rapidly evolving as progress is made in renewable energy technology and jurisdictions around the world address the challenge of climate change due to fossil fuel emissions. Fortunately, in BC most electrical production is from hydro and biomass, about 95% renewable (Figure 2). The context for energy in the built environment in BC is that new, renewable electricity supply (through production or conservation) is necessary to meet demands of a growing population, and replacement of natural gas with renewable alternatives is a second key strategy for a sustainable energy future.
Quality Urban Energy Systems of Tomorrow BC (QUEST BC) reported in 2013 on progress towards “integrated community energy solutions”, consisting of solutions in land use, housing, buildings, community services, transportation, energy supply and distribution and energy, describing “significant momentum.”35 Driven by energy and climate action commitments of the Province and communities, with support from across the spectrum of organizations (e.g. Pacific Institute for Climate Solutions, Pembina Institute, various consultants, BC Bioenergy Network), the report documents a shift from one‐off initiatives to integrated, widespread, coordinated activity across the province. Although barriers remain, policy and legislation supporting integrated community energy systems had been put in place in the 5 years to 2013. Consistent with that finding, recent Climate Action Revenue Incentive Program (CARIP) reporting shows that BC local governments reporting community‐wide greenhouse gas emissions reductions have reduced their focus on policy development and shifted towards public education and engagement, indicating a shift from planning to implementation.
35 (QUEST ICES Progress Report 2013).
Supporting programs and initiatives include:
BC Hydro’s District Energy incentives program; BC Hydro’s Standing Offer for small‐scale renewable energy
generation; and The Fraser Basin Council’s Remote Community Implementation
Program to assist remote communities in switching from diesel electricity generation to clean alternatives.
On the infrastructure side, more than 30 district energy systems were operational or being deployed. While this represents an explosion of development, it represents a tiny proportion of the province’s urban land.
Figure 3: Image source: BC Ministry of Energy and Mines (http://www.empr.gov.bc.ca/EPD/Electricity/supply/Pages/default.aspx, accessed May 5, 2015)

36
However, there remains a significant gap to a built environment powered by renewable energy.
Drivers
Growing recognition of the importance of tackling climate change Provincial leadership on climate change via the Climate Action
Plan has been a key driver of change. Wide spectrum of supportive organizations. Rapidly dropping costs of production for renewable energy as
global manufacturing scales up and technology improves. Improved understanding and technical skills for district scale
energy systems. BC Carbon Tax.
Barriers
Low cost of oil and gas and electricity makes renewable energy technology less cost‐competitive.
Minimum housing densities of about 44 units per hectare must be achieved before co‐generation and district heating can be a viable alternative. This is considerably above the 10‐15 units per hectare that characterizes many BC communities.
Strong public and political resistance to higher energy pricing. Some regulatory barriers (e.g. lack of feed‐in‐tariff, property‐
assessed clean energy financing, carbon tax rate too low). Perception of environmental impacts (fish for micro‐hydro, birds
for wind). Local government regulatory restrictions affecting renewable
energy equipment. Various other barriers, dependent on the type of energy
infrastructure.
37
3.4 Transportation
SCOPE
The transportation system is complex and tightly linked with real estate and land use patterns. While most believe the primary purpose of the transportation system is to move people and goods around, its greater purpose is to provide access to wants and needs, which can also be met without motorized transportation if they are located nearby. Personal transportation occurs by air, boat, bus, personal (including shared) vehicle, bicycle, and on foot. Transportation of goods occurs at a large scale by air, boat, rail, and truck, and at a small scale as part of personal transportation. Movement occurs via a network of transportation infrastructure, including airports, rail lines, waterways and marine terminals, highways, rural roads, urban streets, and sidewalks and pathways.
This study of BC’s Sustainable Built Environment focuses on transportation within and between BC communities, so there is less attention to movement by air, water, and rail, and none to national and international shipping – while recognizing that these aspects are important to larger questions of sustainability for BC. Information about these aspects would complement the work of this report.
VISION
A transportation system in which walking, cycling, and transit are highly attractive options for accessing personal needs, goods movement provides efficient access to goods needed by the BC market, and transportation results in few accidents and very low pollutant emissions.
36 Province of BC. 2012. 2012 BC Greenhouse Gas Inventory Report 37 Provincial Health Services Authority. 2007. Creating a Healthier Environment in BC.
KEY IMPACTS
Transportation systems are a significant part of the built environment, affecting many sustainability considerations.
Transportation is responsible for 38% of BC’s greenhouse gas (GHG) emissions in 2012.36
Transportation impacts health through patterns of physical activity, air pollution, and accidents causing injuries. Walkable neighbourhoods (having good network connectivity and mixed uses) are associated with lower body weights. Pedestrian‐friendly streets encourage physical activity and are associated with fewer traffic accidents and less crime, and public transit encourages physical activity because all transit users must also walk or cycle for the first and last parts of their journey.37
Reduced motor vehicle transportation correlates with reduced accidents, and the impacts and costs of accidents is influenced by speed and vehicle design.
Transportation systems are a key factor influencing access to jobs, services, amenities, etc. that contribute to quality of life.
Goods movement is essential to our economy and for providing access to goods needed by residents and businesses of BC.
Some modes of transportation are more space‐ and resource‐efficient than others: the number of people that 1 m width of lane can carry varies from 170 for cars in mixed traffic or 750 on a highway, to 3,600 for pedestrians and 9,000 for light rail transit.38
38 Translink. 2011. Cycling for Everyone, Cycling strategic plan
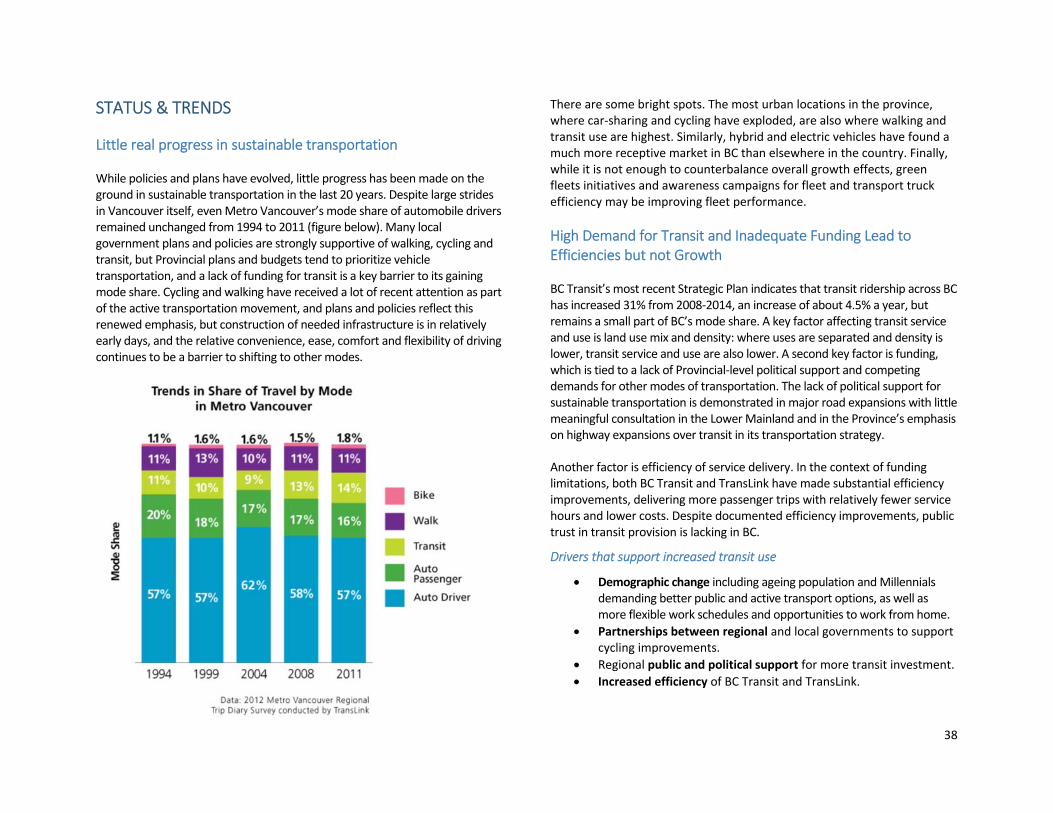
38
STATUS & TRENDS
Little real progress in sustainable transportation
While policies and plans have evolved, little progress has been made on the ground in sustainable transportation in the last 20 years. Despite large strides in Vancouver itself, even Metro Vancouver’s mode share of automobile drivers remained unchanged from 1994 to 2011 (figure below). Many local government plans and policies are strongly supportive of walking, cycling and transit, but Provincial plans and budgets tend to prioritize vehicle transportation, and a lack of funding for transit is a key barrier to its gaining mode share. Cycling and walking have received a lot of recent attention as part of the active transportation movement, and plans and policies reflect this renewed emphasis, but construction of needed infrastructure is in relatively early days, and the relative convenience, ease, comfort and flexibility of driving continues to be a barrier to shifting to other modes.
There are some bright spots. The most urban locations in the province, where car‐sharing and cycling have exploded, are also where walking and transit use are highest. Similarly, hybrid and electric vehicles have found a much more receptive market in BC than elsewhere in the country. Finally, while it is not enough to counterbalance overall growth effects, green fleets initiatives and awareness campaigns for fleet and transport truck efficiency may be improving fleet performance.
High Demand for Transit and Inadequate Funding Lead to Efficiencies but not Growth
BC Transit’s most recent Strategic Plan indicates that transit ridership across BC has increased 31% from 2008‐2014, an increase of about 4.5% a year, but remains a small part of BC’s mode share. A key factor affecting transit service and use is land use mix and density: where uses are separated and density is lower, transit service and use are also lower. A second key factor is funding, which is tied to a lack of Provincial‐level political support and competing demands for other modes of transportation. The lack of political support for sustainable transportation is demonstrated in major road expansions with little meaningful consultation in the Lower Mainland and in the Province’s emphasis on highway expansions over transit in its transportation strategy.
Another factor is efficiency of service delivery. In the context of funding limitations, both BC Transit and TransLink have made substantial efficiency improvements, delivering more passenger trips with relatively fewer service hours and lower costs. Despite documented efficiency improvements, public trust in transit provision is lacking in BC.
Drivers that support increased transit use
Demographic change including ageing population and Millennials demanding better public and active transport options, as well as more flexible work schedules and opportunities to work from home.
Partnerships between regional and local governments to support cycling improvements.
Regional public and political support for more transit investment. Increased efficiency of BC Transit and TransLink.

39
Barriers to increased transit use
Broad support for “balanced” transportation systems and “choice” but lack of support to prioritize active transportation.
Lack of Provincial political support and/or political conflict over transit funding.
Hidden costs and subsidies make driving appear more affordable. There is also a challenge to divide the costs and benefits between transit users and the wider community who benefits from transit use.
Statutory limitations on transit funding in the Lower Mainland. Priority given to major road infrastructure improvements over
investments in transit improvements. Technological problems with fare gates and the Compass Card
system have delayed system implementation and eroded public trust in TransLink.
Transportation models tend to over‐estimate vehicular traffic in multi‐modal contexts.
Low density separated land uses in many smaller and suburban communities make providing viable frequent transit challenging.
Lack of communication and understanding about the role that transit and active transportation play in creating great places.
In some cases, there has been a lack of new development around SkyTrain stations. TransLink Municipal Agreements can support committing a required amount of density to stations.
Cycling and Walking Investment Lags Behind Interest and Knowledge, Leading to Moderate and Localized Growth
In BC there is a good understanding of the drivers and barriers to increased cycling, and policies and plans to support cycling are in place in many communities. Furthermore there is growing interest in walking and cycling for both recreation and commuting, due in part to the demonstrated link between active transportation and public health. Implementation,
39 See especially BC Cycling Coalition’s public opinion survey results
however, is slow, in part because investment in active transportation is relatively low. For example, the percentage of transportation budgets allocated to cycling are at or below the cycling mode share. On the cultural side, there is growing recognition of the benefits of active transportation amongst the public, in the medical and planning communities, and within the aging community. However, in smaller and more suburban communities, a “car/truck” culture may also be holding cycling and walking back, at least as a commuting option. Another key barrier for some locations is low‐density land use patterns. These place many homes and workplaces too far apart for cycling or walking to be realistic options for commuting; they also make them rare choices, perceived as unconventional.
Drivers that support increased cycling39
Public support for an increase in Provincial investment in cycling infrastructure.
Increased interest in cycling, including greater number and size of pro‐cycling organizations.
Healthy lifestyles with public awareness of link between obesity and active transportation and exercise.
In medium to large cities, land use patterns that support work trips by bike are relatively common.
Good research on motivators and barriers has led to strong guidance for effective policy.
Barriers to increased cycling
Inadequate and inconsistent funding. Transportation funding needs to focus on active transportation and transit rather than roads and vehicle infrastructure to make a difference.
Infrastructure (network of routes, adequacy of routes, separated lanes) that would attract more people to cycle is not extensive enough and/or has gaps.
Public concerns about safety are deterring cycling.

40
Personal Vehicles Continue to Dominate, but Car‐Sharing and Electric Vehicles Offer Hope
Personal vehicles remain the primary mode of transportation for British Columbians. For example, the automobile mode share in Metro Vancouver has only dropped 2% since 1994, from 77% to 75%, and much of that decline was due to fewer automobile passengers.40 Counterbalancing that lack of progress to some extent, BC’s adoption of hybrid electric vehicles is almost twice the rate of other provinces in the country, and car‐sharing services have flourished in the most urban areas of the province.
Drivers that support more sustainable auto use
Financial incentives to reduce initial cost difference. Baby Boomers are aging out of the 40‐50 age bracket in which the
highest trips/capita occur, so total trips per capita may fall with this demographic shift.
Californian, Canadian, and US requirements for automobile emission standards and sales of low or no emissions vehicles.
Public interest in electric vehicles, and willingness to pay more for them if environmental benefits are significant.
High proportion of renewable electricity supply in BC, so that BC can accommodate a shift to electric vehicles.
Barriers to more sustainable auto use
For electric vehicles, the energy density of electric storage (batteries) is the critical technological barrier to longer range and more convenience.
Public opinion polls show primary barriers are perception of limited range and battery charging concerns; poor understanding of cost savings of switching from gas to electric.
Regulatory barriers to ride‐sharing business models, especially where they compete with existing businesses like taxis, and where
40 TransLink. 2011. Cycling for Everyone: A regional cycling strategy for Metro Vancouver.
concerns have been raised around personal security, public safety, livelihoods, and licencing.
Potentially limited viability of car‐sharing in lower density contexts.
Hard to Define “Sustainable” Goods Movement; Environmental Improvements Overwhelmed by Growth
Goods movement in BC includes rail, marine, air, and truck modes. Because goods movement is tightly tied to the global economy, it is difficult to define what “sustainability” means for this aspect of the built environment in a way that leads to practical change. It is possible to make two general observations, however. BC Trucking Association statistics show that goods transportation by truck has become more fuel efficient and less polluting, and safety has been maintained or has improved. On the other hand, the increase in overall goods movement by truck has overwhelmed technological improvements, making for substantially higher total GHG emissions, and the noise and safety impacts of goods movement through communities is becoming of greater concern, especially where major trucking routes coincide and conflict with residential and shopping areas.
Drivers to more sustainable goods movement
Decreased costs associated with fuel savings. Carbon tax making fuel cost savings more important. Increased awareness driving technologies and techniques for
improved environmental performance, through initiatives like E3 Fleets, and demonstrated through information on the BC Trucking Association website.

41
Barriers to more sustainable goods movement
Hard to understand how to define and achieve sustainability in goods movement realistically, given its tie to the economy in general.
Personal vehicle use competes with goods movement, with attempts to increase capacity for commercial vehicles on highways also allowing the expansion of personal use.
Global economic growth drives increased goods movement, leading to more emissions, more accidents, and more noise (exclusive of technological/practice changes).
Public perception that investments in highways is a public investment, while investment in (more efficient) rail infrastructure is a private investment.
Separated land uses increase demand for transporting goods from place to place.

42
3.5 First Nations
CONTEXT
The authors acknowledge that the majority of BC exists on Traditional Territories which were never ceded by the First Nations who have occupied them for millennia. Today we find First Nations and immigrants living side‐by‐side, working to resolve complex legal, social, economic, and political aspects of our shared history, with a view to restoring fairness and dignity to our relationship.
The First Nations context in British Columbia is complex, with a lack of negotiated treaties, a long and continuing history of colonialism, a lasting legacy of the Residential School System, growing strength of Nations and individual communities, a changing legal landscape (including recent treaties), and the beginnings of reconciliation. Beginning in 1876, the Indian Act gave the federal Department of Indian Affairs authority to intervene in First Nations life, including determining who was an Indian; managing Indian lands, resources, and money; and promoting “civilization.” Over time, the Act became more restrictive, imposing new forms of governance and banning aspects of traditional ways of life. In the 1950s, intent to return some control to First Nations led to relaxation of some provisions in the Act, whereby greater control and latitude was afforded to Band Councils. The relationship between First Nations and the Canadian government began shifting further in the 1970s, with Indian Affairs and Northern Development Canada (INAC, now Aboriginal Affairs and Northern Development Canada (AANDC)) beginning to negotiate land claims. Recent provisions for Nations to adopt their own Land Codes and to have greater financial autonomy have continued that shift. Finally, the treaty process is on‐going, and is gradually cementing nation to nation agreements in BC. The Nisga’a Final Agreement of 2000 was the first modern treaty in British Columbia. Sixty‐five First Nations, representing 104 of the 203 Indian Act Bands in BC, are now participating in or have completed treaties through the BC treaty negotiations process. Of these, eight have signed treaties. The challenging process of shaping a respectful
and reciprocal relationship between governments continues to evolve through these and other means.
SCOPE
In this context, this report focuses on the state of the built environment as a whole (as previously defined) in First Nations communities, and makes some very preliminary observations, based on four expert interviews (some First Nations, some practitioners who work with First Nations). The information in this section should be considered a starting point for REFBC to deepen its understanding of the situation and of unique First Nations needs. It is recommended that REFBC conduct a more in‐depth review of the status of the Sustainable Built Environment with a First Nations focus to complement this report.
VISION Interviewees were asked about their vision of a sustainable built environment for First Nations Communities. The understanding of the Haida, Nuu Chal Nulth, and other Nations that we live in respectful, reciprocal relationship with the earth is a foundational understanding of sustainability. For the Haida, "everything is one and everything is interconnected." All things must be done with respect, including hunting, fishing, and food gathering. So you think about all the interconnections before you do any kind of project.
The Nuu Chal Nulth have a story about a young man paddling his canoe from the open ocean up the inlet when the tide is going out: he is not organizing his energy in keeping with the natural cycles of the moon, the sun, and the world around him. You'd never let the young man marry your daughter because he is not living intelligently nor responsibly. Similarly, we should design and build communities that are in harmony with natural cycles and capacities, and in harmony with the needs of the people. We need to think and believe that we can and should live, design, build our communities in harmony with nature and with the needs of our people first and foremost. So the vision begins with a cultural paradigm that flows into behaviours and practices.
43
Sustainable communities are designed and built for the long‐term (many generations), and must be matched with economic and social structures that are designed to last for a similarly long time. These allow a community to be able to operate and manage their own affairs in a way that can be maintained over a long period of time. This long‐term community self‐sufficiency is a core part of the vision of a sustainable built environment.
KEY IMPACTS
The impacts of achieving sustainable built environments in First Nations communities must be understood as an interconnected part of their achievement of their vision of a sustainable community. Such an achievement would be a demonstration of the importance and value of their culture and stories in shaping a hopeful future for BC and beyond. It would also, and perhaps more importantly, represent a return to the health, vitality, and self‐sufficiency BC First Nations enjoyed historically – within the context of a new relationship with other residents of BC.
STATUS & TRENDS
There is strong cultural alignment with sustainability
As noted in the Vision section, First Nations culture reflects a strong understanding of sustainability. While their rural history may conflict with ideas about higher density, and culture is evolving alongside modern western culture, this is a strong foundation for the future.
Many communities struggle to meet basic needs
Housing, water supply, wastewater treatment, and regular access to energy are taken for granted by most BC citizens; however, these are not consistently available to First Nations communities (e.g. regular boil‐water advisories), and/or they are very expensive (e.g. electricity produced by diesel generators). The high cost of building infrastructure and housing in remote communities makes improving the condition of the built environment very challenging. There is a lack of resources to maintain and
renew buildings and infrastructure, and energy and transportation costs are high.
Peri‐urban and urban communities are in the best shape
Communities located within or near major urban centres are in relatively good shape, due in large part to their ability to draw economic development, and to leverage this into improvements to the lives of community members.
Legal decisions are empowering First Nations…
Nations, beginning with the 1973 Supreme Court of Canada Calder decision that Aboriginal title to lands was part of Canadian law, a ruling in favour of the Nisga’a people. Most recently, the Supreme Court of Canada ruled in the Tsilhqot’in decision 2014 that the Tsilhqot’in First Nation have Aboriginal title to their lands, meaning they have the right to decide how the land will be used, the right to benefit economically from the land, and the right to proactively use and manage the land. Governments and others seeking to use the land must obtain consent of the Aboriginal title holders, and incursion without consent must be justified under s.35 of the Constitution Act, 1982.
… but most Nations still have severely restricted powers.
First Nations without a treaty or a Land Code are very limited in how they can use and control land. Many restrictions about land and resource use/sales exist. First Nations are challenged to capture the economic benefits of local resources (within their territories), which usually flow out of the community.
Resources are stretched
Band administration is expected to do more than a local government with fewer resources: staff are required to manage education, housing, capital projects and infrastructure, fire and police, social challenges, social assistance, and healthcare.

44
Population growth is putting a lot of pressure on reserves.
Currently, the population is growing quite quickly, but the housing stock grows more slowly, restricted by related AANDC funding and approvals processes. Without a way to generate local revenue, jobs, and a transition to local and sustainable food, energy, and waste management, population growth pressures lead to young people moving and working elsewhere. As a result of these and other factors, many First Nations live off‐reserve.
Priorities remain mental and physical health, with the built environment trailing.
Many First Nations communities are tackling pressing mental health, addiction, and physical health challenges. These are a direct result of the history of colonialism, including the residential schools history. Addressing homes and buildings is naturally secondary, with infrastructure being even less of a priority.
Drivers of Change
Supreme Court of Canada decisions. The Constitution did not clearly define Aboriginal Title, and over a series of decisions, the Court has defined it more closely, including recent landmark cases like Tsilhqot’in.
Enabling Federal legislation such as the First Nations Fiscal Management Act and the First Nations Land Management Act have enabled some nations to control their finances and land base better.
Increased financial self‐reliance, due in part to benefits agreements with resource companies. These agreements are bringing at least some benefits from resource extraction to the local community. In peri‐urban communities, economic development initiatives have increased financial capacity significantly.
Local government recognition of the importance of building long‐term relationships with their First Nation neighbours is increasing;
partnerships in which the built environment is shared cross‐culturally help build these relationships.
Aboriginal Affairs and Northern Development Canada (AANDC) is involved in Nation‐to‐Nation networking to support the built environment.
Capacity‐building approaches are being used more frequently by consultants to help coach First Nations on planning‐related issues.
Mentorship both between elders and youth and between Nations is building a strong knowledge base and skills to support administration.
Barriers to Change
The Indian Act restricts resource use and limits sales and revenue generation opportunities.
Lack of capacity to meet community needs and external demands Slow progress on reconciliation. The final residential school,
located in Saskatchewan, closed in 1996. In 2007, the Government of Canada created the Truth and Reconciliation Commission, along with a compensation fund for residential school survivors. The Commission’s findings set out clear steps towards reconciliation. The Government of Canada formally apologized for the residential school system in 2008. However, more remains to be done.
Inconsistent and hard to access funding. Funding to implement projects is inconsistent from year to year and can be hard to access. Further, the shared ownership of on reserve land makes asset‐backed financing (i.e. mortgages) impossible.
Housing deficit. Bands finance housing construction, then rent housing to members. If members are unable to pay rent – a common problem in communities with health and literacy issues combined with limited access to employment – the band is left with a growing and significant deficit.
Lack of a triple bottom line approach. Many Provincial and Federal decisions are made based primarily on financial considerations, rather than other values, the number of people benefitting, and the effect on the land.
45
AANDC focused on least cost: capital projects decisions are largely based on cost rather than longevity, design, and sustainability.
The process of developing good service agreements has been slow with some local governments slow to support better relationships and agreements with neighbouring First Nations.
Lack of local educational opportunities. Young people are reluctant to leave communities, due to the legacy of the residential school system. Once they leave, it is harder for them to find jobs.
Reserves are usually much too small to support economic development for the band. Furthermore, they are sometimes located on marginal lands, leaving residents vulnerable to natural hazards.
Traditional knowledge is lost or not used. Traditional knowledge and wisdom are sources of direction and can help shape land use decisions to be consistent with natural cycles. However, the loss of language and of elders themselves has translated into a loss of important and useful knowledge, and it is not always used in planning.