the business combination - crescitaspa.it · business combination –key highlights the business...
TRANSCRIPT

The Business CombinationFebruary 19th, 2018

Disclaimer
2
This document has been prepared by Crescita S.p.A. (the “Company”) exclusively for use in the presentation of the envisaged business combination. Thisdocument may not be copied, distributed or reproduced in whole or in part, nor passed to any third party without the written consent of the Company.
The information contained herein does not purport to be comprehensive. The content of this document has a merely informative nature and is not to beconstrued as providing investment advice. Interested parties should conduct their own investigation and analysis of the Company and the data set forth inthis document. This presentation, any presentation made in connection herewith and any accompanying materials are preliminary and subject tocorrection and amendment in their entirety and are made available solely for discussion and feedback purposes and do not, and are not intended to,constitute any sort of recommendation, invitation or solicitation regarding any investment in the shares of the Company. The information contained hereinis only preliminary and indicative and does not purport to contain the information that would be required to evaluate the Company, its financial positionand/or any investment decision. This document is not intended to provide, and should not be relied upon for, accounting, legal or tax advice nor does itconstitute a recommendation. any investment decision should only be made on the basis of information contained in the Admission Document and in theInformation Document that is available at the registered office of the Company or on the Company’s web site.
No representation or warranty, either express or implied, is made as to, and no reliance should be placed on, the fairness, accuracy, completeness,correctness or reliability of the information contained herein. Neither the Company nor any of its representatives shall accept any liability whatsoever(whether in negligence or otherwise) arising in any way in relation to such information or in relation to any loss arising from its use or otherwise arising inconnection with this presentation.
The information contained in this document, unless otherwise specified is only current as of the date of this document. Unless otherwise stated in thisdocument, the information contained herein is based on management information and estimates. This presentation includes certain forward lookingstatements, projections, objectives and estimates reflecting the current views of the management of the Company with respect to future events. Due tosuch uncertainties and risks, readers are cautioned not to place undue reliance on such forward-looking statements as a prediction of actual results. Allforward-looking statements included herein are based on information available to the Company as of the date hereof. The Company undertakes noobligation to update publicly or revise any forward-looking statement, whether as a result of new information, future events or otherwise, except as may berequired by applicable law. The information contained herein is subject to change without notice and past performance is not indicative of future results.The Company may alter, modify or otherwise change in any manner the content of this document, without obligation to notify any person of such revisionor changes. Persons reading this document must make all trading and investment decisions in reliance on their own judgement. No statement in thispresentation is intended to be nor may be construed as a profit forecast.
This presentation does not constitute an offer of securities for sale and is not for transmission to, publication or distribution or release in the United States ofAmerica (including its territories and possessions, any state of the United States of America and the District of Columbia) ("United States"), Canada,Australia or Japan, or to any other country where such distribution may lead to a breach of any law or regulatory requirement.
By accepting this document, you agree to be bound by the foregoing limitations.

Investment supported by compelling reasons
Notes: * This includes the capital raised on the market of €130m and the capital injection made by the sponsors of €3m ; ** Calculated on the basis of data verified by the Management and available market sources. Source: Management information on external market data
3
• Crescita is a SPAC (Special Purpose Acquisition Company) set up under Italian Law
• Listed on AIM, the SPAC has raised a total capital of €133m*
Crescita
Main reasons to invest in the proposed Business Combination
Sizeable market with strong expected growth in specific segments, both in Italy (the “stronghold” market for CL, whose share is 38% compared to 7% of the second player**) and Europe
Leading European company specialized on smartphone accessories products with a track record of growth outperforming all the major EU markets
Plan to unleash growth opportunities in terms of geographies, products and channels
Top of mind brand, first ranked when compared to the other aftermarket players
Led by best-in-class top Management, characterized by deep expertise in the retail and consumer industry, commitmentand proven track record
Cash generating company, with an operating cash flow of c. €34m on average and an EBITDA margin constantly at 23% on average in the last three years
Attractive valuation
Public company quickly aiming at STAR segment

Table of contents
1. Transaction overview
4

Business combination – Key highlights
The Business Combination will be in the form of a Merger by incorporation of the Cellular Group into Crescita and consists of 3 concurrent steps
▪ Listing of Cellularline on the Italian Stock Exchange ▪ Provide financial resources to Cellularline to exploit growth opportunities
Key objectives
Key steps
▪ Acquisition by Crescita of a 49.87% stake in the Cellular Group mainly from financial investors and marginally from founders
▪ Acquisition cost €80m
▪ Acquisition by Christian Aleotti and Marco Cagnettaof a 3.1% interest in the company for a total €5m investment
▪ Both agree for a 36-month lock up on their shares
▪ Merger by incorporation of the Cellular Group into Crescita
▪ The resulting company takes the name of Cellularline
▪ Exchange share ratio 1 to 1 (@€10 per share)
Shares purchase Co-CEOs investment Merger
5

Business combination – Valuation and price adjustments
• Remedy Shares: up to 1,067,159 remedy shares will be made available to Crescita shareholders by Sellers• Earn out: Crescita will recognize to Sellers the tax benefit potentially arising from the Patent Box application for 2015, 2016 and 2017 fiscal years
Price adjustments
Valuation
Exchange ratio
Exchange share ratio 1 to 1 (@€10 per share)
Equity Value* €160.4m
Enterprise Value** €244.4m
‘16 EV/EBITDA Adj.** 6.3x
‘16 P/E*, *** 6.6x
Net Asset Value €133.0m
Equity value per share €10.0
Notes: * Pre money; ** Based on a normalized Net Financial Position, agreed in €84m; *** Based on 2016 net result before GW amortization & Intangible w/o.
6

Pre-merger
Post-merger
Crescita
50.28%6.70%
6.46%
36.56%S.L.M.K.
DVR
Movil 2000
Founders 86.47%
13.53%
Market
Sponsors
13.16%
11.98%
10.82%1.15%
62.89%
Funds
Aleotti Family
Foglio Family
M. Cagnetta
Crescita Shareholders
16.41%
14.93%
13.49%1.44%
53.73%
Funds
Aleotti Family
Foglio Family
M. Cagnetta
Crescita Shareholders
Business combination – Shareholders structure*
Cellular Italia**
Cellularline in case of zero withdrawal*** Cellularline in case of maximum withdrawal***
Notes: * The shareholders structure includes special shares; ** Shares indirectly owned through Ginetta S.p.A. which controls Cellular at 100%; *** Potential dilution deriving from warrants exercise not included.
7
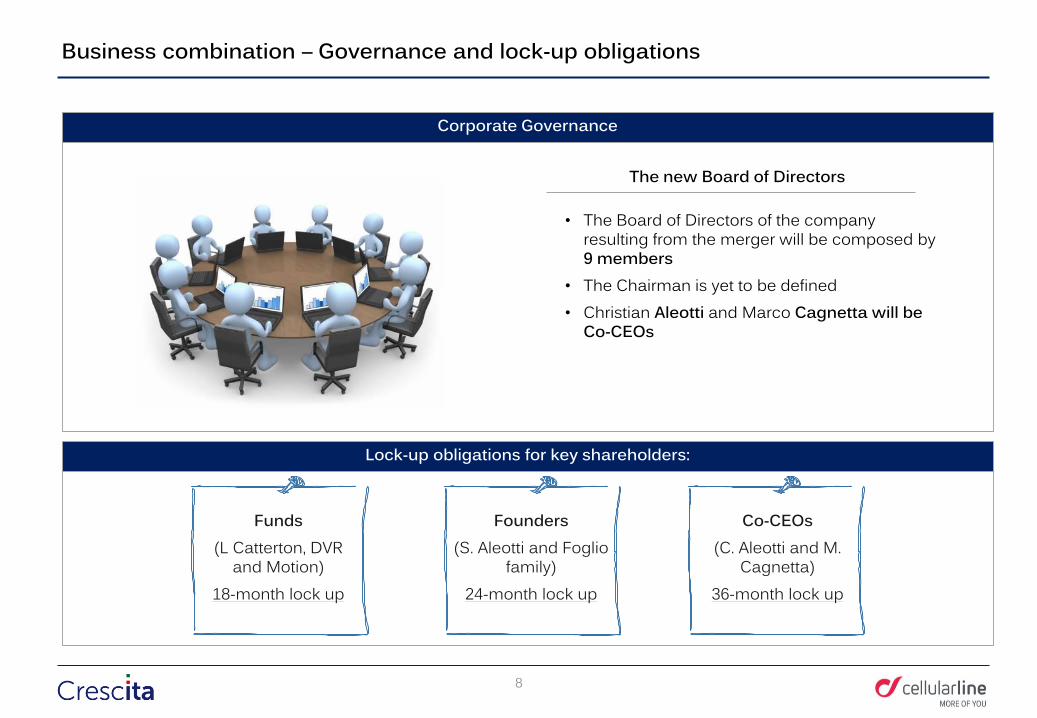
Business combination – Governance and lock-up obligations
Corporate Governance
• The Board of Directors of the company resulting from the merger will be composed by 9 members
• The Chairman is yet to be defined• Christian Aleotti and Marco Cagnetta will be
Co-CEOs
The new Board of Directors
Lock-up obligations for key shareholders:
8
Funds(L Catterton, DVR
and Motion)18-month lock up
Founders (S. Aleotti and Foglio
family)24-month lock up
Co-CEOs (C. Aleotti and M.
Cagnetta)36-month lock up
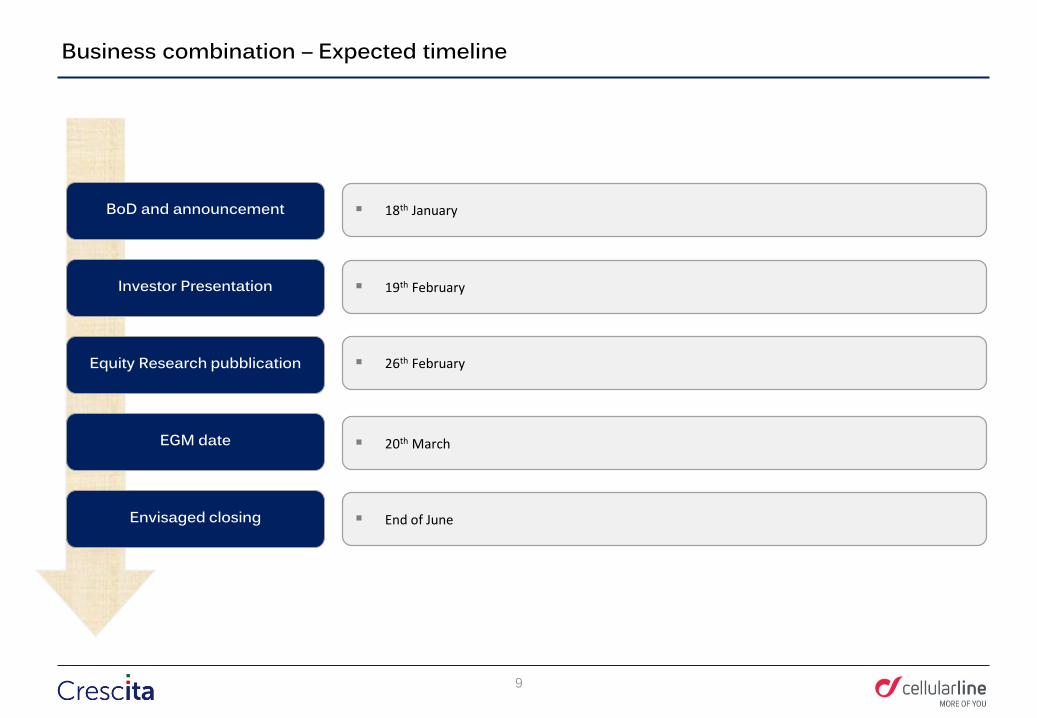
Business combination – Expected timeline
BoD and announcement
Investor Presentation
EGM date
Envisaged closing
Equity Research pubblication
▪ End of June
▪ 20th March
▪ 26th February
▪ 19th February
▪ 18th January
9

Table of contents
2. The Equity Story
10

Cellularline at a glance
▪ Founded in Reggio Emilia in 1990, Cellularline has become a European leading brand in the development and sale of accessories for smartphones and tablets
▪ In Italy CL is by far the market leader in CE and Mass Merch channels and in allthe product categories, while in Germany is the 3rd market player
▪ The company has reported a strong historical sales growth (CAGR +16% in 2011-2016 period) with an EBITDA margin stable in the range of 20-24%
▪ In the last two years the company has reported an average net result* of €23.4m and an average net cash flow of €22.0m
Overview
Historical sales trend evolution Historical EBITDA Adj.** trend evolution
+16%
2016 A
164.5
2015 A
160.7
2014 A
158.2
2013 A***
134.8
2012 A***
108.4
2011 A***
79.3
2016 A
36.9
+19%
38.937.3
2014 A 2015 A
28.4
2013 A***
33.2
2012 A***2011 A***
16.1
(€m) (€m)
25% 23% 23% 24%26%20%Ebitda Margin %
Notes: * Before GW amortization & Intangible w/o; ** Normalized for non recurring items and forex (classified, under the accounting principles, below the Operating Income); *** For years prior to the acquisition by Ginetta S.p.A. (2013) data refer to Cellular Italia consolidated financials statements. Source: Management information
11

The Equity Story - Contents
1. Sizeable market 2. Leading European company 3. Top of mind brand4. Distinctive and effective business model 5. Best-in-class top Management6. Growth opportunities
12
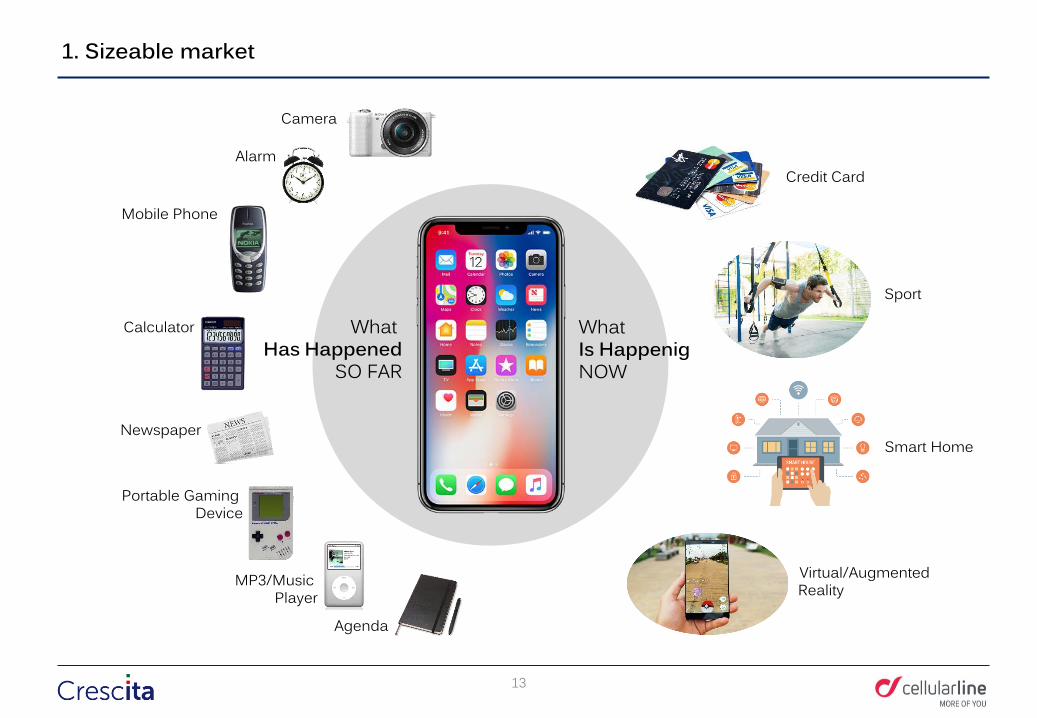
Camera
Alarm
Mobile Phone
Calculator
Newspaper
Portable Gaming Device
MP3/Music Player
Agenda
Credit Card
Sport
Smart Home
Virtual/Augmented Reality
WhatHas Happened
SO FAR
WhatIs HappenigNOW
1. Sizeable market
13

2. Leading European company - Product portfolio
Voice & Audio Music Wearables Motorcycle
productsBranded products
distribution
Protection & Style
Charge & Utilities
37%35% 14% 2% 6% 6%
Red line Black line Blue line
Cases
Screen protectors
Power bank
Battery charger
Headsets
Speakers/ HF
Interphone Other products with different
labels
Others
Smart watches & Fitness trackers
Car accessories VR headmounts
Note: *Consolidated sales, gross of bonuses to clients and intercompany adjustments, excluding revenues realized by Cellular Spain. Source: Management information.
14

Source: Management Information
Charge & Utilities
2. Leading European company - Product portfolio (cont’d)
Multi-specialist segmentationDifferent product/pack strategy
Protection & Style Voice & Audio Music
15

Source: Management Information
2. Leading European company - Product portfolio (cont’d)
Attractive, easy and self explaining pack
16

2. Leading European company - Countries
Among Top 3 Players
Other key EU countries
Market leading position Business by geography
46%
31%
14%
2%4% 4% Italy
UE countries
non UE countries
Red line - All geographies
Black line - Allgeographies
Blue line - Allgeographies
(% on total 2016 sell-out data)
Market leader
Red line (⁓90%)
Source: Management information on external market data.
17

CL is the most recognized brand among competitors specialized in smartphone accessories - aided
Competitor #7 11%
Competitor #6 14%
Competitor #5 21%
Competitor #4 23%
Competitor #3 26%
Competitor #2 27%
Cellularline 63%
Smartphone Producer #6 9%
Smartphone Producer #5 9%
Smartphone Producer #4 12%
Cellularline 17%
Smartphone Producer #3 21%
Smartphone Producer #2 37%
Smartphone Producer #1 46%
CL is the fourth most recognized brand after phoneproducers - not aided
3. Top of mind brand
Sources: Consumer interviews, Management information on ad-hoc research. Questions were: - Aided: For each of the following brand could you please indicate which one you know?- Not Aided: Talking about brands of accessories for mobile phones and tablets, what is the first brand that comes to your mind? Other than this, what other brands do you know?
18

4. Distinctive and effective business model – Value chain strategy
Source: Management Information
Logistic & StockingManufacturingProduct development
▪ New product development and scouting
▪ R&D activities▪ Product marketing▪ SKUs planning and
offer segmentation
▪ Development ofoutsourcing strategies for production
▪ Vendor selection▪ Negotiation of supply
conditions▪ Definition of
exclusivity agreements▪ Quality control
▪ Management relationship with the logistic partner in charge of products warehousing, picking & packing
▪ E-commerce ready
Strategicinternally managed
Sales & Marketing
▪ Marketing analysis▪ Single product
category management ▪ SKUs planning and
offer segmentation ▪ Pricing strategy▪ Shelf management▪ Management of
seasonal product
Efficiency drivenexternalized
Cellularline directs all the value chain activities
19

4. Distinctive and effective business model - Product development
Source: Management Information
20
• External production process strictly controlled through a proprietary molding tools concept
• Quality control process with double checks before shipment and on arrival
• Weekly sell-out data monitoring on relevant PoS panel to fine tune or to adjust product mix
• R&D team visiting major trade shows twice a year to ensure a constant update on product and consumer trends
• External exclusive design company partner, managing design for technical products and allowing consistent and distinctive brand family visual concept across different product categories
• Internal packaging & POP material design and development team
• Selection of suppliers with strong technical innovation capabilities and willingness to support the company in its continuous innovation effort
• High visibility on market upcoming trends thanks to Cellularline sales team privileged point of view on European market
• Usage and attitude studies by product category with both qualitative and quantitative data
• Detailed market monitoring for main geographies across Europe • Fully dedicated group product and product managers to define product
portfolio structure, new product development and go to market strategy
Consumer driven approach, internal drivers for product
development
A
External drivers for product development
B
Dedicated R&D and design team
C
Production, launch, monitoring sell out
results
D

4. Distinctive and effective business model - Sales & Trade Marketing
Source: Management Information
Assortment management
Display layout management
POP materials strategy by channel
Impulse material development
A
B
C
D
▪ Consumer centric approach combining B2B customers requirements with end users’ needs
▪ Ad hoc shelf management with specific solutions for different channels and clients. Superior capability to precisely execute at POS level the defined trade marketing strategies, with a unique direct access to the clients points of sale allowing a direct hands-on assortment management
▪ Visual merchandising management• Ensuring clear distinction between different product
categories• Allowing flexibility to quickly launch new products and
easily place them in stores▪ POP materials strategy by channel
• Allowing Cellularline products to stand out attracting customers
• Facilitating cross-selling• Providing end-users with information related to selected
offers• Brand value message communicated to the widest
possible audience▪ Seasonal POP materials placed at the exit/cashiers to
exploit the impulse purchasing
21
Co-CEO Sales,
Marketing & Trade
Marketing
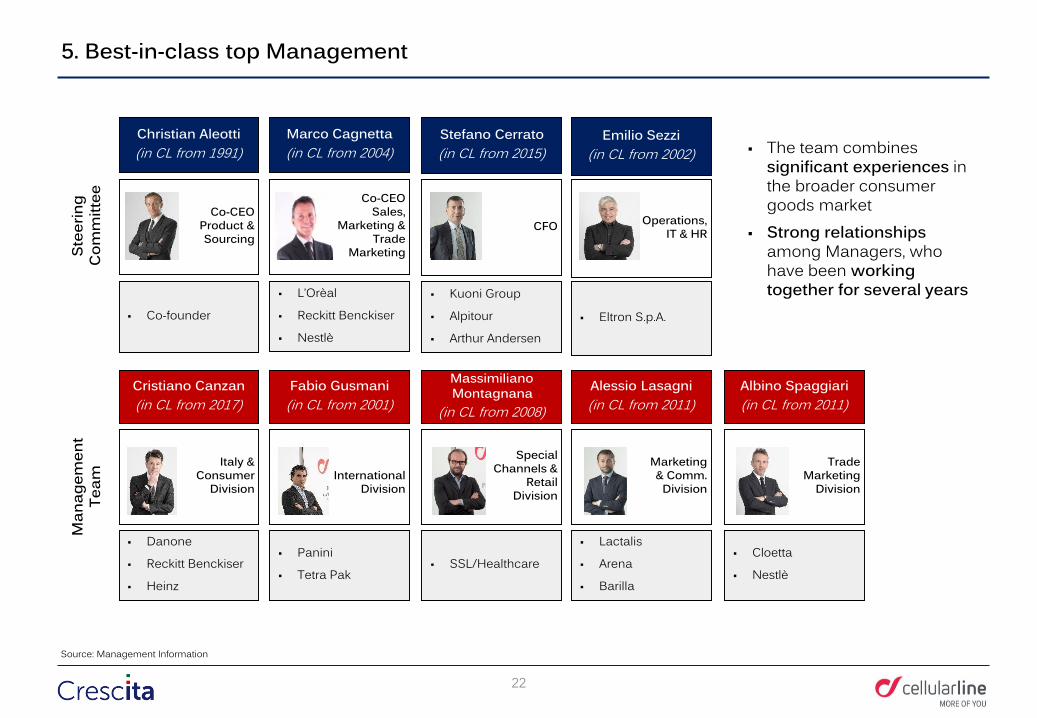
5. Best-in-class top Management
Source: Management Information
Christian Aleotti (in CL from 1991)
▪ Co-founder
Co-CEOProduct & Sourcing
Stee
ring
Com
mitt
ee
Marco Cagnetta(in CL from 2004)
▪ L’Orèal
▪ Reckitt Benckiser
▪ Nestlè
Stefano Cerrato(in CL from 2015)
▪ Kuoni Group
▪ Alpitour
▪ Arthur Andersen
CFO
Emilio Sezzi(in CL from 2002)
▪ Eltron S.p.A.
Operations, IT & HR
Cristiano Canzan(in CL from 2017)
▪ Danone
▪ Reckitt Benckiser
▪ Heinz
Fabio Gusmani(in CL from 2001)
▪ Panini
▪ Tetra Pak
Massimiliano Montagnana
(in CL from 2008)
▪ SSL/Healthcare
Alessio Lasagni(in CL from 2011)
▪ Lactalis
▪ Arena
▪ Barilla
Albino Spaggiari (in CL from 2011)
▪ Cloetta
▪ Nestlè
Italy &Consumer
DivisionInternational
Division
SpecialChannels &
RetailDivision
Marketing & Comm.
Division
Trade Marketing
Division
▪ The team combines significant experiences in the broader consumer goods market
▪ Strong relationships among Managers, who have been working together for several years
Man
agem
ent
Team
22

6. Growth opportunities - Overview
Identified path to growth
Product development
International expansion
Channels development
Online
M&A
23

Notes: *Calculated on the basis of data verified by the Management and provided by primary research institution; ** It comprises car battery chargers, accessories and speakers. Source: Management information on external market data
(YTD Sep 2017, €m*)
YTD Sep 2017 BatteryChargers
53%
Headsets
70
16%
Cases Car devices**
1520
37%
ScreenProtectors
4070
39% 49%
BatteryChargers
20
43%
PowerBanks
35%
65%
YTD Sep 2017
Cellularline market rank:
Market share by product category for CE channel
125
16%
85
Headsets PowerBanks
30 25
13%
Cardevices**
15
17%
35
9%25%
ScreenProtectors
Cases
Cellularline market rank:
11%
89%
Market share by product category for all channels(YTD Sep 2017, €m*)
235
315
1%
24
6. Growth opportunities - Product development

Source: Management Information
• Carefully designed and crafted by Cellularline, AQL is the audio brand that will improve people’s listening experience and boost their emotions everyday and wherever they are
• Focusing on customer needs via ad hoc market research, AQL line-up is balanced among different typologies (wired / Bluetooth earphones and headphones and Bluetooth speakers), technologies (noise cancelling, waterproof etc..) and design / color options
Key features of the new AQL line-up by Cellularline
6. Growth opportunities - Product development (cont’d)
Headphones Earphones Speakers
25

6. Growth opportunities - Countries
26
▪ Strong market position in all main EU countries:
• Market leader in Italy and Austria
• Among Top3 player in Germany, Belgium, Netherlands
• Developing presence in the highly fragmented French market
Market share in top EU countries (2016, €m*)
Top 3Market leader
Cellularline market rank
Market leader Top 3 Top 3 n.m.
Cellularline market share
Total Market size (€m)
Top3 market share
2nd player market share: 7%
38%
14% 7% 7% 5% 2%18%**
100 48090 160710330
51%
29% 21%n.a.31%
Notes: * Calculated on the basis of data verified by the Management and provided by a primary research institution; ** For France data refers to the period from April 2016 to March 2017. Source: Management information on external market data.
Market share evolution by countries
+2.4 ppt +13.5 ppt +22.1 ppt +21.9 ppt+27.2 ppt∆ CAGRCellularline vs. market
34.5%
17.6%
19.1%
20.8%13.5%
36.9% 27.0% 42.9% 41.0%44.8%CAGR Cellularline2011-2016
(2011-2016, €m*)
CAGR Market 2011-2016
CellularlineMarket share
445360
480
200
320290
1413 161512111413 161512111413 161512111413 161512111413 16151211
6045359085701059585
160145110
710
315
660550
450390330300
245330
14075

43%31%
11%
>50%
CE MassMerch. Telco Travel Retail
6. Growth opportunities – Distribution channels
Sales Channel coverage Italy
Cellularline market share
41 2030155Channel size (€m, YTD Sept 2017)
15% 10%5%67%% on CL Sales in Italy
▪ Cellularline is the leading supplier of all major players in Italy in CE, MassMerch. and Travel Retail
▪ Since 2017, thanks to the new TIM agreement, CL share in Telco has been rapidly growing
Note: * Management estimate assuming a value of sell-out equal to twice the amount of sell-in. Source: Management information on external market data.
*
27

7. Online
Development pathToday
Developed and launched the proprietary e-commerce platform
Engagement of CE retailers throughout their online shift;
Promotion of online and social campaigns to support the brand
Expansion of online distribution on marketplaces
Keyactivities
Development of the e-shop on www.cellularline.com▪ Emotional product presentation▪ Simplified product research▪ B2C delivery
Development of specific capabilities on the proprietary websites to better serve offline CE retailers in their online progression▪ Presence on all the online shops of
major CE retailers and IT integration
▪ Joint development of cross selling processes
Development of online and social activities to promote brand awareness and drive traffic to the stores
Speed-up growth in marketplaces▪ International expansion (Spain,
France, Germany), with main focus on premium and value-added products, such as Audio and Wearables, with strong online share of Sales
Source: Management Information
28
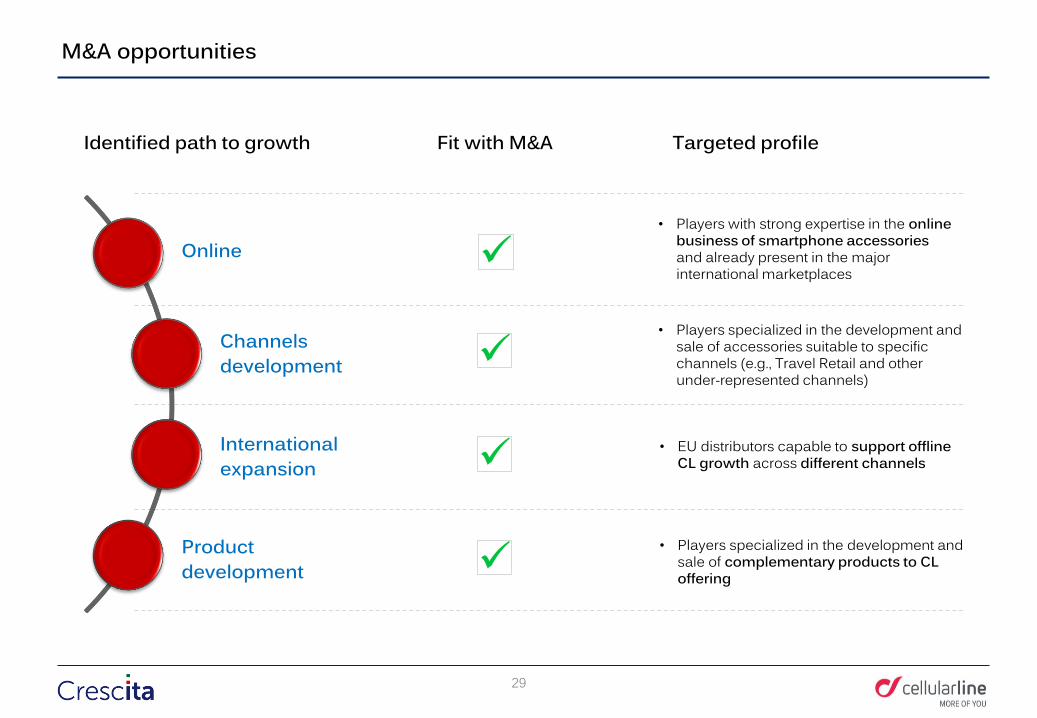
M&A opportunities
Fit with M&A Targeted profile
✓
✓
Online
Channels development
International expansion
Product development
Identified path to growth
✓
• Players specialized in the development and sale of complementary products to CL offering
• EU distributors capable to support offline CL growth across different channels
• Players with strong expertise in the online business of smartphone accessories and already present in the major international marketplaces
• Players specialized in the development and sale of accessories suitable to specific channels (e.g., Travel Retail and other under-represented channels)
✓
29
Table of contents
30
3. Key Financials and Final Remarks

Ginetta Group 2011-2016 (consolidated1)
31
* * *
Note: * Cellular Italia consolidated data for 2011 and 2012 and Ginetta consolidated from 2014q** Cellular Italia S.p.A. statutory figures (no consolidated figures available for 2013)
q *** Before R&D capitalizations for €0,5m (applied in 2016 only for IFRS purposes of CL Italia, and since 2017 for all reporting)q**** Calculated as financial flow from operating activities (no CapEx) + interests and taxes paid as per “Rendiconto Finanziario” q***** In 2013 it mainly includes goodwill and other intangibles arising from merger; from 2014 it mainly refers to non recurring CapEx incurred on buildings and in connection with refinancing.
Note: 1. ITA GAAP q.
€ K 2011 * 2012 * 2013 ** 2014 * 2015 * 2016 *
VALUE OF PRODUCTION 79.269 108.366 134.791 158.167 160.722 164.484
EBITDA Adj 16.110 28.374 33.227 36.897 37.298 38.887
% EBITDA / SALES 20,3% 26,2% 24,7% 23,3% 23,2% 23,6%
NET RESULT before GW amort. & Intangible w/o 10.070 18.446 17.341 20.975 22.489 24.262
% NET RESULT / SALES 12,7% 17,0% 12,9% 13,3% 14,0% 14,8%
CASH / (NET DEBT) (13.311) (13.564) (85.719) (70.133) (53.100) (26.179)
OPERATING CASH-FLOW **** 3.139 9.813 31.861 29.203 35.035 39.242
% OCF / EBITDA 19,5% 34,6% 95,9% 79,1% 93,9% 100,9%
INVENTORY 7.935 12.965 15.348 14.150 17.029 15.980
% INVENTORY / SALES 10,0% 12,0% 11,4% 8,9% 10,6% 9,7%
CAPEX, recurring (1.501) (2.498) (1.248) (1.574) (1.446) (1.700)
% CAPEX / SALES 1,9% 2,3% 0,9% 1,0% 0,9% 1,0%
CapEx, not recurring ***** - - (137.881) (758) (1.800) (1.786)
CapEx, Total (1.501) (2.498) (139.129) (2.332) (3.246) (3.486)
Ginetta Group 2011 - 2016 (consolidated)
***
**

Ready to exploit the new market opportunities
Booming Phase at the development of smartphone era
Consolidation Phase in major market segments
Expansion Phase through organic growth and M&A opportunities
Offering expansion in a wide range of smartphone and
tablet accessories
Exploiting further opportunities in
international markets, online and new
channels/products
Strengthened and more balanced brand
presence in distribution channels and
international markets
Cellularline development phases
20152014201320122011 2019201820172016
Cash available to finance furtherexpansion opportunities in next years
Strong financial performances and cash generation
32