the cbd insider 2019 us cbd consumer report · the cbd insider is an independent publication...
TRANSCRIPT

THE CBD INSIDER 2019 US CBD CONSUMER
REPORT
© T H E C B D I N S I D E R . A L L R I G H T S R E S E R V E D .
...................... 03
................................................... 04
............................................ 05
............................................................... 05
......................................................... 07
.................. 07
....................................... 09
....................................................... 11
................................................................ 11
.......................................... 12
........................................................ 15
.................... 17
................................................................ 19
.......................................................... 19
............................... 21
........................................... 24
...................................................... 27
..................... 27
......................................... 32
........................ 33
.......................................... 36
.................... 36
.......................... 37
............................... 38
............................................... 40
............................................ 40
................................................................................. 42
......................................................................... 49
.......................................................................... 56
............................................... 63
...................................................................... 71
.............................................................. 75
LETTER FROM THE EDITOR-IN-CHIEF
EXECUTIVE SUMMARY
ABOUT THE CBD INSIDER
METHODOLOGY
PART ONE: CBD CONSUMER HABITS AND PREFERENCES
AWARENESS AND EXPOSURE TO CBD
SENTIMENT TOWARD CBD
CBD CONSUMERS
Behavior
Product Preferences
Reasons for Use and Perceived Effectiveness
Consumer Concerns About CBD
PURCHASING TRENDS OF CBD CONSUMERS
CBD Brands
Purchase Decision Factors
Purchasing Behavior
PAST CONSUMERS
Understanding Lost Consumers
Concerns About CBD
Winning Back Lost Consumers
POTENTIAL CONSUMERS
Reasons They Haven’t Tried CBD
Reasons They Would Try CBD
Purchase Decision Factors
PART TWO: CROSSTABS
RESPONDENT PROFILES
AGE
GENDER
REGION
MILITARY & VETERANS
DISABLED
KEY TAKEAWAYS
thecbdinsider.com TABLE OF CONTENTS 2
TABLE OF CONTENTS
As someone who has lived with autoimmune disorders my entire life, I have tried everything from turmeric to acupuncture to help treat my symptoms. When I first discovered CBD, I couldn’t believe how effective it was at relieving the fatigue and inflammation I dealt with almost every day. After a few weeks of consistent results, I was convinced that there was more to CBD than could be explained by mere placebo, and I realized that CBD had the potential to dramatically improve the lives of countless people around the world.
As I started to educate myself about CBD, I found that there was a shocking lack of information about the cannabinoid that was both reputable and easy to understand. Information about CBD was essentially limited to dense and complex medical studies or oversimplified, biased market-ing copy on CBD company websites. I found myself driven to change this, and so I put together a team that would help me launch what became known as “The CBD Insider.”
From the outset, we knew our mission was to provide everyday people with objective and understandable information about CBD and the companies that produce it, so that they could confidently make informed purchasing decisions.
The concept for The CBD Insider 2019 US CBD Consumer Report was developed by our team in
early 2019. The goal was to take our analysis of the CBD industry to the next logical level, specifically, to better understand what consumers want, like, dislike, and need from the CBD industry. We firmly believe that a more informed industry can grow in a healthy, sustainable way while better serving customers in the process.
When considering the objectives of the report, our team also discussed the potential insights we could offer not just to the CBD industry itself, but also to regulators, policymakers, and the media. While our report provides unbiased facts, we have sprinkled in some perspective on ways that the FDA, Amazon, and the mainstream media (to name a few) could better serve those that rely on them.
This report would not have been possible without the long nights and hard work of The CBD Insider team, particularly Managing Editor Caleb Lacefield. It also would not have been possible without the guidance and assistance of friends and colleagues in the data science field who helped us climb the learning curve faster than we could have on our own.
I hope that you are able to derive significant insights and value from this study. If you would like to share your thoughts (positive, negative, or otherwise), I encourage you to contact me via email at [email protected].
To Good Health,Ian Eckstein
thecbdinsider.com LETTER FROM THE EDITOR-IN-CHIEF 3
Letter from the Editor-in-Chief
Throughout the United States and around the
world, awareness, popularity, and usage rates of
CBD continue to grow at an extraordinarily rapid
rate. The majority of current CBD consumers have
been using the product for less than one year,
and mainstream awareness of CBD is increasing-
ly prevalent. At the same time, attitudes and un-
derstanding of CBD are shifting across nearly all
demographics, including age, region, gender, and
others.
With the industry evolving at such a rapid pace,
the need for quantitative insight into consumer
preferences and behaviors towards CBD are more
important than ever.
The CBD Insider 2019 US CBD Consumer Report
is an effort by our editorial team to help provide
clarity on what consumers want and expect from
the CBD industry moving forward.
Key Takeaways
Our key takeaways revolve around consumer
behaviors, consumer knowledge about CBD,
the state of the marketplace, and the effects of
current public policy.
Some of our key takeaways include:
• Amazon’s current policy prohibits product
listings containing CBD, so several sellers
sell “hemp oil” that may or may not contain
CBD. Despite this, more than one in four con-
sumers (26.7%) say they purchase CBD from
Amazon and almost half of all consumers
(49.4%) said they would feel comfortable
purchasing from Amazon.
• Consumers do not know how much CBD to
take and would benefit from clear guidance.
More than two in five past consumers (41.3%)
and one in five current consumers (20.8%) are
unaware of how much CBD they take.
• CBD is beginning to displace some traditional
medications. More than one in five current
CBD consumers (22%) said they have replaced
a medication with CBD.
• The high cost of CBD products is also driv-
ing away a significant number of consumers.
More than one in five past consumers (21.9%)
said they stopped using CBD because it was
too expensive.
thecbdinsider.com EXECUTIVE SUMMARY 4
Executive Summary
S U R V E Y O V E R V I E W
SAMPLE SIZE: 1,055
MARGIN OF ERROR: ±3.3
SURVEY DATES: 12/20/2019 -
1/20/2020
METHODOLOGY: Online Survey
To conduct the study, our team utilized a nationally representative set of online audience panels, with support from Qualtrics. The survey took respondents approximately 15 minutes to complete, and was conducted from December 20th, 2019 through January 20, 2020.
The survey separated respondents into four segments:
• Current CBD consumers: Individuals who
are familiar with and currently using CBD products.
• Potential CBD consumers: Individuals who are at least somewhat familiar with CBD prod-ucts and were willing to consider using CBD.
• Past CBD consumers: Individuals who had used CBD in the past but no longer do.
• Uninterested: Individuals who were either unaware of or uninterested in CBD.
Respondents were also balanced by age, gen-der, and region with respondents from 48 states. Crosstabs were identified for the following catego-ries and some are analyzed in Part 2 of this report:
• Age• Gender• U.S. region• Income• Education• Disability status• Military/veteran status
Demographics
Our study included 1,055 respondents from 48 of the 50 states (only North Dakota and Vermont are not represented in our sample). When analyzing the crosstabs, we separated the United States into four regions: West, South, Northeast, and Midwest, which is in line with how the United States Census Bureau assesses the nation’s regions.
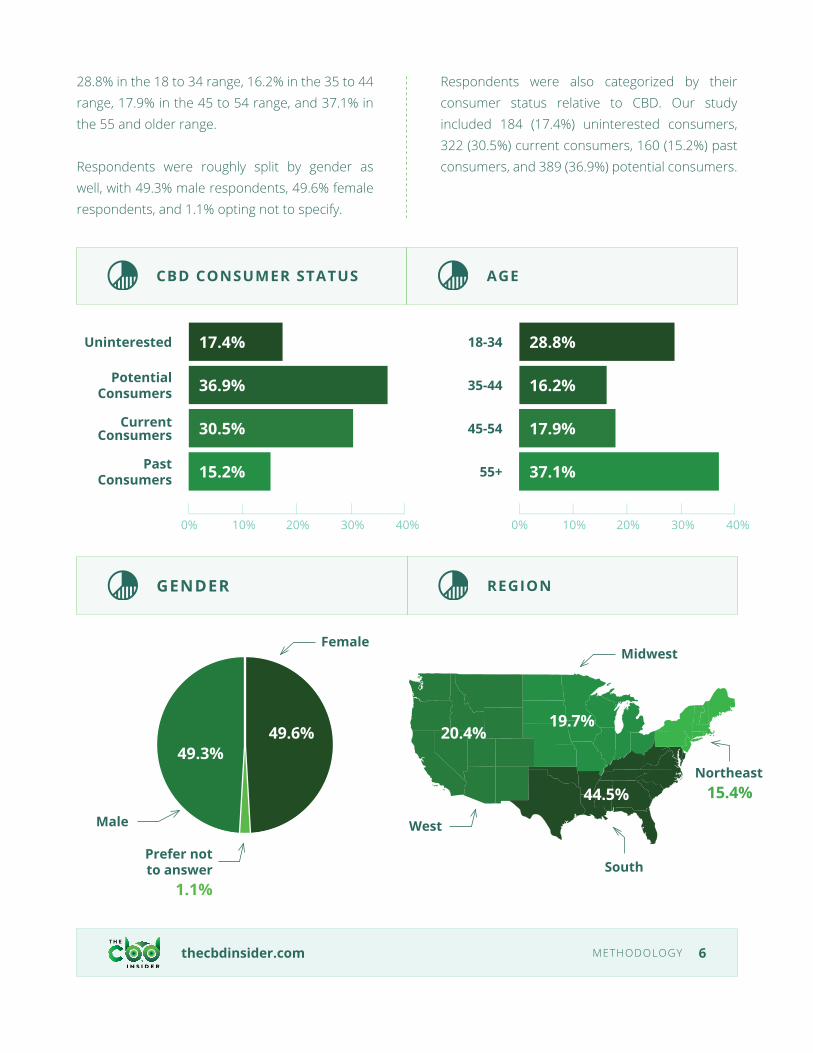
The regional breakdown is as follows: 15.4% of respondents are from the Northeast, 19.7% are from the Midwest, 44.5% of respondents are from the South, and 20.4% are from the West.
Respondents were also categorized by age, with
The CBD Insider is an independent publication specializing in news and analysis of the CBD indus-try.
The CBD Insider’s mission is to bring honest, un-derstandable, and authoritative information about CBD to consumers. The publication was founded in 2018 by Ian Eckstein, a long-standing proponent of the therapeutic potential of CBD. His goal is to help consumers make educated choices when purchasing CBD and highlight CBD companies who are building their brands in a responsible manner.
thecbdinsider.com METHODOLOGY 5
About The CBD Insider
Methodology
thecbdinsider.com METHODOLOGY 6
GENDER
Male
Prefer not to answer
Northeast
Female
South
West
Midwest
49.3%49.6%
44.5%
19.7%
15.4%
20.4%
Uninterested 18-34
Potential Consumers 35-44
Current Consumers 45-54
Past Consumers 55+
17.4% 28.8%
36.9% 16.2%
30.5% 17.9%
15.2% 37.1%
0% 0%10% 10%20% 20%30% 30%40% 40%
CBD CONSUMER STATUS AGE
REGION
1.1%
28.8% in the 18 to 34 range, 16.2% in the 35 to 44 range, 17.9% in the 45 to 54 range, and 37.1% in the 55 and older range.
Respondents were roughly split by gender as well, with 49.3% male respondents, 49.6% female respondents, and 1.1% opting not to specify.
Respondents were also categorized by their consumer status relative to CBD. Our study included 184 (17.4%) uninterested consumers, 322 (30.5%) current consumers, 160 (15.2%) past consumers, and 389 (36.9%) potential consumers.
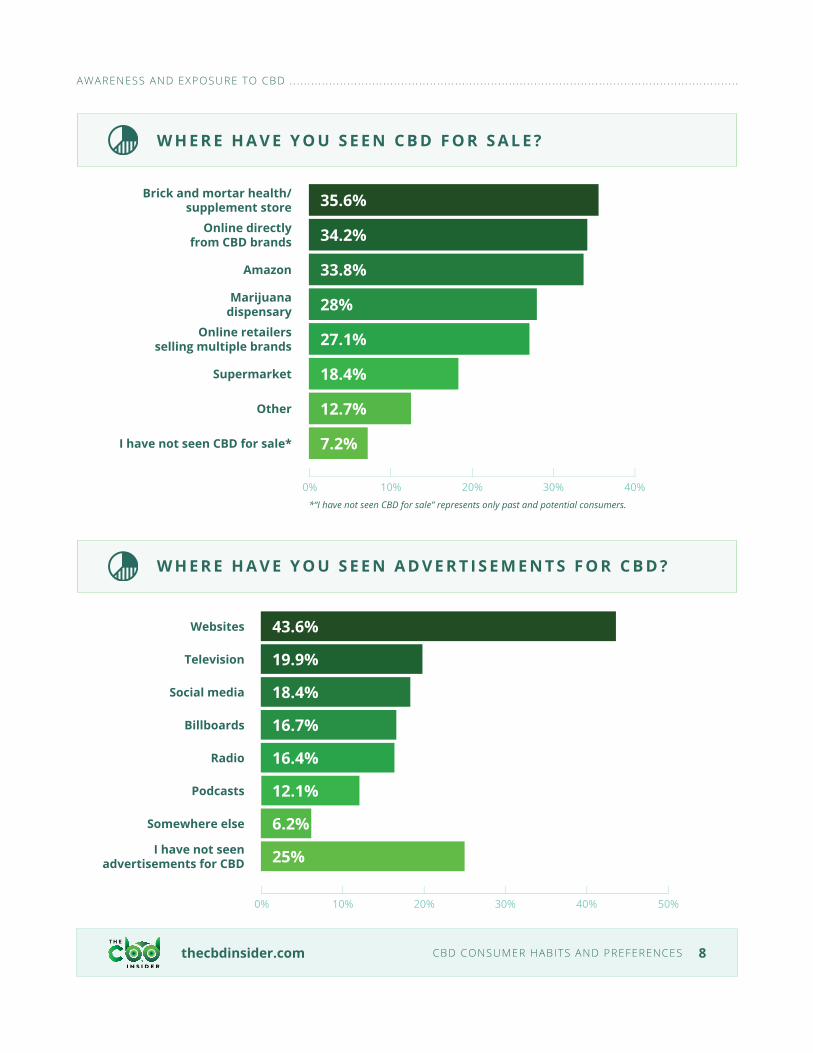
AWARENESS AND EXPOSURE TO CBDConsumers most often see CBD for sale at brick
and mortar health stores (35.6%), followed by
the websites of CBD brands (34.2%) and Amazon
(33.8%).
When it comes to advertisements featuring CBD,
more than two in five consumers (43.6%) see ads
on websites while one in four consumers (25%)
have not come across ads for CBD at all.
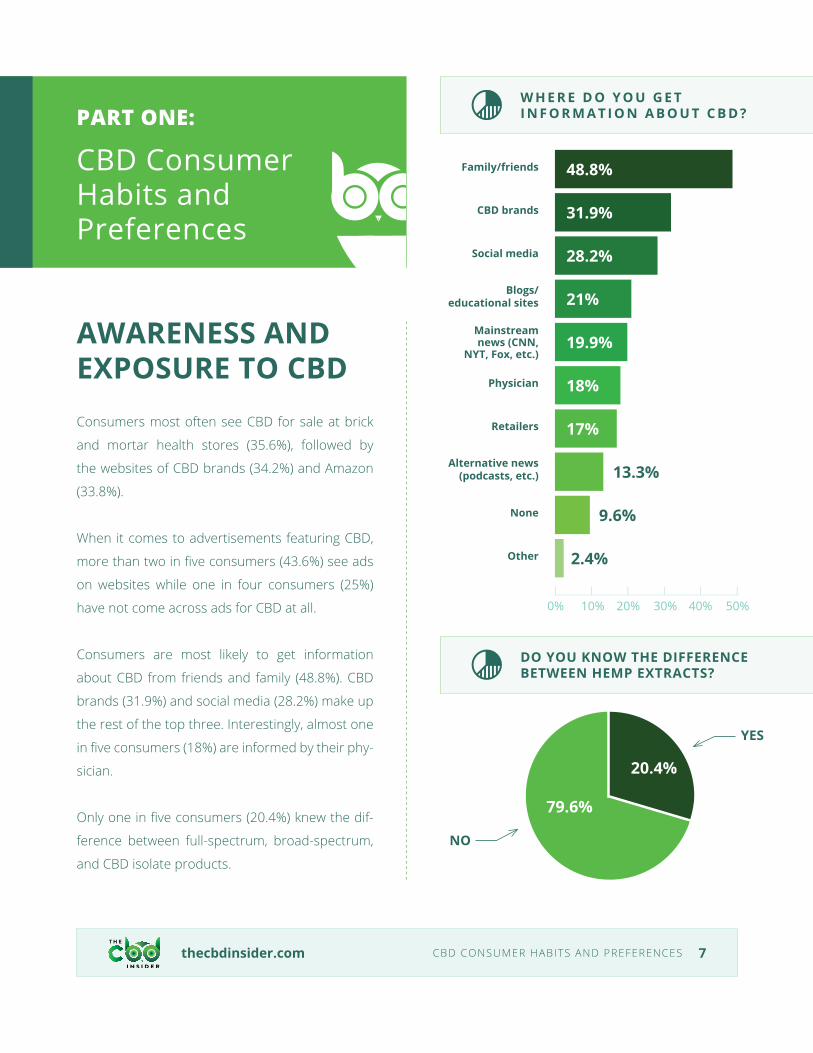
Consumers are most likely to get information
about CBD from friends and family (48.8%). CBD
brands (31.9%) and social media (28.2%) make up
the rest of the top three. Interestingly, almost one
in five consumers (18%) are informed by their phy-
sician.
Only one in five consumers (20.4%) knew the dif-
ference between full-spectrum, broad-spectrum,
and CBD isolate products.
thecbdinsider.com CBD CONSUMER HABITS AND PREFERENCES 7
PART ONE:
CBD Consumer Habits and Preferences
W H E R E D O Y O U G E T I N F O R M A T I O N A B O U T C B D ?
Family/friends
CBD brands
Mainstream news (CNN,
NYT, Fox, etc.)
Alternative news(podcasts, etc.)
Social media
Physician
None
Blogs/educational sites
Retailers
Other
48.8%
31.9%
19.9%
13.3%
28.2%
18%
9.6%
21%
17%
2.4%
0% 10% 20% 30% 40% 50%
DO YOU KNOW THE DIFFERENCE BETWEEN HEMP EXTRACTS?
NO
YES
20.4%
79.6%
thecbdinsider.com CBD CONSUMER HABITS AND PREFERENCES 8
W H E R E H A V E Y O U S E E N C B D F O R S A L E ?
Brick and mortar health/supplement store
Online directly from CBD brands
Online retailers selling multiple brands
I have not seen CBD for sale*
Amazon
Supermarket
Marijuana dispensary
Other
35.6%
34.2%
27.1%
7.2%
33.8%
18.4%
28%
12.7%
0% 10% 20% 30% 40%*“I have not seen CBD for sale” represents only past and potential consumers.
W H E R E H A V E Y O U S E E N A D V E R T I S E M E N T S F O R C B D ?
Websites
Television
Radio
I have not seen advertisements for CBD
Social media
Podcasts
Billboards
Somewhere else
43.6%
19.9%
16.4%
25%
18.4%
12.1%
16.7%
6.2%
0% 10% 20% 30% 40% 50%
AWARENESS AND EXPOSURE TO CBD . . . . . . . . . . . . . . . . . . . . . . . . . . . . . . . . . . . . . . . . . . . . . . . . . . . . . . . . . . . . . . . . . . . . . . . . . . . . . . . . . . . . . . . . . . . . . . . . . . . . . . . . . . . . . . . . . . . . . . . . . . . . .

SENTIMENT TOWARD CBDDespite regulatory loose ends left untied by the FDA, it is now fairly easy to purchase CBD in most parts of the United States, both online and in person. As a result, 41.3% of survey respondents were “somewhat satisfied” or “very satisfied” with the current regulatory state of CBD, and only 14.6% were “somewhat dissatisfied” or “not at all satisfied” with the current regulatory environment. Many Americans have yet to take a stance on the regulatory state of CBD with 44.1% of respondents “unsure” of the current regulatory state or having no strong opinion on the issue.
Interestingly, younger consumers are more likely to be satisfied with the current state of CBD regu-lations than older consumers. For example, more than half of consumers 18-34 years old (55%) were satisfied to some extent compared to just a quar-ter of consumers 55 and older (25.7%). Younger consumers are likely more satisfied because they
are more comfortable purchasing online and at marijuana dispensaries with relatively few restric-tions. As a result, the data tells us we need to like-wise protect the interests of older consumers.
Survey respondents also made it clear that they want the FDA involved in the regulatory process. An overwhelming 73.9% of respondents want either FDA regulation or a combination of FDA and industry self-regulation, while only 19.8% said they prefer industry self-regulation without the FDA. Brands and consumers alike are waiting on the FDA to fulfill its responsibility to provide clear and reasonable regulations on the CBD industry.
At the same time, most consumers (57.1%) believe that there should be no restrictions on advertising for CBD. About one in five (22.3%) said that CBD should not be allowed to be advertised.
Among consumers who are not currently using CBD, almost three in five (58.8%) believe CBD is definitely effective for some people and another
three in ten (29.9%) think it might be effective.
thecbdinsider.com CBD CONSUMER HABITS AND PREFERENCES 9
S A T I S F A C T I O N W I T H T H E R E G U L A T O R Y S T A T E O F C B D
Not at all satisfied
Somewhat dissatisfied
Very satisfied
Neither satisfied nor dissatisfied
I am unsure what the current regulatory state of the
CBD industry is
Somewhat satisfied
6.4%
8.2%
22.5%
20.4%
23.7%
18%
0% 10% 20% 30% 40% 50%

thecbdinsider.com CBD CONSUMER HABITS AND PREFERENCES
SENTIMENT TOWARD CBD . . . . . . . . . . . . . . . . . . . . . . . . . . . . . . . . . . . . . . . . . . . . . . . . . . . . . . . . . . . . . . . . . . . . . . . . . . . . . . . . . . . . . . . . . . . . . . . . . . . . . . . . . . . . . . . . . . . . . . . . . . . . . . . . . . . . . . . . . . . . . .
10
Yes, definitely
It might be
Definitely not
Not sure
I don’t think so
58.8%
29.9%
0.6%
9.7%
1.1%
I S C B D E F F E C T I V E F O R S O M E P E O P L E ?
Data represents past and potential consumers.
0% 10% 20% 30% 40% 50% 60%
SUPPORT FOR FDA REGULATIONS OR SELF-REGULATION
S H O U L D A D V E R T I S I N G B E A L L O W E D F O R C B D ?
I prefer FDA regulation
CBD should not be allowed to be advertised
I prefer industry self-regulation
There should be some limitations on where
CBD can be advertised
I prefer a combination of FDA and industry
self-regulation
CBD should be allowed to be advertised
anywhere
Something else
Something else
33.8%
22.3%
19.8%
15.3%
40.2%
57.1%
6.3%
5.4%
0%
0%
10%
10%
20%
20%
30%
30%
40%
40%
50%
50% 60%
CBD CONSUMERS
Behavior
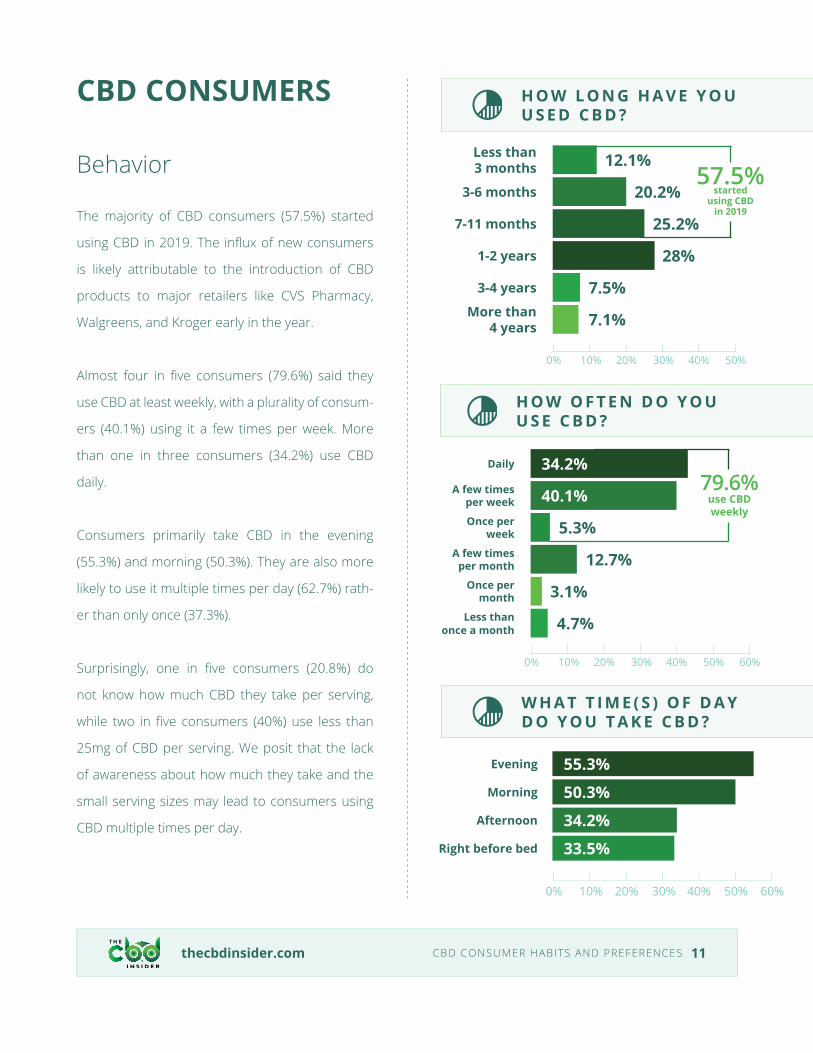
The majority of CBD consumers (57.5%) started
using CBD in 2019. The influx of new consumers
is likely attributable to the introduction of CBD
products to major retailers like CVS Pharmacy,
Walgreens, and Kroger early in the year.
Almost four in five consumers (79.6%) said they
use CBD at least weekly, with a plurality of consum-
ers (40.1%) using it a few times per week. More
than one in three consumers (34.2%) use CBD
daily.
Consumers primarily take CBD in the evening
(55.3%) and morning (50.3%). They are also more
likely to use it multiple times per day (62.7%) rath-
er than only once (37.3%).
Surprisingly, one in five consumers (20.8%) do
not know how much CBD they take per serving,
while two in five consumers (40%) use less than
25mg of CBD per serving. We posit that the lack
of awareness about how much they take and the
small serving sizes may lead to consumers using
CBD multiple times per day.
thecbdinsider.com CBD CONSUMER HABITS AND PREFERENCES 11
Less than 3 months
3-6 months
3-4 years
More than 4 years
7-11 months
1-2 years
12.1%
20.2%
7.5%
7.1%
25.2%
28%
0% 10% 20% 30% 40% 50%
H O W L O N G H A V E Y O U U S E D C B D ?
57.5% started
using CBDin 2019
Evening
Morning
Afternoon
Right before bed
55.3%
50.3%
34.2%
33.5%
0% 10% 20% 30% 40% 50% 60%
W H A T T I M E ( S ) O F D A Y D O Y O U T A K E C B D ?
Daily
A few times per week
Once per month
Less thanonce a month
Once per week
A few times per month
34.2%
40.1%
3.1%
4.7%
5.3%
12.7%
0% 10% 20% 30% 40% 50% 60%
H O W O F T E N D O Y O U U S E C B D ?
79.6% use CBD weekly
thecbdinsider.com CBD CONSUMER HABITS AND PREFERENCES 12
Less than 5mg
5-10mg
11-25mg
41-55mg
56-70mg
71-86mg
87-100mg
More than 100mg
Unknown/not sure
26-40mg
5.6%
18.6%
15.8%
9.6%
4.3%
1.9%
5%
6.2%
20.8%
12.1%
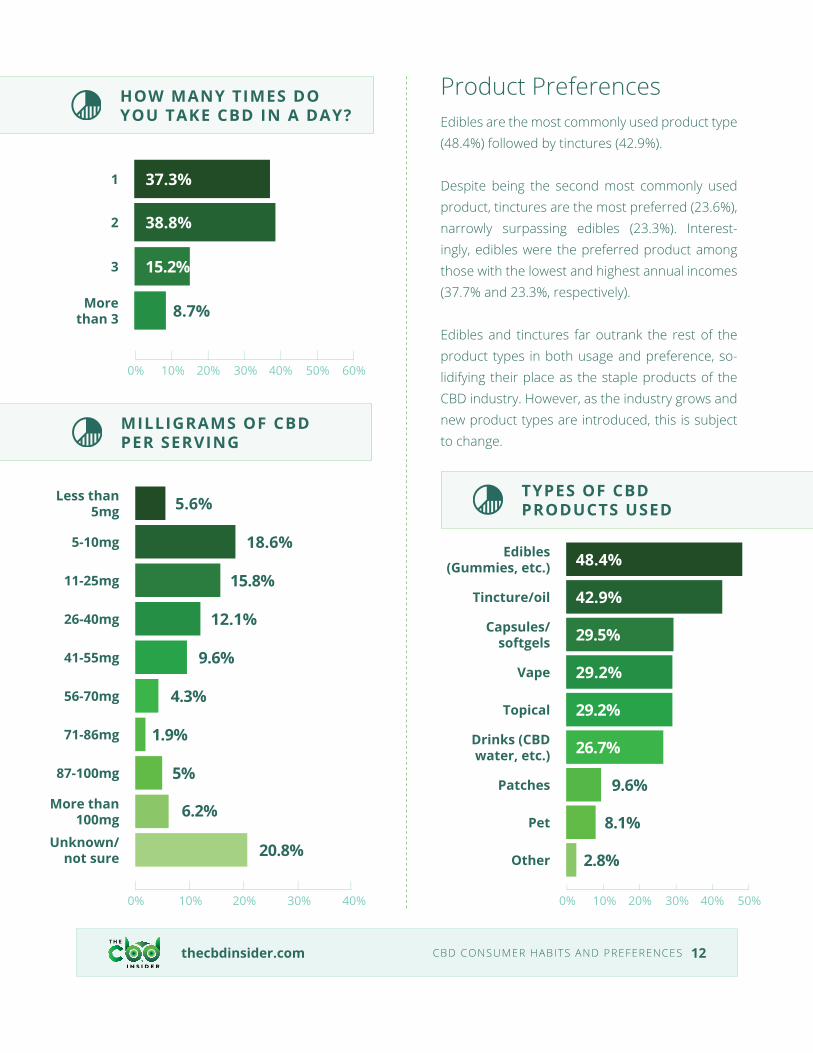
MILLIGRAMS OF CBD PER SERVING
0% 10% 20% 30% 40%
Product PreferencesEdibles are the most commonly used product type (48.4%) followed by tinctures (42.9%).
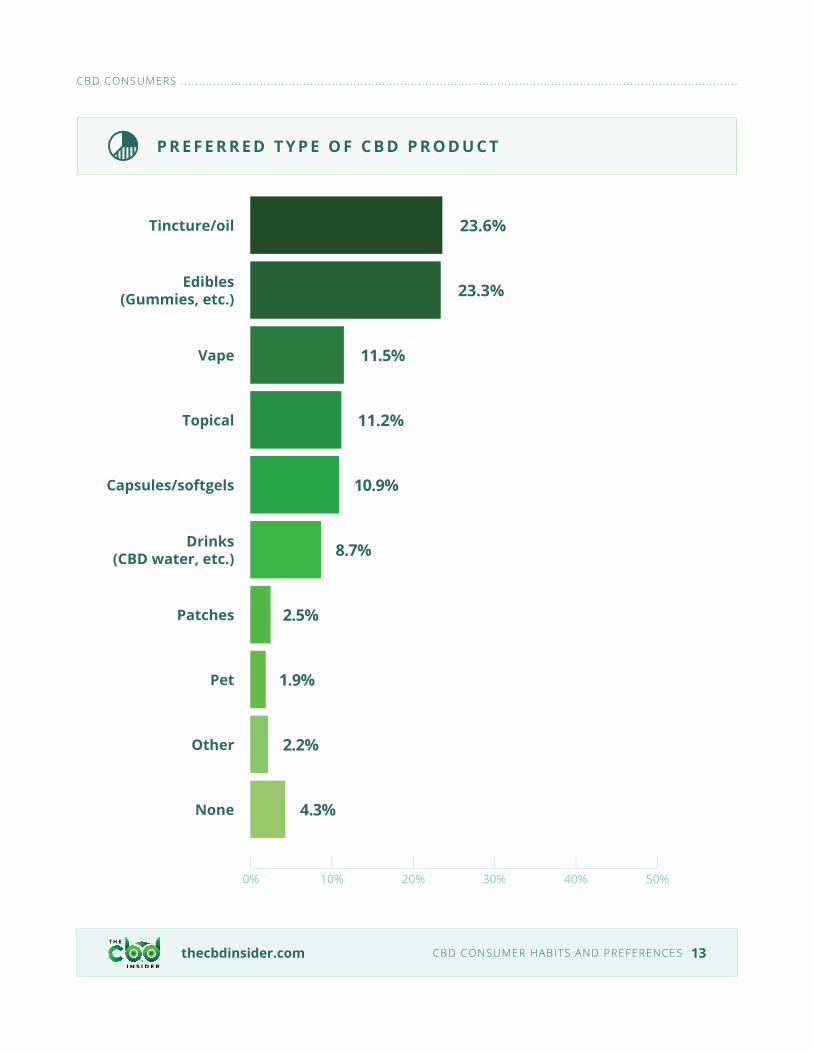
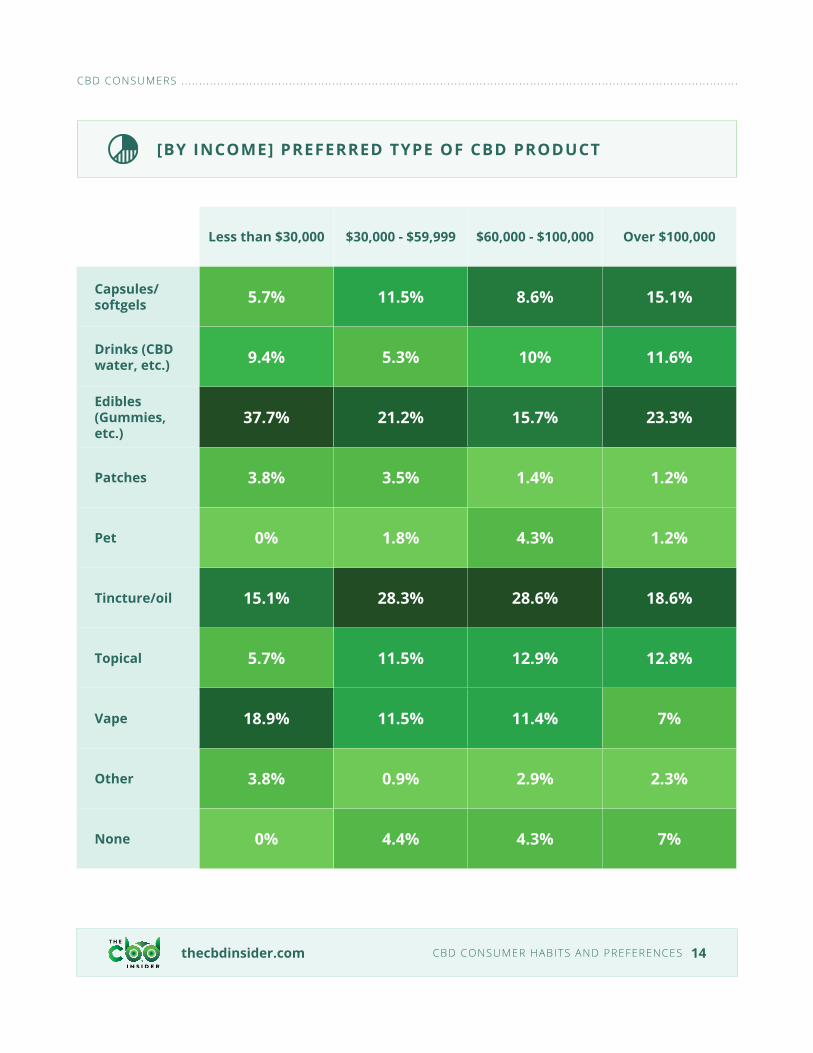
Despite being the second most commonly used product, tinctures are the most preferred (23.6%), narrowly surpassing edibles (23.3%). Interest-ingly, edibles were the preferred product among those with the lowest and highest annual incomes (37.7% and 23.3%, respectively).
Edibles and tinctures far outrank the rest of the product types in both usage and preference, so-lidifying their place as the staple products of the CBD industry. However, as the industry grows and new product types are introduced, this is subject to change.
Edibles (Gummies, etc.)
Tincture/oil
Capsules/softgels
Topical
Drinks (CBD water, etc.)
Patches
Pet
Other
Vape
48.4%
42.9%
29.5%
29.2%
26.7%
9.6%
8.1%
2.8%
29.2%
0% 10% 20% 30% 40% 50%
TYPES OF CBD PRODUCTS USED
1
2
3
More than 3
37.3%
38.8%
15.2%
8.7%
0% 10% 20% 30% 40% 50% 60%
HOW MANY TIMES DO YOU TAKE CBD IN A DAY?
thecbdinsider.com CBD CONSUMER HABITS AND PREFERENCES 13
Edibles (Gummies, etc.)
Tincture/oil
Capsules/softgels
Topical
Drinks (CBD water, etc.)
Patches
Pet
Other
None
Vape
23.6%
23.3%
11.5%
10.9%
8.7%
2.5%
1.9%
2.2%
4.3%
11.2%
P R E F E R R E D T Y P E O F C B D P R O D U C T
0% 10% 20% 30% 40% 50%
CBD CONSUMERS . . . . . . . . . . . . . . . . . . . . . . . . . . . . . . . . . . . . . . . . . . . . . . . . . . . . . . . . . . . . . . . . . . . . . . . . . . . . . . . . . . . . . . . . . . . . . . . . . . . . . . . . . . . . . . . . . . . . . . . . . . . . . . . . . . . . . . . . . . . . . . . . . . . . . . . . . . .
thecbdinsider.com CBD CONSUMER HABITS AND PREFERENCES 14
[BY INCOME] PREFERRED TYPE OF CBD PRODUCT
Less than $30,000 $30,000 - $59,999 $60,000 - $100,000 Over $100,000
Capsules/softgels 5.7% 11.5% 8.6% 15.1%
Drinks (CBD water, etc.) 9.4% 5.3% 10% 11.6%
Edibles (Gummies, etc.)
37.7% 21.2% 15.7% 23.3%
Patches 3.8% 3.5% 1.4% 1.2%
Pet 0% 1.8% 4.3% 1.2%
Tincture/oil 15.1% 28.3% 28.6% 18.6%
Topical 5.7% 11.5% 12.9% 12.8%
Vape 18.9% 11.5% 11.4% 7%
Other 3.8% 0.9% 2.9% 2.3%
None 0% 4.4% 4.3% 7%
CBD CONSUMERS . . . . . . . . . . . . . . . . . . . . . . . . . . . . . . . . . . . . . . . . . . . . . . . . . . . . . . . . . . . . . . . . . . . . . . . . . . . . . . . . . . . . . . . . . . . . . . . . . . . . . . . . . . . . . . . . . . . . . . . . . . . . . . . . . . . . . . . . . . . . . . . . . . . . . . . . . . .

thecbdinsider.com CBD CONSUMER HABITS AND PREFERENCES 15
Reasons for Use and Perceived Effectiveness
The most commonly reported reason people use CBD is for aches and discomfort (58.1%), followed by relaxation (50%) and muscle soreness and recovery (41%).
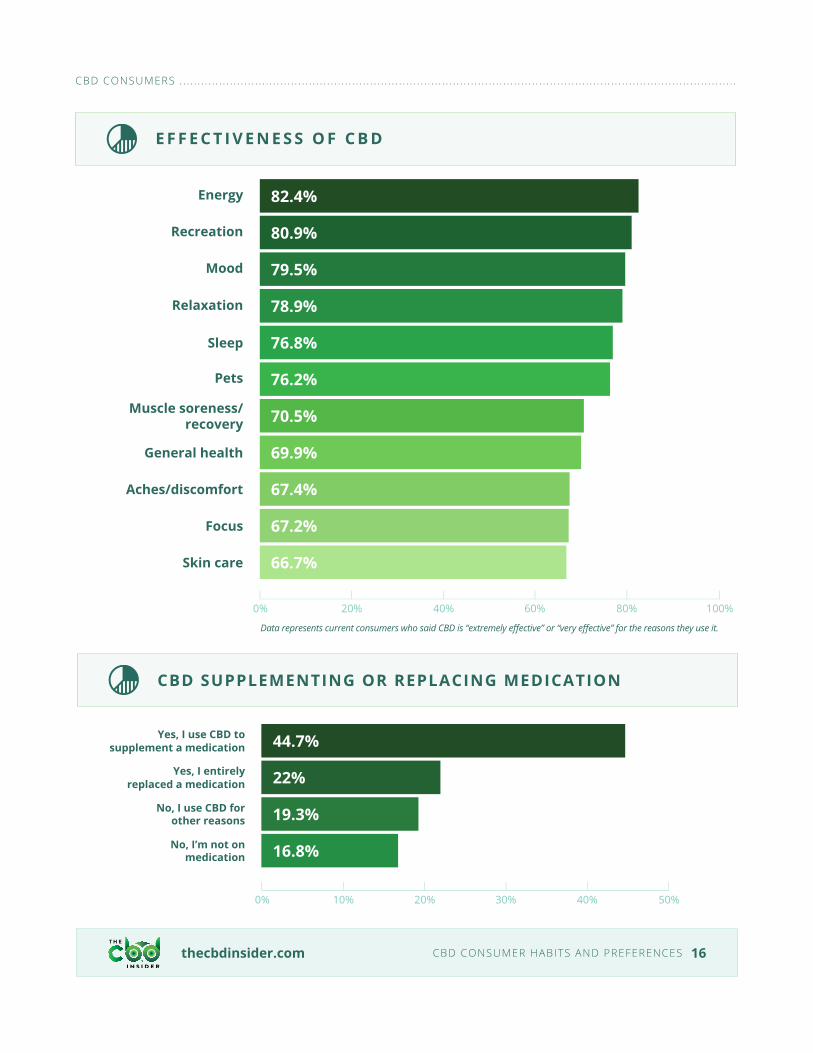
Surprisingly, the use with the highest perceived effectiveness rate was energy. More than four in five consumers (82.4%) using CBD for this purpose said it was “extremely effective” or “very effective.” Recreation (80.9%) and mood (79.5%) round out the top three.
The most popularly reported uses for CBD—aches and discomfort, relaxation, and muscle soreness and recovery—also had high perceived effective-ness rates.
More than two in three consumers (67.4%) said CBD was extremely or very effective for aches and discomfort, seven in ten (70.5%) said the same for muscle soreness and recovery, and nearly four in five (78.9%) said the same for relaxation.
CBD is also beginning to displace some medica-tions. More than one in five consumers (22%) said they replaced a medication with CBD, while more than two in five consumers (44.7%) said they sup-plement a medication with it.
As for the medications consumers replaced, 11.2% of consumers said they replaced an over-the-counter drug, 8.1% replaced a prescription opiate, 6.8% re-placed a prescription anxiolytic (anti-anxiety) drug, and 5.6% replaced a prescription sleep drug.
Among those who are supplementing their medication with CBD, 20.5% supplement their over-the-counter medication, 14.9% supplement their prescription anxiolytic (anti-anxiety) drug, 12.4% supplement their prescription opiate, and 9.6% supplement their prescription sleep drug.
In light of the opioid crisis in the US, researchers are looking for alternatives to opiates for pain relief. While more research is needed to verify if CBD is a viable alternative, a significant portion of certain groups of CBD consumers have replaced their prescription opiates.
For example, 12.3% of military and veteran CBD consumers said they replaced a prescription opiate compared to only 7% of non-military con-sumers. Also, 16.9% of disabled consumers re-placed prescription opiates compared to only 5.3% of non-disabled consumers.
Aches/DiscomfortRelaxation
Muscle soreness/recovery
Sleep
MoodGeneral
healthEnergy
Focus
Recreation
Skin care
Pets
Other
58.1%50%41%38.8%37.9%28.9%23%18.9%
14.6%11.2%
6.5%2.5%
0% 10% 20% 30% 40% 50% 60%
U S E S F O R C B D
thecbdinsider.com CBD CONSUMER HABITS AND PREFERENCES 16
E F F E C T I V E N E S S O F C B D
Energy
Recreation
Sleep
General health
Aches/discomfort
Focus
Skin care
Mood
Pets
Relaxation
Muscle soreness/recovery
82.4%
80.9%
76.8%
69.9%
67.4%
67.2%
66.7%
79.5%
76.2%
78.9%
70.5%
0% 20% 40% 60% 80% 100%
Data represents current consumers who said CBD is “extremely effective” or “very effective” for the reasons they use it.
CBD SUPPLEMENTING OR REPLACING MEDICATION
Yes, I entirely replaced a medication
No, I use CBD for other reasons
Yes, I use CBD to supplement a medication
No, I’m not on medication
22%
19.3%
44.7%
16.8%
0% 10% 20% 30% 40% 50%
CBD CONSUMERS . . . . . . . . . . . . . . . . . . . . . . . . . . . . . . . . . . . . . . . . . . . . . . . . . . . . . . . . . . . . . . . . . . . . . . . . . . . . . . . . . . . . . . . . . . . . . . . . . . . . . . . . . . . . . . . . . . . . . . . . . . . . . . . . . . . . . . . . . . . . . . . . . . . . . . . . . . .

thecbdinsider.com CBD CONSUMER HABITS AND PREFERENCES 17
Consumer Concerns About CBD
Nearly two-thirds (64.9%) of consumers say they have not developed a tolerance to CBD, defined as consumers requiring an increase in serving size on multiple occasions over time to achieve the same results. Among consumers who said they did de-velop a tolerance, more than half of them (54.8%) said it took less than three months.
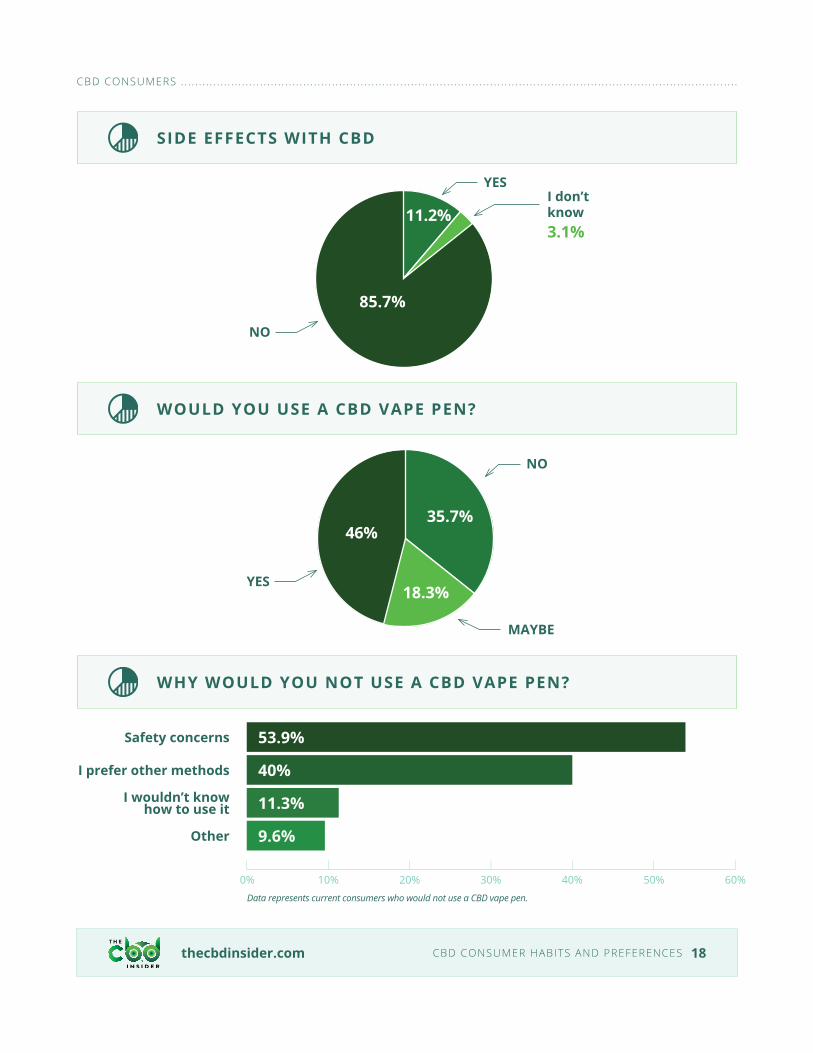
An overwhelming majority of consumers said they did not experience negative side effects (85.7%). Of those who did experience negative side effects, the most common were drowsiness (47.2%) and dry mouth (47.2%).
When asked if they would use a CBD vape pen, around one in three consumers (35.7%) said they would not. A majority of those consumers cited safety concerns (53.9%) as one reason they would not use a CBD vape pen.
MEDICATIONS REPLACED OR SUPPLEMENTED
Over-the-counter drug
Prescription anti-anxiety drug
Prescription opiate
Prescription sleep drug
Supplement 20.5% 14.9% 12.4% 9.6%
Replace 11.2% 6.8% 8.1% 5.6%
Data represents percentage of total current consumers who have replaced or are supplementing these medications.
HAVE YOU DEVELOPED A TOLERANCE TO CBD?
NO
YES
35.1%
64.9%
Less than a month
1-3 months
4-6 months
7-12 months
More than a year
15%
39.8%
23%
9.7%
12.4%
0% 10% 20% 30% 40% 50% 60%
HOW LONG DID IT TAKE TO DEVELOP A TOLERANCE?
thecbdinsider.com CBD CONSUMER HABITS AND PREFERENCES
NO
YESI don’t know3.1%
85.7%
11.2%
YES
NO
MAYBE
35.7%46%
18.3%
Safety concerns
I prefer other methods
I wouldn’t know how to use it
Other
53.9%
40%
11.3%
9.6%
18
Data represents current consumers who would not use a CBD vape pen.
SIDE EFFECTS WITH CBD
WHY WOULD YOU NOT USE A CBD VAPE PEN?
WOULD YOU USE A CBD VAPE PEN?
CBD CONSUMERS . . . . . . . . . . . . . . . . . . . . . . . . . . . . . . . . . . . . . . . . . . . . . . . . . . . . . . . . . . . . . . . . . . . . . . . . . . . . . . . . . . . . . . . . . . . . . . . . . . . . . . . . . . . . . . . . . . . . . . . . . . . . . . . . . . . . . . . . . . . . . . . . . . . . . . . . . . .
0% 10% 20% 30% 40% 50% 60%
PURCHASING TRENDS OF CBD CONSUMERS
CBD Brands
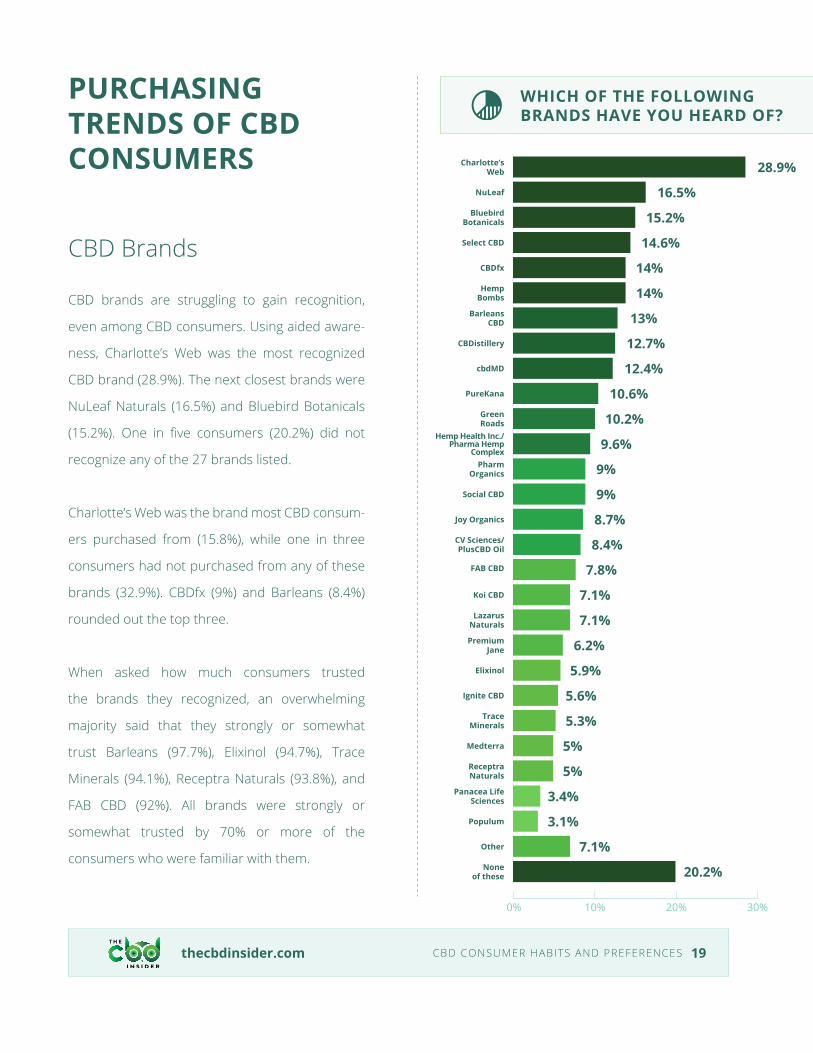
CBD brands are struggling to gain recognition,
even among CBD consumers. Using aided aware-
ness, Charlotte’s Web was the most recognized
CBD brand (28.9%). The next closest brands were
NuLeaf Naturals (16.5%) and Bluebird Botanicals
(15.2%). One in five consumers (20.2%) did not
recognize any of the 27 brands listed.
Charlotte’s Web was the brand most CBD consum-
ers purchased from (15.8%), while one in three
consumers had not purchased from any of these
brands (32.9%). CBDfx (9%) and Barleans (8.4%)
rounded out the top three.
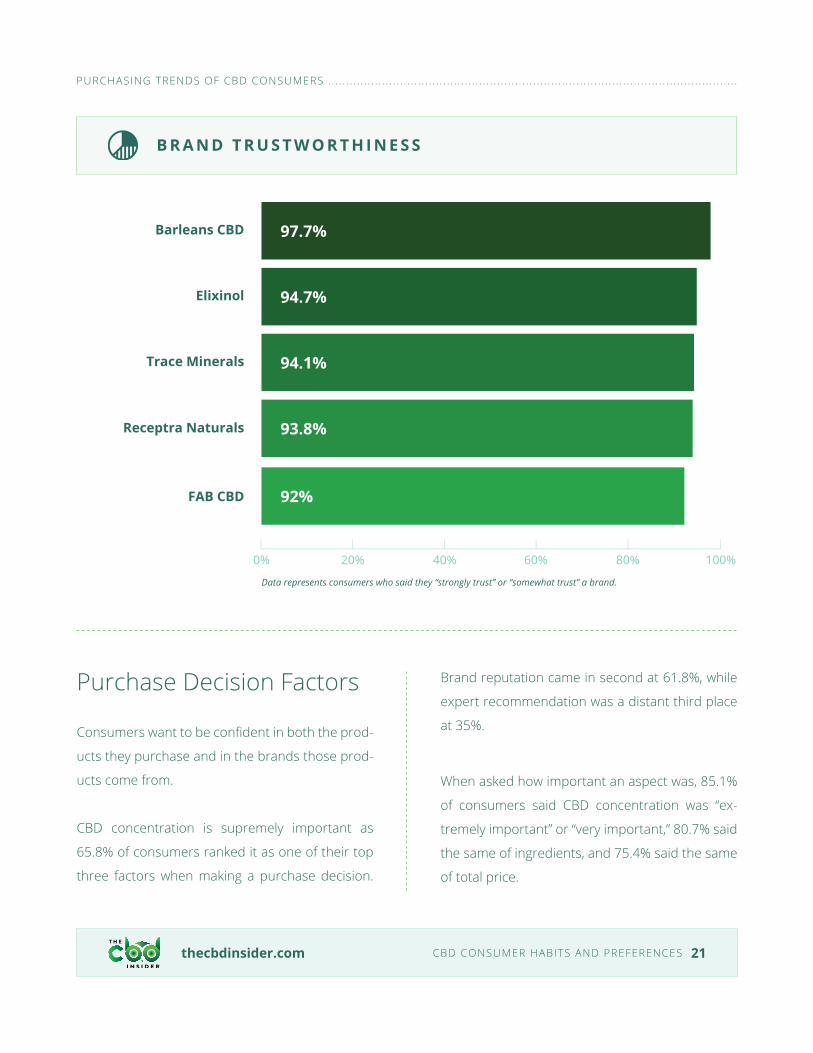
When asked how much consumers trusted
the brands they recognized, an overwhelming
majority said that they strongly or somewhat
trust Barleans (97.7%), Elixinol (94.7%), Trace
Minerals (94.1%), Receptra Naturals (93.8%), and
FAB CBD (92%). All brands were strongly or
somewhat trusted by 70% or more of the
consumers who were familiar with them.
thecbdinsider.com CBD CONSUMER HABITS AND PREFERENCES 19
WHICH OF THE FOLLOWING BRANDS HAVE YOU HEARD OF?
Charlotte’s Web
cbdMD
FAB CBD
NuLeaf
PureKana
Koi CBD
CBDfx
Pharm Organics
Elixinol
Panacea Life Sciences
CBDistillery
CV Sciences/PlusCBD Oil
Medterra
None of these
Bluebird Botanicals
Green Roads
Lazarus Naturals
Hemp Bombs
Social CBD
Ignite CBD
Populum
Select CBD
Hemp Health Inc./Pharma Hemp
Complex
Premium Jane
Receptra Naturals
Barleans CBD
Joy Organics
Trace Minerals
Other
28.9%
12.4%
7.8%
16.5%
10.6%
7.1%
14%
9%
5.9%
3.4%
12.7%
8.4%
5%
20.2%
15.2%
10.2%
7.1%
14%
9%
5.6%
3.1%
14.6%
9.6%
6.2%
5%
13%
8.7%
5.3%
7.1%
0% 10% 20% 30%

thecbdinsider.com CBD CONSUMER HABITS AND PREFERENCES 20
W H I C H B R A N D S H A V E Y O U P U R C H A S E D F R O M ?
Charlotte’s Web
CBDistillery
Hemp Health Inc./Pharma Hemp Complex
CBDfx
Other
Premium Jane
Select CBD
PureKana
Ignite CBD
Populum
Green Roads
CV Sciences/PlusCBD Oil
Receptra Naturals
None of these
Barleans CBD
cbdMD
Pharm Organics
NuLeaf
FAB CBD
Koi CBD
Panacea Life Sciences
Bluebird Botanicals
Joy Organics
Elixinol
Medterra
Hemp Bombs
Social CBD
Lazarus Naturals
Trace Minerals
15.8%
6.5%
3.7%
9%
6.5%
3.7%
8.1%
5%
3.1%
1.6%
6.8%
3.7%
2.8%
32.9%
8.4%
6.2%
3.4%
7.8%
4.7%
3.1%
1.2%
8.1%
5.6%
3.1%
2.2%
7.1%
4%
3.1%
1.2%
0% 10% 20% 30% 40%
PURCHASING TRENDS OF CBD CONSUMERS . . . . . . . . . . . . . . . . . . . . . . . . . . . . . . . . . . . . . . . . . . . . . . . . . . . . . . . . . . . . . . . . . . . . . . . . . . . . . . . . . . . . . . . . . . . . . . . . . . . . . . . . . . . . . . . . . .
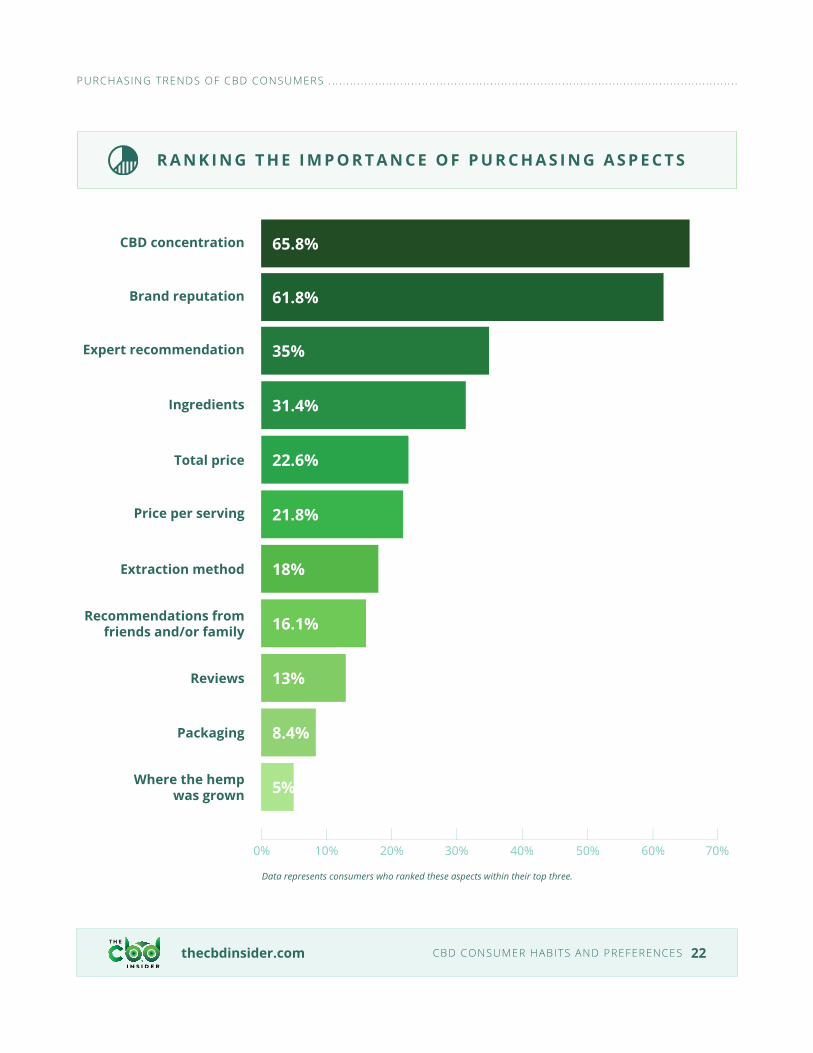
Purchase Decision Factors
Consumers want to be confident in both the prod-
ucts they purchase and in the brands those prod-
ucts come from.
CBD concentration is supremely important as
65.8% of consumers ranked it as one of their top
three factors when making a purchase decision.
Brand reputation came in second at 61.8%, while
expert recommendation was a distant third place
at 35%.
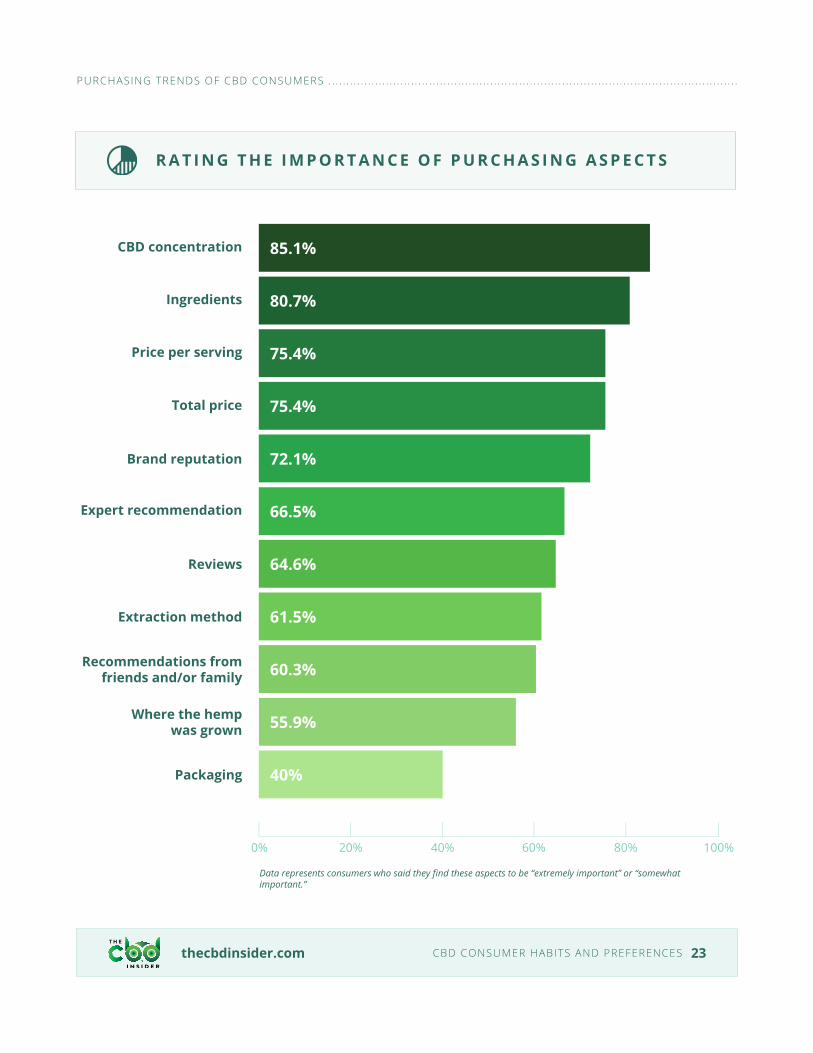
When asked how important an aspect was, 85.1%
of consumers said CBD concentration was “ex-
tremely important” or “very important,” 80.7% said
the same of ingredients, and 75.4% said the same
of total price.
thecbdinsider.com CBD CONSUMER HABITS AND PREFERENCES 21
B R A N D T R U S T W O R T H I N E S S
Barleans CBD
Elixinol
FAB CBD
Trace Minerals
Receptra Naturals
97.7%
94.7%
92%
94.1%
93.8%
0% 20% 40% 60% 80% 100%
Data represents consumers who said they “strongly trust” or “somewhat trust” a brand.
PURCHASING TRENDS OF CBD CONSUMERS . . . . . . . . . . . . . . . . . . . . . . . . . . . . . . . . . . . . . . . . . . . . . . . . . . . . . . . . . . . . . . . . . . . . . . . . . . . . . . . . . . . . . . . . . . . . . . . . . . . . . . . . . . . . . . . . . .
thecbdinsider.com CBD CONSUMER HABITS AND PREFERENCES 22
R A N K I N G T H E I M P O R T A N C E O F P U R C H A S I N G A S P E C T S
CBD concentration
Brand reputation
Total price
Recommendations from friends and/or family
Reviews
Packaging
Where the hemp was grown
Expert recommendation
Price per serving
Ingredients
Extraction method
65.8%
61.8%
22.6%
16.1%
13%
8.4%
5%
35%
21.8%
31.4%
18%
0% 10% 20% 30% 40% 50% 60% 70%
Data represents consumers who ranked these aspects within their top three.
PURCHASING TRENDS OF CBD CONSUMERS . . . . . . . . . . . . . . . . . . . . . . . . . . . . . . . . . . . . . . . . . . . . . . . . . . . . . . . . . . . . . . . . . . . . . . . . . . . . . . . . . . . . . . . . . . . . . . . . . . . . . . . . . . . . . . . . . .
thecbdinsider.com CBD CONSUMER HABITS AND PREFERENCES 23
R A T I N G T H E I M P O R T A N C E O F P U R C H A S I N G A S P E C T S
CBD concentration
Ingredients
Brand reputation
Extraction method
Recommendations from friends and/or family
Where the hemp was grown
Packaging
Price per serving
Expert recommendation
Total price
Reviews
85.1%
80.7%
72.1%
61.5%
60.3%
55.9%
40%
75.4%
66.5%
75.4%
64.6%
0% 20% 40% 60% 80% 100%
Data represents consumers who said they find these aspects to be “extremely important” or “somewhat important.”
PURCHASING TRENDS OF CBD CONSUMERS . . . . . . . . . . . . . . . . . . . . . . . . . . . . . . . . . . . . . . . . . . . . . . . . . . . . . . . . . . . . . . . . . . . . . . . . . . . . . . . . . . . . . . . . . . . . . . . . . . . . . . . . . . . . . . . . . .
thecbdinsider.com CBD CONSUMER HABITS AND PREFERENCES 24
WHERE CBD PRODUCTS ARE PURCHASED
Marijuana dispensary
AmazonOnline directly from CBD brands
Brick and mortar health/supplement
store
Online retailers selling multiple
brands
Supermarket Other
35.7% 33.9% 26.7% 25.5% 17.7% 13.4% 10.9%0%
10%
20%
30%
40%
50%
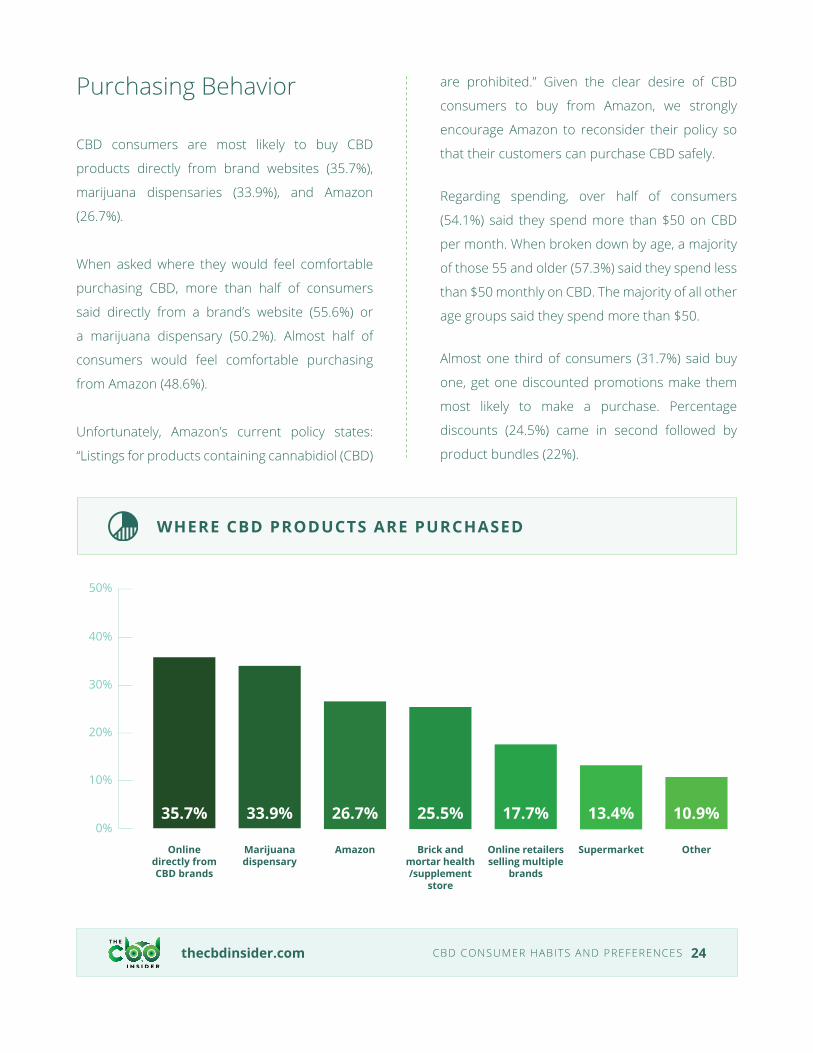
Purchasing Behavior
CBD consumers are most likely to buy CBD
products directly from brand websites (35.7%),
marijuana dispensaries (33.9%), and Amazon
(26.7%).
When asked where they would feel comfortable
purchasing CBD, more than half of consumers
said directly from a brand’s website (55.6%) or
a marijuana dispensary (50.2%). Almost half of
consumers would feel comfortable purchasing
from Amazon (48.6%).
Unfortunately, Amazon’s current policy states:
“Listings for products containing cannabidiol (CBD)
are prohibited.” Given the clear desire of CBD
consumers to buy from Amazon, we strongly
encourage Amazon to reconsider their policy so
that their customers can purchase CBD safely.
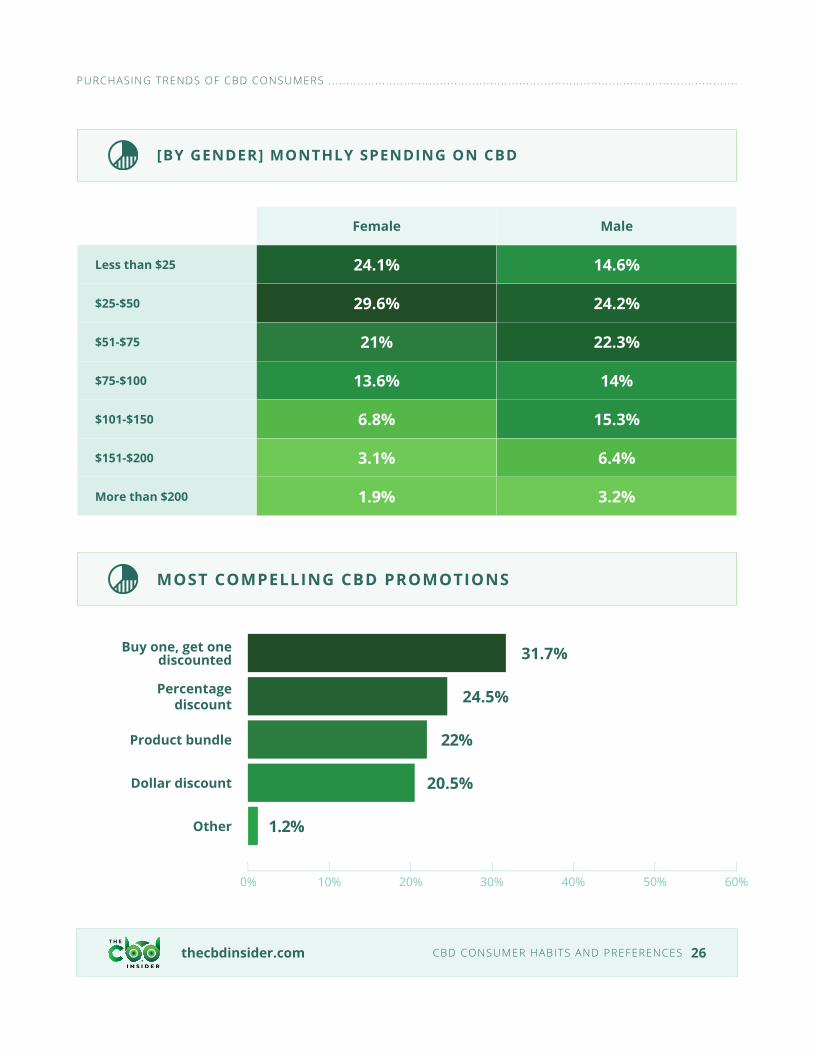
Regarding spending, over half of consumers
(54.1%) said they spend more than $50 on CBD
per month. When broken down by age, a majority
of those 55 and older (57.3%) said they spend less
than $50 monthly on CBD. The majority of all other
age groups said they spend more than $50.
Almost one third of consumers (31.7%) said buy
one, get one discounted promotions make them
most likely to make a purchase. Percentage
discounts (24.5%) came in second followed by
product bundles (22%).

thecbdinsider.com CBD CONSUMER HABITS AND PREFERENCES 25
WHERE CONSUMERS FEEL COMFORTABLE PURCHASING CBD
Marijuana dispensary
Amazon
Online directly from CBD brands
Brick and mortar health/supplement store
Online retailers selling multiple brands
Supermarket
Other
I wouldn’t feel comfortable purchasing
CBD from any of these
50.2%
48.6%
55.6%
44.8%
34.6%
33%
4.8%
1%
0%
0%
10%
10%
20%
20%
30%
30%
40%
40%
50%
50%
60%
60%
Less than $25
$25-$50
$51-$75
$101-$150
$151-$200
More than $200
$75-$100
19.3%
26.7%
21.4%
10.9%
5%
2.5%
14.3%
MONTHLY SPENDING ON CBD
PURCHASING TRENDS OF CBD CONSUMERS . . . . . . . . . . . . . . . . . . . . . . . . . . . . . . . . . . . . . . . . . . . . . . . . . . . . . . . . . . . . . . . . . . . . . . . . . . . . . . . . . . . . . . . . . . . . . . . . . . . . . . . . . . . . . . . . . .
Female Male
Less than $25 24.1% 14.6%
$25-$50 29.6% 24.2%
$51-$75 21% 22.3%
$75-$100 13.6% 14%
$101-$150 6.8% 15.3%
$151-$200 3.1% 6.4%
More than $200 1.9% 3.2%
thecbdinsider.com CBD CONSUMER HABITS AND PREFERENCES 26
PURCHASING TRENDS OF CBD CONSUMERS . . . . . . . . . . . . . . . . . . . . . . . . . . . . . . . . . . . . . . . . . . . . . . . . . . . . . . . . . . . . . . . . . . . . . . . . . . . . . . . . . . . . . . . . . . . . . . . . . . . . . . . . . . . . . . . . . .
[BY GENDER] MONTHLY SPENDING ON CBD
Buy one, get one discounted
Percentage discount
Product bundle
Other
Dollar discount
31.7%
24.5%
22%
1.2%
20.5%
MOST COMPELLING CBD PROMOTIONS
0% 10% 20% 30% 40% 50% 60%
thecbdinsider.com CBD CONSUMER HABITS AND PREFERENCES
PAST CONSUMERS
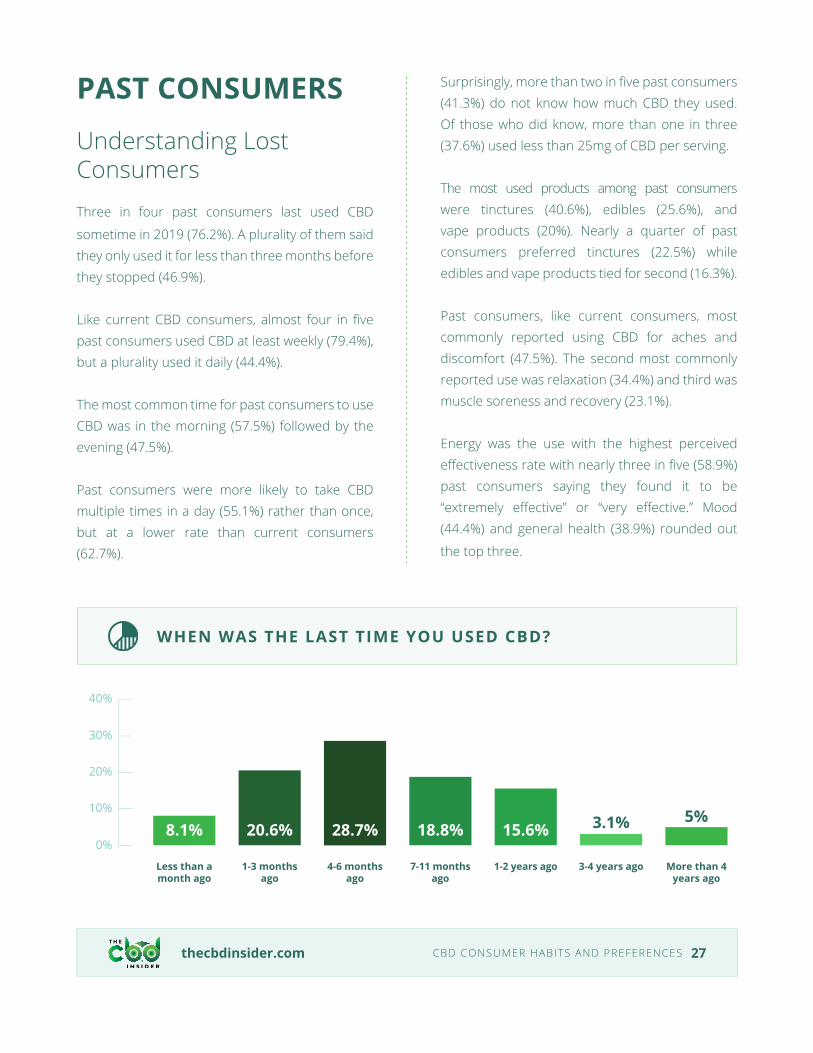
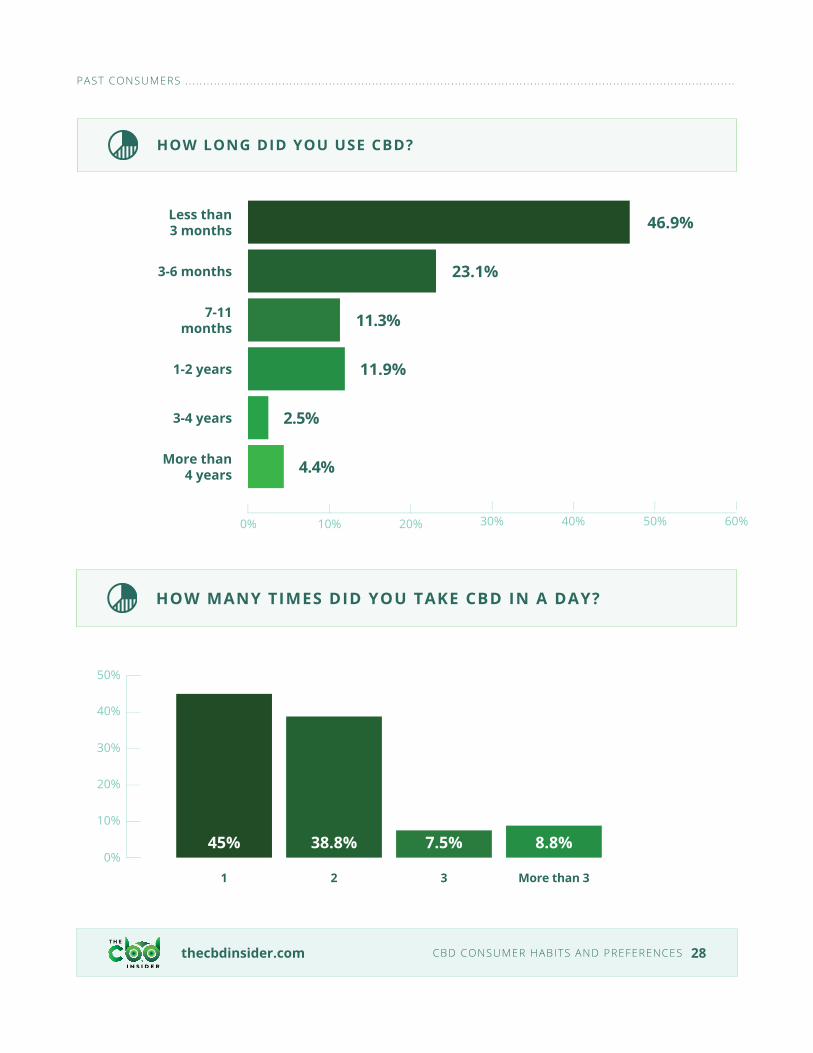
Understanding Lost ConsumersThree in four past consumers last used CBD
sometime in 2019 (76.2%). A plurality of them said they only used it for less than three months before they stopped (46.9%).
Like current CBD consumers, almost four in five past consumers used CBD at least weekly (79.4%), but a plurality used it daily (44.4%).
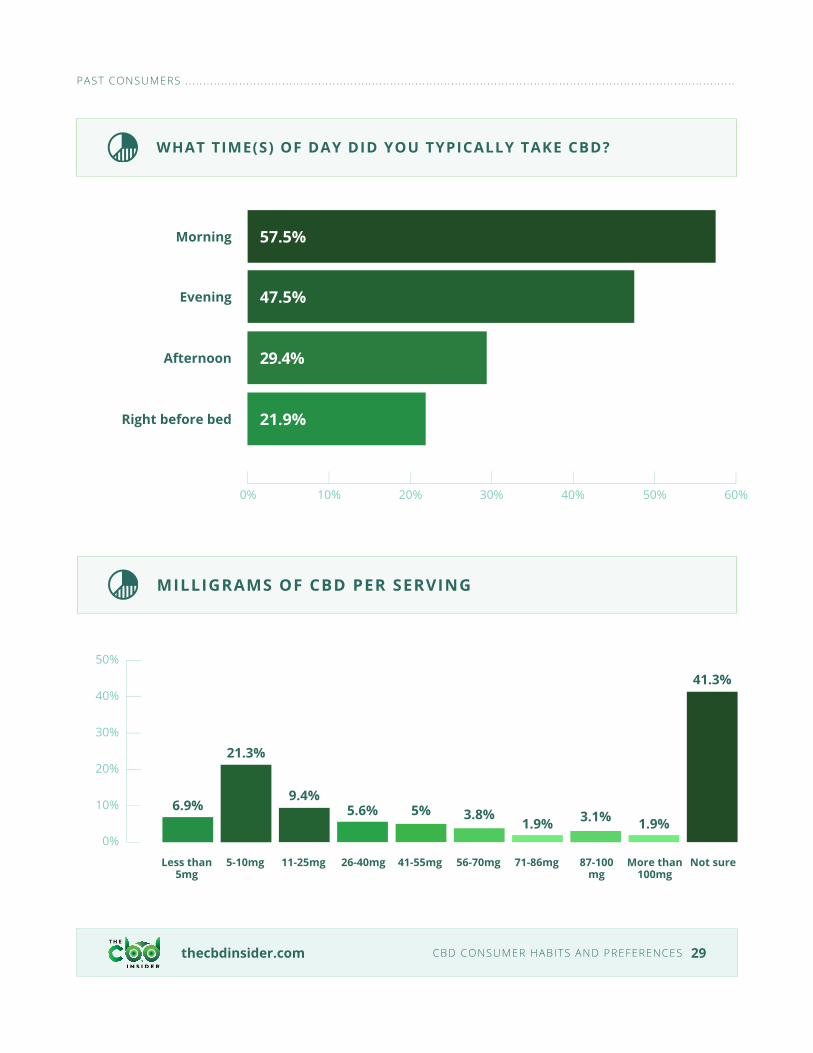
The most common time for past consumers to use CBD was in the morning (57.5%) followed by the evening (47.5%).
Past consumers were more likely to take CBD multiple times in a day (55.1%) rather than once, but at a lower rate than current consumers (62.7%).
Surprisingly, more than two in five past consumers (41.3%) do not know how much CBD they used. Of those who did know, more than one in three (37.6%) used less than 25mg of CBD per serving.
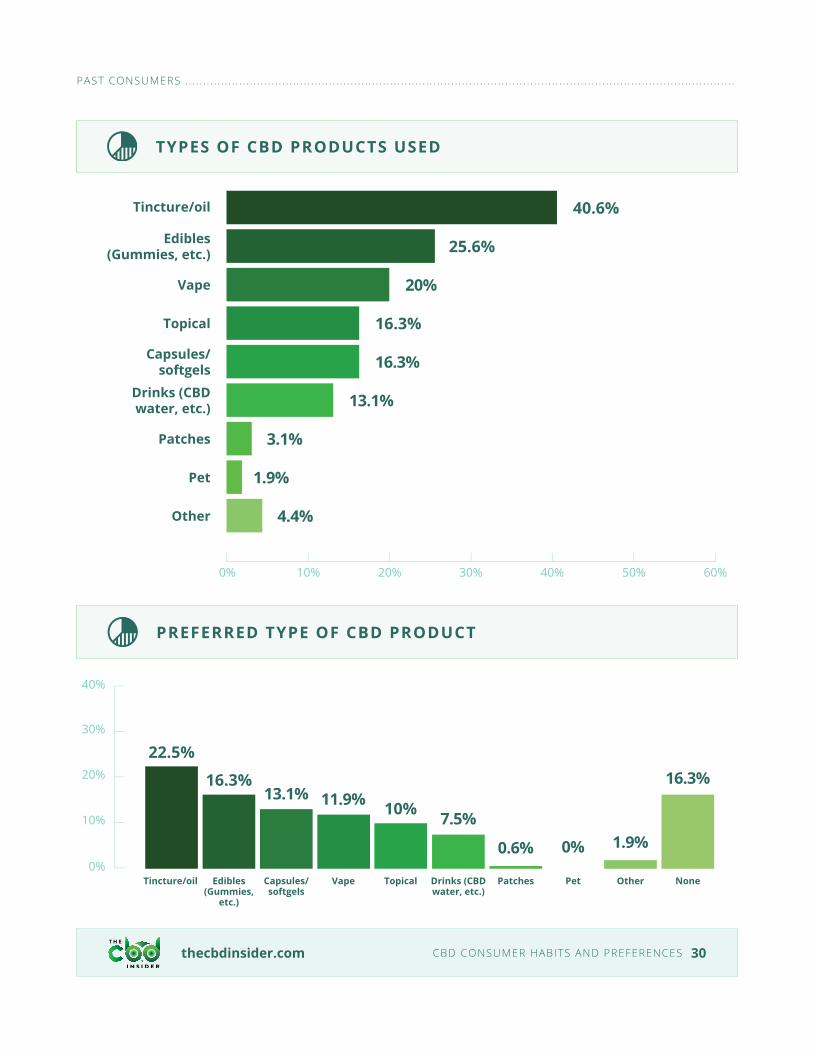
The most used products among past consumers were tinctures (40.6%), edibles (25.6%), and vape products (20%). Nearly a quarter of past consumers preferred tinctures (22.5%) while edibles and vape products tied for second (16.3%).
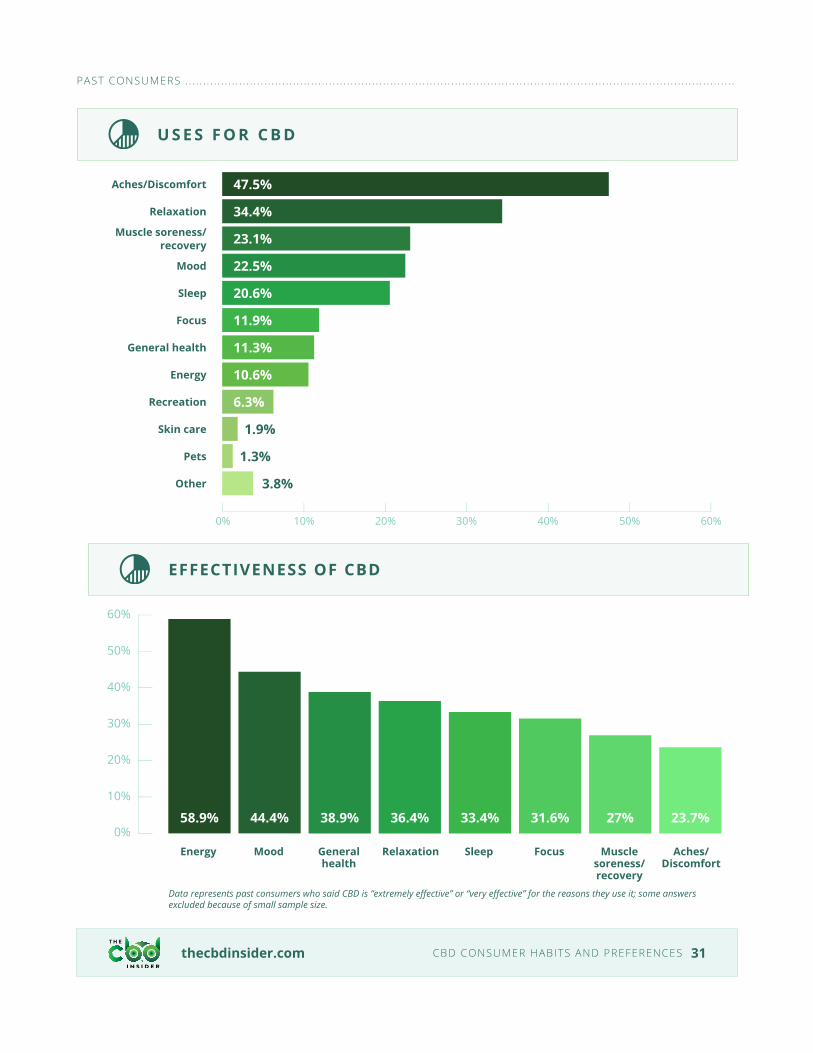
Past consumers, like current consumers, most commonly reported using CBD for aches and discomfort (47.5%). The second most commonly reported use was relaxation (34.4%) and third was muscle soreness and recovery (23.1%).
Energy was the use with the highest perceived effectiveness rate with nearly three in five (58.9%) past consumers saying they found it to be “extremely effective” or “very effective.” Mood (44.4%) and general health (38.9%) rounded out
the top three.
27
WHEN WAS THE LAST TIME YOU USED CBD?
1-3 months ago
4-6 months ago
Less than a month ago
7-11 months ago
1-2 years ago 3-4 years ago More than 4 years ago
8.1% 20.6% 28.7% 18.8% 15.6% 3.1% 5%0%
10%
20%
30%
40%
thecbdinsider.com CBD CONSUMER HABITS AND PREFERENCES 28
Less than 3 months
3-6 months
7-11 months
3-4 years
More than 4 years
1-2 years
46.9%
23.1%
11.3%
2.5%
4.4%
11.9%
HOW MANY TIMES DID YOU TAKE CBD IN A DAY?
2 31 More than 3
45% 38.8% 7.5% 8.8%0%
10%
20%
30%
40%
50%
PAST CONSUMERS . . . . . . . . . . . . . . . . . . . . . . . . . . . . . . . . . . . . . . . . . . . . . . . . . . . . . . . . . . . . . . . . . . . . . . . . . . . . . . . . . . . . . . . . . . . . . . . . . . . . . . . . . . . . . . . . . . . . . . . . . . . . . . . . . . . . . . . . . . . . . . . . . . . . . . . . .
HOW LONG DID YOU USE CBD?
0% 10% 20% 30% 40% 50% 60%
thecbdinsider.com CBD CONSUMER HABITS AND PREFERENCES 29
Less than 5mg
41-55mg5-10mg 56-70mg11-25mg 71-86mg26-40mg 87-100mg
More than 100mg
6.9% 5%
21.3%
3.8%9.4%
1.9%5.6% 3.1% 1.9%
0%
10%
20%
30%
40%
50%
MILLIGRAMS OF CBD PER SERVING
Not sure
41.3%
PAST CONSUMERS . . . . . . . . . . . . . . . . . . . . . . . . . . . . . . . . . . . . . . . . . . . . . . . . . . . . . . . . . . . . . . . . . . . . . . . . . . . . . . . . . . . . . . . . . . . . . . . . . . . . . . . . . . . . . . . . . . . . . . . . . . . . . . . . . . . . . . . . . . . . . . . . . . . . . . . . .
Morning
Evening
Afternoon
Right before bed
57.5%
47.5%
29.4%
21.9%
WHAT TIME(S) OF DAY DID YOU TYPICALLY TAKE CBD?
0% 10% 20% 30% 40% 50% 60%
Capsules/softgels
13.1%
thecbdinsider.com CBD CONSUMER HABITS AND PREFERENCES 30
Edibles (Gummies, etc.)
Tincture/oil
Capsules/softgels
Topical
Drinks (CBD water, etc.)
Patches
Pet
Other
Vape
40.6%
25.6%
20%
16.3%
13.1%
3.1%
1.9%
4.4%
16.3%
TYPES OF CBD PRODUCTS USED
Edibles (Gummies,
etc.)
Tincture/oil Topical Drinks (CBD water, etc.)
Patches Pet Other NoneVape
22.5%
16.3%11.9%
7.5%
0.6% 0% 1.9%
16.3%
10%
0%
10%
20%
30%
40%
PREFERRED TYPE OF CBD PRODUCT
0% 10% 20% 30% 40% 50% 60%
PAST CONSUMERS . . . . . . . . . . . . . . . . . . . . . . . . . . . . . . . . . . . . . . . . . . . . . . . . . . . . . . . . . . . . . . . . . . . . . . . . . . . . . . . . . . . . . . . . . . . . . . . . . . . . . . . . . . . . . . . . . . . . . . . . . . . . . . . . . . . . . . . . . . . . . . . . . . . . . . . . .
thecbdinsider.com CBD CONSUMER HABITS AND PREFERENCES 31
Aches/Discomfort
Relaxation
Muscle soreness/recovery
Sleep
Mood
General health
Energy
Focus
Recreation
Skin care
Pets
Other
47.5%
34.4%
23.1%
22.5%
20.6%
11.9%
11.3%
10.6%
6.3%
1.9%
1.3%
3.8%
U S E S F O R C B D
0% 10% 20% 30% 40% 50% 60%
Energy SleepMood FocusGeneral health
Muscle soreness/recovery
Relaxation Aches/Discomfort
58.9% 33.4%44.4% 31.6%38.9% 27%36.4% 23.7%0%
10%
20%
30%
40%
50%
60%
EFFECTIVENESS OF CBD
Data represents past consumers who said CBD is “extremely effective’’ or “very effective” for the reasons they use it; some answers excluded because of small sample size.
PAST CONSUMERS . . . . . . . . . . . . . . . . . . . . . . . . . . . . . . . . . . . . . . . . . . . . . . . . . . . . . . . . . . . . . . . . . . . . . . . . . . . . . . . . . . . . . . . . . . . . . . . . . . . . . . . . . . . . . . . . . . . . . . . . . . . . . . . . . . . . . . . . . . . . . . . . . . . . . . . . .
thecbdinsider.com CBD CONSUMER HABITS AND PREFERENCES
Concerns About CBD
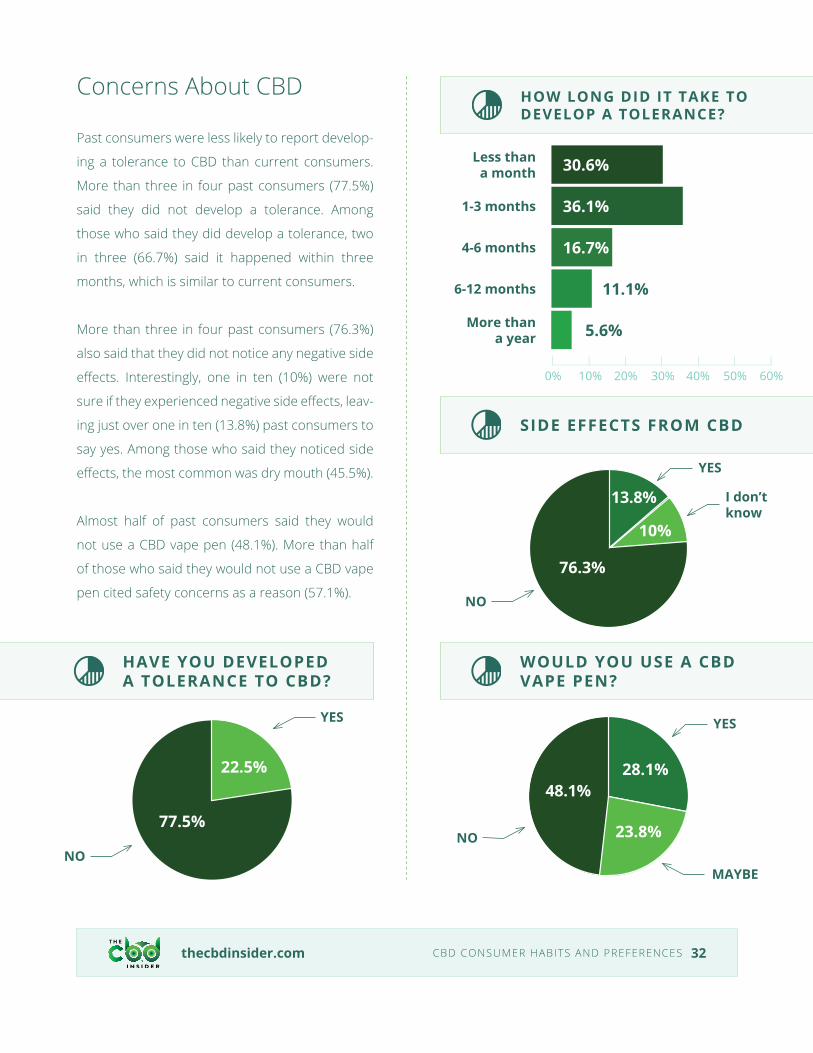
Past consumers were less likely to report develop-
ing a tolerance to CBD than current consumers.
More than three in four past consumers (77.5%)
said they did not develop a tolerance. Among
those who said they did develop a tolerance, two
in three (66.7%) said it happened within three
months, which is similar to current consumers.
More than three in four past consumers (76.3%)
also said that they did not notice any negative side
effects. Interestingly, one in ten (10%) were not
sure if they experienced negative side effects, leav-
ing just over one in ten (13.8%) past consumers to
say yes. Among those who said they noticed side
effects, the most common was dry mouth (45.5%).
Almost half of past consumers said they would
not use a CBD vape pen (48.1%). More than half
of those who said they would not use a CBD vape
pen cited safety concerns as a reason (57.1%).
32
HAVE YOU DEVELOPED A TOLERANCE TO CBD?
NO
YES
22.5%
77.5%
SIDE EFFECTS FROM CBD
NO
YES
I don’t know
10%
76.3%
13.8%
Less than a month
1-3 months
4-6 months
6-12 months
More than a year
30.6%
36.1%
16.7%
11.1%
5.6%
0% 10% 20% 30% 40% 50% 60%
HOW LONG DID IT TAKE TO DEVELOP A TOLERANCE?
WOULD YOU USE A CBD VAPE PEN?
NO
YES
MAYBE
28.1%48.1%
23.8%
Safety concerns
thecbdinsider.com CBD CONSUMER HABITS AND PREFERENCES
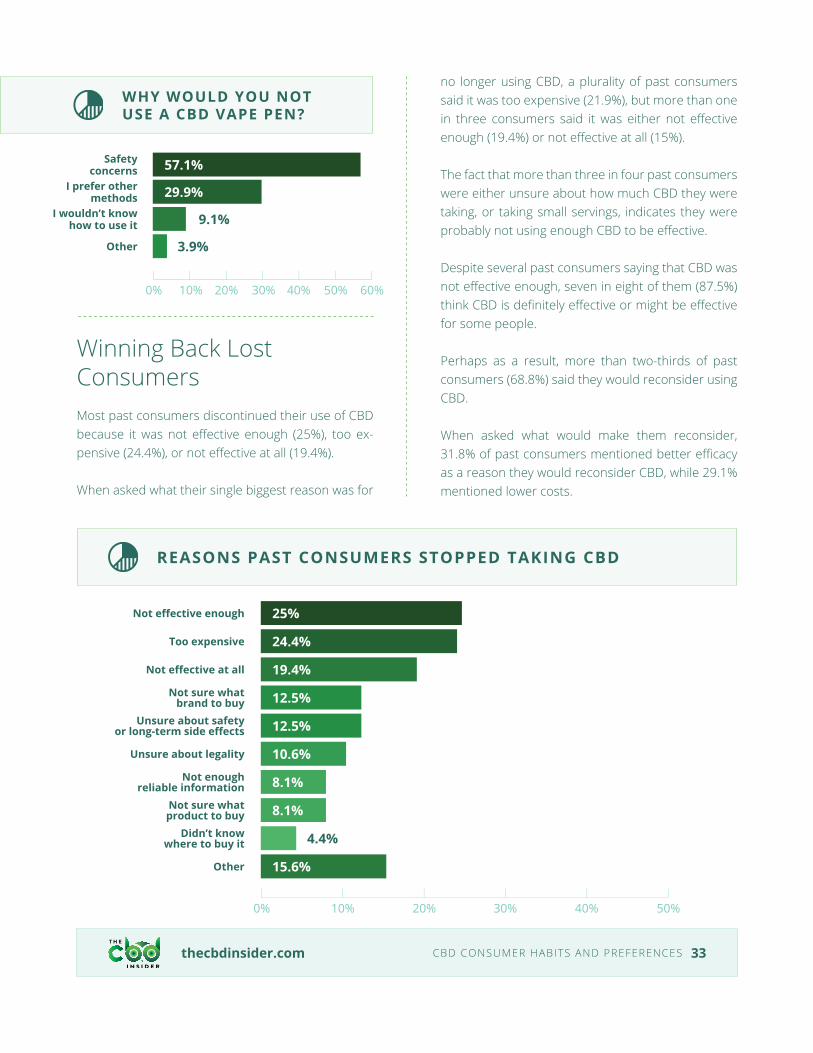
Winning Back Lost ConsumersMost past consumers discontinued their use of CBD because it was not effective enough (25%), too ex-pensive (24.4%), or not effective at all (19.4%).
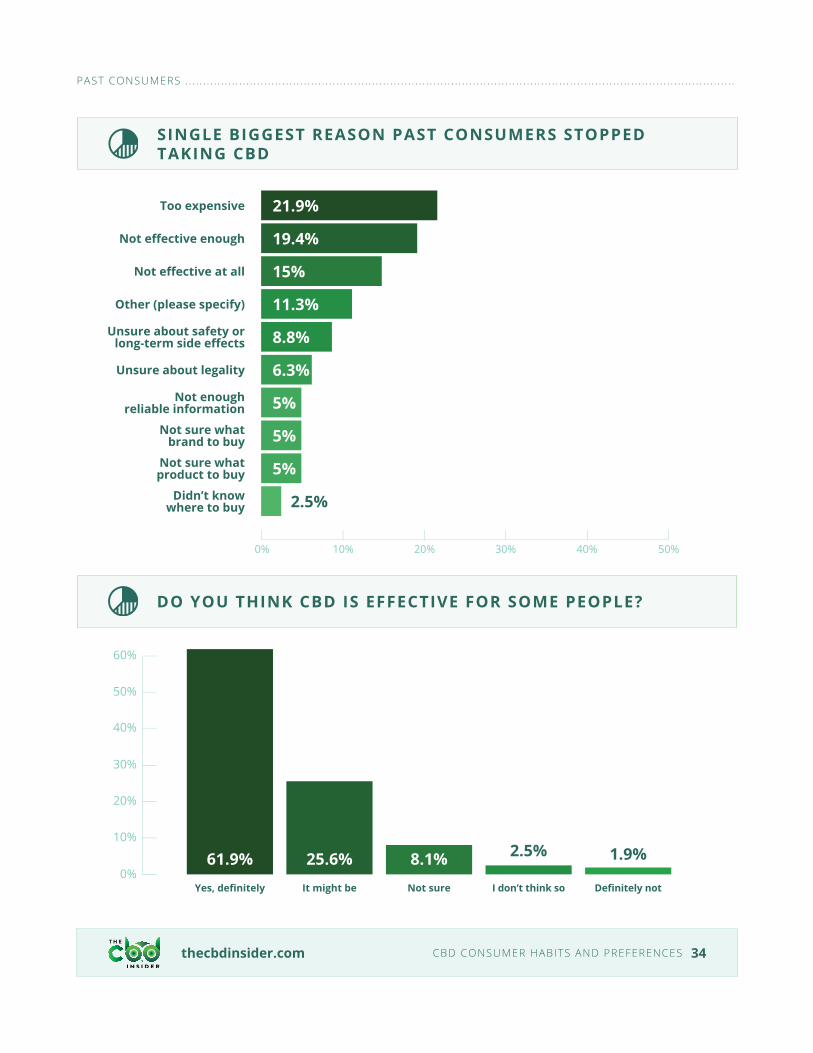
When asked what their single biggest reason was for
no longer using CBD, a plurality of past consumers said it was too expensive (21.9%), but more than one in three consumers said it was either not effective enough (19.4%) or not effective at all (15%).
The fact that more than three in four past consumers were either unsure about how much CBD they were taking, or taking small servings, indicates they were probably not using enough CBD to be effective.
Despite several past consumers saying that CBD was not effective enough, seven in eight of them (87.5%) think CBD is definitely effective or might be effective for some people.
Perhaps as a result, more than two-thirds of past consumers (68.8%) said they would reconsider using CBD.
When asked what would make them reconsider, 31.8% of past consumers mentioned better efficacy as a reason they would reconsider CBD, while 29.1% mentioned lower costs.
33
Safety concerns
I prefer other methods
I wouldn’t know how to use it
Other
57.1%
29.9%
9.1%
3.9%
0% 10% 20% 30% 40% 50% 60%
WHY WOULD YOU NOT USE A CBD VAPE PEN?
REASONS PAST CONSUMERS STOPPED TAKING CBD
Too expensive
Not effective at all
Not effective enough
Not sure what brand to buy
Unsure about safety or long-term side effects
Unsure about legality
Not enough reliable information
Not sure what product to buy
Didn’t know where to buy it
Other
24.4%
19.4%
25%
12.5%
12.5%
10.6%
8.1%
8.1%
4.4%
15.6%
0% 10% 20% 30% 40% 50%
DO YOU THINK CBD IS EFFECTIVE FOR SOME PEOPLE?
It might be Not sureYes, definitely I don’t think so Definitely not
61.9% 25.6% 8.1% 2.5% 1.9%0%
10%
20%
30%
40%
50%
60%
thecbdinsider.com CBD CONSUMER HABITS AND PREFERENCES 34
SINGLE BIGGEST REASON PAST CONSUMERS STOPPED TAKING CBD
Not effective enough
Not effective at all
Too expensive
Other (please specify)
Unsure about safety or long-term side effects
Unsure about legality
Not enough reliable information
Not sure what brand to buy
Not sure what product to buy
Didn’t know where to buy
19.4%
15%
21.9%
11.3%
8.8%
6.3%
5%
5%
5%
2.5%
0% 10% 20% 30% 40% 50%
PAST CONSUMERS . . . . . . . . . . . . . . . . . . . . . . . . . . . . . . . . . . . . . . . . . . . . . . . . . . . . . . . . . . . . . . . . . . . . . . . . . . . . . . . . . . . . . . . . . . . . . . . . . . . . . . . . . . . . . . . . . . . . . . . . . . . . . . . . . . . . . . . . . . . . . . . . . . . . . . . . .

thecbdinsider.com CBD CONSUMER HABITS AND PREFERENCES 35
WOULD YOU RECONSIDER USING CBD?
YES
NO
31.3%
68.8%
WHAT WOULD MAKE YOU RECONSIDER USING CBD?
If it was less expensive
If I knew it was safe/high-quality
If I know it works
If I had more information
Other
If I had a reason to use it
27.2%
10%
41.8%
9.1%
12.7%
4.5%
0% 10% 20% 30% 40% 50%
Data represents past consumers who said they would reconsider using CBD.
PAST CONSUMERS . . . . . . . . . . . . . . . . . . . . . . . . . . . . . . . . . . . . . . . . . . . . . . . . . . . . . . . . . . . . . . . . . . . . . . . . . . . . . . . . . . . . . . . . . . . . . . . . . . . . . . . . . . . . . . . . . . . . . . . . . . . . . . . . . . . . . . . . . . . . . . . . . . . . . . . . .
POTENTIAL CONSUMERS
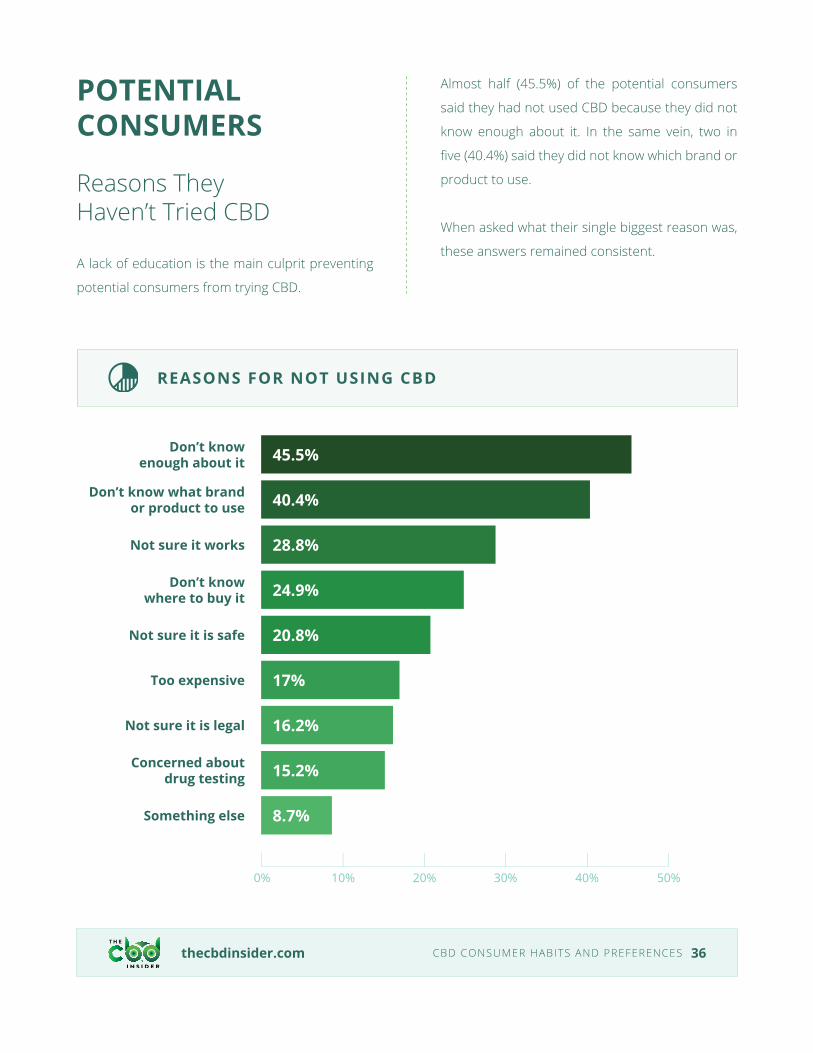
Reasons They Haven’t Tried CBD
A lack of education is the main culprit preventing
potential consumers from trying CBD.
Almost half (45.5%) of the potential consumers
said they had not used CBD because they did not
know enough about it. In the same vein, two in
five (40.4%) said they did not know which brand or
product to use.
When asked what their single biggest reason was,
these answers remained consistent.
thecbdinsider.com CBD CONSUMER HABITS AND PREFERENCES 36
REASONS FOR NOT USING CBD
Don’t know what brand or product to use
Not sure it works
Don’t know enough about it
Don’t know where to buy it
Not sure it is safe
Too expensive
Not sure it is legal
Concerned aboutdrug testing
Something else
40.4%
28.8%
45.5%
24.9%
20.8%
17%
16.2%
15.2%
8.7%
0% 10% 20% 30% 40% 50%
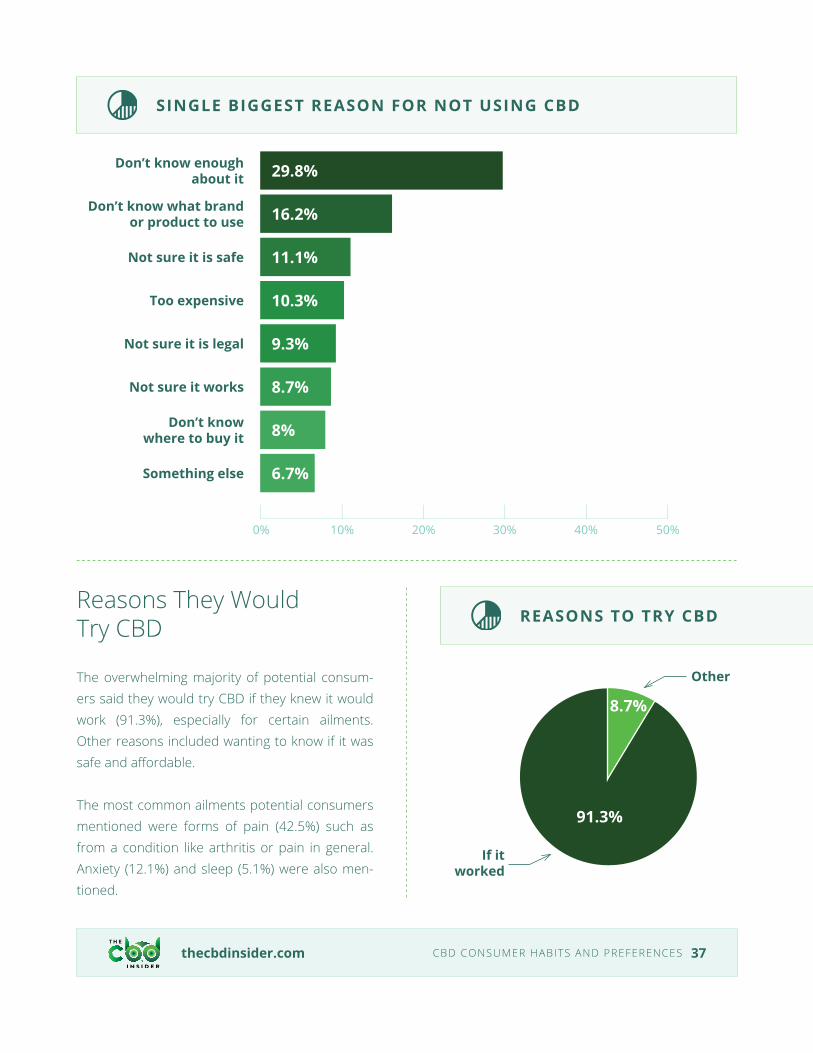
Reasons They Would Try CBD
The overwhelming majority of potential consum-ers said they would try CBD if they knew it would work (91.3%), especially for certain ailments. Other reasons included wanting to know if it was safe and affordable.
The most common ailments potential consumers mentioned were forms of pain (42.5%) such as from a condition like arthritis or pain in general. Anxiety (12.1%) and sleep (5.1%) were also men-tioned.
thecbdinsider.com CBD CONSUMER HABITS AND PREFERENCES 37
SINGLE BIGGEST REASON FOR NOT USING CBD
Don’t know what brand or product to use
Not sure it is safe
Don’t know enough about it
Too expensive
Not sure it is legal
Not sure it works
Don’t know where to buy it
Something else
16.2%
11.1%
29.8%
10.3%
9.3%
8.7%
8%
6.7%
0% 10% 20% 30% 40% 50%
REASONS TO TRY CBD
If it worked
Other
8.7%
91.3%
thecbdinsider.com CBD CONSUMER HABITS AND PREFERENCES 38
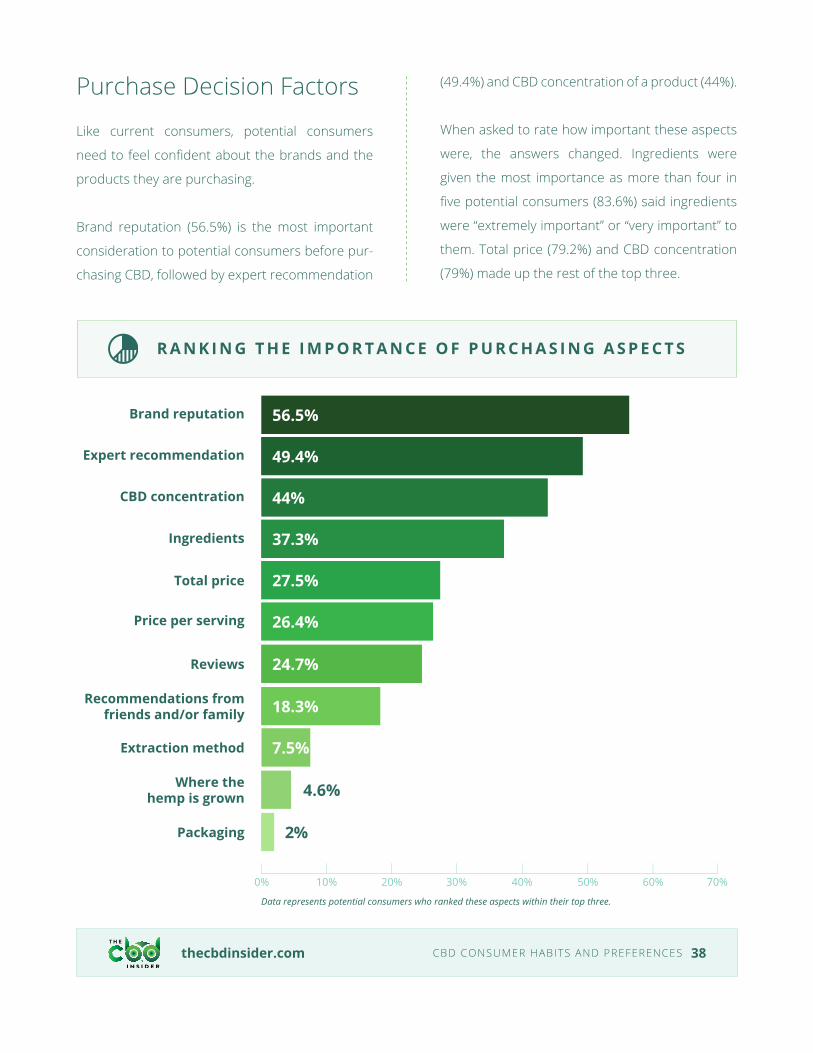
Purchase Decision Factors
Like current consumers, potential consumers
need to feel confident about the brands and the
products they are purchasing.
Brand reputation (56.5%) is the most important
consideration to potential consumers before pur-
chasing CBD, followed by expert recommendation
(49.4%) and CBD concentration of a product (44%).
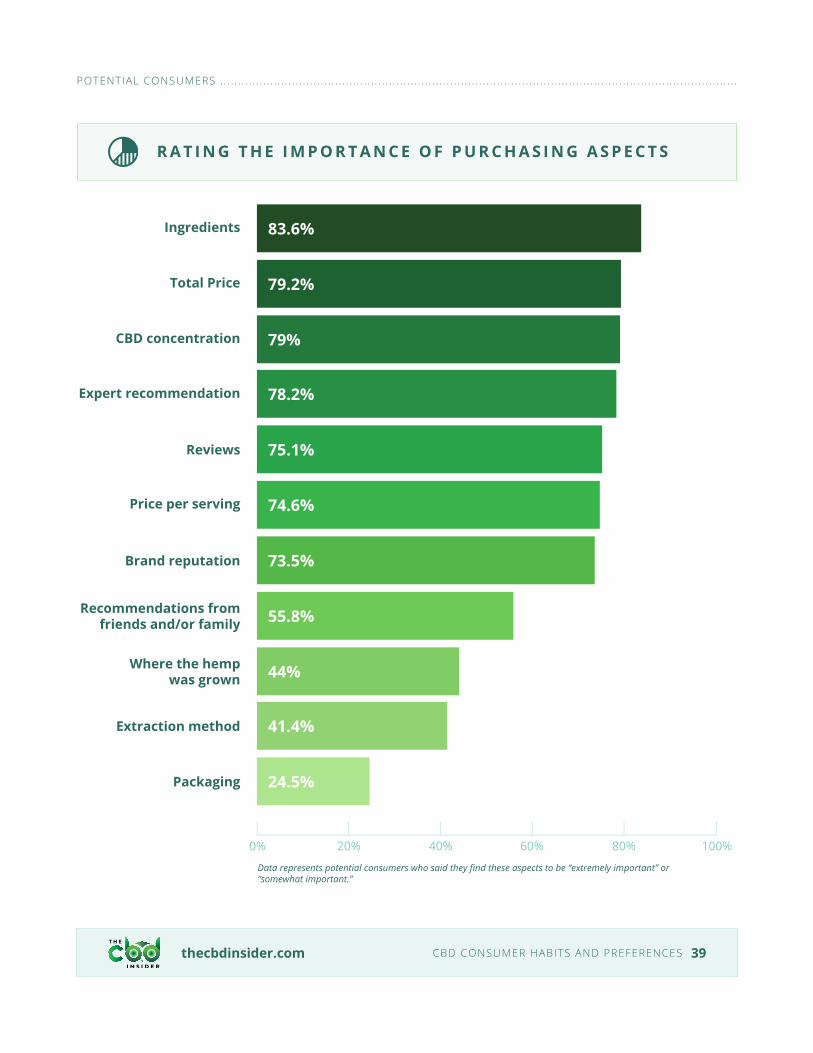
When asked to rate how important these aspects
were, the answers changed. Ingredients were
given the most importance as more than four in
five potential consumers (83.6%) said ingredients
were “extremely important” or “very important” to
them. Total price (79.2%) and CBD concentration
(79%) made up the rest of the top three.
R A N K I N G T H E I M P O R T A N C E O F P U R C H A S I N G A S P E C T S
Brand reputation
Expert recommendation
Total price
Recommendations from friends and/or family
Extraction method
Where the hemp is grown
Packaging
CBD concentration
Price per serving
Ingredients
Reviews
56.5%
49.4%
27.5%
18.3%
7.5%
4.6%
2%
44%
26.4%
37.3%
24.7%
0% 10% 20% 30% 40% 50% 60% 70%
Data represents potential consumers who ranked these aspects within their top three.
thecbdinsider.com CBD CONSUMER HABITS AND PREFERENCES 39
R A T I N G T H E I M P O R T A N C E O F P U R C H A S I N G A S P E C T S
Ingredients
Total Price
Reviews
Extraction method
Recommendations from friends and/or family
Where the hemp was grown
Packaging
CBD concentration
Price per serving
Expert recommendation
Brand reputation
83.6%
79.2%
75.1%
55.8%
44%
41.4%
24.5%
79%
74.6%
78.2%
73.5%
0% 20% 40% 60% 80% 100%
Data represents potential consumers who said they find these aspects to be “extremely important” or “somewhat important.”
POTENTIAL CONSUMERS . . . . . . . . . . . . . . . . . . . . . . . . . . . . . . . . . . . . . . . . . . . . . . . . . . . . . . . . . . . . . . . . . . . . . . . . . . . . . . . . . . . . . . . . . . . . . . . . . . . . . . . . . . . . . . . . . . . . . . . . . . . . . . . . . . . . . . . . . . . . . . . .
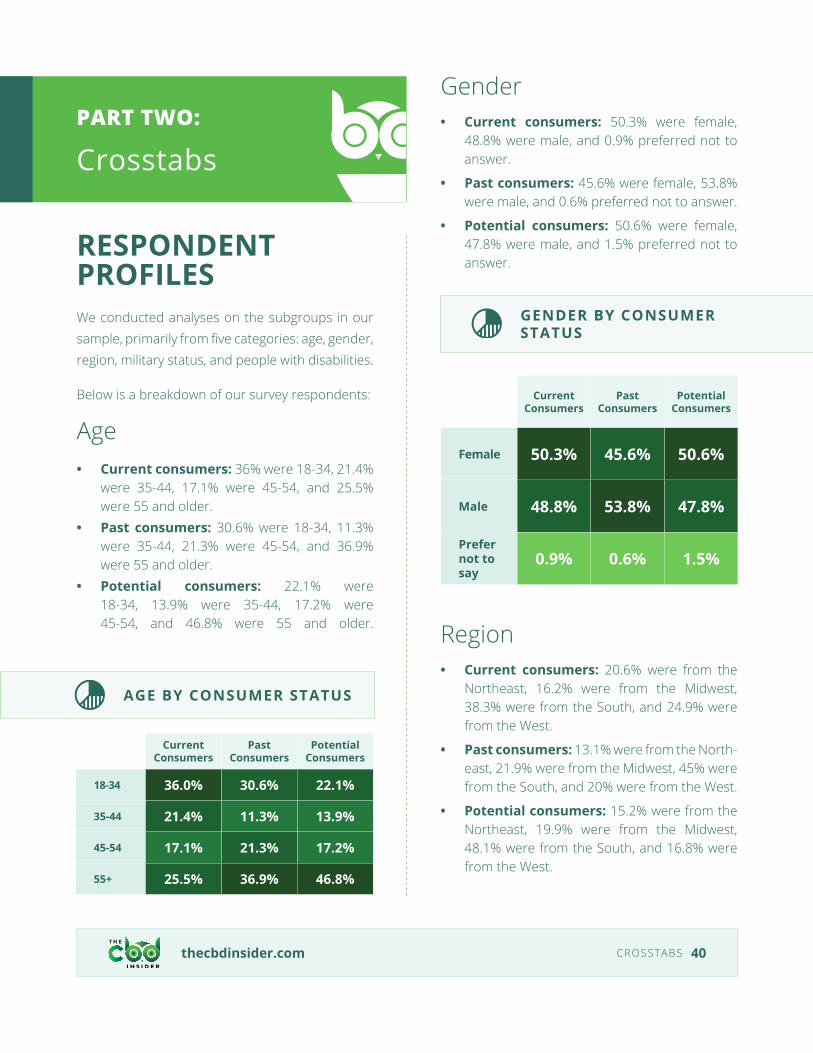
RESPONDENT PROFILESWe conducted analyses on the subgroups in our sample, primarily from five categories: age, gender, region, military status, and people with disabilities.
Below is a breakdown of our survey respondents:
Age• Current consumers: 36% were 18-34, 21.4%
were 35-44, 17.1% were 45-54, and 25.5% were 55 and older.
• Past consumers: 30.6% were 18-34, 11.3% were 35-44, 21.3% were 45-54, and 36.9% were 55 and older.
• Potential consumers: 22.1% were 18-34, 13.9% were 35-44, 17.2% were 45-54, and 46.8% were 55 and older.
Gender• Current consumers: 50.3% were female,
48.8% were male, and 0.9% preferred not to answer.
• Past consumers: 45.6% were female, 53.8% were male, and 0.6% preferred not to answer.
• Potential consumers: 50.6% were female, 47.8% were male, and 1.5% preferred not to answer.
Region• Current consumers: 20.6% were from the
Northeast, 16.2% were from the Midwest, 38.3% were from the South, and 24.9% were from the West.
• Past consumers: 13.1% were from the North-east, 21.9% were from the Midwest, 45% were from the South, and 20% were from the West.
• Potential consumers: 15.2% were from the Northeast, 19.9% were from the Midwest, 48.1% were from the South, and 16.8% were from the West.
thecbdinsider.com CROSSTABS 40
PART TWO:
Crosstabs
AGE BY CONSUMER STATUS
Current Consumers
Past Consumers
Potential Consumers
18-34 36.0% 30.6% 22.1%
35-44 21.4% 11.3% 13.9%
45-54 17.1% 21.3% 17.2%
55+ 25.5% 36.9% 46.8%
Current Consumers
Past Consumers
Potential Consumers
Female 50.3% 45.6% 50.6%
Male 48.8% 53.8% 47.8%
Prefer not to say
0.9% 0.6% 1.5%
GENDER BY CONSUMER STATUS
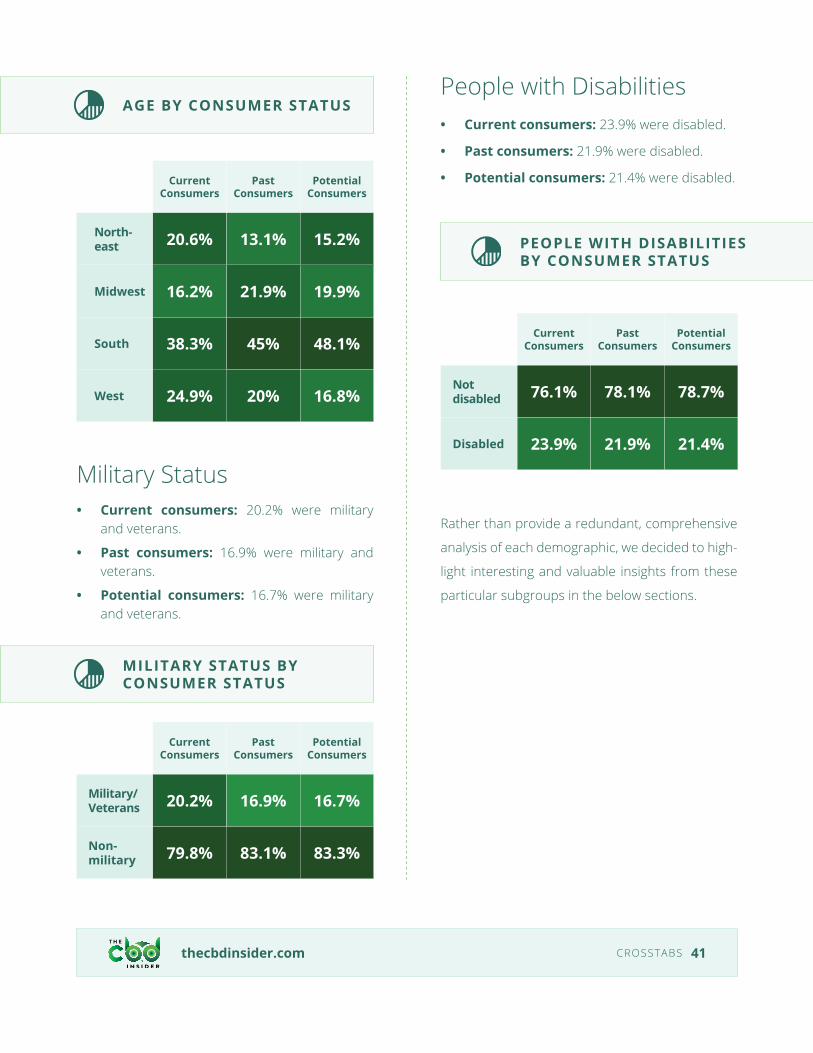
Military Status• Current consumers: 20.2% were military
and veterans.
• Past consumers: 16.9% were military and veterans.
• Potential consumers: 16.7% were military and veterans.
People with Disabilities• Current consumers: 23.9% were disabled.
• Past consumers: 21.9% were disabled.
• Potential consumers: 21.4% were disabled.
Rather than provide a redundant, comprehensive
analysis of each demographic, we decided to high-
light interesting and valuable insights from these
particular subgroups in the below sections.
thecbdinsider.com CROSSTABS 41
Current Consumers
Past Consumers
Potential Consumers
North-east 20.6% 13.1% 15.2%
Midwest 16.2% 21.9% 19.9%
South 38.3% 45% 48.1%
West 24.9% 20% 16.8%
Current Consumers
Past Consumers
Potential Consumers
Military/Veterans 20.2% 16.9% 16.7%
Non-military 79.8% 83.1% 83.3%
Current Consumers
Past Consumers
Potential Consumers
Not disabled 76.1% 78.1% 78.7%
Disabled 23.9% 21.9% 21.4%
AGE BY CONSUMER STATUS
MILITARY STATUS BY CONSUMER STATUS
PEOPLE WITH DISABILITIES BY CONSUMER STATUS
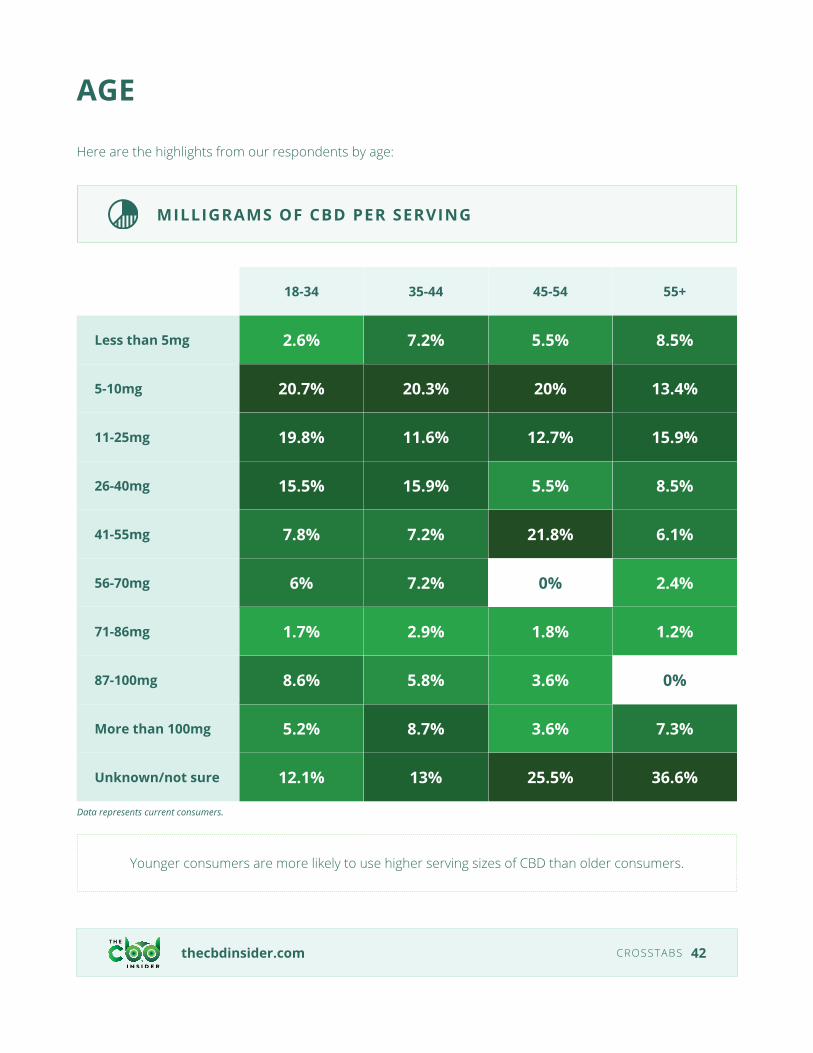
AGE
Here are the highlights from our respondents by age:
thecbdinsider.com CROSSTABS 42
MILLIGRAMS OF CBD PER SERVING
18-34 35-44 45-54 55+
Less than 5mg 2.6% 7.2% 5.5% 8.5%
5-10mg 20.7% 20.3% 20% 13.4%
11-25mg 19.8% 11.6% 12.7% 15.9%
26-40mg 15.5% 15.9% 5.5% 8.5%
41-55mg 7.8% 7.2% 21.8% 6.1%
56-70mg 6% 7.2% 0% 2.4%
71-86mg 1.7% 2.9% 1.8% 1.2%
87-100mg 8.6% 5.8% 3.6% 0%
More than 100mg 5.2% 8.7% 3.6% 7.3%
Unknown/not sure 12.1% 13% 25.5% 36.6%
Data represents current consumers.
Younger consumers are more likely to use higher serving sizes of CBD than older consumers.

The 18-34, 35-44, and 45-54 age groups were far more likely to use edibles, vape products, and CBD
drinks than those 55 and older. Tinctures were the most used only among the 55 and older group.
thecbdinsider.com CROSSTABS 43
TYPES OF CBD PRODUCTS USED
18-34 35-44 45-54 55+
Capsules/softgels 31.9% 33.3% 36.4% 18.3%
Drinks (CBD water, etc.) 39.7% 26.1% 27.3% 8.5%
Edibles (Gummies, etc.) 63.8% 49.3% 40% 31.7%
Patches 13.8% 15.9% 7.3% 0%
Pet 8.6% 11.6% 5.5% 6.1%
Tincture/oil 43.1% 39.1% 38.2% 48.8%
Topical 23.3% 24.6% 30.9% 40.2%
Vape 38.8% 31.9% 32.7% 11%
Other 2.6% 2.9% 0% 4.9%
Data represents current consumers.
thecbdinsider.com CROSSTABS 44
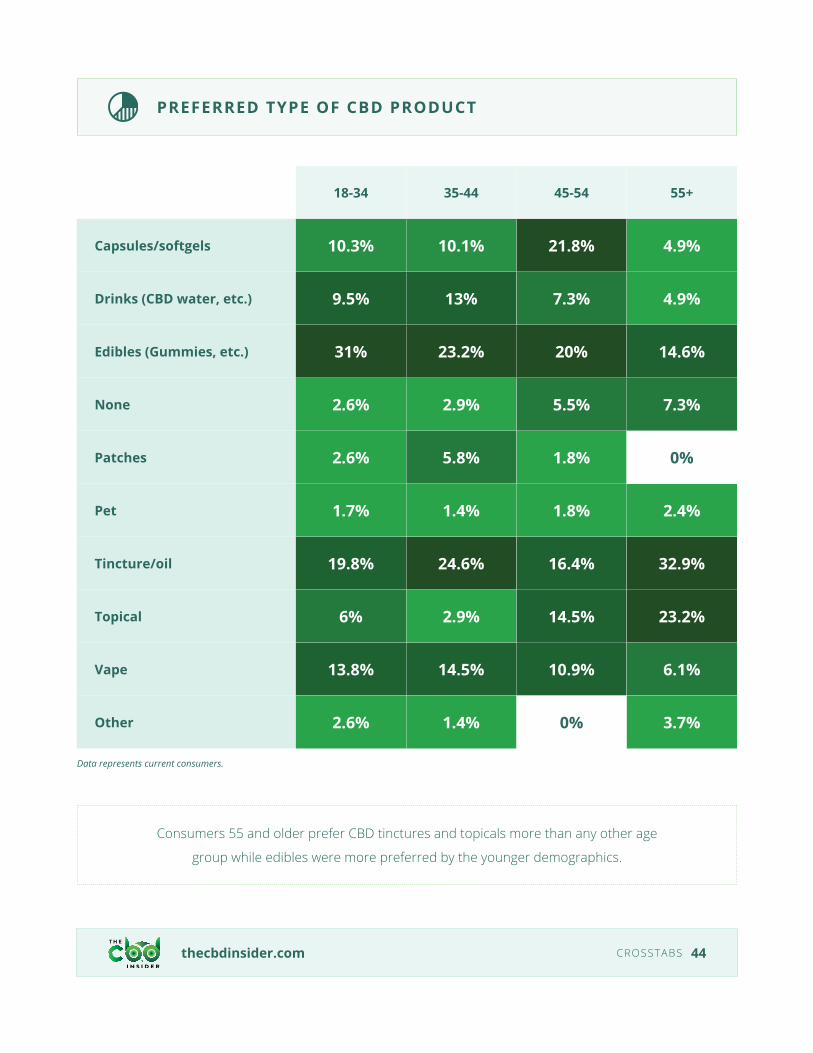
PREFERRED TYPE OF CBD PRODUCT
18-34 35-44 45-54 55+
Capsules/softgels 10.3% 10.1% 21.8% 4.9%
Drinks (CBD water, etc.) 9.5% 13% 7.3% 4.9%
Edibles (Gummies, etc.) 31% 23.2% 20% 14.6%
None 2.6% 2.9% 5.5% 7.3%
Patches 2.6% 5.8% 1.8% 0%
Pet 1.7% 1.4% 1.8% 2.4%
Tincture/oil 19.8% 24.6% 16.4% 32.9%
Topical 6% 2.9% 14.5% 23.2%
Vape 13.8% 14.5% 10.9% 6.1%
Other 2.6% 1.4% 0% 3.7%
Data represents current consumers.
Consumers 55 and older prefer CBD tinctures and topicals more than any other age
group while edibles were more preferred by the younger demographics.
thecbdinsider.com CROSSTABS 45
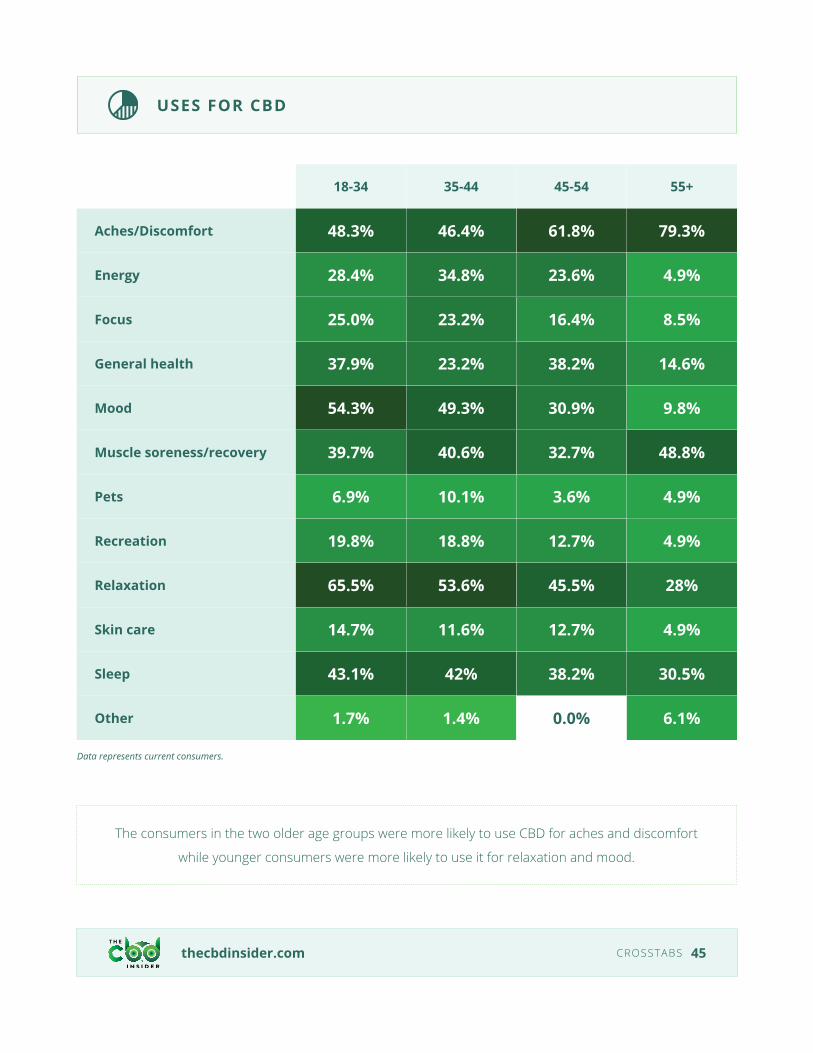
USES FOR CBD
18-34 35-44 45-54 55+
Aches/Discomfort 48.3% 46.4% 61.8% 79.3%
Energy 28.4% 34.8% 23.6% 4.9%
Focus 25.0% 23.2% 16.4% 8.5%
General health 37.9% 23.2% 38.2% 14.6%
Mood 54.3% 49.3% 30.9% 9.8%
Muscle soreness/recovery 39.7% 40.6% 32.7% 48.8%
Pets 6.9% 10.1% 3.6% 4.9%
Recreation 19.8% 18.8% 12.7% 4.9%
Relaxation 65.5% 53.6% 45.5% 28%
Skin care 14.7% 11.6% 12.7% 4.9%
Sleep 43.1% 42% 38.2% 30.5%
Other 1.7% 1.4% 0.0% 6.1%
Data represents current consumers.
The consumers in the two older age groups were more likely to use CBD for aches and discomfort
while younger consumers were more likely to use it for relaxation and mood.
thecbdinsider.com CROSSTABS 46
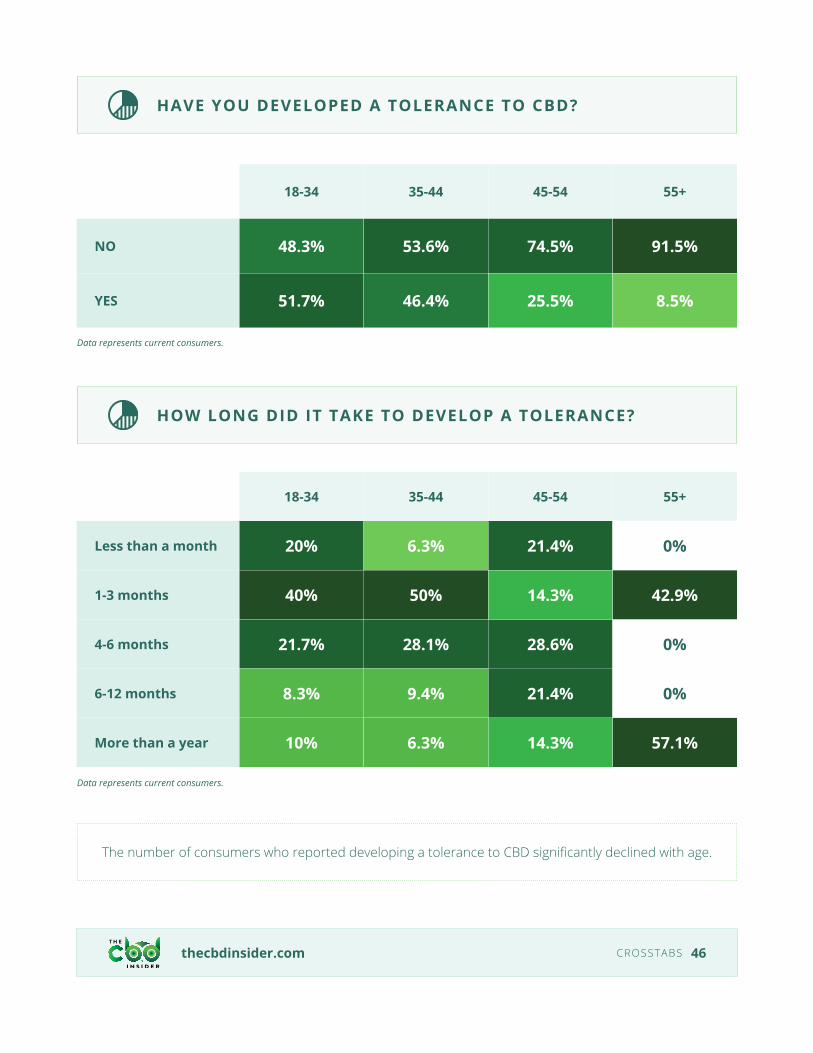
HAVE YOU DEVELOPED A TOLERANCE TO CBD?
HOW LONG DID IT TAKE TO DEVELOP A TOLERANCE?
18-34 35-44 45-54 55+
NO 48.3% 53.6% 74.5% 91.5%
YES 51.7% 46.4% 25.5% 8.5%
18-34 35-44 45-54 55+
Less than a month 20% 6.3% 21.4% 0%
1-3 months 40% 50% 14.3% 42.9%
4-6 months 21.7% 28.1% 28.6% 0%
6-12 months 8.3% 9.4% 21.4% 0%
More than a year 10% 6.3% 14.3% 57.1%
Data represents current consumers.
Data represents current consumers.
The number of consumers who reported developing a tolerance to CBD significantly declined with age.
thecbdinsider.com CROSSTABS 47
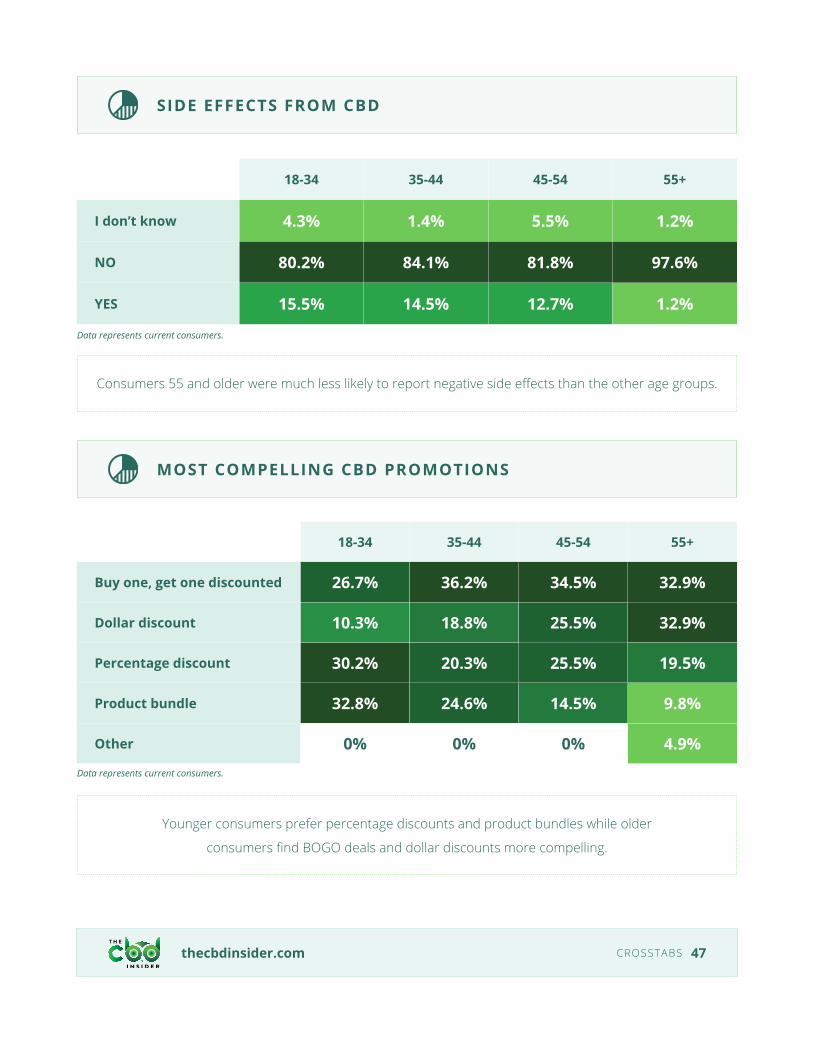
SIDE EFFECTS FROM CBD
MOST COMPELLING CBD PROMOTIONS
18-34 35-44 45-54 55+
I don’t know 4.3% 1.4% 5.5% 1.2%
NO 80.2% 84.1% 81.8% 97.6%
YES 15.5% 14.5% 12.7% 1.2%
18-34 35-44 45-54 55+
Buy one, get one discounted 26.7% 36.2% 34.5% 32.9%
Dollar discount 10.3% 18.8% 25.5% 32.9%
Percentage discount 30.2% 20.3% 25.5% 19.5%
Product bundle 32.8% 24.6% 14.5% 9.8%
Other 0% 0% 0% 4.9%
Data represents current consumers.
Data represents current consumers.
Consumers 55 and older were much less likely to report negative side effects than the other age groups.
Younger consumers prefer percentage discounts and product bundles while older
consumers find BOGO deals and dollar discounts more compelling.
thecbdinsider.com CROSSTABS 48
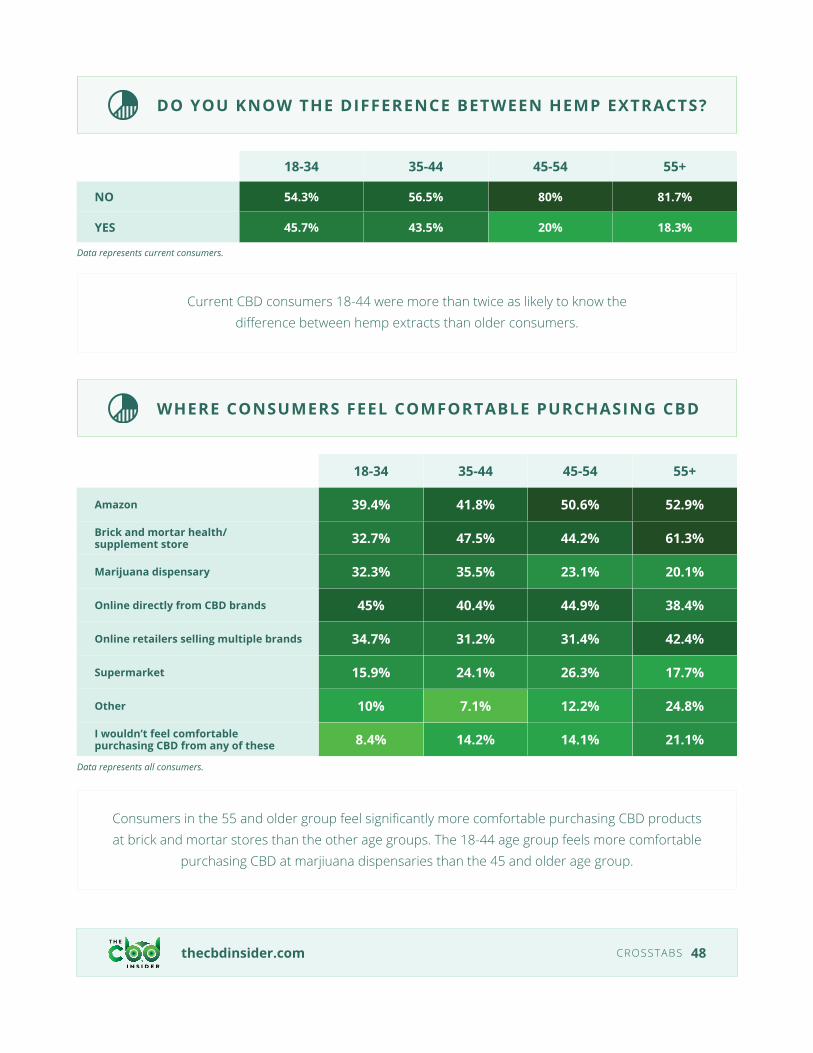
DO YOU KNOW THE DIFFERENCE BETWEEN HEMP EXTRACTS?
WHERE CONSUMERS FEEL COMFORTABLE PURCHASING CBD
18-34 35-44 45-54 55+
NO 54.3% 56.5% 80% 81.7%
YES 45.7% 43.5% 20% 18.3%
18-34 35-44 45-54 55+
Amazon 39.4% 41.8% 50.6% 52.9%
Brick and mortar health/supplement store 32.7% 47.5% 44.2% 61.3%
Marijuana dispensary 32.3% 35.5% 23.1% 20.1%
Online directly from CBD brands 45% 40.4% 44.9% 38.4%
Online retailers selling multiple brands 34.7% 31.2% 31.4% 42.4%
Supermarket 15.9% 24.1% 26.3% 17.7%
Other 10% 7.1% 12.2% 24.8%
I wouldn’t feel comfortable purchasing CBD from any of these 8.4% 14.2% 14.1% 21.1%
Data represents current consumers.
Data represents all consumers.
Current CBD consumers 18-44 were more than twice as likely to know the difference between hemp extracts than older consumers.
Consumers in the 55 and older group feel significantly more comfortable purchasing CBD products at brick and mortar stores than the other age groups. The 18-44 age group feels more comfortable
purchasing CBD at marjiuana dispensaries than the 45 and older age group.
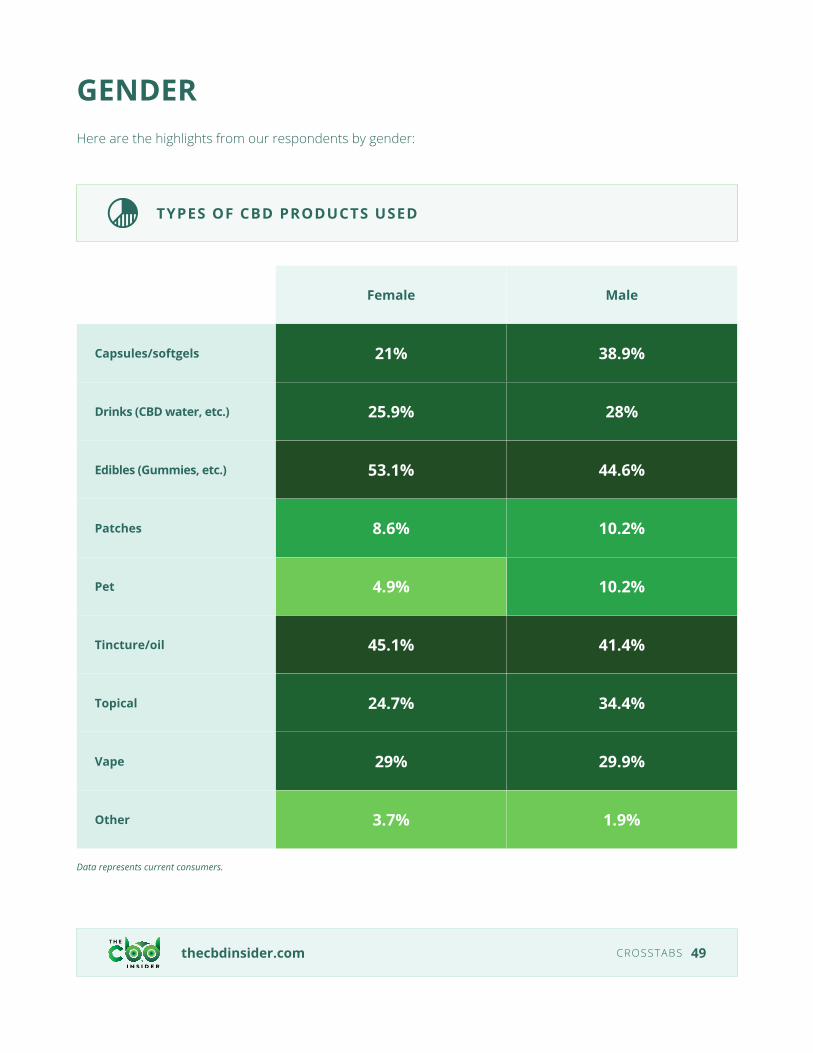
GENDERHere are the highlights from our respondents by gender:
thecbdinsider.com CROSSTABS 49
TYPES OF CBD PRODUCTS USED
Female Male
Capsules/softgels 21% 38.9%
Drinks (CBD water, etc.) 25.9% 28%
Edibles (Gummies, etc.) 53.1% 44.6%
Patches 8.6% 10.2%
Pet 4.9% 10.2%
Tincture/oil 45.1% 41.4%
Topical 24.7% 34.4%
Vape 29% 29.9%
Other 3.7% 1.9%
Data represents current consumers.
thecbdinsider.com CROSSTABS 50
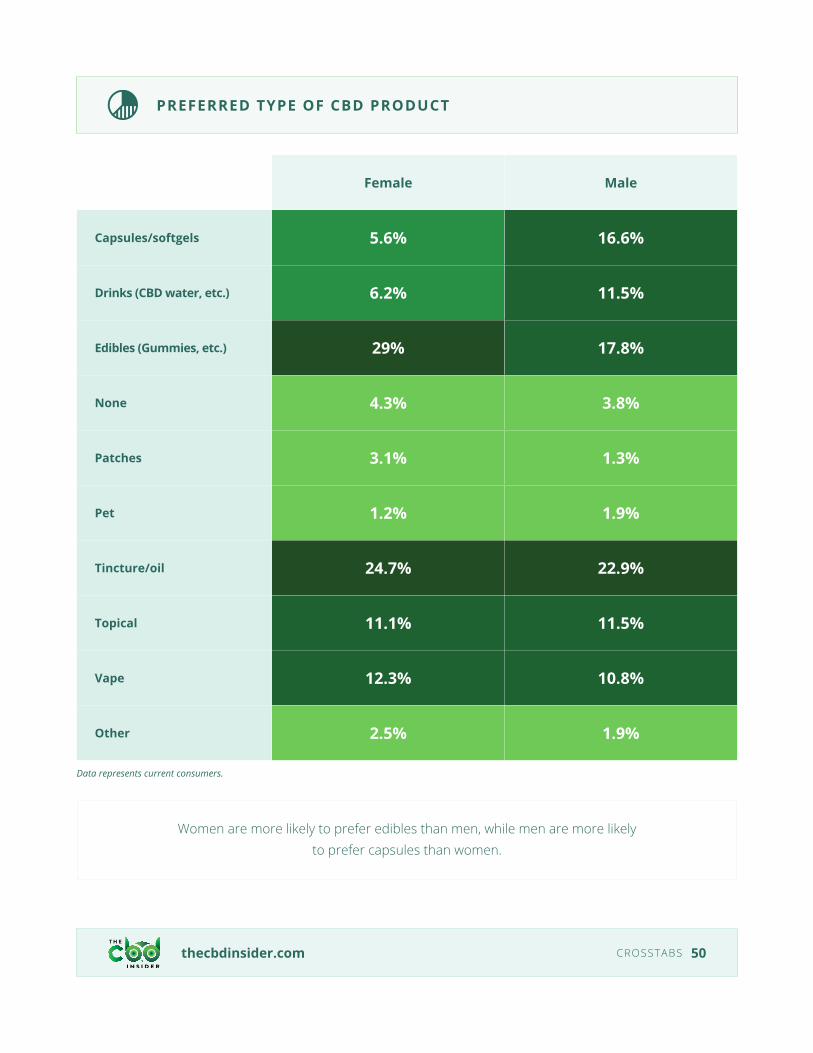
PREFERRED TYPE OF CBD PRODUCT
Female Male
Capsules/softgels 5.6% 16.6%
Drinks (CBD water, etc.) 6.2% 11.5%
Edibles (Gummies, etc.) 29% 17.8%
None 4.3% 3.8%
Patches 3.1% 1.3%
Pet 1.2% 1.9%
Tincture/oil 24.7% 22.9%
Topical 11.1% 11.5%
Vape 12.3% 10.8%
Other 2.5% 1.9%
Data represents current consumers.
Women are more likely to prefer edibles than men, while men are more likely to prefer capsules than women.
thecbdinsider.com CROSSTABS 51
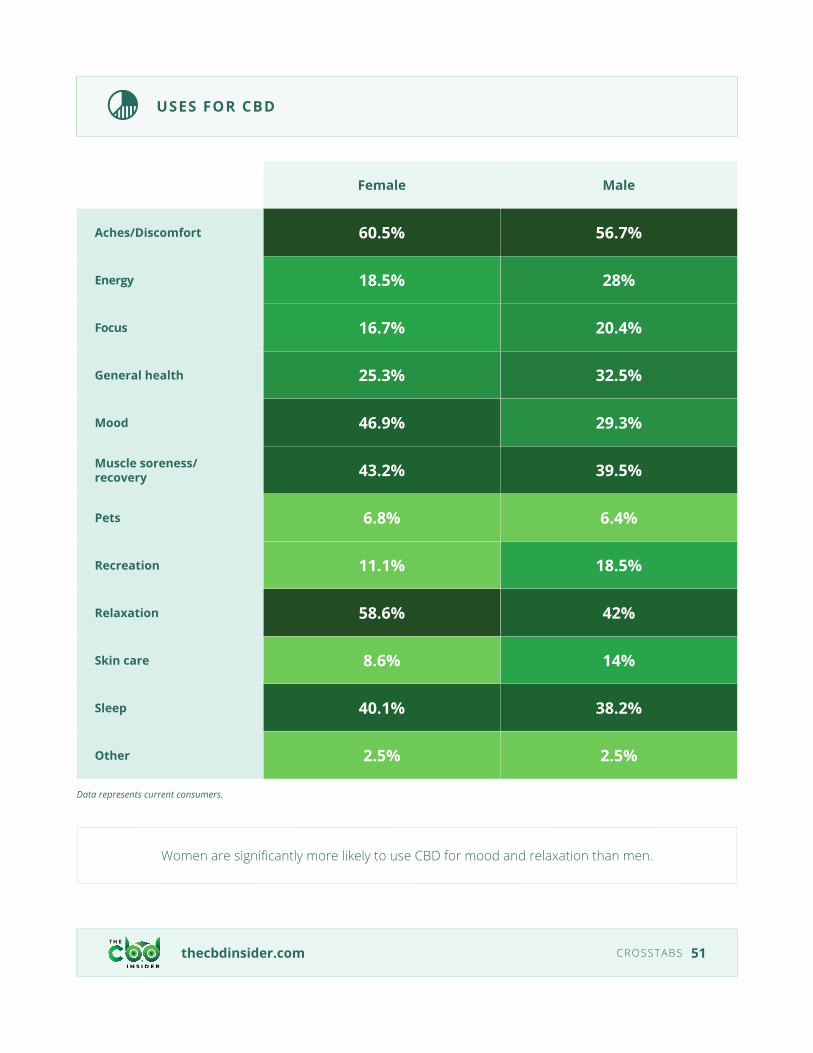
USES FOR CBD
Female Male
Aches/Discomfort 60.5% 56.7%
Energy 18.5% 28%
Focus 16.7% 20.4%
General health 25.3% 32.5%
Mood 46.9% 29.3%
Muscle soreness/recovery 43.2% 39.5%
Pets 6.8% 6.4%
Recreation 11.1% 18.5%
Relaxation 58.6% 42%
Skin care 8.6% 14%
Sleep 40.1% 38.2%
Other 2.5% 2.5%
Data represents current consumers.
Women are significantly more likely to use CBD for mood and relaxation than men.
thecbdinsider.com CROSSTABS 52
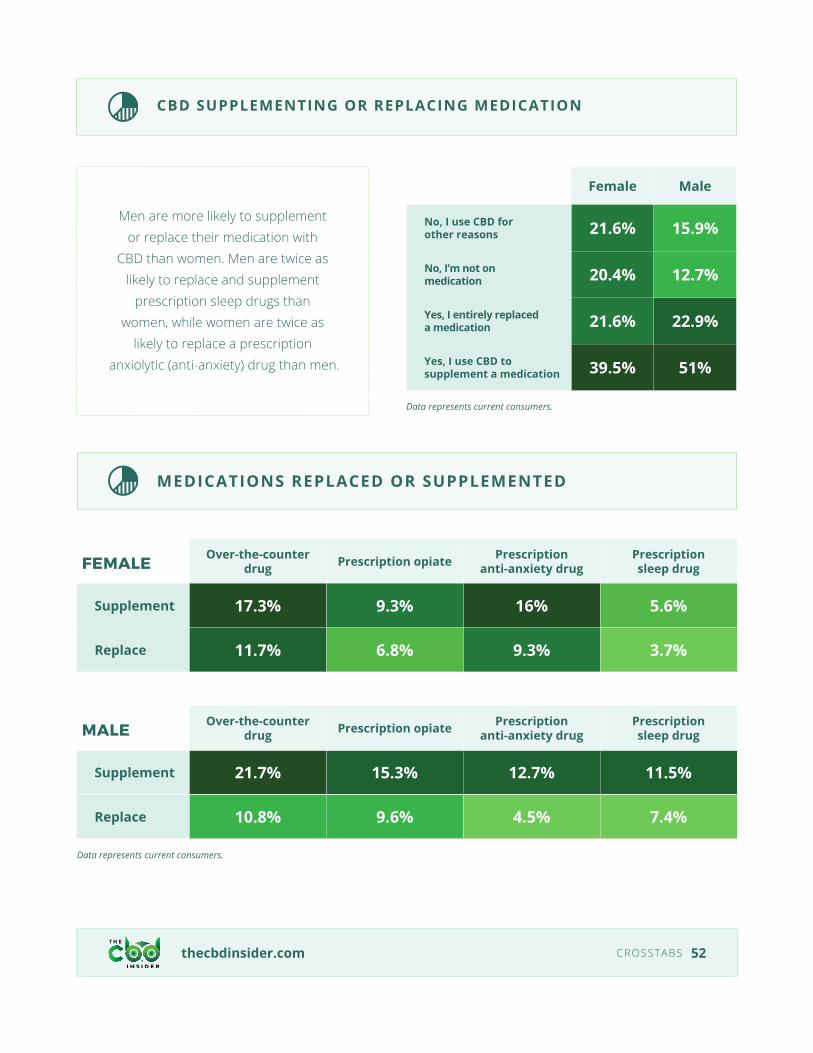
MEDICATIONS REPLACED OR SUPPLEMENTED
FEMALE Over-the-counter drug Prescription opiate Prescription
anti-anxiety drugPrescription sleep drug
Supplement 17.3% 9.3% 16% 5.6%
Replace 11.7% 6.8% 9.3% 3.7%
MALE Over-the-counter drug Prescription opiate Prescription
anti-anxiety drugPrescription sleep drug
Supplement 21.7% 15.3% 12.7% 11.5%
Replace 10.8% 9.6% 4.5% 7.4%
Data represents current consumers.
CBD SUPPLEMENTING OR REPLACING MEDICATION
Female Male
No, I use CBD for other reasons 21.6% 15.9%
No, I’m not on medication 20.4% 12.7%
Yes, I entirely replaced a medication 21.6% 22.9%
Yes, I use CBD to supplement a medication 39.5% 51%
Data represents current consumers.
Men are more likely to supplement or replace their medication with
CBD than women. Men are twice as likely to replace and supplement
prescription sleep drugs than women, while women are twice as
likely to replace a prescription anxiolytic (anti-anxiety) drug than men.

thecbdinsider.com CROSSTABS 53
WHERE DO YOU GET INFORMATION ABOUT CBD?
Female Male
Alternative News (podcasts, etc.) 12.7% 13.8%
Blogs/educational sites 21.1% 21%
CBD brands 29.9% 34%
Family/friends 55.1% 42.4%
Mainstream News (CNN, NYT, Fox, etc.) 15.7% 24%
Physician 15.5% 20.8%
Retailers 14.6% 19.1%
Social media 30.1% 26.8%
Other 1.4% 3.3%
None 9.3% 10%
Data represents all consumers.
Female consumers are more likely to get their information about CBD from family and friends than male consumers.

thecbdinsider.com CROSSTABS 54
MOST COMPELLING CBD PROMOTION
WOULD YOU RECONSIDER USING CBD?
RANKING THE IMPORTANCE OF PURCHASING ASPECTS
Female Male
Buy one, get one discounted 37.7% 26.1%
Dollar discount 16.7% 23.6%
Percentage discount 21% 28%
Product bundle 24.7% 19.7%
Other 0% 2.5%
Female Male
No 39.7% 24.4%
Yes 60.3% 75.6%
EXPERT RECOMMENDATION Female Male
1 15.2% 25.3%
2 11.2% 11.3%
3 16.8% 19.4%
INGREDIENTS Female Male
1 16.8% 10.8%
2 13.2% 8.1%
3 15.2% 9.7%
REVIEWS Female Male
1 6.1% 8.6%
2 7.6% 12.4%
3 6.1% 9.1%
Data represents current consumers.
Data represents past consumers.
Data represents potential consumers who placed these purchase aspects in their top three.
RANK THE IMPORTANCE OF PURCHASING ASPECTS
BRAND REPUTATION
Female Male
Extremely important 43.8% 38.2%
Very important 35.8% 27.4%
Moderately important 14.8% 24.2%
Slightly important 4.3% 9.6%
Not at all important 1.2% 0.6%Data represents current consumers.
Brand reputation is more important to women than men.
Women find BOGO deals more compelling than men do.
Male past consumers are more likely to re-consider using CBD than female past consumers.
Male potential consumers ranked “expert recom-mendation” and “reviews” higher than potential
female consumers in importance. Women ranked “ingredients” higher than men.
thecbdinsider.com CROSSTABS 55
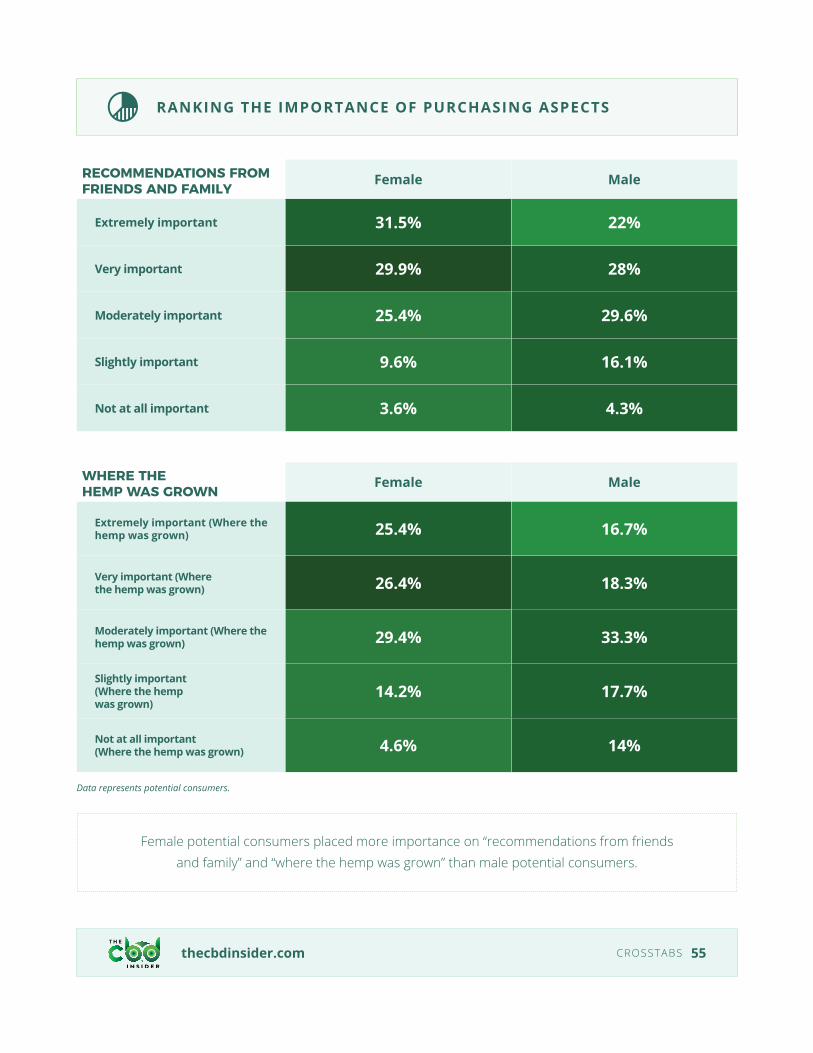
RANKING THE IMPORTANCE OF PURCHASING ASPECTS
RECOMMENDATIONS FROM FRIENDS AND FAMILY
Female Male
Extremely important 31.5% 22%
Very important 29.9% 28%
Moderately important 25.4% 29.6%
Slightly important 9.6% 16.1%
Not at all important 3.6% 4.3%
WHERE THE HEMP WAS GROWN Female Male
Extremely important (Where the hemp was grown) 25.4% 16.7%
Very important (Where the hemp was grown) 26.4% 18.3%
Moderately important (Where the hemp was grown) 29.4% 33.3%
Slightly important (Where the hemp was grown)
14.2% 17.7%
Not at all important (Where the hemp was grown) 4.6% 14%
Data represents potential consumers.
Female potential consumers placed more importance on “recommendations from friends and family” and “where the hemp was grown” than male potential consumers.
REGIONHere are the highlights from our respondents by region:
thecbdinsider.com CROSSTABS 56
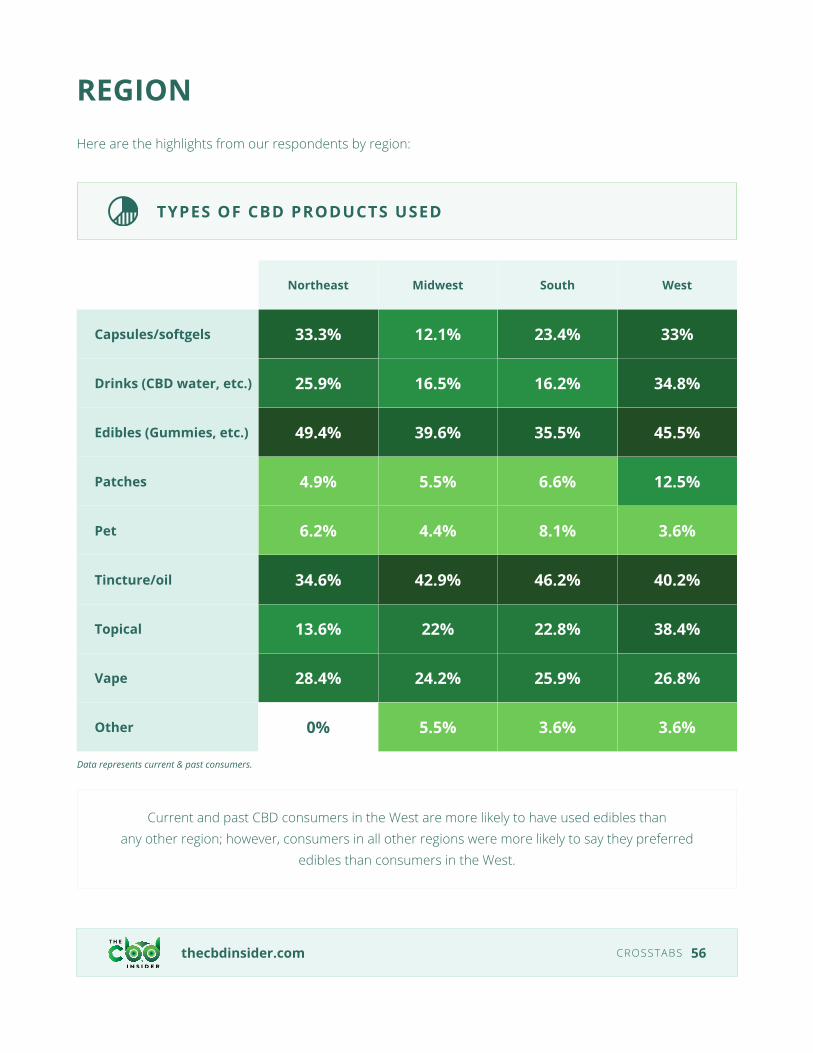
TYPES OF CBD PRODUCTS USED
Northeast Midwest South West
Capsules/softgels 33.3% 12.1% 23.4% 33%
Drinks (CBD water, etc.) 25.9% 16.5% 16.2% 34.8%
Edibles (Gummies, etc.) 49.4% 39.6% 35.5% 45.5%
Patches 4.9% 5.5% 6.6% 12.5%
Pet 6.2% 4.4% 8.1% 3.6%
Tincture/oil 34.6% 42.9% 46.2% 40.2%
Topical 13.6% 22% 22.8% 38.4%
Vape 28.4% 24.2% 25.9% 26.8%
Other 0% 5.5% 3.6% 3.6%
Data represents current & past consumers.
Current and past CBD consumers in the West are more likely to have used edibles than any other region; however, consumers in all other regions were more likely to say they preferred
edibles than consumers in the West.
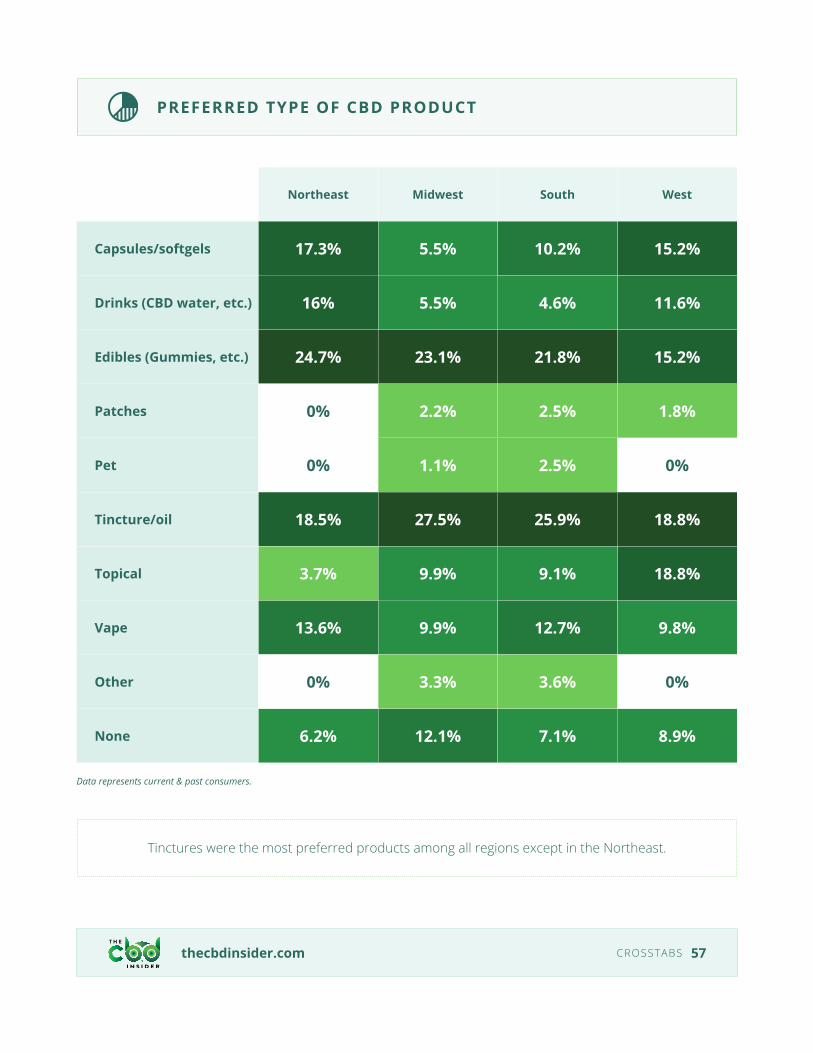
PREFERRED TYPE OF CBD PRODUCT
Northeast Midwest South West
Capsules/softgels 17.3% 5.5% 10.2% 15.2%
Drinks (CBD water, etc.) 16% 5.5% 4.6% 11.6%
Edibles (Gummies, etc.) 24.7% 23.1% 21.8% 15.2%
Patches 0% 2.2% 2.5% 1.8%
Pet 0% 1.1% 2.5% 0%
Tincture/oil 18.5% 27.5% 25.9% 18.8%
Topical 3.7% 9.9% 9.1% 18.8%
Vape 13.6% 9.9% 12.7% 9.8%
Other 0% 3.3% 3.6% 0%
None 6.2% 12.1% 7.1% 8.9%
thecbdinsider.com CROSSTABS 57
Tinctures were the most preferred products among all regions except in the Northeast.
Data represents current & past consumers.
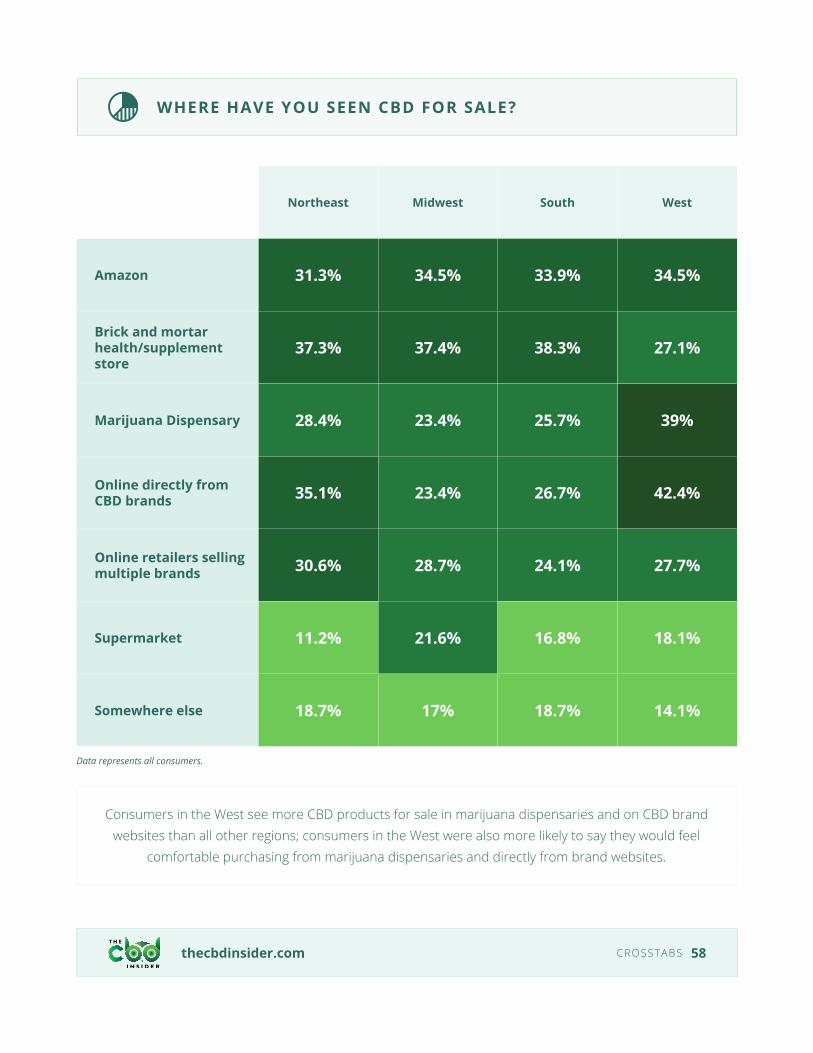
WHERE HAVE YOU SEEN CBD FOR SALE?
Northeast Midwest South West
Amazon 31.3% 34.5% 33.9% 34.5%
Brick and mortar health/supplement store
37.3% 37.4% 38.3% 27.1%
Marijuana Dispensary 28.4% 23.4% 25.7% 39%
Online directly from CBD brands 35.1% 23.4% 26.7% 42.4%
Online retailers selling multiple brands 30.6% 28.7% 24.1% 27.7%
Supermarket 11.2% 21.6% 16.8% 18.1%
Somewhere else 18.7% 17% 18.7% 14.1%
thecbdinsider.com CROSSTABS 58
Data represents all consumers.
Consumers in the West see more CBD products for sale in marijuana dispensaries and on CBD brand websites than all other regions; consumers in the West were also more likely to say they would feel
comfortable purchasing from marijuana dispensaries and directly from brand websites.
thecbdinsider.com CROSSTABS 59
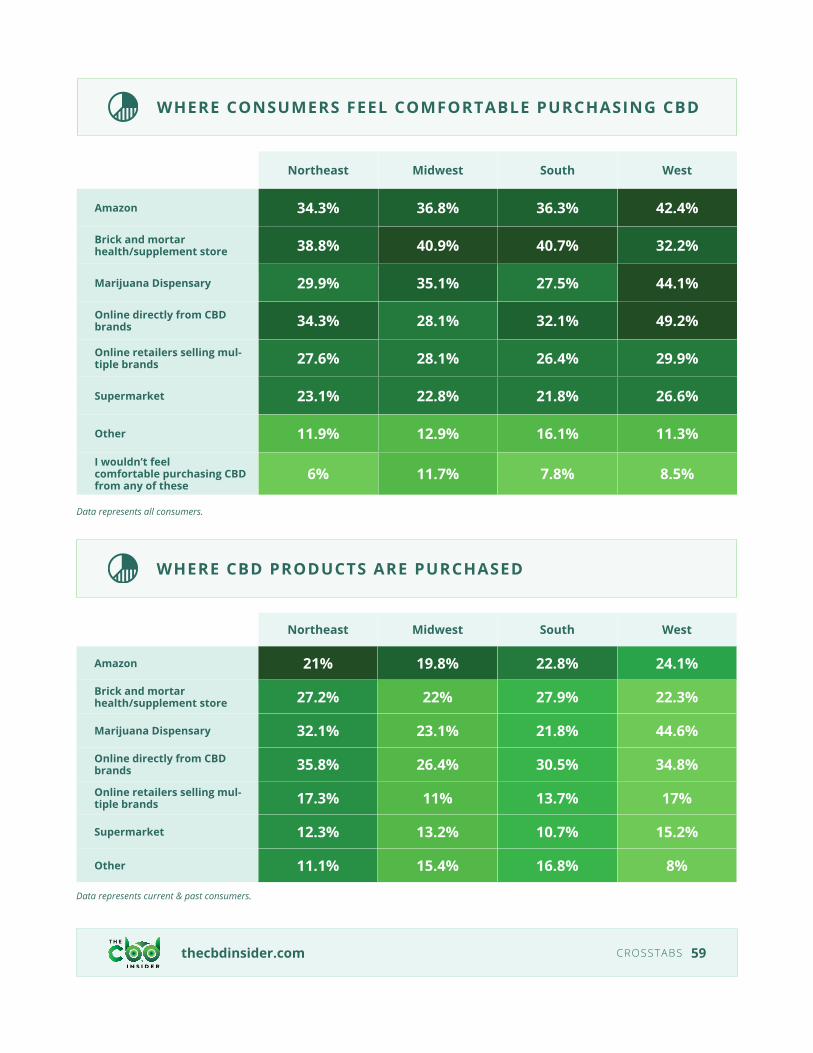
WHERE CONSUMERS FEEL COMFORTABLE PURCHASING CBD
Northeast Midwest South West
Amazon 34.3% 36.8% 36.3% 42.4%
Brick and mortar health/supplement store 38.8% 40.9% 40.7% 32.2%
Marijuana Dispensary 29.9% 35.1% 27.5% 44.1%
Online directly from CBD brands 34.3% 28.1% 32.1% 49.2%
Online retailers selling mul-tiple brands 27.6% 28.1% 26.4% 29.9%
Supermarket 23.1% 22.8% 21.8% 26.6%
Other 11.9% 12.9% 16.1% 11.3%
I wouldn’t feel comfortable purchasing CBD from any of these
6% 11.7% 7.8% 8.5%
Data represents all consumers.
WHERE CBD PRODUCTS ARE PURCHASED
Northeast Midwest South West
Amazon 21% 19.8% 22.8% 24.1%
Brick and mortar health/supplement store 27.2% 22% 27.9% 22.3%
Marijuana Dispensary 32.1% 23.1% 21.8% 44.6%
Online directly from CBD brands 35.8% 26.4% 30.5% 34.8%
Online retailers selling mul-tiple brands 17.3% 11% 13.7% 17%
Supermarket 12.3% 13.2% 10.7% 15.2%
Other 11.1% 15.4% 16.8% 8%
Data represents current & past consumers.

thecbdinsider.com CROSSTABS 60
USES FOR CBD
Northeast Midwest South West
Aches/Discomfort 37.7% 70.9% 57.6% 65%
Energy 32.8% 9.1% 21.6% 27.5%
Focus 18% 12.7% 21.6% 20%
General health 31.1% 14.5% 27.2% 40%
Mood 41% 30.9% 45.6% 28.8%
Muscle soreness/recovery 32.8% 41.8% 40% 48.8%
Pets 4.9% 5.5% 9.6% 3.8%
Recreation 19.7% 5.5% 15.2% 16.3%
Relaxation 57.4% 43.6% 51.2% 47.5%
Skin care 18% 0% 12% 12.5%
Sleep 45.9% 34.5% 38.4% 37.5%
Other 0% 3.6% 4% 1.3%
Data represents current consumers.
Current consumers in the West and Midwest are more likely to report using CBD for aches and discomfort. Consumers in the Midwest were much less likely to report using CBD for energy and skin care.
thecbdinsider.com CROSSTABS 61
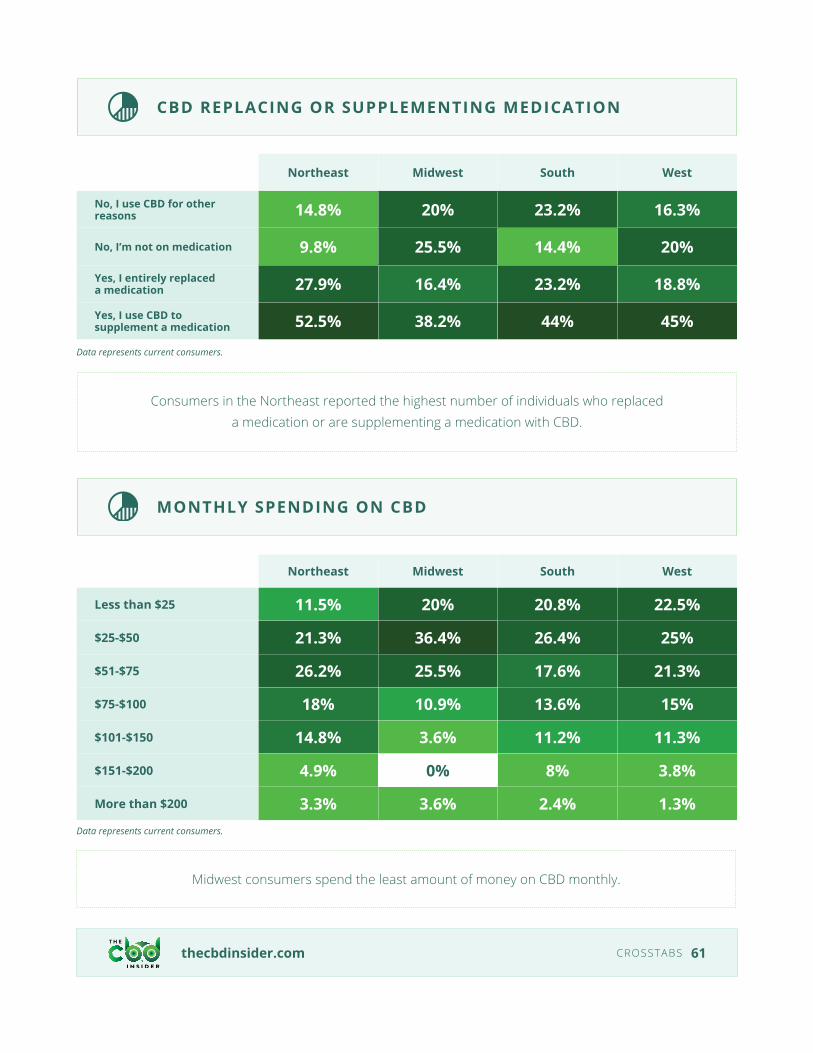
CBD REPLACING OR SUPPLEMENTING MEDICATION
Northeast Midwest South West
No, I use CBD for other reasons 14.8% 20% 23.2% 16.3%
No, I’m not on medication 9.8% 25.5% 14.4% 20%
Yes, I entirely replaced a medication 27.9% 16.4% 23.2% 18.8%
Yes, I use CBD to supplement a medication 52.5% 38.2% 44% 45%
Data represents current consumers.
MONTHLY SPENDING ON CBD
Northeast Midwest South West
Less than $25 11.5% 20% 20.8% 22.5%
$25-$50 21.3% 36.4% 26.4% 25%
$51-$75 26.2% 25.5% 17.6% 21.3%
$75-$100 18% 10.9% 13.6% 15%
$101-$150 14.8% 3.6% 11.2% 11.3%
$151-$200 4.9% 0% 8% 3.8%
More than $200 3.3% 3.6% 2.4% 1.3%Data represents current consumers.
Consumers in the Northeast reported the highest number of individuals who replaced a medication or are supplementing a medication with CBD.
Midwest consumers spend the least amount of money on CBD monthly.
thecbdinsider.com CROSSTABS 62
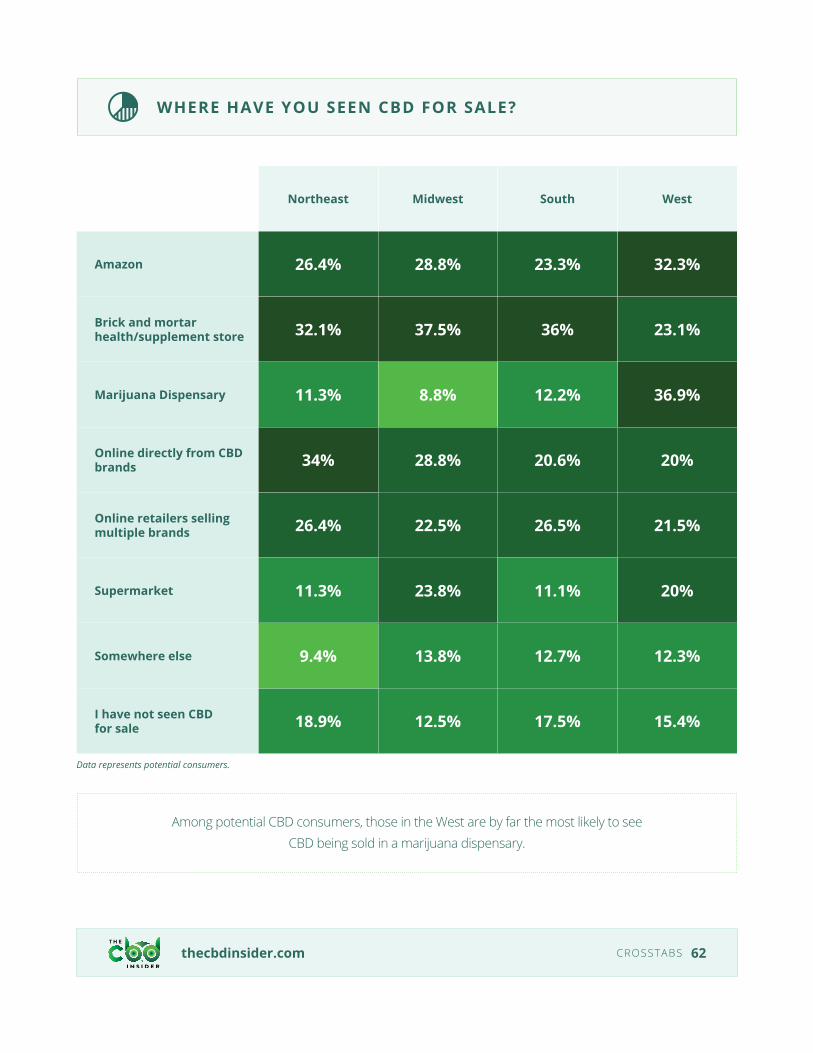
WHERE HAVE YOU SEEN CBD FOR SALE?
Northeast Midwest South West
Amazon 26.4% 28.8% 23.3% 32.3%
Brick and mortar health/supplement store 32.1% 37.5% 36% 23.1%
Marijuana Dispensary 11.3% 8.8% 12.2% 36.9%
Online directly from CBD brands 34% 28.8% 20.6% 20%
Online retailers selling multiple brands 26.4% 22.5% 26.5% 21.5%
Supermarket 11.3% 23.8% 11.1% 20%
Somewhere else 9.4% 13.8% 12.7% 12.3%
I have not seen CBD for sale 18.9% 12.5% 17.5% 15.4%
Data represents potential consumers.
Among potential CBD consumers, those in the West are by far the most likely to see CBD being sold in a marijuana dispensary.
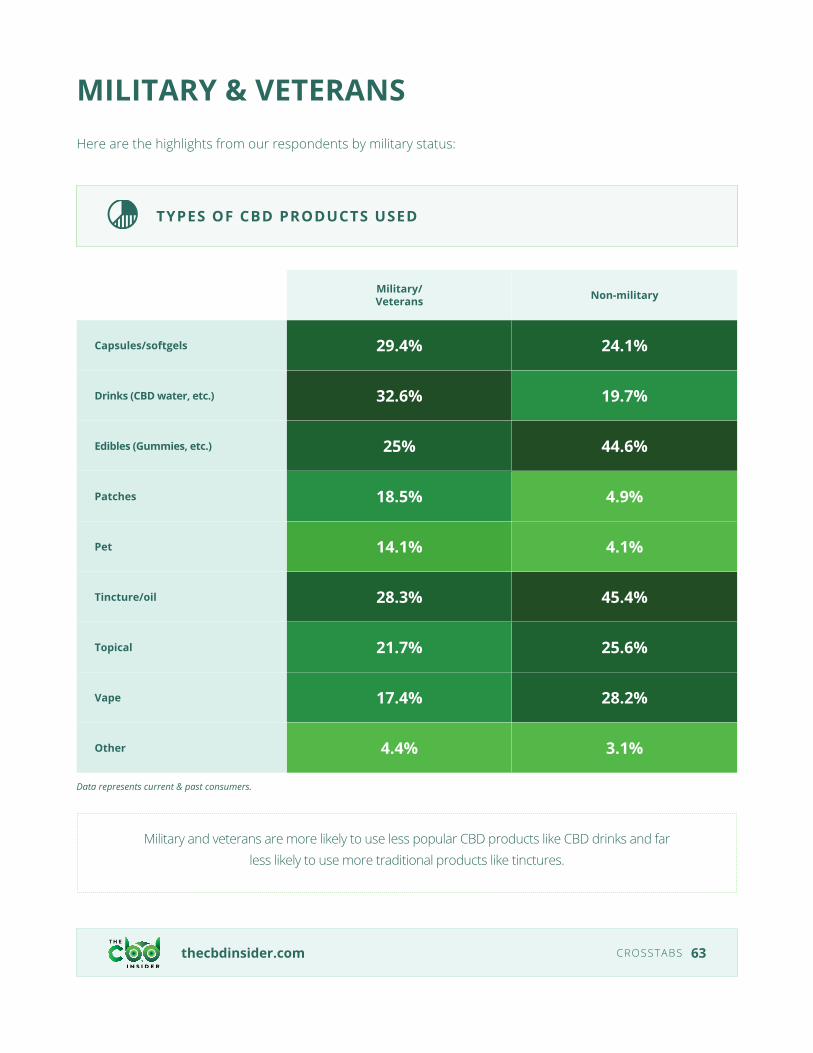
MILITARY & VETERANSHere are the highlights from our respondents by military status:
thecbdinsider.com CROSSTABS 63
TYPES OF CBD PRODUCTS USED
Military/Veterans Non-military
Capsules/softgels 29.4% 24.1%
Drinks (CBD water, etc.) 32.6% 19.7%
Edibles (Gummies, etc.) 25% 44.6%
Patches 18.5% 4.9%
Pet 14.1% 4.1%
Tincture/oil 28.3% 45.4%
Topical 21.7% 25.6%
Vape 17.4% 28.2%
Other 4.4% 3.1%
Data represents current & past consumers.
Military and veterans are more likely to use less popular CBD products like CBD drinks and far less likely to use more traditional products like tinctures.
thecbdinsider.com CROSSTABS 64
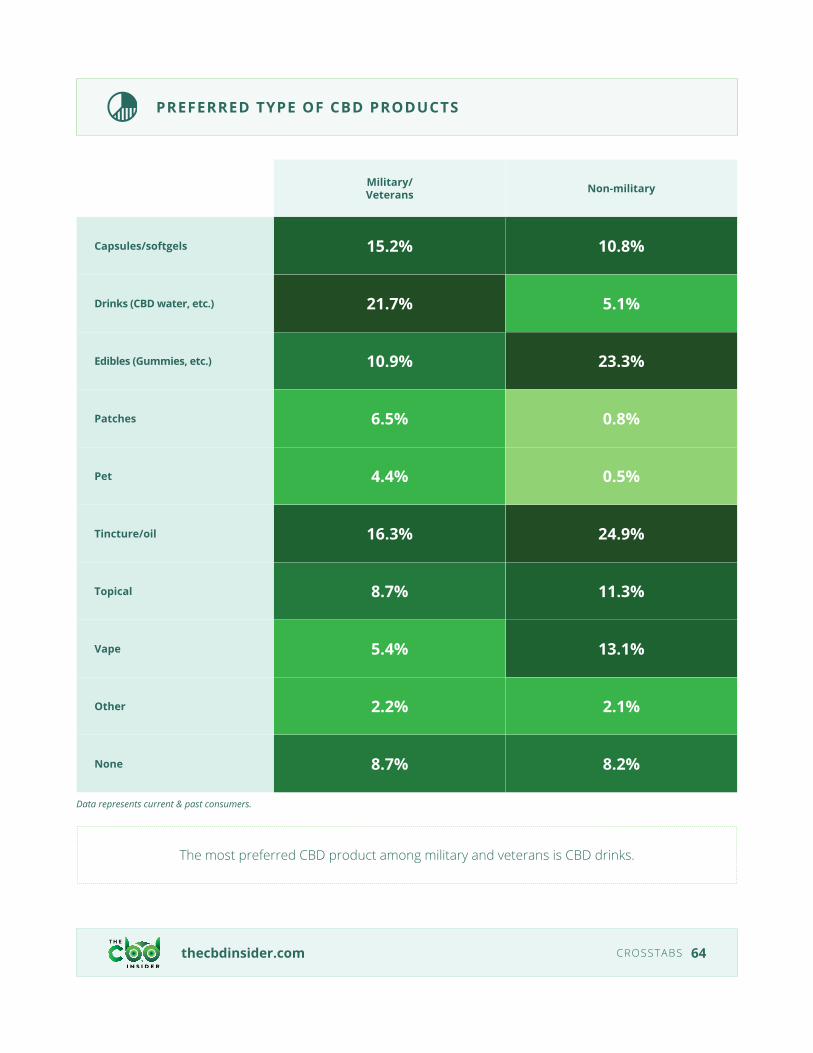
PREFERRED TYPE OF CBD PRODUCTS
Military/Veterans Non-military
Capsules/softgels 15.2% 10.8%
Drinks (CBD water, etc.) 21.7% 5.1%
Edibles (Gummies, etc.) 10.9% 23.3%
Patches 6.5% 0.8%
Pet 4.4% 0.5%
Tincture/oil 16.3% 24.9%
Topical 8.7% 11.3%
Vape 5.4% 13.1%
Other 2.2% 2.1%
None 8.7% 8.2%
Data represents current & past consumers.
The most preferred CBD product among military and veterans is CBD drinks.
thecbdinsider.com CROSSTABS 65
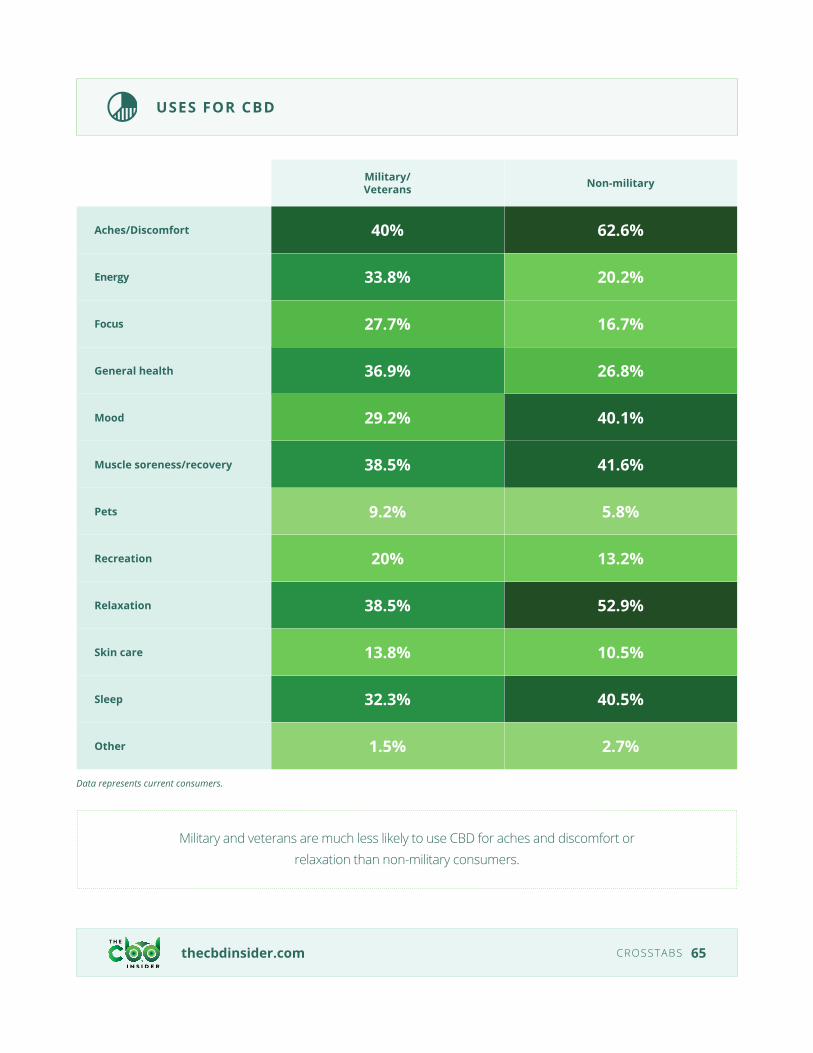
USES FOR CBD
Military/Veterans Non-military
Aches/Discomfort 40% 62.6%
Energy 33.8% 20.2%
Focus 27.7% 16.7%
General health 36.9% 26.8%
Mood 29.2% 40.1%
Muscle soreness/recovery 38.5% 41.6%
Pets 9.2% 5.8%
Recreation 20% 13.2%
Relaxation 38.5% 52.9%
Skin care 13.8% 10.5%
Sleep 32.3% 40.5%
Other 1.5% 2.7%
Data represents current consumers.
Military and veterans are much less likely to use CBD for aches and discomfort or relaxation than non-military consumers.
thecbdinsider.com CROSSTABS 66
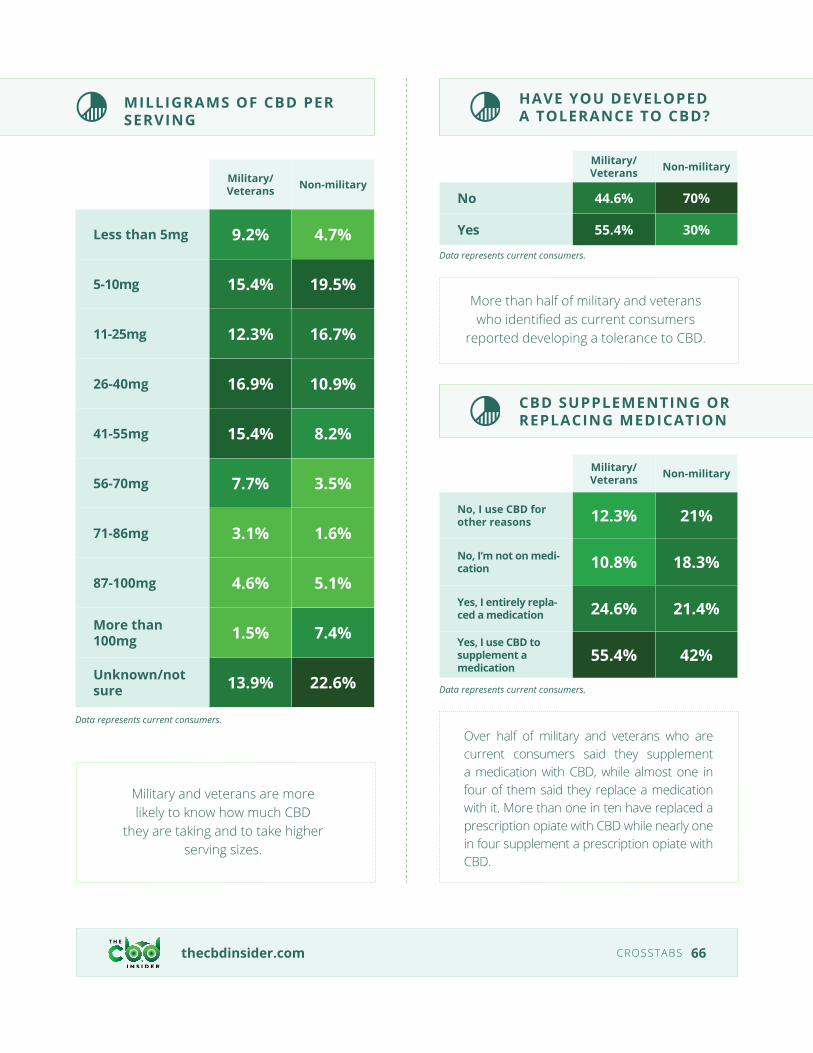
MILLIGRAMS OF CBD PER SERVING
HAVE YOU DEVELOPED A TOLERANCE TO CBD?
CBD SUPPLEMENTING OR REPLACING MEDICATION
Military/Veterans Non-military
Less than 5mg 9.2% 4.7%
5-10mg 15.4% 19.5%
11-25mg 12.3% 16.7%
26-40mg 16.9% 10.9%
41-55mg 15.4% 8.2%
56-70mg 7.7% 3.5%
71-86mg 3.1% 1.6%
87-100mg 4.6% 5.1%
More than 100mg 1.5% 7.4%
Unknown/not sure 13.9% 22.6%
Military/Veterans Non-military
No 44.6% 70%
Yes 55.4% 30%
Military/Veterans Non-military
No, I use CBD for other reasons 12.3% 21%
No, I’m not on medi-cation 10.8% 18.3%
Yes, I entirely repla-ced a medication 24.6% 21.4%
Yes, I use CBD to supplement a medication
55.4% 42%
Data represents current consumers.
Data represents current consumers.
Data represents current consumers.
Military and veterans are more likely to know how much CBD
they are taking and to take higher serving sizes.
More than half of military and veterans who identified as current consumers
reported developing a tolerance to CBD.
Over half of military and veterans who are current consumers said they supplement a medication with CBD, while almost one in four of them said they replace a medication with it. More than one in ten have replaced a prescription opiate with CBD while nearly one in four supplement a prescription opiate with CBD.
thecbdinsider.com CROSSTABS 67
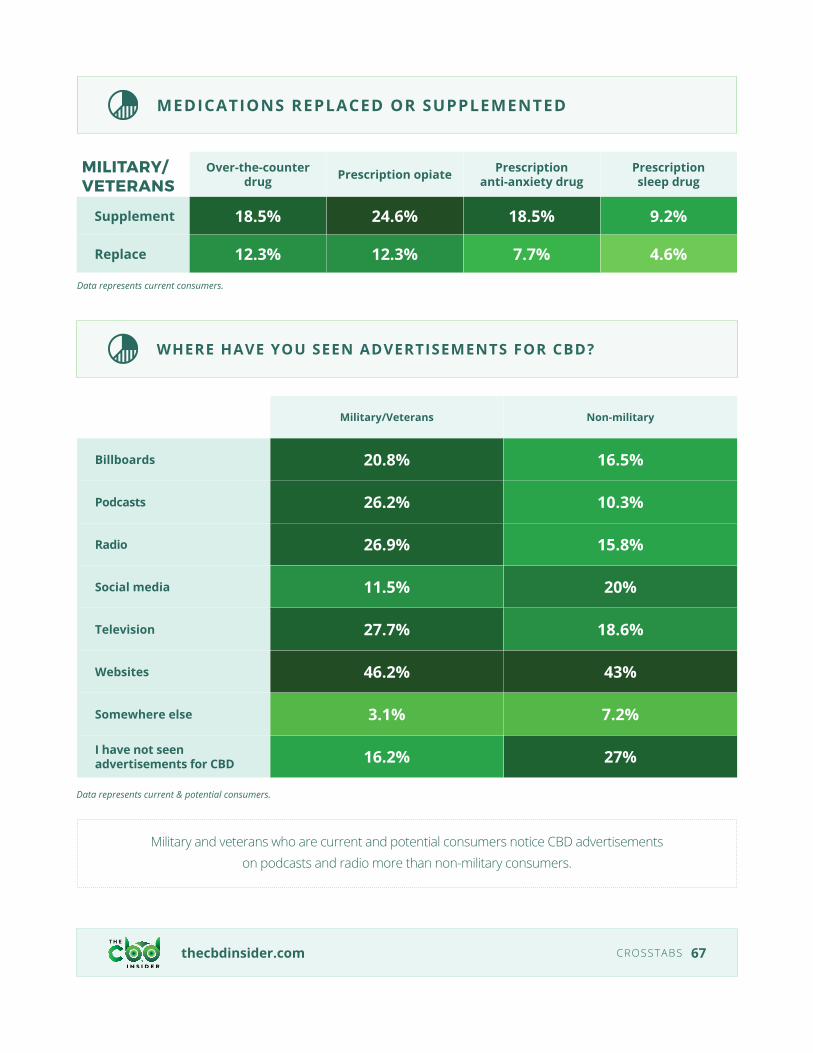
MEDICATIONS REPLACED OR SUPPLEMENTED
MILITARY/VETERANS
Over-the-counter drug Prescription opiate Prescription
anti-anxiety drugPrescription sleep drug
Supplement 18.5% 24.6% 18.5% 9.2%
Replace 12.3% 12.3% 7.7% 4.6%
Data represents current consumers.
WHERE HAVE YOU SEEN ADVERTISEMENTS FOR CBD?
Military/Veterans Non-military
Billboards 20.8% 16.5%
Podcasts 26.2% 10.3%
Radio 26.9% 15.8%
Social media 11.5% 20%
Television 27.7% 18.6%
Websites 46.2% 43%
Somewhere else 3.1% 7.2%
I have not seen advertisements for CBD 16.2% 27%
Data represents current & potential consumers.
Military and veterans who are current and potential consumers notice CBD advertisements on podcasts and radio more than non-military consumers.
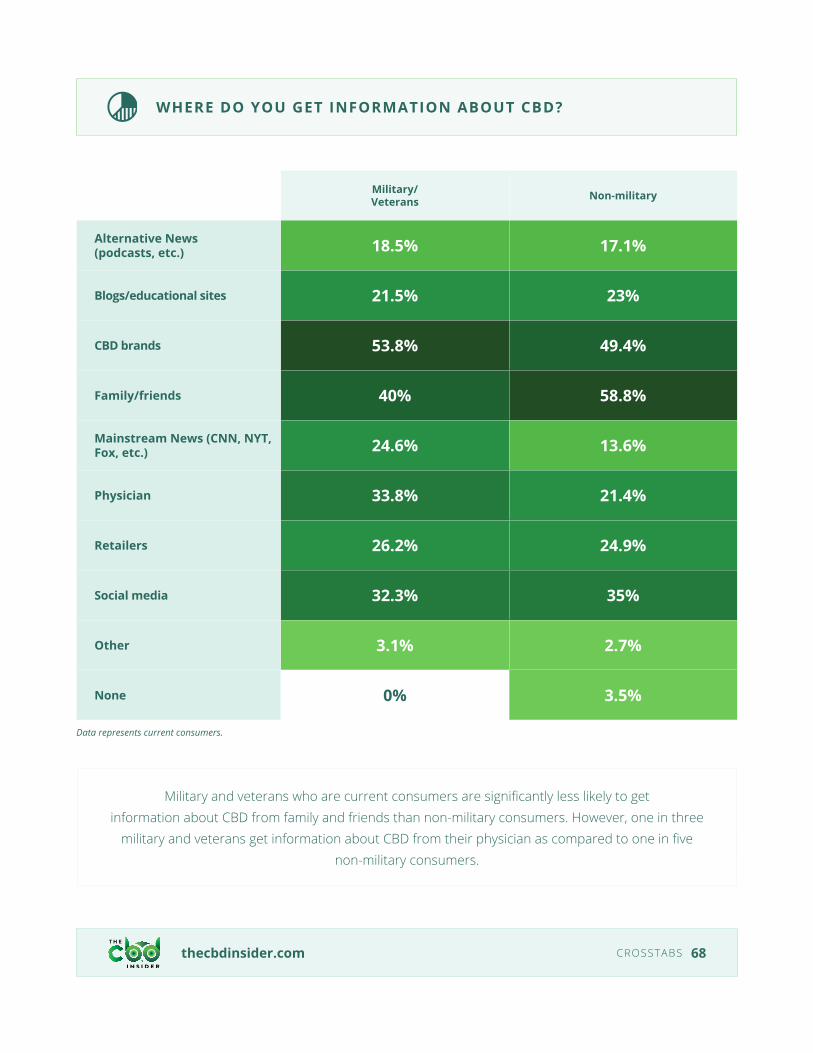
thecbdinsider.com CROSSTABS 68
Military/Veterans Non-military
Alternative News (podcasts, etc.) 18.5% 17.1%
Blogs/educational sites 21.5% 23%
CBD brands 53.8% 49.4%
Family/friends 40% 58.8%
Mainstream News (CNN, NYT, Fox, etc.) 24.6% 13.6%
Physician 33.8% 21.4%
Retailers 26.2% 24.9%
Social media 32.3% 35%
Other 3.1% 2.7%
None 0% 3.5%
Data represents current consumers.
Military and veterans who are current consumers are significantly less likely to get information about CBD from family and friends than non-military consumers. However, one in three
military and veterans get information about CBD from their physician as compared to one in five non-military consumers.
WHERE DO YOU GET INFORMATION ABOUT CBD?
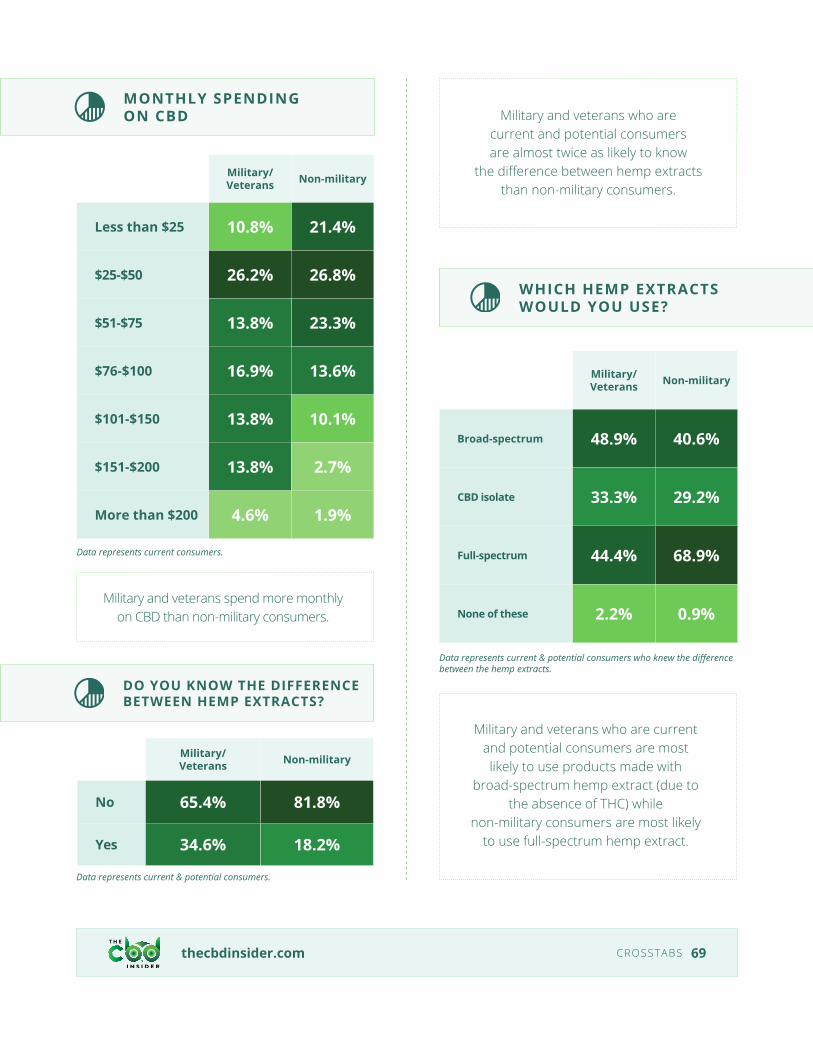
thecbdinsider.com CROSSTABS 69
MONTHLY SPENDING ON CBD
WHICH HEMP EXTRACTS WOULD YOU USE?
Military/Veterans Non-military
Less than $25 10.8% 21.4%
$25-$50 26.2% 26.8%
$51-$75 13.8% 23.3%
$76-$100 16.9% 13.6%
$101-$150 13.8% 10.1%
$151-$200 13.8% 2.7%
More than $200 4.6% 1.9%
Military/Veterans Non-military
Broad-spectrum 48.9% 40.6%
CBD isolate 33.3% 29.2%
Full-spectrum 44.4% 68.9%
None of these 2.2% 0.9%
Data represents current consumers.
Data represents current & potential consumers who knew the difference between the hemp extracts.
Military and veterans spend more monthly on CBD than non-military consumers.
DO YOU KNOW THE DIFFERENCE BETWEEN HEMP EXTRACTS?
Military/Veterans Non-military
No 65.4% 81.8%
Yes 34.6% 18.2%
Data represents current & potential consumers.
Military and veterans who are current and potential consumers are almost twice as likely to know
the difference between hemp extracts than non-military consumers.
Military and veterans who are current and potential consumers are most likely to use products made with
broad-spectrum hemp extract (due to the absence of THC) while
non-military consumers are most likely to use full-spectrum hemp extract.
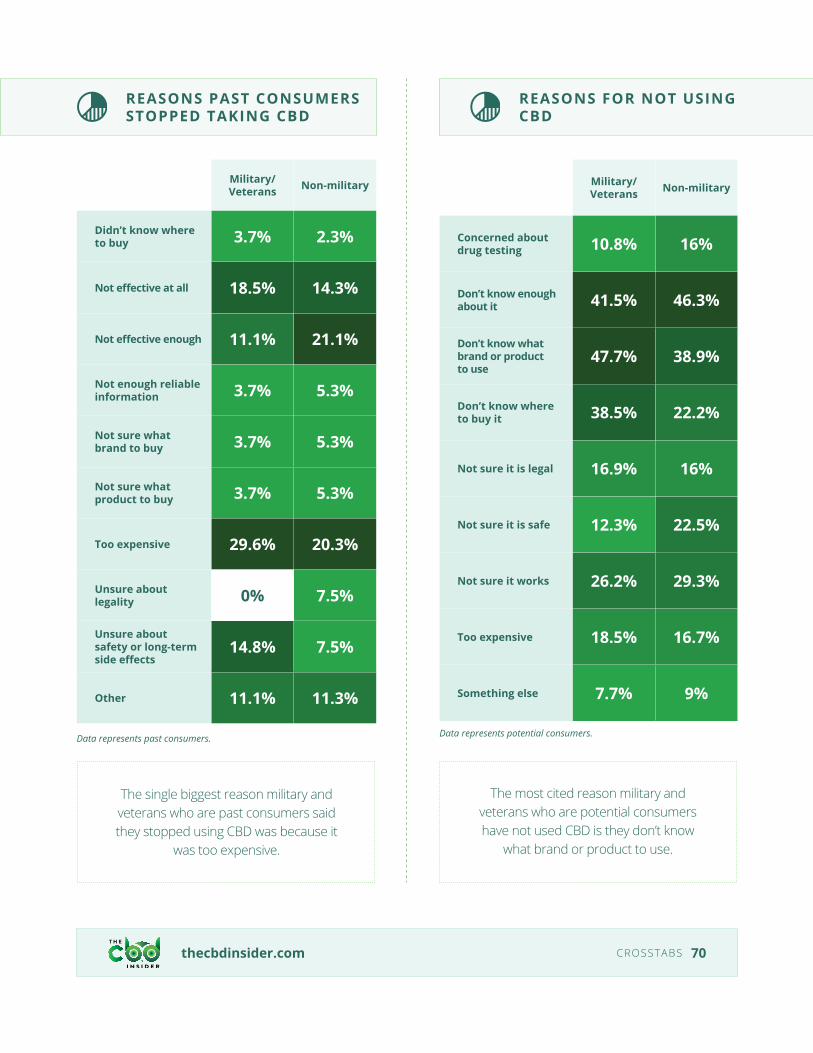
REASONS PAST CONSUMERS STOPPED TAKING CBD
REASONS FOR NOT USING CBD
Military/Veterans Non-military
Didn’t know where to buy 3.7% 2.3%
Not effective at all 18.5% 14.3%
Not effective enough 11.1% 21.1%
Not enough reliable information 3.7% 5.3%
Not sure what brand to buy 3.7% 5.3%
Not sure whatproduct to buy 3.7% 5.3%
Too expensive 29.6% 20.3%
Unsure about legality 0% 7.5%
Unsure about safety or long-term side effects
14.8% 7.5%
Other 11.1% 11.3%
Military/Veterans Non-military
Concerned about drug testing 10.8% 16%
Don’t know enough about it 41.5% 46.3%
Don’t know what brand or product to use
47.7% 38.9%
Don’t know where to buy it 38.5% 22.2%
Not sure it is legal 16.9% 16%
Not sure it is safe 12.3% 22.5%
Not sure it works 26.2% 29.3%
Too expensive 18.5% 16.7%
Something else 7.7% 9%
Data represents past consumers. Data represents potential consumers.
thecbdinsider.com CROSSTABS 70
The single biggest reason military and veterans who are past consumers said they stopped using CBD was because it
was too expensive.
The most cited reason military and veterans who are potential consumers have not used CBD is they don’t know
what brand or product to use.
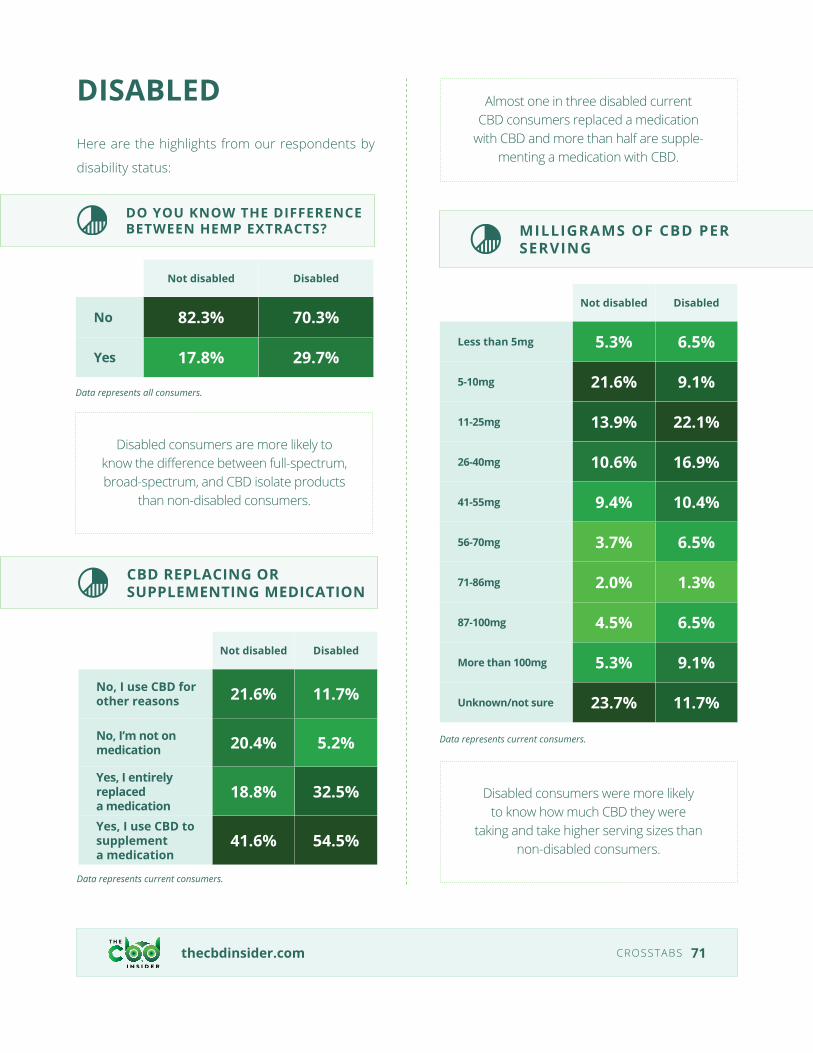
DISABLEDHere are the highlights from our respondents by
disability status:
thecbdinsider.com CROSSTABS 71
DO YOU KNOW THE DIFFERENCE BETWEEN HEMP EXTRACTS? MILLIGRAMS OF CBD PER
SERVING
Not disabled Disabled
No 82.3% 70.3%
Yes 17.8% 29.7%
Not disabled Disabled
Less than 5mg 5.3% 6.5%
5-10mg 21.6% 9.1%
11-25mg 13.9% 22.1%
26-40mg 10.6% 16.9%
41-55mg 9.4% 10.4%
56-70mg 3.7% 6.5%
71-86mg 2.0% 1.3%
87-100mg 4.5% 6.5%
More than 100mg 5.3% 9.1%
Unknown/not sure 23.7% 11.7%
Data represents all consumers.
Data represents current consumers.
CBD REPLACING OR SUPPLEMENTING MEDICATION
Not disabled Disabled
No, I use CBD for other reasons 21.6% 11.7%
No, I’m not on medication 20.4% 5.2%
Yes, I entirely replaced a medication
18.8% 32.5%
Yes, I use CBD to supplement a medication
41.6% 54.5%
Data represents current consumers.
Disabled consumers are more likely to know the difference between full-spectrum, broad-spectrum, and CBD isolate products
than non-disabled consumers.
Almost one in three disabled current CBD consumers replaced a medication
with CBD and more than half are supple-menting a medication with CBD.
Disabled consumers were more likely to know how much CBD they were
taking and take higher serving sizes than non-disabled consumers.
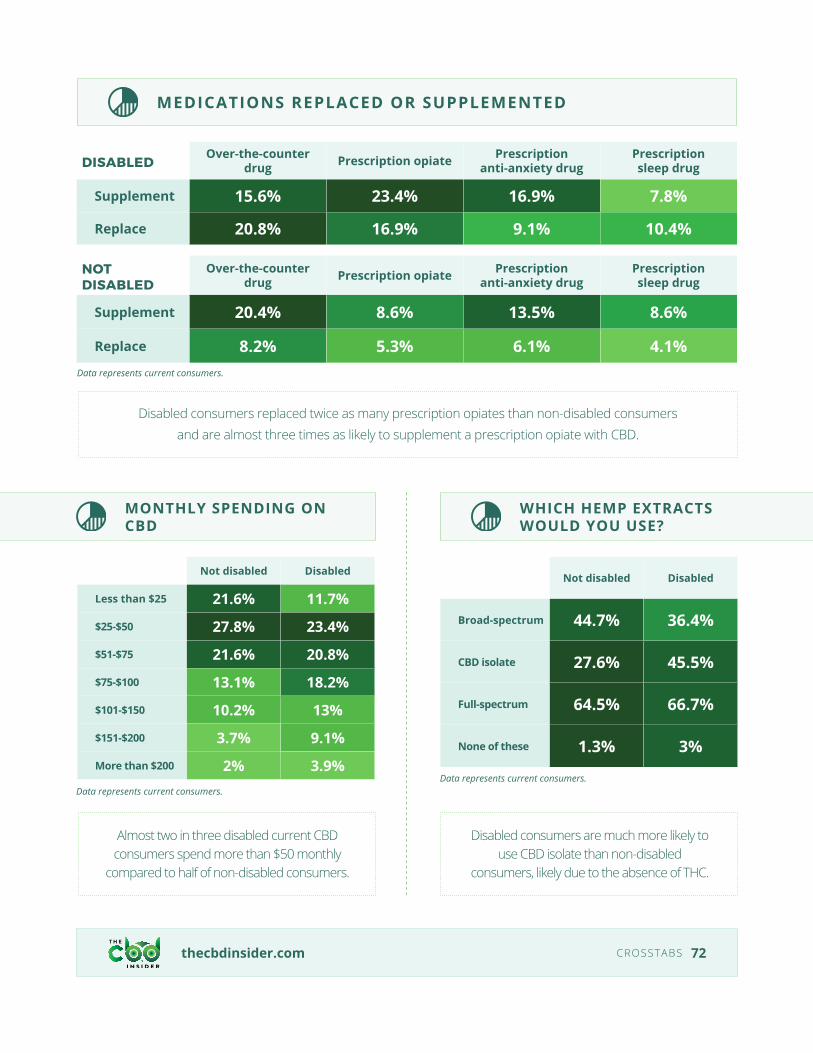
thecbdinsider.com CROSSTABS 72
MEDICATIONS REPLACED OR SUPPLEMENTED
DISABLED Over-the-counter drug Prescription opiate Prescription
anti-anxiety drugPrescription sleep drug
Supplement 15.6% 23.4% 16.9% 7.8%
Replace 20.8% 16.9% 9.1% 10.4%
NOT DISABLED
Over-the-counter drug Prescription opiate Prescription
anti-anxiety drugPrescription sleep drug
Supplement 20.4% 8.6% 13.5% 8.6%
Replace 8.2% 5.3% 6.1% 4.1%Data represents current consumers.
MONTHLY SPENDING ON CBD
WHICH HEMP EXTRACTS WOULD YOU USE?
Not disabled Disabled
Less than $25 21.6% 11.7%
$25-$50 27.8% 23.4%
$51-$75 21.6% 20.8%
$75-$100 13.1% 18.2%
$101-$150 10.2% 13%
$151-$200 3.7% 9.1%
More than $200 2% 3.9%
Not disabled Disabled
Broad-spectrum 44.7% 36.4%
CBD isolate 27.6% 45.5%
Full-spectrum 64.5% 66.7%
None of these 1.3% 3%
Data represents current consumers.Data represents current consumers.
Disabled consumers replaced twice as many prescription opiates than non-disabled consumers and are almost three times as likely to supplement a prescription opiate with CBD.
Almost two in three disabled current CBD consumers spend more than $50 monthly
compared to half of non-disabled consumers.
Disabled consumers are much more likely to use CBD isolate than non-disabled
consumers, likely due to the absence of THC.
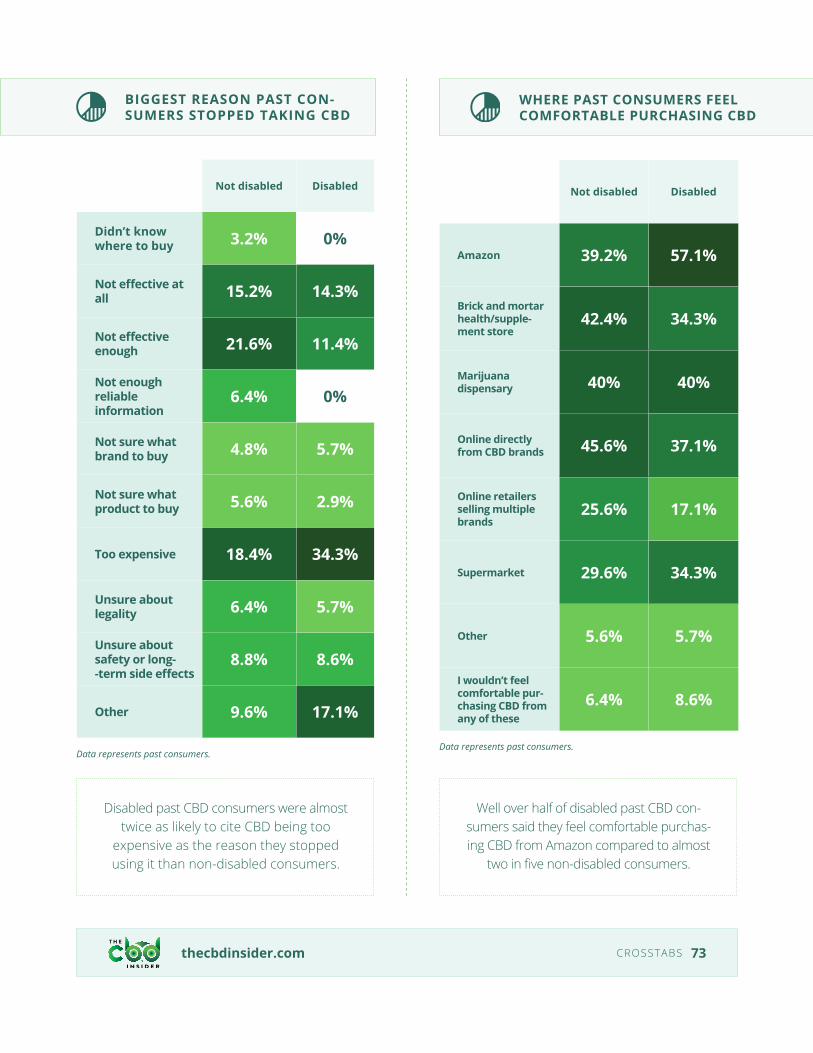
thecbdinsider.com CROSSTABS 73
BIGGEST REASON PAST CON-SUMERS STOPPED TAKING CBD
WHERE PAST CONSUMERS FEEL COMFORTABLE PURCHASING CBD
Not disabled Disabled
Didn’t know where to buy 3.2% 0%
Not effective at all 15.2% 14.3%
Not effective enough 21.6% 11.4%
Not enough reliable information
6.4% 0%
Not sure what brand to buy 4.8% 5.7%
Not sure what product to buy 5.6% 2.9%
Too expensive 18.4% 34.3%
Unsure about legality 6.4% 5.7%
Unsure about safety or long--term side effects
8.8% 8.6%
Other 9.6% 17.1%
Not disabled Disabled
Amazon 39.2% 57.1%
Brick and mortar health/supple-ment store
42.4% 34.3%
Marijuana dispensary 40% 40%
Online directly from CBD brands 45.6% 37.1%
Online retailers selling multiple brands
25.6% 17.1%
Supermarket 29.6% 34.3%
Other 5.6% 5.7%
I wouldn’t feel comfortable pur-chasing CBD from any of these
6.4% 8.6%
Data represents past consumers.Data represents past consumers.
Disabled past CBD consumers were almost twice as likely to cite CBD being too
expensive as the reason they stopped using it than non-disabled consumers.
Well over half of disabled past CBD con-sumers said they feel comfortable purchas-ing CBD from Amazon compared to almost
two in five non-disabled consumers.
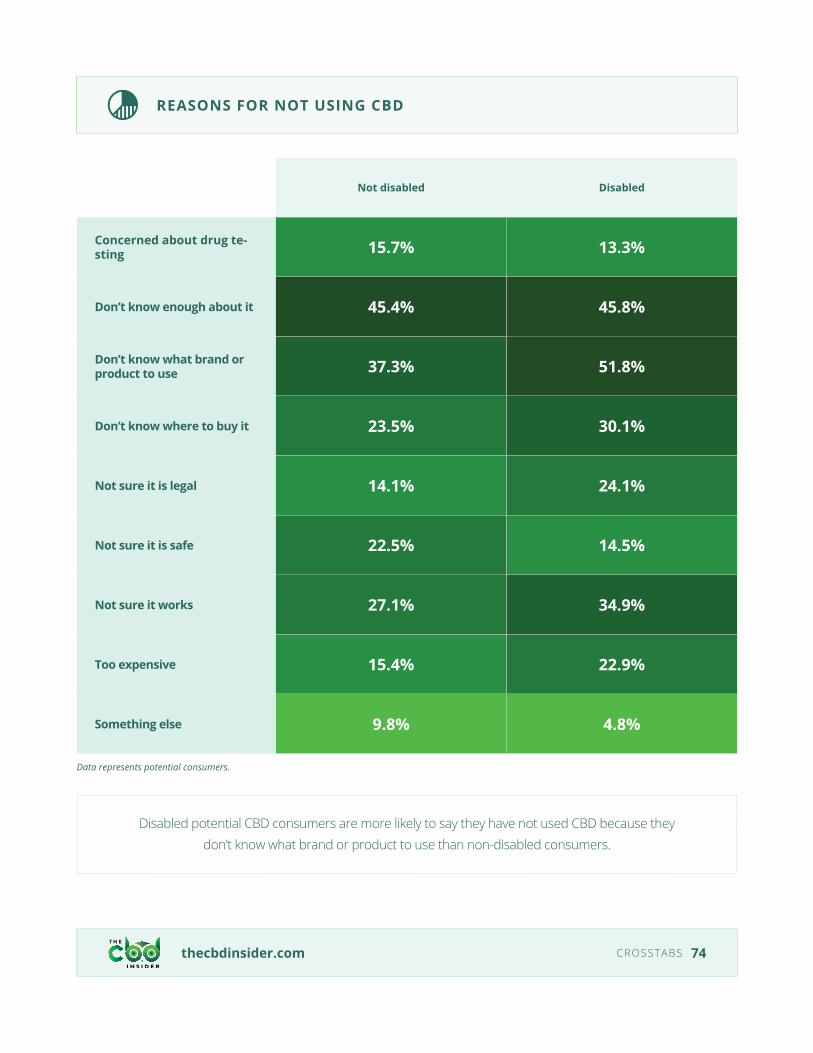
thecbdinsider.com CROSSTABS 74
REASONS FOR NOT USING CBD
Not disabled Disabled
Concerned about drug te-sting 15.7% 13.3%
Don’t know enough about it 45.4% 45.8%
Don’t know what brand or product to use 37.3% 51.8%
Don’t know where to buy it 23.5% 30.1%
Not sure it is legal 14.1% 24.1%
Not sure it is safe 22.5% 14.5%
Not sure it works 27.1% 34.9%
Too expensive 15.4% 22.9%
Something else 9.8% 4.8%
Data represents potential consumers.
Disabled potential CBD consumers are more likely to say they have not used CBD because they don’t know what brand or product to use than non-disabled consumers.
Consumers want to purchase CBD from Amazon, but Amazon’s policies make it tough.
More than one quarter of CBD consumers (26.7%)
reported purchasing products from Amazon and
almost half of all consumers (49.4%) said they
would feel comfortable purchasing from Amazon.
The number of consumers purchasing from
Amazon is surprising because the platform does
not technically allow the sale of CBD. However,
several brands can be found selling “hemp oil” to
skirt the policy. Since it is not allowed to be men-
tioned, buying “CBD” products on Amazon is risky
because consumers cannot be sure how much
CBD is in them, or if there is any at all.
With the expectation that online purchasing will
play a larger role in the future, especially in a
post-COVID-19 era, consumers will likewise expect
Amazon to carry reputable CBD products.
Given the popularity of Amazon and the federal
standing on CBD, we strongly encourage Amazon
to reconsider their policy so that their customers
can purchase CBD quickly and safely.
Some consumers report developing a tolerance to CBD despite the fact scientific research has not observed this phenomenon.
More than one in three CBD consumers (35.1%)
said they developed a tolerance to CBD, requiring
them to increase their serving size on multiple
occasions over time.
According to the 2018 Critical Review Report on
CBD by the World Health Organization (WHO),
“CBD exhibits no effects indicative of any abuse or
dependence potential.”
Dependence is characterized by tolerance and
withdrawal, meaning the WHO has not found
any research to indicate that humans or animals
build a tolerance to CBD. The WHO’s 2018 report
only mentions one animal study that observed no
tolerance to CBD at any dosage. No data from
human research studying tolerance were available
at the time.
In light of this information, we believe that as
consumers increased their serving sizes in an
attempt to achieve their desired results, they
may have mistook this trial-and-error period as
developing a “tolerance” to CBD.
It seems to us that tolerance is one piece in the
bigger puzzle of determining how much CBD
consumers should be taking.
thecbdinsider.com KEY TAKEAWAYS 75
Key Takeaways
In most human studies, researchers test a
few doses of CBD no less than 100mg—and
much more in many cases—to determine which
dosage is most effective. Usually, the most effective
dosage is more than 100mg.
As a result, we would like to see CBD brands
increase the potency of their products across the
board to reflect the available science.
A lack of education is preventing many potential consumers from trying CBD.
The most common reason potential consumers
cite for not having tried CBD is they do not know
enough about it.
We did identify a couple of groups that displayed
a more robust understanding of CBD within the
potential consumer segment, including
consumers who are disabled or military personnel
and veterans. However, the vast majority are still
in the dark about the fundamentals of CBD, such
as knowing the difference between full-spectrum,
broad-spectrum, and CBD isolate products.
In private conversations with our editorial team,
brand representatives frequently cite their
frustration at their inability to educate customers
due to the legal risk that doing so exposes them
to. While brands are restricted in what they can
say about CBD because of current regulations,
we encourage them to find creative methods for
informing their customers, and to aggres-
sively push for federal regulators to provide
clear guidance on acceptable ways to educate
consumers.
CBD is beginning to displace some medications.
More than one in five current CBD consumers
(22%) have replaced a medication and more than
two in five (44.7%) are supplementing a medica-
tion with CBD. Almost one in ten consumers said
they replaced a prescription opiate (8.1%), which
provides some anecdotal evidence that CBD
may play a role in the solution to the US opioid
epidemic.
With natural and alternative therapies growing
in popularity, it will be interesting to see if CBD
displaces more medications over time.
Brand reputation is important to most consumers, but brand recognition still remains low.
Brand reputation is one of the top three
considerations for current and potential CBD
consumers when making a purchase
decision. However, among all consumers, no
brand received more than 20% brand recognition.
This data indicate that there is plenty of
opportunity for brands to create loyal
followings; however, because of current bans on
advertisements featuring CBD, companies cannot
always effectively promote their brands.
thecbdinsider.com KEY TAKEAWAYS 76
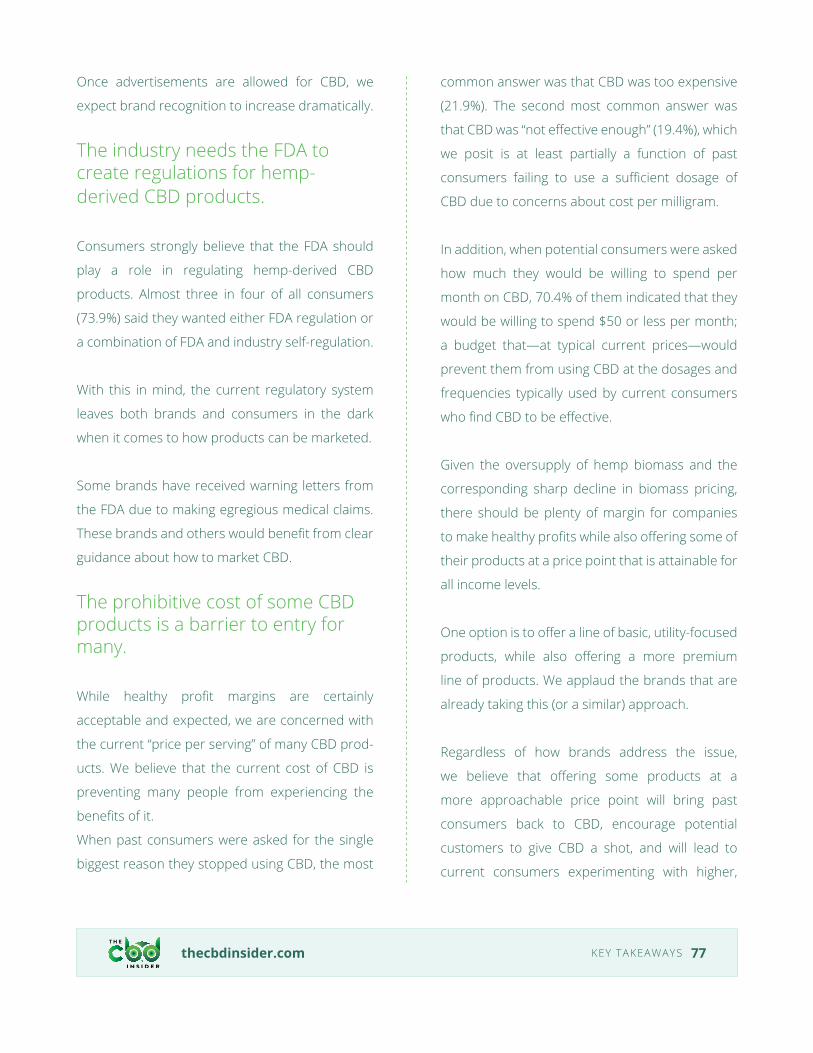
Once advertisements are allowed for CBD, we
expect brand recognition to increase dramatically.
The industry needs the FDA to create regulations for hemp-derived CBD products.
Consumers strongly believe that the FDA should
play a role in regulating hemp-derived CBD
products. Almost three in four of all consumers
(73.9%) said they wanted either FDA regulation or
a combination of FDA and industry self-regulation.
With this in mind, the current regulatory system
leaves both brands and consumers in the dark
when it comes to how products can be marketed.
Some brands have received warning letters from
the FDA due to making egregious medical claims.
These brands and others would benefit from clear
guidance about how to market CBD.
The prohibitive cost of some CBD products is a barrier to entry for many.
While healthy profit margins are certainly
acceptable and expected, we are concerned with
the current “price per serving” of many CBD prod-
ucts. We believe that the current cost of CBD is
preventing many people from experiencing the
benefits of it.
When past consumers were asked for the single
biggest reason they stopped using CBD, the most
common answer was that CBD was too expensive
(21.9%). The second most common answer was
that CBD was “not effective enough” (19.4%), which
we posit is at least partially a function of past
consumers failing to use a sufficient dosage of
CBD due to concerns about cost per milligram.
In addition, when potential consumers were asked
how much they would be willing to spend per
month on CBD, 70.4% of them indicated that they
would be willing to spend $50 or less per month;
a budget that—at typical current prices—would
prevent them from using CBD at the dosages and
frequencies typically used by current consumers
who find CBD to be effective.
Given the oversupply of hemp biomass and the
corresponding sharp decline in biomass pricing,
there should be plenty of margin for companies
to make healthy profits while also offering some of
their products at a price point that is attainable for
all income levels.
One option is to offer a line of basic, utility-focused
products, while also offering a more premium
line of products. We applaud the brands that are
already taking this (or a similar) approach.
Regardless of how brands address the issue,
we believe that offering some products at a
more approachable price point will bring past
consumers back to CBD, encourage potential
customers to give CBD a shot, and will lead to
current consumers experimenting with higher,
thecbdinsider.com KEY TAKEAWAYS 77
potentially more effective dosages.
The anecdotal evidence surrounding CBD warrants increased scientific research.
Most current consumers reported finding CBD
extremely or very effective for the reasons they
were using it. Add to this the fact that more than
one in five consumers (22%) replaced a medica-
tion with CBD and there is plenty of anecdotal
evidence that CBD is beneficial.
While some studies have been and are being
conducted, the data indicate much more research
is necessary to prove what CBD is most useful for.
Content advertised on or by The CBD Insider, on its website, in any reports, or any social media
platform affiliated with The CBD Insider, is for informational purposes only. The CBD Insider
doesn’t offer medical advice and the content within this report is not intended for medical advice,
diagnosis, or treatments, and has not been evaluated by the FDA. We recommend consulting with
your healthcare professional before using any products discussed in this report.
thecbdinsider.com KEY TAKEAWAYS 78