the ceo poverty measure, 2005 - 2011 - new york city
TRANSCRIPT
The CEO Poverty Measure, 2005 - 2011
An Annual Report by the NYC Center for Economic Opportunity
April 2013
The CEO Poverty Measure, 2005 - 2011
An Annual Report by the NYC Center for Economic Opportunity
April 2013


Table of ConTenTs
PREFACE AND ACKNOWLEDGMENTS ............................................................................................. i
EXECUTIVE SUMMARY ................................................................................................................... iii
I. INTRODUCTION .......................................................................................................................... 1 1.1TheOfficialPovertyMeasure ............................................................................................. 1 1.2TheNationalAcademyofSciences’Alternative ................................................................. 2 1.3TheSupplementalPovertyMeasure ................................................................................... 2 1.4CEO’sAdoptionoftheNAS/SPMMethod .......................................................................... 2 1.5ComparingPovertyRates ................................................................................................... 5 1.6TheNewYorkCityLaborMarket ....................................................................................... 6 1.7KeyFindingsinThisReport................................................................................................7
II. POVERTY IN NEW YORK CITY, 2005 - 2011 ................................................................................ 9 2.1NewYorkCityPovertyRates,2005-2011 ......................................................................... 9 2.2TheDepthofPovertyandExtentofNearPoverty ............................................................. 13 2.3TheEffectofNon-CashResourcesontheCEOPovertyRate............................................. 14
III. CEO POVERTY RATES IN DEMOGRAPHIC DETAIL, 2005 - 2011 ............................................. 19 3.1PovertyRatesbyDemographicCharacteristicoftheIndividual ........................................ 19 3.2PovertyRatesbyFamilyCharacteristic ............................................................................. 22 3.3PovertyRatesbyBorough ............................................................................................... 25
IV. ALTERNATIVE POVERTY MEASURES IN THE U.S. AND NEW YORK CITY ................................ 27 4.1PovertyRatesbyAgeGroup ............................................................................................ 27 4.2ExtremePoverty ............................................................................................................... 28 4.3ChangesintheSPMandCEOPovertyRates,2009-2011 ............................................... 28
V. POLICY AFFECTS POVERTY ....................................................................................................... 31 5.1MeasuringtheEffectsofNewandExpandedTaxCredits .................................................. 31 5.2MeasuringtheEffectofChangesinFoodStampPolicy .................................................... 34 5.3PolicyAffectsIncome ...................................................................................................... 35 5.4PolicyAffectsPoverty ....................................................................................................... 37
VI: IN CONCLUSION ..................................................................................................................... 39
APPENDIX A: THE POVERTY UNIVERSE AND UNIT OF ANALYSIS ............................................... 41 APPENDIXB:DERIVINGAPOVERTYTHRESHOLDFORNEWYORKCITY .................................. 43 APPENDIX C: ADJUSTMENT FOR HOUSING STATUS .................................................................. 47 APPENDIX D: THE CEO TAX MODEL ............................................................................................. 56 APPENDIX E: ESTIMATING THE VALUE OF NUTRITIONAL ASSISTANCE ...................................... 64 APPENDIXF:ESTIMATINGTHEVALUEOFHEAPBENEFITS ......................................................... 76 APPENDIX G: WORK-RELATED EXPENSES .................................................................................... 78 APPENDIX H: MEDICAL OUT-OF-POCKET EXPENDITURES .......................................................... 84 APPENDIX I: ACCURACY OF THE DATA ........................................................................................ 88


Preface & Acknowledgments i
NYC Center for Economic Opportunity nyc.gov/ceo
PrefaCe and aCknowledgmenTs
In2006,NewYorkCityMayorMichaelR.BloombergconvenedaCommissiononEconomicOpportunity,directingittocraftinnovativeapproachestoreducingpovertyintheCity.TheCommissionmemberstookabroadviewoftheirmandate.What,theyasked,arewetryingtoreduce?Howdoweknowifwearesucceeding?Toanswerquestionslikethese,policymakersneedbroadsocialindicators.TheCommissionerssoonlearnedwhatsocialscientistshaveknownfordecades:thenation’sfifty-year-oldmeasureofpovertynolongerprovidesusefulinformation.Inthe1960s,thepovertymeasurewasafocalpointforthenation’sgrowingconcernaboutpoverty.Overthedecades,societyevolvedandpolicieshaveshifted,buttheofficialpovertymeasureremainsfrozenintime.Asaresult,ithassteadilylostcredibilityandusefulness.TheCommissionersconcludedthat,alongwithnewprograms,theCityneededtodevelopanewmeasureofpoverty.MayorBloombergembracedtheCommission’srecommendationandthedevelopmentofanimprovedmeasureofpovertybecameaprojectoftheorganizationhecreatedtoimplementtheCommission’srecommendations,theNewYorkCityCenterforEconomicOpportunity(CEO).
TherehasbeennoshortageofproposalsforimprovingthewayAmericacountsitspoor.Themostinfluentialofthesewasdeveloped,attherequestofCongress,bytheNationalAcademyofSciences(NAS).AlthoughtheNAS’sproposalwasissuedin1995,neithertheFederalnoranyotherbranchofgovernmenthadadoptedthisapproachuntil2008whenCEOreleaseditsfirstworkingpaperonpovertyinNewYorkCity.Thisstudy–ourfifth–continuesourpracticeofissuingannualupdatesofourmeasure.
Wehavenotbeenaloneinthiswork.Inrecentyears,CEOhasbeenjoinedbyotherstateandlocalpovertymeasurementinitiatives.Todate,NAS-style,state-levelpovertymeasureshavebeendevelopedforNewYork,Connecticut,Georgia,Illinois,Massachusetts,Minnesota,andWisconsin,alongwiththecity(andmetroarea)ofPhiladelphia.Alltheseprojectshavebeenenormouslyhelpfultoourwork.WehavebenefitedfromthewisdomofGeorgeFalcoandJihyunShinattheNewYorkStateOfficeofTemporaryandDisabilityAssistance;MarkSternoftheUniversityofPennsylvania;LindaGiannarelli,LauraWheaton,andSheilaZedlewskiattheUrbanInstitute;andJuliaIsaacsandTimothySmeedingattheUniversityofWisconsin’sInstituteforResearchonPoverty.
In2011,theU.S.BureauoftheCensusbeganreleasingannualreportsonpovertyintheUnitedStatesusinganewSupplementalPovertyMeasure,whichisalsobasedontheNASrecommendations.ToenhancethecommensurabilityofourworkwiththenewFederalmeasure,CEOrevisedsomeelementsofourapproach.OurcolleaguesattheCensusBureau,DavidJohnson,KathleenShort,andTrudiRenwick,aswellasThesiaGarnerattheBureauofLaborStatistics–friendsoftheCEOprojectsinceitsinception–havebeenparticularlyhelpfulinthiswork.
Fromtheearlieststagesofoureffort,wehavebenefitedfromopportunitiestopresentourworktootherscholarsandpolicypractitioners.TheBrookingsInstitutionCenteronChildrenandFamilieshostedanumberofmeetings,someatCEO’srequest,wheremanyofthenation’sleadingpovertyexpertsnotonlysharedtheirwork,butofferedusadviceforimprovingourmeasure.WeneedtorecognizethegenerosityofRonHaskins,theCenter’sCo-Director,aswellasthewisdomofthosewhohaveattendedtheseevents.CEOhasalsopresentedourworkatanumberofconferences,includingannualmeetingsoftheAssociationforPublicPolicyandManagement,theNationalAssociationforWelfareResearchandStatistics,theAmericanStatisticalAssociation,theInternationalAssociationforResearchinIncomeandWealth,andtheAdministrationforChildrenandFamilies’WelfareResearchandEvaluationConference.ThankstoagrantfromtheRIDGECenterforNationalFoodandNutritionAssistanceResearchattheUniversityofWisconsin’sInstituteforResearchonPoverty,wewereabletopresentourworkonvaluingFoodStampbenefitstoexpertsinthisfield.Inthecourseofallthiswehaveamassedaconsiderabledebt.Inadditiontothosementionedabove,wewishtoacknowledgeJessicaBanthin,RichardBavier,DavidBetson,RebeccaBlank,GaryBurtless,ConstanceCitro,SharonO’Donnell,IrvGarfinkel,MarkGreenberg,AmyO’Hara,NathanHutto,JohnIceland,DottieRosenbaum,IsabelleSawhill,KarlScholz,ArlocSherman,SharonStern,JaneWaldfogel,andJamesZiliak.
Closertohome,VickyVirgin,demographicanalystatthePopulationDivisionofNewYorkCityDepartmentofCityPlanning,hasmadeimportantcontributionsthroughouttheproject.Shedeservesspecialthanks,asdoesDr.JosephSalvo,thePopulationDivision’sDirector.ManyothercolleaguesinCitygovernmenthavesharedtheirexpertiseaboutpublicpolicy,theCity’sadministrationofbenefitprograms,andagency-leveldata.SondraSanchez,DirectorofHEAPandTraceyThorne,DirectorofProgramandPolicyAnalysis,Office

NYC Center for Economic Opportunity nyc.gov/ceo
ii The CEO Poverty Measure, 2005 - 2011
ofEmergencyandInterventionServicesattheCity’sHumanResourcesAdministration,provideddataandinsightontheHomeEnergyAssistanceProgram;RobertDeschak,attheDepartmentofEducation’sOfficeofSchoolSupportServices,shareddataonschoolmeals;andJacksonP.Sekhobo,Director,EvaluationandAnalysisUnit,DivisionofNutrition,NewYorkStateDepartmentofHealth,provideddataonparticipationintheWICprogram.ThanksarealsoduetoRobertDoar,Commissioner;AngelaSheehan,DeputyCommissionerforEvaluationandResearch;andHildyDworkin,librarian,attheCity’sHumanResourcesAdministrationfortheircontinuedsupport.
Staffatothergovernmentagenciesthatalsoassistedusinclude:RamchalKaveeta,MetropolitanTransitAuthority;ToddGoldman,PortAuthorityofNewYorkandNewJersey;JessicaSemega,HousingandHouseholdEconomicStatisticsDivision,U.S.BureauoftheCensus;MahdiSundukchi,DemographicStatisticalMethodsDivision,U.S.BureauoftheCensus;andLyndaLaughlin,Social,EconomicandHousingStatisticsDivision,U.S.BureauoftheCensus.
OvertheyearswehavealsoamassedaconsiderabledebttopastandpresentCEOcolleagues,includingDavidBerman,AllegraBlackburn-Dwyer,CoreyChambliss,KateDempsey,PatrickHart,AnnelHernandez,CarsonHicks,SusanneJames,SineadKeegan,MosesMagali,CarmenGenao-Maria,EmmaOppenheim,ArturoReyes,DorickScarpelli,CarlUrness,JoshuaWheatley,andJeromeWhite.LastsummerwewerejoinedbystudentinternsNikhilGahlawatandMayaOrtiz.Wethankthemfortheirveryableassistance.AdebtofgratitudeisalsoowedtoKristinMisner,ChiefofStafftotheDeputyMayorforHealthandHumanServices.
ThisreportwasauthoredbyChristineD’Onofrio,Ph.D.,JohnKrampner,DanielScheer,andToddSeidel,alongwithmyself.Sinceitsinception,ourworkreliedontheleadershipofVeronicaWhite,CEO’sfoundingExecutiveDirector.Hercommitmenttothisprojectwassimplyindispensible.ThisyearwegratefullyacknowledgetheleadershipandsupportofKristinMorse,CEO’scurrentExecutiveDirector.WeextendourlastthankyoutoLindaGibbs,NewYorkCityDeputyMayorforHealthandHumanServices.Hercommitmenttothisprojecthasbeensteadfast,enthusiastic,andessential.
MarkLevitan,Ph.D. DirectorofPovertyResearch OnbehalfoftheNewYorkCityCenterforEconomicOpportunity
desi
gn: P
urpl
e Ga
te D
esig
n w
ww.
pur
pleg
ated
esig
n.co
m
Executive Summary iii
NYC Center for Economic Opportunity nyc.gov/ceo
exeCuTive summary
Thisyear’sCenterforEconomicOpportunity(CEO)reportonpovertyinNewYorkCityreflectsaturningpoint.Ourtwopriorannualreportsdocumentedthegrowingimportanceofthesocialsafetynetatatimewhenthejobmarketwascontractingandearnedincomewasindecline.Formanylow-incomefamilies,thedistancebetweentheirearningsandthepovertylinewidened.Atthesametimethesafetynetexpanded,fillingsome,butnotall,ofthegap.Asaconsequence,from2008to2010,theCitypovertyraterose.
The2011datawepresentinthisreportcoincidewithashiftintheeconomicenvironment.Afteratwo-yearfall,theproportionofworkingageNewYorkersholdingajobrose.Althoughannualearningsdidnotriseforfamiliesvulnerabletopoverty,theirrecession-relateddeclinewasarrested.Thestabilizationinearningsalongwithexpandedtaxinitiatives(especiallythepayrolltaxcutthattookeffectin2011)andacontinuingincreaseinenrollmentintheFoodStampprogrampushedourbroadmeasureoffamilyresourceshigher.Theincreasewaslargeenoughtooffsettheyear-to-yearriseintheCEOpovertythreshold.Asaresult,the2011CEOpovertyrate,21.3percent,isstatisticallyunchangedfromtheprioryear,whenitstoodat20.9percent.
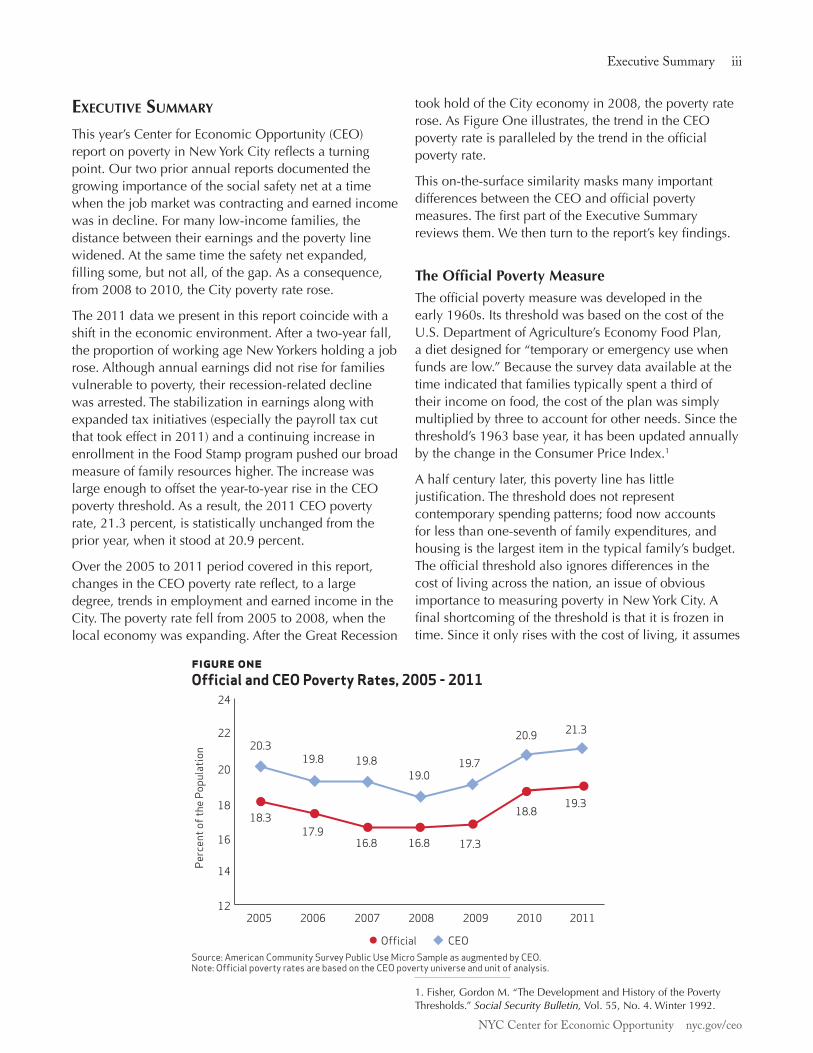
Overthe2005to2011periodcoveredinthisreport,changesintheCEOpovertyratereflect,toalargedegree,trendsinemploymentandearnedincomeintheCity.Thepovertyratefellfrom2005to2008,whenthelocaleconomywasexpanding.AftertheGreatRecession
tookholdoftheCityeconomyin2008,thepovertyraterose.AsFigureOneillustrates,thetrendintheCEOpovertyrateisparalleledbythetrendintheofficialpovertyrate.
Thison-the-surfacesimilaritymasksmanyimportantdifferencesbetweentheCEOandofficialpovertymeasures.ThefirstpartoftheExecutiveSummaryreviewsthem.Wethenturntothereport’skeyfindings.
The Official Poverty MeasureTheofficialpovertymeasurewasdevelopedintheearly1960s.ItsthresholdwasbasedonthecostoftheU.S.DepartmentofAgriculture’sEconomyFoodPlan,adietdesignedfor“temporaryoremergencyusewhenfundsarelow.”Becausethesurveydataavailableatthetimeindicatedthatfamiliestypicallyspentathirdoftheirincomeonfood,thecostoftheplanwassimplymultipliedbythreetoaccountforotherneeds.Sincethethreshold’s1963baseyear,ithasbeenupdatedannuallybythechangeintheConsumerPriceIndex.1
Ahalfcenturylater,thispovertylinehaslittlejustification.Thethresholddoesnotrepresentcontemporaryspendingpatterns;foodnowaccountsforlessthanone-seventhoffamilyexpenditures,andhousingisthelargestiteminthetypicalfamily’sbudget.Theofficialthresholdalsoignoresdifferencesinthecostoflivingacrossthenation,anissueofobviousimportancetomeasuringpovertyinNewYorkCity.Afinalshortcomingofthethresholdisthatitisfrozenintime.Sinceitonlyriseswiththecostofliving,itassumes
1.Fisher,GordonM.“TheDevelopmentandHistoryofthePovertyThresholds.”Social Security Bulletin, Vol.55,No.4.Winter1992.
figure oneOfficial and CEO Poverty Rates, 2005 - 2011
Source: American Community Survey Public Use Micro Sample as augmented by CEO. Note: Official poverty rates are based on the CEO poverty universe and unit of analysis.
Perc
ent o
f the
Pop
ulat
ion
2005 2006 2007 2008 2009 2010 2011
Official CEO
12
14
16
18
20
22
24
18.317.9
16.8 16.8 17.3
18.819.3
20.9 21.3
19.719.0
19.819.820.3

NYC Center for Economic Opportunity nyc.gov/ceo
iv The CEO Poverty Measure, 2005 - 2011
thatastandardoflivingthatdefinedpovertyintheearly1960sremainsappropriate,despiteadvancesinthenation’sstandardoflivingsincethattime.
Theofficialmeasure’sdefinitionoftheresourcesthatarecomparedagainstthethresholdispre-taxcash.Thisincludeswages,salaries,andearningsfromself-employment;incomefrominterest,dividends,andrents;andsomeofwhatfamiliesreceivefrompublicprograms,iftheytaketheformofcash.Thus,paymentsfromUnemploymentInsurance,SocialSecurity,SupplementalSecurityIncome,andpublicassistanceareincludedintheofficialresourcemeasure.
Giventhedataavailableandthepoliciesinplaceatthetime,thiswasnotanunreasonabledefinition.Butinrecentyearsanincreasingshareofwhatgovernmentprogramsdotosupportlow-incomefamiliestakestheformoftaxcredits(suchastheEarnedIncomeTaxCredit)andin-kindbenefits(suchasFoodStamps).
Measures of Poverty
Official: The current official poverty measure was de-veloped in the early 1960s. It consists of a set of thresh-olds that were based on the cost of a minimum diet at that time. A family’s pre-tax cash income is compared against the threshold to determine whether its mem-bers are poor.
NAS: At the request of Congress, the National Academy of Sciences issued a set of recommendations for an im-proved poverty measure in 1995. Although the proposal did not become the new official poverty measure, staff at the Census Bureau, Bureau of Labor Statistics, and other researchers created a body of research that was based on the NAS proposal.
SPM: In March 2010 the Obama Administration an-nounced that the Census Bureau, in cooperation with the Bureau of Labor Statistics, would create a Supple-mental Poverty Measure based on the NAS recommen-dations, subsequent research, and a set of guidelines proposed by an Interagency Working Group. The first report on poverty using this measure was issued by the Census Bureau in November 2011.
CEO: The Center for Economic Opportunity released its first report on poverty in New York City in August 2008. CEO’s poverty measure is based on the NAS recommen-dations and the guidelines from the SPM Interagency Working Group.
Ifpolicymakersorthepublicwanttoknowhowthese programsaffectpoverty,theofficialmeasurecannotprovideananswer.
The National Academy of Sciences’ AlternativeDissatisfactionwiththeofficialmeasurepromptedCongresstorequestastudybytheNationalAcademyofSciences(NAS).TheNAS’srecommendationsforanimprovedmeasurewereissuedin1995.2Theysparkedfurtherresearchandgarneredwidespreadsupportamongpovertyexperts.3TheNAStookaconsiderablydifferentapproachtoboththethresholdandresourcesideofthepovertymeasure.Itspovertythresholdreflectstheneedforclothing,shelter,andutilitiesaswellasfood.Itisestablishedbyselectingasub-groupoffamiliesasreferencefamilies,4calculatingtheirspendingontheseitems,andthenchoosingapointintheresultingexpendituredistribution.5Asmallmultiplierisappliedtoaccountformiscellaneousexpensessuchaspersonalcare,householdsupplies,andnon-work-relatedtransportation.Thethresholdisupdatedeachyearbythechangeinthelevelofthisspending.Thisconnectsthethresholdtothegrowthinlivingstandards.Infurthercontrasttotheofficialmeasure,theNASproposedthatthepovertylinebeadjustedtoreflectgeographicdifferencesinhousingcosts.
Ontheresourceside,theNASmeasureisdesignedtoaccountfortheflowofincomeandin-kindbenefitsthatafamilycanusetomeettheneedsrepresentedinthethreshold.Thiscreatesamuchmoreinclusivemeasureofincomethanpre-taxcash.Thetaxsystemandthecash-equivalentvalueofin-kindbenefitsforfoodandhousingcreateimportantadditionstofamilyresources.Butfamiliesalsohavenon-discretionaryexpensesthatreducetheincomeavailabletomeettheirotherneeds.Theseincludethecostofchildcare,commutingtowork,andmedicalcarethatmustbepaidforoutofpocket.Thisnon-discretionaryspendingisaccountedforasdeductionsfromincome.
2.Citro,ConstanceF.andRobertT.Michael(eds).Measuring Poverty: A New Approach.Washington,DC:NationalAcademyPress.1995.3.MuchoftheresearchinspiredbytheNASreportisavailableat:www.census.gov/hhes/povmeas/methodology/nas/index.html4.TheNASreferencefamiliesarethosecomposedoftwoadultsandtwochildren.Thethresholdforthisfamilyisthenscaledforfamiliesofdifferentsizesandcompositions.SeeAppendixB.5.TheNASsuggestedthatthispointliebetweenthe30th and35thpercentile.CitroandMichael,p.106.

Executive Summary v
NYC Center for Economic Opportunity nyc.gov/ceo
CEO’s Adoption of the NAS/SPM MethodLikeCEO’smeasure,theCensusBureau’snewSupplementalPovertyMeasure(SPM)isalsoshapedbytheNASrecommendationsalongwithasetofguidelinesprovidedbyanInteragencyTechnicalWorkingGroupinMarch2010.6TheguidelinesincorporatedworkbyresearchersattheCensusBureau,BureauofLaborStatistics,andotherssubsequenttotheoriginalNASreport.Manyoftheserecommendationsarereflectedinourmeasure.
CEObasesourNewYorkCity-specificpovertythresholdontheU.S.-widethresholddevelopedfortheSPM.Weadjustthenational-levelthresholdtoaccountfortherelativelyhighcostofhousinginNewYorkCitybyapplyingtheratiooftheNewYorkCitytotheU.S.-wideFairMarketRentforatwo-bedroomapartmenttothehousingportionofthethreshold.7In2011,ourpovertylineforthetwo-adult,two-childfamilycomesto$30,949.WerefertothisNewYorkCity-specificthresholdastheCEOpovertythreshold.The2011officialpovertythresholdforthecorrespondingfamilywas$22,811.
Poverty Thresholds
Official: The official threshold was developed in the early 1960s and was based on the cost of a minimum diet at that time. It is updated each year by the change in consumer prices. It is uniform across the United States.
CEO: The CEO poverty threshold is a New York City-specific threshold derived from the U.S.-wide thresh-old developed for the Federal Supplemental Poverty Measure. The threshold is based on what families spend on basic necessities: food, clothing, shelter, and utilities. It is adjusted to reflect the variation in housing costs across the United States.
6. Observations from the Interagency Technical Working Group on Developing a Supplemental Poverty Measure.March2010.Availableat:www.census.gov/hhes/www/poverty/SPM_TWGObservations.pdf7.DetailsofthecalculationaregiveninAppendixB.
Measuring Income
Official Income: The official poverty measure’s defini-tion of family resources is pre-tax cash. This includes income from all sources such as earnings, interest, and government transfer payments that take the form of cash. Thus, Social Security benefits are included in this measure, but the value of in-kind benefits such as Food Stamps or tax credits such as the Earned Income Tax Credit are not counted.
CEO Income: Based on the NAS recommendations, CEO income includes all the elements of pre-tax cash plus the effect of income and payroll taxes, and the value of in-kind nutritional and housing assistance. Non-discre-tionary spending for commuting to work, childcare, and out-of-pocket medical care are accounted for as deduc-tions from income.
Obviously,ifthisweretheonlychangeCEOhadmadetothepovertymeasure,itwouldleadtoapovertyratehigherthantheofficialrate.But,asdescribedabove,CEOalsousesafardifferentmeasureofincometocompareagainstthepovertythreshold.Althoughourmeasureincludessubtractionsaswellasadditionstoresources,CEOincomeishigherthanpre-taxcashincomeatthelowerrungsoftheincomeladder.Atthe20thpercentile,forexample,CEOincomewas$30,195in2011.Thecorrespondingfigureforpre-taxcashwasonly$22,944.Thus,ifamorecompleteaccountofresourceshadbeentheonlychangewehadmadetothepovertymeasure,theCEOpovertyratewouldfallbelowtheofficialmeasure.FigureTwoillustratesofficialandCEOincomes,thresholds,andpovertyratesfor2011.TheeffectofthehigherCEOthreshold(35.7percentabovetheofficial)outweighstheeffectofCEO’smorecompletedefinitionofresources(whichis31.6percenthigher,atthe20thpercentile,thantheofficialresourcemeasure),resultinginahigherpovertyrate.In2011,theCEOpovertyratestoodat21.3percentwhiletheofficialratewas19.3percent,a2.0percentagepointdifference.

NYC Center for Economic Opportunity nyc.gov/ceo
vi The CEO Poverty Measure, 2005 - 2011
figure twoOfficial and CEO Thresholds, Incomes, and Poverty Rates, 2011
Source: U.S. Bureau of the Census and American Community Survey Public Use Micro Sample as augmented by CEO. Notes: Incomes are measured at the 20th percentile and stated in family size and composition-adjusted dollars. Official poverty rates are based on the CEO poverty universe and unit of analysis.
Tomeasuretheresourcesavailabletoafamilytomeettheneedsrepresentedbythethreshold,ourpovertymeasureemploysthePublicUseMicroSamplefromtheCensusBureau’sAmericanCommunitySurvey(ACS)asitsprincipaldataset.Theadvantagesofthissurveyforlocalpovertymeasurementarenumerous.TheACSisdesignedtoprovidemeasuresofsocio-economicconditionsonanannualbasisinstatesandlargerlocalities.ItoffersarobustsampleforNewYorkCity(roughly25,000households)andcontainsessentialinformationabouthouseholdcomposition,familyrelationships,andcashincomefromavarietyofsources.
But,asnotedearlier,theNAS-recommendedpovertymeasuregreatlyexpandsthescopeofresourcesthatmustbemeasuredinordertodeterminewhetherafamilyispoor.Unfortunately,theACSprovidesonlysomeoftheinformationneededtoestimatetheseadditionalresources.CEOhasdevelopedavarietyofmodelsthatestimatetheeffectoftaxation,nutritionalandhousingassistance,work-relatedexpenses,andmedicalout-of-pocketexpendituresontotalfamilyresourcesandpovertystatus.Wereferencetheresultingdatasetasthe“AmericanCommunitySurveyPublicUseMicroSampleasaugmentedbyCEO”andwerefertoourestimateoffamilyresourcesas“CEOincome.”
This Year’s ReportThefocusofthisyear’sCEOworkingpaperisonpovertyinNewYorkCitysince2008,aperiodofrecession,thenlingeringweakness,and,mostrecently,recoveryintheeconomy.From2008to2010,labormarketindicatorsforCityresidentspointedsouth.Adecliningproportionoftheworkingagepopulationwasemployed.AsFigureThreeillustrates,theshareofNewYorkers18through64yearsofagewhowereholdingajobatthetimetheyweresurveyedpeakedin2008at70.8percent.Thatproportiondeclinedto66.4percentby2010.Butin2011,itroseto67.0percent.
figure threeEmployment/Population Ratios, 2005 - 2011
Source: American Community Survey Public Use Micro Sample.
Becausepovertystatusisdeterminedbyannualincome,employmentoverthecourseofayearisaparticularlysalientlabormarketindicator.FigureFourshowsthattheshareoftheworkingagepopulationwithsteadywork,definedas50ormoreweeksintheprior12months,declinedfrom59.8percentin2008to56.3percentin2010,whiletheproportionofthepopulationthathadnoworkatallgrewfrom23.5percentin2008to27.3percent2010.Thisindicatorstabilizedin2011.
$22,811
OfficialThresholds Incomes Poverty Rates
$22,944
$30,945
CEO Official CEO Official CEO
$30,195
19.3% 21.3%
Perc
ent o
f 18
thro
ugh
64-Y
ear-
Olds
2005 2006 2007 2008 2009 2010
67.068.7 69.3
70.868.2
66.4
2011
67.0
50
55
60
65
70
75

Executive Summary vii
NYC Center for Economic Opportunity nyc.gov/ceo
figure fourWeeks Worked in Prior 12 Months, 2008 - 2011
Source: American Community Survey Public Use Micro Sample.
The2008to2010declineinweeksworkedisreflectedinmeasuresofearnings.TableOnereportsperfamilyearningsforthosefamilieswhoseearningswouldputthemneartheCEOpovertythreshold(betweenthe25thand40thpercentileoftheearningsdistribution).Thedeclinesrangefrom14.6percentto11.2percentfrom2008to2010.Thedeclineinearningsendsin2011,alsoechoingthepatterninweeksworked.
Thejobmarketplaysanimportant roleinyear-to-yearchangesintheCEOpovertyrate.Butitseffecttakesplacewithinthebroadscopeofourmeasureoffamilyresourcesandthecontextofpublicpoliciesintendedtobolsterfamilyincomes.Inadditiontoearnings,low-incomefamilies’abilitytomeettheirneedsisdeterminedbypublicbenefitprograms.Overthelastseveraldecadestherehasbeenanimportantshiftinthecompositionoftheseprograms,especiallyforthenon-elderlypopulation.Asnotedabove,asmallerproportionofmeans-testedassistancetakestheformofcashpayments,suchaspublicassistance,whilealargerproportioniscomposedoftaxcreditsandin-kindbenefits.ThetrendhasbeenreinforcedbytheBushandObamaAdministrations’economicstimulusprograms.Ataxprogram,theEconomicRecoveryRebate,wasakeyfeatureoftheBushAdministration’sresponsetotheonsetoftherecession.NewandexpandedtaxcreditprogramsandanincreaseinFoodStampbenefitlevelswereimportantelementsinPresidentObama’sAmericanRecoveryandRebuildingAct.
TheexpandingroleoftaxcreditsandtheFoodStampprogramareafocusoftheanalyticalsectionsofthisyear’sreport.Inordertoidentifytheimpactoftherecentpolicychanges,wecomparetrendsinCEOincomeandpovertyratesagainsthypotheticalestimates,toidentifywhatwouldhaveoccurredintheabsenceofthenewtaxandFoodStampinitiatives.
0
20
40
60
80
100
Perc
ent o
f 18
thro
ugh
64-Y
ear-
Olds
23.5
2008
59.8
16.7
2009 2010
24.6 27.3
16.5
56.3
2011
27.0
16.6
56.3
17.1
58.3
At Least 50 Less Than 50 No Weeks
table oneAnnual Family-Level Earned Income, 2008 - 2011
Year Percentage ChangePercentile 2008 2009 2010 2011 2008-2010 2010-2011
25 $18,701 $17,945 $16,122 $16,029 -13.8% -0.6%
30 $25,460 $24,226 $21,741 $21,970 -14.6% 1.1%
35 $31,815 $30,506 $27,818 $27,682 -12.6% -0.5%
40 $38,218 $36,707 $33,922 $33,301 -11.2% -1.8% Source: American Community Survey Public Use Micro Sample as augmented by CEO. Notes: Earnings are stated in family size and composition-adjusted dollars. They are not adjusted for inflation. Persons in families with no earnings are included.

NYC Center for Economic Opportunity nyc.gov/ceo
viii The CEO Poverty Measure, 2005 - 2011
Key Findings Inthecontextofalabormarketthatisrecoveringfromatwo-yearslump,wefindthat:
Afterrisingfrom19.0percentin2008to20.9percentin2010,theCEOpovertyratestoodat21.3percentin2011,statisticallyunchangedfromtheprioryear.Anequivalent8officialpovertyratefollowedasimilarpath,risingfrom16.8percentin2008to18.8percentin2010.Theofficialpovertyratein2011was19.3percent,alsostatisticallyunchangedfrom2010.
AlthoughtheCEOpovertyrateexceedstheofficialrateineachyearforwhichwehavedata,theCEOmethodologyfindsthatasmallerproportionoftheCity’spopulationislivinginextremepoverty–below50percentofthepovertythreshold–thandoestheofficialmethod(5.6percentcomparedto7.9percentin2011).Bybothmeasures,extremepovertyrosefrom2008to2010.Theproportionofthepopulationlivingbelow50percentoftherespectivethresholdswasunchangedfrom2010to2011.SeeFigureFive.
ThetrendinCEOpovertyratesbydemographiccharacteristicssuchasage,familystatus(i.e.,numberofparentsinthefamilyunit),andboroughgenerallyfollowstheriseintheCitywidepovertyratefrom2008to2010anditsstatisticalstabilityfrom2010to2011.Comparing2011to2008,wefindstatisticallysignificantincreasesinthepovertyrateforchildrenunder18andworkingageadults(SeeFigureSix);Non-HispanicWhites,Asians,andHispanics(SeeFigureSeven);andCitizensbyBirthandNon-Citizens(SeeFigureEight).Therearefewstatisticallymeaningfulchangesinpovertyratesfrom2010to2011.Animportantexceptionisthedeclineinthepovertyrateforpersonslivinginasingle-headedfamilywithchildren,from33.4percentin2010to30.9percentin2011.SeeFigureNine.
8.Tomakecomparisonsmoreuseful,theofficialpovertyratesgiveninthereportarebasedontheCEOpovertyuniverseandunitofanalysis.SeeTextBoxFourinChapterIfordetails.
figure fivePercent of the Population in Extreme Poverty, 2008 - 2011
Source: American Community Survey Public Use Micro Sample as augmented by CEO. Note: Official poverty rates are based on the CEO poverty universe and unit of analysis.
0
1
2
3
4
5
6
7
8
6.97.3
7.7 7.9
Official CEO
5.14.8
5.6 5.6
Perc
ent o
f the
Pop
ulat
ion
2008 2009 2010 2011

Executive Summary ix
NYC Center for Economic Opportunity nyc.gov/ceo
figure six CEO Poverty Rates by Age Group, 2008, 2010, and 2011
Source: American Community Survey Public Use Micro Sample as augmented by CEO.
figure sevenCEO Poverty Rates by Race/Ethnicity, 2008, 2010, and 2011
Source: American Community Survey Public Use Micro Sample as augmented by CEO.
0
5
10
15
20
25
30
23.1
Under 18
25.6 24.7
18 through 64 65 and Older
16.919.3 19.9
22.7 22.421.1
Perc
ent o
f the
Pop
ulat
ion
2008 2010 2011
13.215.4 15.4
Non-Hispanic White
Non-Hispanic Black
Non-Hispanic Asian
Hispanic, Any Race
Perc
ent o
f the
Pop
ulat
ion
2008 2010 2011
0
5
10
15
20
25
30
20.8 21.5 21.422.4
26.1 26.5
23.524.6 25.3

NYC Center for Economic Opportunity nyc.gov/ceo
x The CEO Poverty Measure, 2005 - 2011
figure eightCEO Poverty Rates by Nativity/Citizenship, 2008, 2010, and 2011
Source: American Community Survey Public Use Micro Sample as augmented by CEO.
figure nineCEO Poverty Rates for Families with Children, 2008, 2010, and 2011
Source: American Community Survey Public Use Micro Sample as augmented by CEO.
0
5
10
15
20
25
30
17.7
Citizen by Birth
19.9 19.7
Naturalized Citizen Not a Citizen
18.2 17.819.1
24.7
28.927.5
Perc
ent o
f the
Pop
ulat
ion
2008 2010 2011
0
5
10
15
20
25
30
35
20.3
All Families with Children
23.0 22.4
Two-Parent Families
Single-Parent Families
14.4
17.8 17.8
31.1 30.933.4
Perc
ent o
f the
Pop
ulat
ion
2008 2010 2011

Executive Summary xi
NYC Center for Economic Opportunity nyc.gov/ceo
From2008to2011,povertyratesincreasedinthreeoutoffiveoftheCity’sboroughs:Brooklyn(by1.6percentagepointsto23.9percent),Queens(by4.8percentagepointsto21.1percent),andStatenIsland(by3.9percentagepointsto15.3percent).SeeFigureTen.
ThepatterninpovertyratesfortheUnitedStatesbasedonthenewFederalSupplementalPovertyMeasureresemblestheCEOpatternforNewYorkCity.Acrosstheentirepopulation,thetwoNAS-basedpovertymeasuresfindahigherincidenceofpovertythandotheofficialmeasures.IntheU.S.,theratein2011is16.1percentasopposedto15.1percent.InNewYorkCity,thetwopovertyrateswere21.3percentand19.3percentinthatyear.Becausetheycountthevalueofnon-cashassistance,however,boththeSPMandCEOmeasuresofpovertyamongchildrenarelowerthanchildpovertyratesbasedontheofficialmethod:18.1percentcomparedto22.3percentforthenation;24.7percentratherthan28.7percentfortheCity.SeeFigureEleven.
26.2 25.6 26.0
22.324.4 23.9
13.8 14.5 14.716.4
20.021.1
11.413.5
15.3
Bronx Brooklyn Manhattan Queens Staten Island
Perc
ent o
f the
Pop
ulat
ion
2008 2010 2011
0
5
10
15
20
25
30
figure tenCEO Poverty Rates by Borough, 2008, 2010, and 2011
Source: American Community Survey Public Use Micro Sample as augmented by CEO.

NYC Center for Economic Opportunity nyc.gov/ceo
xii The CEO Poverty Measure, 2005 - 2011
Theanalyticalsectionsofthisyear’sreportfocusontrendsinthreefamily-levelmeasuresofincome:earnings,pre-taxcash,andCEOincome.Comparisonsindicatetheextenttowhichtherecession-relateddeclinesinearnedincomewereoffsetbycashandnon-cashbenefitprograms.Wefindthat:
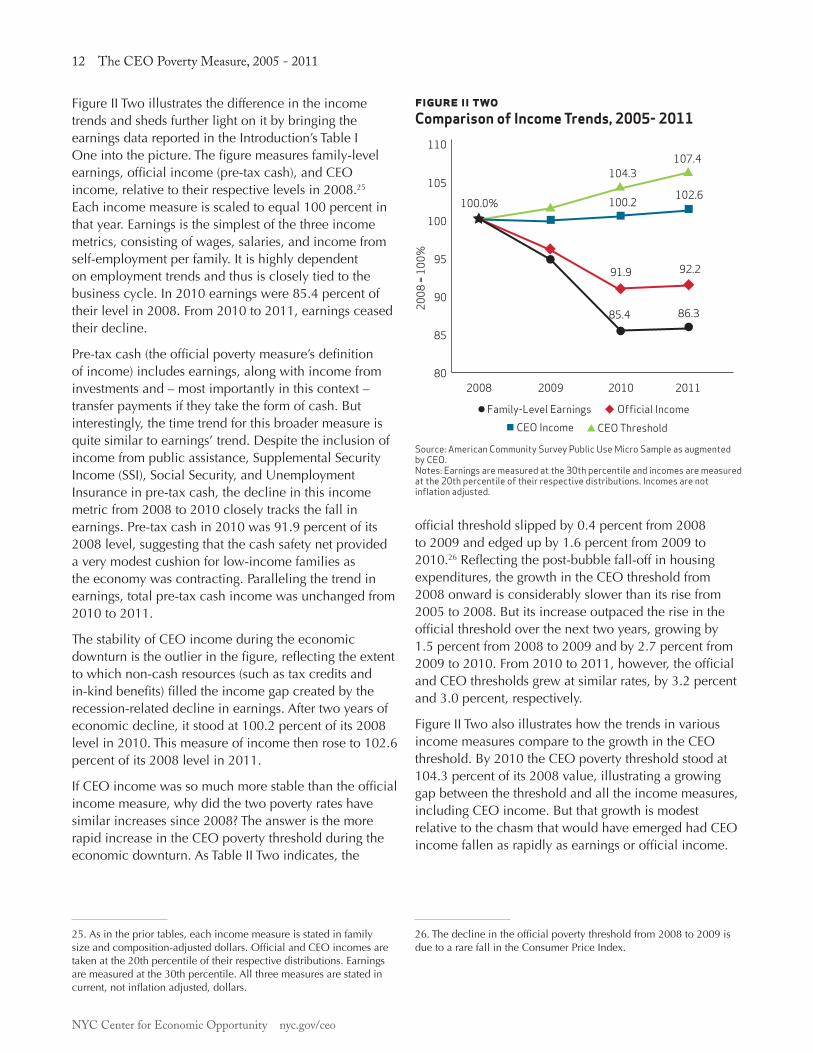
In2010,earnedincomestoodatonly85.4percentofits2008level.Pre-taxcash,themeasureofincomeusedintheofficialpovertymeasure,equaled91.9percentofits2008levelinthatyear.Bycontrast,CEOincomedidnotdeclinefrom2008to2010.From2010to2011,bothearningsandpre-taxcashwerestatisticallyunchanged,whileCEOincomeroseto102.6percentofits2008level.ThedramaticallystrongerperformanceoftheincomemeasureusedtodeterminetheCEOpovertyratecomparedtotheincomemeasureusedtodeterminetheofficialpovertyrateistheresultofCEO’sinclusionofnon-cashsocialsafetynetprogramsthatareuncountedintheofficialpovertymeasure.SeeFigureTwelve.
figure twelve Comparison of Income Trends, 2008 - 2011
Source: American Community Survey Public Use Micro Sample as augmented by CEO. Notes: Earnings are measured at the 30th percentile and incomes are measured at the 20th percentile of their respective distributions. Incomes are not inflation-adjusted.
Official
United States
SPM
15.1
22.3
13.7
8.7
16.118.1
15.5 15.1
Perc
ent o
f the
Pop
ulat
ion
0
10
15
5
20
25
15
5
25
30
Total Under 18 18 - 64 65 and Older
New York City
Official CEO
19.3
28.7
17.5
21.3
24.7
19.922.4
Perc
ent o
f the
Pop
ulat
ion
0
10
20
30
16.5
figure elevenComparison of Poverty Rates in the U.S. and NYC, 2011
Source: American Community Survey Public Use Micro Sample as augmented by CEO.
Official IncomeFamily-Level Earnings CEO Income
2008
= 10
0%
100.0% 100.2%
91.9%
85.4%
102.6%
92.2%
86.3%
2008 2009 2010 201180
95
100
105
90
85
110
Executive Summary xiii
NYC Center for Economic Opportunity nyc.gov/ceo
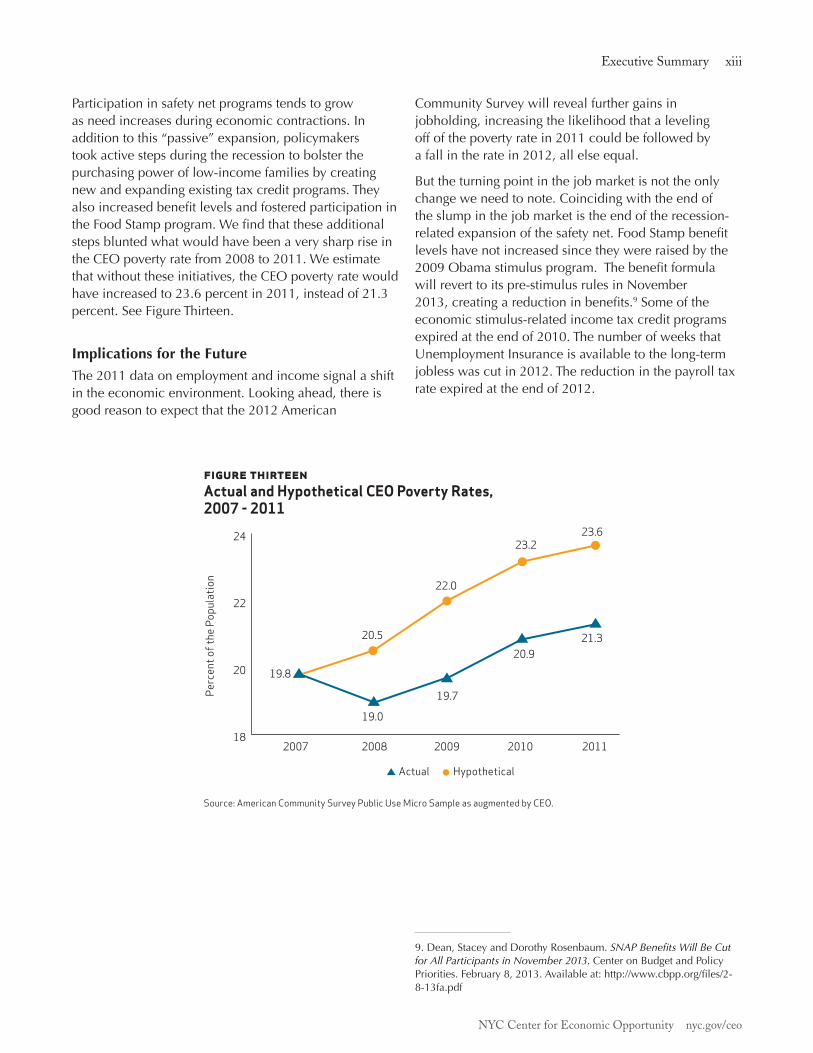
Participationinsafetynetprogramstendstogrowasneedincreasesduringeconomiccontractions.Inadditiontothis“passive”expansion,policymakerstookactivestepsduringtherecessiontobolsterthepurchasingpoweroflow-incomefamiliesbycreatingnewandexpandingexistingtaxcreditprograms.TheyalsoincreasedbenefitlevelsandfosteredparticipationintheFoodStampprogram.WefindthattheseadditionalstepsbluntedwhatwouldhavebeenaverysharpriseintheCEOpovertyratefrom2008to2011.Weestimatethatwithouttheseinitiatives,theCEOpovertyratewouldhaveincreasedto23.6percentin2011,insteadof21.3percent.SeeFigureThirteen.
Implications for the FutureThe2011dataonemploymentandincomesignalashiftintheeconomicenvironment.Lookingahead,thereisgoodreasontoexpectthatthe2012American
CommunitySurveywillrevealfurthergainsinjobholding,increasingthelikelihoodthataleveling offofthepovertyratein2011couldbefollowedby afallintheratein2012,allelseequal.
Buttheturningpointinthejobmarketisnottheonlychangeweneedtonote.Coincidingwiththeendoftheslumpinthejobmarketistheendoftherecession-relatedexpansionofthesafetynet.FoodStampbenefitlevelshavenotincreasedsincetheywereraisedbythe2009Obamastimulusprogram.Thebenefitformulawillreverttoitspre-stimulusrulesinNovember2013,creatingareductioninbenefits.9Someoftheeconomicstimulus-relatedincometaxcreditprogramsexpiredattheendof2010.ThenumberofweeksthatUnemploymentInsuranceisavailabletothelong-termjoblesswascutin2012.Thereductioninthepayrolltaxrateexpiredattheendof2012.
9.Dean,StaceyandDorothyRosenbaum.SNAP Benefits Will Be Cut for All Participants in November 2013.CenteronBudgetandPolicyPriorities.February8,2013.Availableat:http://www.cbpp.org/files/2-8-13fa.pdf
figure thirteen Actual and Hypothetical CEO Poverty Rates, 2007 - 2011
Source: American Community Survey Public Use Micro Sample as augmented by CEO.
20082007 2009 2010 2011
HypotheticalActual
Perc
ent o
f the
Pop
ulat
ion
19.7
20.5
19.0
22.0
23.2
20.9
23.6
21.3
18
20
22
24
19.8

NYC Center for Economic Opportunity nyc.gov/ceo
xiv The CEO Poverty Measure, 2005 - 2011
Thesequester–thecutsinFederalgovernmentspendingthatbeganonMarch1,2013–alsothreatensprogramsimportanttolow-incomeAmericans.UnemploymentInsurancebenefitlevelsforthelong-termjoblesswhoarereceivingFederally-fundedbenefitscouldfallby11percent.10TheCenteronBudgetandPolicyPrioritiesestimatesthatbetween575,000and750,000womenandchildrenwillbedeniedWICbenefitsbytheendofthecurrentFederalfiscalyear.11FundingforFederalhousingprograms,thebackboneofthemeans-testedhousingassistancesovitaltolow-incomeNewYorkers,willalsosufferstiffreductions.12
Insum,thedynamicthatspurred,butalsolimited,therecentriseinpoverty–decliningearningsbufferedbyanexpandedsafetynet–isshifting.InthecontextofpoliticalstalemateinWashingtonandapolicyenvironmentthatisfocusedonreducingtheFederalbudgetdeficit,progressinreducingpovertywilldependtoalargedegreeonarisingeconomictideliftingenoughboats.ProgresswillalsorestonthecontinuedeffortsbyCitypolicymakerstobuild“on-ramps”toanexpandingjobmarketforthosegroupsofNewYorkersthatprosperitysooftenleavesbehind.
10. The Sequester’s Devastating Impact on Families of Unemployed Workers and the Struggling Unemployment Insurance System.NationalEmploymentLawProject.BriefingPaper.February27,2013.Availableat:http://www.nelp.org/page/-/UI/2013/Briefing-Paper-Sequester-Unemployment-Insurance.pdf?nocdn=111.Neuberger,ZoeandBobGreenstein.The Impact of the Sequester on WIC: 575,000 to 750,000 Eligible Low-Income Women and Children at Nutritional Risk Could Be Denied Benefits.CenteronBudgetandPolicyPriorities.March5,2013.Availableat:www.cbpp.org/files/2-26-13fa.pdf12. Estimated Cuts in Federal Housing Assistance and Community Development Programs Due to Sequestration, 2013.CenteronBudgetandPolicyPriorities.March5,2013.Availableat:www.cbpp.org/files/1-28-13hous.pdf
Chapter I: Introduction 1
NYC Center for Economic Opportunity nyc.gov/ceo
ChaPTer i: inTroduCTion
Ithasbeenahalfcenturysincethedevelopmentofthecurrentofficialmeasureofpoverty.Intheearly1960sthemeasurerepresentedanimportantadvance,servingasafocalpointforthepublic’sgrowingconcernaboutpovertyinAmerica.Butoverthedecades,discussionsaboutpovertyincreasinglyincludedcriticismofhowpoorlyitwasbeingmeasured.Societywasevolvingandpublicpolicyhadshifted,yettheCensusBureauwasstillmeasuringpovertyasifnothinghadchanged.
DissatisfactionwiththeofficialmeasurepromptedCongresstorequestastudybytheNationalAcademyofSciences(NAS).TheNAS’srecommendations,issuedin1995,sparkedfurtherresearchandgarneredwidespreadsupportamongpovertyexperts.13However,neithertheFederalnoranystateorlocalgovernmenthadadoptedtheNASapproachuntilCEO’sinitialreportonpovertyinNewYorkCityinAugust2008.14Thisyear’sstudy,ourfourthannualreport,continuesourpracticeofissuingyearlyupdatesofourmeasure.Usingthemostrecentdataavailable,itprovidespovertyratesfor2005 through2011.
Thisintroductorychaptersetsthecontextforourfindings.Itbeginswithanoverviewoftheofficialmeasureanditsweaknesses.Wethendescribeouralternative,whichisbasedontheNASrecommendationsandthedevelopmentofthenewFederalSupplementalPovertyMeasure(SPM),firstissuedinNovember2011.15 Thesecondpartoftheintroductionshiftsthediscussionfrommethodologytothelocaleconomy.Followingtherecessionandcontinuedweaknessinthelocaleconomyfrom2008to2010,thedatafor2011indicatesomeimprovementintheCity’sjobmarket.Theintroduction’sfinalsectionsummarizesthereport’sprincipalfindings.
1.1 The Official Poverty MeasureTheofficialmeasure’spovertythresholdwasdevelopedintheearly1960sandwasbasedonthecostofthe
13.Citro,ConstanceF.andRobertT.Michael(eds).Measuring Poverty: A New Approach.Washington,DC:NationalAcademyPress.1995.MuchoftheresearchinspiredbytheNASreportisavailableat:www.census.gov/hhes/povmeas/methodology/nas/index.html14.NewYorkCityCenterforEconomicOpportunity.The CEO Poverty Measure: A Working Paper by the New York City Center for Economic Opportunity.August2008.Availableat:www.nyc.gov/html/ceo/downloads/pdf/final_poverty_report.pdf15.U.S.BureauoftheCensus.The Research Supplemental Poverty Measure: 2010.November2011.Availableat:www.census.gov/hhes/povmeas/methodology/supplemental/research/Short_ResearchSPM2010.pdf
U.S.DepartmentofAgriculture’sEconomyFoodPlan,adietdesignedfor“temporaryoremergencyusewhenfundsarelow.”Becausethesurveydataavailableatthetimeindicatedthatfamiliestypicallyspentathirdoftheirincomeonfood,thecostoftheplanwassimplymultipliedbythreetoaccountforotherneeds.Sincethethreshold’s1963baseyear,ithasbeenupdatedannuallybythechangeintheConsumerPriceIndex.16
Ahalfcenturylater,thispovertylinehaslittlejustification.Thethresholddoesnotrepresentcontemporaryspendingpatterns;foodnowaccountsforlessthanone-seventhoffamilyexpenditures,andhousingisthelargestiteminthetypicalfamily’sbudget.Theofficialthresholdalsoignoresdifferencesinthecostoflivingacrossthenation,anissueofobviousimportancetomeasuringpovertyinNewYorkCity.Afinalshortcomingofthethresholdisthatitisfrozenintime.Sinceitonlyriseswiththecostofliving,itassumesthatastandardoflivingthatdefinedpovertyintheearly1960sremainsappropriate,despiteadvancesinthenation’sstandardoflivingsincethattime.
Theofficialmeasure’sdefinitionoftheresourcesthatarecomparedagainstthethresholdispre-taxcash.Thisincludeswages,salaries,andearningsfromself-employment;incomefrominterest,dividends,andrents;andsomeofwhatfamiliesreceivefrompublicprograms,iftheytaketheformofcash.Thus,paymentsfromUnemploymentInsurance,SocialSecurity,SupplementalSecurityIncome(SSI),andPublicAssistanceareincludedintheofficialresourcemeasure.
Giventhedataavailableandthepoliciesinplaceatthetime,thiswasnotanunreasonabledefinition.Butinrecentyearsanincreasingshareofwhatgovernmentdoestosupportlow-incomefamiliestakestheformoftaxcredits(suchastheEarnedIncomeTaxCredit)andin-kindbenefits(suchasFoodStamps).Ifpolicymakersorthepublicwanttoknowhowtheseprogramsaffectpoverty,theofficialmeasurecannotprovideananswer.
16.Fisher,GordonM.“TheDevelopmentandHistoryofthePovertyThresholds.”Social Security Bulletin,Vol.55,No.4.Winter1992.

NYC Center for Economic Opportunity nyc.gov/ceo
2 The CEO Poverty Measure, 2005 - 2011
Measures of Poverty
Official: The current official poverty measure was developed in the early 1960s. . It consists of a set of thresholds that were based on the cost of a minimum diet at that time. A family’s pre-tax cash income is compared against the threshold to determine whether its members are poor.
NAS: At the request of Congress, the National Academy of Sciences issued a set of recommendations for an improved poverty measure in 1995. The NAS threshold represents the need for clothing, shelter, and utilities as well as food. The NAS income measure accounts for taxation and the value of in-kind benefits.
SPM: In March 2010 the Obama Administration an-nounced that the Census Bureau, in cooperation with the Bureau of Labor Statistics, would create a Supplemental Poverty Measure based on the NAS recommendations, subsequent research, and a set of guidelines proposed by an Interagency Technical Working Group. The first report on poverty using this measure was issued by the Census Bureau in November 2011.
CEO: The Center for Economic Opportunity released its first report on poverty in New York City in August 2008. CEO’s poverty measure is largely based on the NAS rec-ommendations, with modifications based on the guide-lines from the Interagency Technical Working Group.
1.2 The National Academy of Sciences’ AlternativeNAS-basedmethodstakeaconsiderablydifferentapproachtoboththethresholdandresourcesideofthepovertymeasure.Thepovertythresholdreflectstheneedforclothing,shelter,andutilities,aswellasfood.Itisestablishedbyselectingasub-groupoffamiliesasreferencefamilies,17calculatingtheirspendingontheseitems,andthenchoosingapointintheresultingexpendituredistribution.18Asmallmultiplierisappliedtoaccountformiscellaneousexpensessuchaspersonalcare,householdsupplies,andnon-work-relatedtransportation.Thethresholdisupdatedeachyearbythechangeinthelevelofthisspending.Thisconnects
17.ThereferencefamilyproposedbytheNASiscomposedoftwoadultsandtwochildren.Thethresholdforthisfamilyisthenscaledforfamiliesofdifferentsizesandcompositions.SeeAppendixB.18.TheNASsuggestedthatthispointliebetweenthe30thand35thpercentileofthedistribution.CitroandMichael,p.106.
thethresholdtothegrowthinlivingstandards.Infurthercontrasttotheofficialmeasure,theNAS-stylepovertylineisalsoadjustedtoreflectgeographicdifferencesinhousingcosts.
Ontheresourceside,theNAS-basedmeasureisdesignedtoaccountfortheflowofincomeandin-kindbenefitsthatafamilycanusetomeettheneedsrepresentedinthethreshold.Thiscreatesamuchmoreinclusivemeasureofincomethanpre-taxcash.Thetaxsystemandthecash-equivalentvalueofin-kindbenefitsforfoodandhousingareimportantadditionstofamilyresources.Butfamiliesalsohavenon-discretionaryexpensesthatreducetheincomeavailabletomeettheirotherneeds.Theseincludethecostofcommutingtowork,childcare,andmedicalcarethatmustbepaidforoutofpocket.Thisspendingisaccountedforasdeductionsfromincome.
1.3 The Supplemental Poverty MeasureTheCensusBureau’sSupplementalPovertyMeasureisshapedbytheNASrecommendationsandasetofguidelinesprovidedbyanInteragencyTechnicalWorkingGroup(ITWG)inMarch2010.19Revisionstothe1995NASrecommendationscenteronthethresholdsideofthepovertymeasure.Themostimportantoftheseare:
1.Anexpansionofthetypeoffamilyunitwhoseexpendituresdeterminethepovertythreshold,from two-adultfamilieswithtwochildrentoallfamilieswithtwochildren.
2.Useofafive-year,ratherthanthree-year,movingaverageofexpendituredatatoupdatethepovertythresholdovertime.
3.Creationofseparatethresholdsbasedonhousingstatus:whetherthefamilyownsitshomewithamortgage;owns,butisfreeandclearofamortgage;orrents.
1.4 CEO’s Adoption of the NAS/SPM MethodCEOhasfollowedthefirsttwooftheserevisionstotheNASrecommendations.However,wedonotfollowtheSPM’screationofthresholdsthatvarybyhousingstatus.Weaccountforalldifferencesinhousingstatus– includingresidenceinrent-regulatedapartmentsandparticipationinmeans-testedhousingassistance
19. Observations from the Interagency Technical Working Group on Developing a Supplemental Poverty Measure.March2010.Availableat:www.census.gov/hhes/www/poverty/SPM_TWGObservations.pdf

Chapter I: Introduction 3
NYC Center for Economic Opportunity nyc.gov/ceo
programs–ontheincomesideofthepovertymeasure.20 ByapplyingtheratioofNewYorkCitytoU.S.-wideFairMarketRentforatwo-bedroomapartmenttothehousingportionofthethreshold,weadjustthenational-levelSPMthreshold(regardlessofhousingstatus)toaccountfortherelativelyhighcostofhousinginNewYorkCity.In2011,ourpovertylineforthetwo-adult,two-childfamilycomesto$30,949.WerefertothisNewYorkCity-specificthresholdastheCEOpovertythreshold.(SeeAppendixB.)
Poverty Thresholds
Official: The official threshold was developed in the early 1960s and was based on the cost of a minimum diet at that time. It is updated each year by the change in consumer prices. It is uniform across the United States.
CEO: The CEO poverty threshold is a New York City-specific threshold derived from the U.S.-wide thresh-old developed for the Federal Supplemental Poverty Measure. The threshold is based on what families spend on basic necessities: food, clothing, shelter, and utilities. It is adjusted to reflect the variation in housing costs across the United States.
Tomeasuretheresourcesavailabletoafamilytomeettheneedsrepresentedbythethreshold,ourpovertymeasureemploysthePublicUseMicroSamplefromtheCensusBureau’sAmericanCommunitySurvey(ACS)asitsprincipaldataset.Theadvantagesofthissurveyforlocalpovertymeasurementarenumerous.TheACSisdesignedtoprovidemeasuresofsocioeconomicconditionsonanannualbasisinstatesandlargerlocalities.ItoffersarobustsampleforNewYorkCity(roughly25,000households)andcontainsessentialinformationabouthouseholdcomposition,familyrelationships,andcashincomefromavarietyofsources.
But,asnotedearlier,theNAS-recommendedpovertymeasuregreatlyexpandsthescopeofresourcesthatmustbemeasuredinordertodeterminewhetherafamilyispoor.Unfortunately,theACSprovidesonlysomeoftheinformationneededtoestimatetheadditionalresourcesrequiredbytheNASmeasure.CEOhasdevelopedavarietyofmodelsthatestimatetheeffect
20.TherationaleforthisdecisionisprovidedinAppendixBoflastyear’sreport.See:The CEO Poverty Measure, 2005 – 2010: A Working Paper by the NYC Center for Economic Opportunity.Availableat:www.nyc.gov/html/ceo/downloads/pdf/CEO_Poverty_Measure_April_16.pdf
oftaxation,nutritionalandhousingassistance,work-relatedexpenses,andmedicalout-of-pocketexpendituresontotalfamilyresourcesandpovertystatus.Wereferencetheresultingdatasetasthe“AmericanCommunitySurveyPublicUseMicroSampleasaugmentedbyCEO”andwerefertoourestimateoffamilyresourcesas“CEOincome.”
Measuring Income
Official Income: The official poverty measure’s definition of family resources is pre-tax cash. This includes income from sources such as wages and salaries, as well as government transfer payments, provided that they take the form of cash. Thus, Social Security benefits are included in this measure, but the value of in-kind benefits, like Food Stamps or tax credits such as the Earned Income Tax Credit, are not counted.
CEO Income: Based on the NAS recommendations, CEO income includes all the elements of pre-tax cash plus the effect of income and payroll taxes, as well as the value of in-kind nutritional and housing assistance. Non-discretionary spending for commuting to work, childcare, and out-of-pocket medical care are deductions from income.
Belowisabriefdescriptionofhowthenon-pre-taxcashincomeitemsareestimated.Moredetailsontheseproceduresandanyrevisionswehavemadetothemsinceourlastreportcanbefoundintheappendices.
Housing Adjustment:ThehighcostofhousingmakesNewYorkCityanexpensiveplacetolive.TheCEOpovertythreshold,wenotedabove,isadjustedtoreflectthatreality.ButsomeNewYorkersdonotneedtospendasmuchtosecureadequatehousingasthehigherthresholdimplies.ManyoftheCity’slow-incomefamiliesliveinpublichousingorreceiveahousingsubsidy,suchasaSection8housingvoucher.AlargeproportionofNewYork’srentersliveinrent-regulatedapartments.Somehomeownershavepaidofftheirmortgagesandowntheirhomesfreeandclear.Wemakeanupwardadjustmenttothesefamilies’incomestoreflecttheseadvantages.
TheACSdoesnotprovidedataonhousingprogramparticipation,however.TodeterminewhichhouseholdsintheACSwouldbeparticipantsinrentalsubsidyorregulationprograms,wematchhouseholdsintheCensus
NYC Center for Economic Opportunity nyc.gov/ceo
4 The CEO Poverty Measure, 2005 - 2011
Bureau’sNewYorkCityHousingandVacancy Surveywithhousehold-levelrecordsintheACS. (SeeAppendixC.)
Taxation:CEOhasdevelopedataxmodelthatcreatestaxfilingunitswithintheACShouseholds;computestheiradjustedgrossincome,taxableincome,andtaxliability;andthenestimatesnetincometaxesafternon-refundableandrefundablecreditsareapplied.ThemodeltakesaccountofFederal,State,andCityincometaxprograms,includingallthecreditsthataredesignedtoaidlow-incomefilers.ThemodelalsoincludestheeffectoftheFederalpayrolltaxforSocialSecurityandMedicare(FICA).(SeeAppendixD.)
Nutritional Assistance:WeestimatetheeffectofFoodStamps,21theNationalSchoolLunchprogram,theSchoolBreakfastProgram,andtheSupplementaryNutritionProgramforWomen,Infants,andChildren(WIC).ToestimateFoodStampbenefits,wemakeuseofNewYorkCityHumanResourcesAdministrationFoodStamprecords,imputingFoodStampcasesto“FoodStampUnits”weconstructintheACSdata.WecounteachdollarofFoodStampbenefitsasadollaraddedtofamilyincome.
Thelikelihoodofparticipationintheschoolmealsprogramsiscalculatedbyaprobabilitymodel.ParticipationisassignedtoeligiblefamiliestoreplicatedataonmealsservedbytheCity’sDepartmentofEducation.WefollowtheCensusBureau’smethodforvaluingtheincomefromtheprogramsbyusingtheper-mealcostofthesubsidy.WeidentifyparticipantsintheWICprograminasimilarmanner,matchingenrollmentintheprogramtoparticipationrateestimatesbytheNewYorkStateDepartmentofHealth.BenefitsarecalculatedusingtheaveragebenefitlevelperparticipantcalculatedbytheU.S.DepartmentofAgriculture.(SeeAppendixE.)
Home Energy Assistance Program: TheHomeEnergyAssistanceProgram(HEAP)providesassistancetolow-incomehouseholdsthatoffsetstheirutilitycosts.InNewYorkCity,householdsthatreceivecashassistance,FoodStamps,orarecomposedofasinglepersonreceivingSSIbenefitsareautomaticallyenrolledintheprogram.Otherlow-incomehouseholdscanapplyforHEAP,butadministrativedatafromtheCity’sHumanResourcesAdministrationindicatethatnearlyallHEAPhouseholdscomeintotheprogramthroughtheirparticipationintheseotherbenefitprograms.WeidentifyHEAP-
21.TheFoodStampprogramwasrecentlyrenamedtheSupplementalNutritionalAssistanceProgram(SNAP).Sincetheprogramismorewidelyrecognizedbyitsformername,wecontinuetouseit.
receivinghouseholdsbytheirparticipationinpublicassistance,FoodStamps,andSSI,andthenaddtheappropriatebenefittotheirincome.For2011,wealsomakeuseofHEAPreceiptreportedintheHousingandVacancySurvey.(SeeAppendixF.)
Work-Related Expenses:Workersmusttraveltoandfromtheirjobs,andwetreatthecostofthattravelasanon-discretionaryexpense.Weestimatethenumberoftripsaworkerwillmakeperweekbasedontheirusualweeklyhours.WethencalculatethecostpertripusinginformationintheACSabouttheirmodeoftransportationandadministrativedata(suchassubwayfares).Weeklycommutingcostsarecomputedbymultiplyingthecostpertripbythetripsperweek.Annualcommutingcostsequalweeklycoststimesthenumberofweeksworkedoverthepast12months.
Familiesinwhichtheparentsareworkingmustoftenpayforthecareoftheiryoungchildren.Likethecostofcommuting,theCEOpovertymeasuretreatschildcareexpensesasanon-discretionaryreductioninincome.BecausetheAmericanCommunitySurveyprovidesnoinformationonchildcarespending,wehavecreatedanimputationmodelthatmatchestheweeklychildcareexpendituresreportedintheCensusBureau’sSurveyofIncomeandProgramParticipation(SIPP)toworkingfamilieswithchildrenintheACSdataset.Childcarecostsareonlycountediftheyareincurredinaweekinwhichtheparents(orthesingleparent)areatwork.Theyarecappedbytheearnedincomeofthelowestearningparent.(SeeAppendixG.)
Medical Out-of-Pocket Expenditures (MOOP):Thecostofmedicalcareisalsotreatedasanon-discretionaryexpensethatlimitstheabilityoffamiliestoattainthestandardoflivingrepresentedbythepovertythreshold.MOOPincludeshealthinsurancepremiums,co-pays,anddeductibles,aswellasthecostofmedicalservicesthatarenotcoveredbyinsurance.Inamannersimilartothatforchildcare,weuseanimputationmodeltomatchMOOPexpendituresbyfamiliesintheAgencyforHealthcareResearchandQuality’sMedicalExpenditurePanelSurveytofamiliesintheACSsample.(SeeAppendixH.)
FigureIOnesummarizesthediscussionthusfar,contrastinghowtheofficialandCEOpovertymeasuresestablishathresholdandaccountforfamilyresources.

Chapter I: Introduction 5
NYC Center for Economic Opportunity nyc.gov/ceo
1.5 Comparing Poverty RatesAsnotedabove,theCEOpovertythresholdforatwo-adult,two-childfamilyin2011was$30,949.Theofficialpovertylinefortheequivalentfamilywas$22,811inthatyear.Obviously,ifthisweretheonlychangeCEOhadmadetothepovertymeasure,itwouldleadtoapovertyrateabovetheofficialmeasure.But,asdescribedabove,CEOalsousesafardifferentmeasureofincometocompareagainstthepovertythreshold.Althoughourmeasureincludessubtractionsaswellasadditionstoresources,CEOincomeishigherthanpre-taxcashincomeatthelowerrungsoftheincomeladder.Atthe20thpercentile,forexample,CEOincomewas$30,195in2011.22Thecorrespondingfigureforpre-taxcashwasonly$22,944.Thus,ifamorecompleteaccountofresourceshadbeentheonlychangewemadetothepovertymeasure,theCEOpovertyratewouldfallbelowtheofficialmeasure.FigureITwoillustratesofficialandCEOincomes,thresholds,andpovertyratesfor2011.TheeffectofthehigherCEOthreshold(35.7percentabovetheofficial)outweighstheeffectofCEO’smorecompletedefinitionofresources(whichis31.6percenthigheratthe20thpercentilethantheofficialresourcemeasure),resultinginahigherpovertyrate.In2011,the
22.Throughoutthisworkingpaper,wereportincomeinfamilysizeandcomposition-adjusteddollars.Thismakestheincomemeasuresdirectlycomparabletothetwo-adult,two-childreferencefamilypovertythreshold.
CEOpovertyratestoodat21.3percentwhiletheofficialratewas19.3percent,a2.0percentagepointdifference.
Official Poverty Rates
The official poverty rates reported in this study differ from those provided by the Census Bureau. To make them more comparable to the CEO poverty rates, they are calculated using CEO’s poverty universe and unit of analysis. CEO excludes all members of the group quar-ters population and includes all members of the house-hold population in its universe of persons for whom a poverty status is determined. The CEO poverty unit of analysis expands the notion of the family unit to include more members of the household than just those related by blood, marriage, or adoption. Unmarried partners, for example, are treated as members of the family unit. Both these changes lower the poverty rate. In 2011, for example, the Census Bureau’s official poverty rate for New York City is 20.1 percent. The 2011 official poverty rate for the City that we report is 19.3 percent. See Ap-pendix A for further explanation.
figure i oneComparison of Poverty Measures
Official CEO
Threshold
Established in mid-1960s at three times the cost of “Economy Food Plan.”
Equal to 33rd percentile of family expenditures on food, clothing, shelter, and utilities, plus 20 percent more for miscellaneous needs.
Updated by change in Consumer Price Index.
Updated by change in expenditures for the items in the threshold.
No geographic adjustment. Inter-area adjustment based on differences in housing costs.
Resources
Total family pre-tax cash income (includes earnings, cash assistance, Social Security, etc.)
Total family after-tax income.
Include value of near-cash, in-kind benefits such as Food Stamps.Housing status adjustment.Subtract work-related expenses such as childcare and transportation costs.Subtract medical out-of-pocket expenditures.

NYC Center for Economic Opportunity nyc.gov/ceo
6 The CEO Poverty Measure, 2005 - 2011
figure i twoComparison of Thresholds, Income, and Poverty Rates, Official and CEO, 2011
Sources: U.S. Bureau of the Census and American Community Survey Public Use Micro Sample as augmented by CEO. Note: Incomes are measured at the 20th percentile and stated in family size and composition-adjusted dollars.
1.6 The New York City Labor MarketPovertyratesareinfluencedbytheeconomicenvironment.AfocusofthisreportisonthechangeintheCEOpovertyratesince2008.Thenationaleconomybegantocontractsharplyinearly2008,markingDecember2007asthepriorhighwatermarkintheU.S.-widebusinesscycle.23Thus,U.S.-levelstudiestrackingtheeffectsoftherecentrecessionandsubsequentperiodofsluggishemploymentgrowthhaveused2007astheirpointofcomparison.ButtherecessioncamelatertoNewYorkCity.Here,employmentdidnotbegintodeclineuntilthefallof2008,makingthatyearthelastforwhichannualindicatorsfindincreasesinemployment,earnings,andincome.
From2008to2010,labormarketindicatorsforCityresidentspointdecidedlysouth.Asmallerproportionoftheworkingagepopulationwasholdingajob.AsFigureIThreeillustrates,theemployment/populationratio–theshareofNewYorkers18through64yearsofagewhowereholdingajobatthetimetheyweresurveyed– peakedin2008at70.8percent.Thatproportiondeclinedto66.4percentby2010.Thedownward trend,however,isbrokenbythe2011uptickinthe ratio(of0.6percentagepoints)to67.0percent.
Becausepovertystatusisdeterminedbyannualincome,employmentoverthecourseofayearisaparticularlysalientlabormarketindicator.FigureIFourshowsthat theshareoftheworkingagepopulationwithsteady
23.TheNationalBureauforEconomicResearchdatesthestartoftherecentrecessionatDecember2007.
figure i threeEmployment/Population Ratios, 2005 - 2011
Source: American Community Survey Public Use Micro Sample.
work,definedas50ormoreweeksintheprior12months,declinedfrom59.8percentin2008to56.3percentin2010,whiletheproportionofthepopulationthathadnoworkatallgrewfrom23.5percentin2008to27.3percent2010.Thelatestdataidentifyalevelingoffofthedeclineinweeksworked;theshareoftheworkingagepopulationwithyear-roundwork,forexample,heldsteady.
figure i fourWeeks Worked in Prior 12 Months, 2008 - 2011
Source: American Community Survey Public Use Micro Sample.
Thetrendinweeksworkedisreflectedinmeasuresofearnings.TableIOnereportsearningsperfamilyforthosefamiliesthatareinthelowerhalfoftheearningsdistribution.Afterregisteringsharpdeclinesfrom2008to2009and2009to2010,thechangesinearningsfrom2010to2011aretoosmalltobestatisticallysignificant.
Perc
ent o
f 18
thro
ugh
64-Y
ear-
Olds
2005 2006 2007 2008 2009 2010
67.068.7 69.3
70.868.2
66.4
2011
67.0
50
55
60
65
70
75
0
20
40
60
80
100
Perc
ent o
f 18
thro
ugh
64-Y
ear-
Olds
23.5
2008
59.8
16.7
2009 2010
24.6 27.3
16.5
56.3
2011
27.0
16.6
56.3
17.1
58.3
At Least 50 Less Than 50 No Weeks
$22,811
OfficialThresholds Incomes Poverty Rates
$22,944
$30,945
CEO Official CEO Official CEO
$30,195
19.3% 21.3%

Chapter I: Introduction 7
NYC Center for Economic Opportunity nyc.gov/ceo
Thelabormarketdatasuggestthatthe2011ACSdescribesaneconomyataturningpoint.Thereisamodestuptickinemploymentlevelsandanendtotherecession-relateddeclineinweeksworkedandannualearnings.Thecontrastbetweentheimprovementintheemployment-populationratioandthestabilityofthelattertwoindicatorsislikelyduetothewayinwhichtheACSsampleiscollected.Theemployment-populationratioindicatesrespondents’statusatthetimetheyaresurveyed.Bycontrast,theweeksworkedandannualearningsdataareretrospective,lookingbackovertheprior12months.Thustheemployment-populationratioreflectsconditionsincalendaryear2011,whiletheannualindicatorsareasrepresentativeofconditionsin2010astheyareof2011.
Calendar Years and ACS Survey Years
The American Community Survey (ACS) is conducted as a rolling sample gathered over the course of a calendar year. Approximately one-twelfth of the total sample is collected in each month. Respondents are asked to pro-vide information on work experience and income during the 12 months prior to the time they are in the sample. Households that are surveyed in January of 2011, for example, would report their income for the 12 months of 2010, households that are surveyed in February 2011 would report their income for February 2010 through January 2011, and so on. Consequently, estimates for poverty rates derived from the 2011 ACS do not, strict-ly speaking, represent a 2011 poverty rate. Rather, it is a poverty rate derived from a survey that was fielded in 2011. Readers should bear in mind this difference as they interpret the findings in this report.
1.7 Key Findings in This Report Inthecontextofalabormarketthatisrecoveringfromatwoyearslump,wefindthat:
Afterrisingfrom19.0percentin2008to20.9percentin2010,theCEOpovertyratestoodat21.3percentin2011,statisticallyunchangedfromtheprioryear.Theofficialpovertyratefollowedasimilarpath,risingfrom16.8percentin2008to18.8percentin2010.Theofficialpovertyratein2011was19.3percent,alsostatisticallyunchangedfrom2010.
AlthoughtheCEOpovertyrateexceedstheofficialrateineachyearforwhichwehavedata,theCEOmethodologyfindsthatasmallerproportionoftheCity’spopulationislivinginextremepoverty–below50percentofthepovertythreshold–thandoestheofficialmethod(5.6percentcomparedto7.9percentin2011).
ThetrendinCEOpovertyratesbyindividualcharacteristicssuchasage,familystatus(i.e.,numberofparentsinthefamilyunit),andboroughgenerallyfollowstheriseintheCitywidepovertyratefrom2008to2010anditsstatisticalstabilityfrom2010to2011.Lookingoverthe2008to2011timeperiod,wefindstatisticallysignificantincreasesinthepovertyrateformales,females,childrenunder18,workingageadults,Non-HispanicWhites,Asians,andHispanics.Therearefewstatisticallymeaningfulchangesinpovertyratesfrom2010to2011.Animportantexceptionisthedeclineinthepovertyrateforpersonslivinginasingle-headedfamilywithchildren,from33.4percentin2010to30.9percentin2011.
From2008to2011,povertyratesincreasedinthreeoutoffiveoftheCity’sboroughs:Brooklyn(by1.6percentagepointsto23.9percent),Queens(by4.8
table i one Annual Family-Level Earned Income, 2008 - 2011
Year Percentage Change
Percentile 2008 2009 2010 2011 2008-2009 2009-2010 2008-201120 $12,311 $11,116 $9,673 $10,157 -9.7% -13.0% 5.0%25 $18,701 $17,945 $16,122 $16,029 -4.0% -10.2% -0.6%30 $25,460 $24,226 $21,741 $21,970 -4.8% -10.3% 1.1%35 $31,815 $30,506 $27,818 $27,682 -4.1% -8.8% -0.5%40 $38,218 $36,707 $33,922 $33,301 -4.0% -7.6% -1.8%45 $44,640 $43,131 $40,305 $40,322 -3.4% -6.6% 0.0%50 $51,271 $50,019 $46,505 $47,000 -2.4% -7.0% 1.1%
Source: American Community Survey Public Use Micro Sample as augmented by CEO. Notes: Earnings are stated in family size and composition-adjusted dollars. They are not adjusted for inflation. Persons in families with no earnings are included.
NYC Center for Economic Opportunity nyc.gov/ceo
8 The CEO Poverty Measure, 2005 - 2011
percentagepointsto21.1percent),andStatenIsland(by3.9percentagepointsto15.3percent).
ThepatterninpovertyratesfortheUnitedStatesbasedonthenewFederalSupplementalPovertyMeasureresemblestheCEOpatternforNewYorkCity.Acrosstheentirepopulation,thetwoNAS-basedpovertymeasuresfindahigherincidenceofpovertythandotheofficialmeasures.IntheU.S.,theratein2011is16.1percentasopposedto15.1percent.InNewYorkCity,thetwopovertyrateswere21.3percentand19.3percentinthatyear.Becausetheycountthevalueofnon-cashassistance,however,boththeSPMandCEOmeasuresofpovertyamongchildrenarelowerthanchildpovertyratesbasedontheofficialmethod:18.1percentcomparedto22.3percentforthenation;24.7percentratherthan28.7percentfortheCity.
Theanalyticalsectionsofthisyear’sreportfocusontrendsinthreefamily-levelmeasuresofincome:earnings,pre-taxcash,andCEOincome.Comparisonsindicatetheextenttowhichtherecession-relateddeclinesinearnedincomewereoffsetbycashandnon-cashbenefitprograms.Wefindthat:
In2010,earnedincomestoodatonly85.4percentofits2008level.Pre-taxcash,themeasureofincomeusedintheofficialpovertymeasure,equaled91.9percentofits2008levelin2010.Bycontrast,CEOincomedidnotdeclinefrom2008to2010.From2010to2011,earningsandpre-taxcashwerestatisticallyunchanged,whileCEOincomeroseby2.5percent.ThedramaticallystrongerperformanceoftheincomemeasureusedtodeterminetheCEOpovertyratecomparedtotheincomemeasureusedtodeterminetheofficialpovertyrateistheresultofCEO’sinclusionofnon-cashsocialsafetynetprogramsthatareuncountedintheofficialpovertymeasure.
Participationinsafetynetprogramstendstogrowasneedincreasesduringeconomiccontractions.Inadditiontothis“passive”expansion,policymakerstookactivestepsduringtherecessiontobolsterthepurchasingpoweroflow-incomefamiliesbycreatingnewandexpandingexistingtaxcreditprograms.TheyalsoincreasedbenefitlevelsandfosteredparticipationintheFoodStampprogram.WefindthattheseadditionalstepsbluntedwhatwouldhavebeenaverysharpriseintheCEOpovertyratefrom2008to2011.Weestimatethatwithoutthesesteps,theCEOpovertyratewouldhaveincreasedto23.6percentin2011,insteadof 21.3percent.
Theremainderofthisreportproceedsasfollows:ThenextchapterprovidesanoverviewoftrendsintheofficialandCEOpovertyratesfrom2005to2011.Inthatcontextwetracehowchangesinthethresholdandresourcesidesofthetwomeasuresdeterminedchangesintheirrespectivepovertyrates.ChapterIIIdetailspovertyratesinNewYorkCitybydemographiccharacteristic,familystatus,andborough.InChapterIV,wecompareofficialandCEOpovertyratesforNewYorkCitytoofficialandSupplementalPovertyMeasureratesfortheUnitedStates.Thefollowingchapterexploresthedegreetowhichcashandnon-cashpublicbenefitprogramsoffsetrecession-relateddeclinesinearnedincome.Thereport’sfinalchapterofferssomethoughtsontheimplicationsofourfindings.Asetofappendicesprovidemoredetailabouthowourpovertyestimates arecreated.

Chapter II: Poverty in New York City, 2005 - 2011 9
NYC Center for Economic Opportunity nyc.gov/ceo
ChaPTer ii: PoverTy in new york CiTy, 2005 - 2011TheIntroductionnotedthattheCEOpovertyrateexceedstheofficialratein2011.Indeed,itdoessoineachoftheyearsforwhichwehavecomparabledata.Thefocusofthischapter,however,isnotonthedifferentlevelsofpovertyderivedfromthetwoapproaches,butonhowandwhytheychangeovertime.TheofficialandCEOpovertyrateshavetakenparallelpathsduringtheseven-yeartimespancoveredbythisreport.From2005to2008,whentheCityeconomywasexpanding,thetwomeasuresregisterdeclinesofsimilarmagnitude.From2008to2011,theyrecordnearlyequalincreases.
ThischapterbeginswithanoverviewofhowandwhytheofficialandCEOpovertyrateschangedfrom2005to2011.Thesimilarityintheirtrendmasksimportantdifferencesbetweenthemeasures.From2008to2010,recession-relateddeclinesintheofficialmeasureofincome–pre-taxcash–aredramatic.Overthesametimeperiod,CEOincomewasremarkablystable.From2010to2011,officialincomewasunchangedwhileCEOincomerose.
Asecondsectioninthechapterexploresthedepthofpoverty,thedegreetowhichthepoorarelivingclosetoorfarbelowthepovertythreshold,aswellastheextentofnearpoverty(thedegreetowhichthepopulationthatresidesabovethepovertylineisuncomfortablyclosetoit).BecauseCEO’spovertymeasureprovidesamoreinclusivedefinitionofincome,itfindsasmallerproportionofthepopulationinextremepovertythandoestheofficialmeasure.Ontheotherhand,becauseeligibilityformeans-testedbenefitsendsandthevalueoftaxcreditsphaseoutasincomesrise,theCEOmeasurefindsalargershareofthepopulationlivinginnearpovertycomparedtotheofficialmeasure.
Thechapter’sthirdsectionexplorestherolethatnon-cashresourcesandnon-discretionaryexpensesplayintheCEOpovertymeasure.Wefindthatsince2008,taxprogramsandFoodStampshavebecomeincreasinglyimportantresourcesforlow-incomefamilies.Thisisnotsimplya“passive”outcomereflectinggreaterneedinabadeconomy.Itisalsoaresultofpolicychoices,atopicweexploreinChapterFive.
2.1 New York City Poverty Rates, 2005 - 2011ChangesintheofficialandCEOpovertyratefrom2005to2011moveintandemwiththelabormarketconditionsdescribedintheIntroduction.Povertydeclinesduringtheexpansionandrisesafter2008.FigureIIOneillustratestheofficialandCEOpovertyratesforNewYorkCityovertheseven-yeartimespancoveredinthisreport.
figure ii oneOfficial and CEO Poverty Rates, 2005 - 2011
Source: American Community Survey Public Use Micro Sample as augmented by CEO. Note: Official poverty rates are based on the CEO poverty universe and unit of analysis.
TableIIOneprovidestheseratesandadditionally,reportsdifferencesbetweenthemandchangesovertime.Asnotedabove,theCEOpovertyrateexceedstheofficialrateineachyear,adifferencethatrangesfrom2.0to3.0percentagepoints.However,changesinthetworatesovertimeareremarkablysimilar.WhiletheCityeconomywasgrowing,from2005to2008,theofficialpovertyratedeclinedby1.5percentagepointswhiletheCEOpovertyratefellby1.3percentagepoints.From2008to2010,asemploymentandearningscontracted,theofficialpovertyrateroseby2.1percentagepointsto18.8percent,andtheCEOpovertyrateclimbedby1.9percentagepoints,reaching20.9percentin2010.Themostrecentdatareflectastabilizinglabormarket;neitherpovertyrateexperiencedastatisticallysignificantchangefrom2010to2011.
Perc
ent o
f the
Pop
ulat
ion
2005 2006 2007 2008 2009 2010 2011
Official CEO
12
14
16
18
20
22
24
18.317.9
16.8 16.817.3
18.8
20.9
19.719.0
19.819.820.3
21.3
19.3

NYC Center for Economic Opportunity nyc.gov/ceo
10 The CEO Poverty Measure, 2005 - 2011
table ii oneOfficial and CEO Poverty Rates, 2005 - 2011(Numbers are Percent of the Population)
Year Official CEO
Percentage Point
Difference*2005 18.3 20.3 2.0
2006 17.9 19.8 1.9
2007 16.8 19.8 3.0
2008 16.8 19.0 2.3
2009 17.3 19.7 2.3
2010 18.8 20.9 2.1
2011 19.3 21.3 2.0
Percentage Point Change* Official CEO
2005-2008 -1.5 -1.3
2008-2010 2.1 1.9
2010-2011 0.5 0.4 *Differences and changes are measured in percentage points and are taken from unrounded numbers; those in bold type are statistically significant. Source: American Community Survey Public Use Micro Sample as augmented by CEO. Note: Official poverty rates are based on the CEO poverty universe and unit of analysis.
TableIITwoexploresthechangesinpovertyratesfromthevantagepointofchangesontheincomeandthresholdsideoftheirrespectivepovertymeasures.24 Asthetable’sPanelAreports,theofficialmeasureofincome–pre-taxcash–roseineachyearfrom2005 to2008,growingby17.7percentacrossthethree years.From2008to2010,pre-taxcashplungedby 8.1percent.Thismeasureofincomewasunchangedfrom2010to2011.
24.Tomaketheincomefiguresinthetablecomparabletothetwo-adult,two-childfamilypovertythresholds,theyareadjustedforfamilysizeandcomposition.Pre-taxcashandCEOincomesarebothreportedatthe20thpercentileoftheirrespectivedistributionsandbotharestatedincurrent,notinflationadjusted,dollars.
Changesinincometellastoryaboutpovertyrateswhentheyarecomparedagainstchangesinthepovertythreshold.Inthe2005to2008period,year-to-yearchangesinpre-taxincomeexceededthechangeintheofficialthreshold.From2006to2007,forexample,thismeasureofincomeroseby7.8percentwhiletheofficialthresholdedgedupby2.9percent.Asaconsequence,theofficialpovertyratedeclinedby1.2percentagepoints.Inthetwo-yearperiodfrom2008to2010,bycontrast,thesteepfallinincome(by8.1percent)wascoupledwithamodestriseintheofficialthreshold(by1.3percent),leadingtoariseintheofficialrateof2.1percentagepoints.The3.2percentclimbintheofficialthresholdfrom2010to2011outpacedtheessentiallyunchangedmeasureofincome,whichgeneratedanarithmeticriseintheofficialpovertyrateby0.5percentagepoints.Thisincrease,however,wasnotlargeenoughtobestatisticallysignificant.
PanelBinthetableprovidesthesameinformationforCEOincome,thresholds,andpovertyrates.Thepatternofrisingincomesandgrowthinthepovertythresholdsitdescribes,from2005to2008,mimicsthepatternfortheofficialmeasure.The20.9percentriseinCEOincomefrom2005to2008outpacedthe17.5percentincreaseintheCEOthreshold,leadingtoafallinthepovertyrateby1.3percentagepoints.
From2008to2010theCEOpovertyrateroseby1.9percentagepoints,roughlyequaltotheclimbintheofficialrate.Butthesimilarityinthetwopovertyrateincreasesmasksimportantdifferencesontheincomesideofthepovertymeasure.CEOincomeisremarkablymorestablethanofficialincome;itwasessentiallyunchangedfrom2008to2010.From2010to2011,itroseby2.5percent,asomewhatmoremodestpacethanthe3.0percentincreaseintheCEOthreshold.Thisresultedinasmall,butnotstatisticallysignificant,uptickintheCEOpovertyratefrom2010to2011.

Chapter II: Poverty in New York City, 2005 - 2011 11
NYC Center for Economic Opportunity nyc.gov/ceo
table ii two Income, Thresholds, and Poverty Rates, Official and CEO, 2005 - 2011
A. Official Income, Thresholds, and Poverty Rates
Income (Pre-tax Cash) Threshold Poverty Rate
Year LevelPercentage
Change* LevelPercentage
Change* Level
Percentage Point
Change*2005 $21,154 $19,806 18.3%
2006 $22,339 5.6% $20,444 3.2% 17.9% -0.3
2007 $24,083 7.8% $21,027 2.9% 16.8% -1.2
2008 $24,896 3.4% $21,834 3.8% 16.8% 0.0
2009 $24,087 -3.2% $21,756 -0.4% 17.3% 0.6
2010 $22,873 -5.0% $22,113 1.6% 18.8% 1.5
2011 $22,944 0.3% $22,811 3.2% 19.3% 0.5
Percentage Change
Percentage Change
Percentage Point Change
2005-2008 17.7% 10.2% -1.5
2008-2010 -8.1% 1.3% 2.1
B. CEO Income, Thresholds, and Poverty Rates
Income Threshold Poverty Rate
Year LevelPercentage
Change* LevelPercentage
Change* Level
Percentage Point
Change*2005 $24,332 $24,532 20.3%
2006 $25,711 5.7% $25,615 4.4% 19.8% -0.5
2007 $27,108 5.4% $26,979 5.3% 19.8% 0.0
2008 $29,417 8.5% $28,822 6.8% 19.0% -0.8
2009 $29,483 0.2% $29,265 1.5% 19.7% 0.6
2010 $29,465 -0.1% $30,055 2.7% 20.9% 1.2
2011 $30,195 2.5% $30,945 3.0% 21.3% 0.4
Percentage Change
Percentage Change
Percentage Point Change
2005-2008 20.9% 17.5% -1.3
2008-2010 0.2% 4.3% 1.9 *Change from prior year.Source: American Community Survey Public Use Micro Sample as augmented by CEO.Notes: Official poverty rates are based on the CEO poverty universe and unit of analysis.Incomes are measured at the 20th percentile and are stated in family size and composition-adjusted dollars. They are not adjusted for inflation. Differences in poverty rates are measured in percentage points and are taken from unrounded numbers; those in bold type are statistically significant..
NYC Center for Economic Opportunity nyc.gov/ceo
12 The CEO Poverty Measure, 2005 - 2011
FigureIITwoillustratesthedifferenceintheincometrendsandshedsfurtherlightonitbybringingtheearningsdatareportedintheIntroduction’sTableIOneintothepicture.Thefiguremeasuresfamily-levelearnings,officialincome(pre-taxcash),andCEOincome,relativetotheirrespectivelevelsin2008.25 Eachincomemeasureisscaledtoequal100percentinthatyear.Earningsisthesimplestofthethreeincomemetrics,consistingofwages,salaries,andincomefromself-employmentperfamily.Itishighlydependentonemploymenttrendsandthusiscloselytiedtothebusinesscycle.In2010earningswere85.4percentoftheirlevelin2008.From2010to2011,earningsceasedtheirdecline.
Pre-taxcash(theofficialpovertymeasure’sdefinitionofincome)includesearnings,alongwithincomefrominvestmentsand–mostimportantlyinthiscontext–transferpaymentsiftheytaketheformofcash.Butinterestingly,thetimetrendforthisbroadermeasureisquitesimilartoearnings’trend.Despitetheinclusionofincomefrompublicassistance,SupplementalSecurityIncome(SSI),SocialSecurity,andUnemploymentInsuranceinpre-taxcash,thedeclineinthisincomemetricfrom2008to2010closelytracksthefallinearnings.Pre-taxcashin2010was91.9percentofits2008level,suggestingthatthecashsafetynetprovidedaverymodestcushionforlow-incomefamiliesastheeconomywascontracting.Parallelingthetrendinearnings,totalpre-taxcashincomewasunchangedfrom2010to2011.
ThestabilityofCEOincomeduringtheeconomicdownturnistheoutlierinthefigure,reflectingtheextenttowhichnon-cashresources(suchastaxcreditsandin-kindbenefits)filledtheincomegapcreatedbytherecession-relateddeclineinearnings.Aftertwoyearsofeconomicdecline,itstoodat100.2percentofits2008levelin2010.Thismeasureofincomethenroseto102.6percentofits2008levelin2011.
IfCEOincomewassomuchmorestablethantheofficialincomemeasure,whydidthetwopovertyrateshavesimilarincreasessince2008?TheansweristhemorerapidincreaseintheCEOpovertythresholdduringtheeconomicdownturn.AsTableIITwoindicates,the
25.Asinthepriortables,eachincomemeasureisstatedinfamilysizeandcomposition-adjusteddollars.OfficialandCEOincomesaretakenatthe20thpercentileoftheirrespectivedistributions.Earningsaremeasuredatthe30thpercentile.Allthreemeasuresarestatedincurrent,notinflationadjusted,dollars.
figure ii two Comparison of Income Trends, 2005- 2011
Source: American Community Survey Public Use Micro Sample as augmented by CEO. Notes: Earnings are measured at the 30th percentile and incomes are measured at the 20th percentile of their respective distributions. Incomes are not inflation adjusted.
officialthresholdslippedby0.4percentfrom2008to2009andedgedupby1.6percentfrom2009to2010.26Reflectingthepost-bubblefall-offinhousingexpenditures,thegrowthintheCEOthresholdfrom2008onwardisconsiderablyslowerthanitsrisefrom2005to2008.Butitsincreaseoutpacedtheriseintheofficialthresholdoverthenexttwoyears,growingby1.5percentfrom2008to2009andby2.7percentfrom2009to2010.From2010to2011,however,theofficialandCEOthresholdsgrewatsimilarrates,by3.2percentand3.0percent,respectively.
FigureIITwoalsoillustrateshowthetrendsinvariousincomemeasurescomparetothegrowthintheCEOthreshold.By2010theCEOpovertythresholdstoodat104.3percentofits2008value,illustratingagrowinggapbetweenthethresholdandalltheincomemeasures,includingCEOincome.ButthatgrowthismodestrelativetothechasmthatwouldhaveemergedhadCEOincomefallenasrapidlyasearningsorofficialincome.
26.Thedeclineintheofficialpovertythresholdfrom2008to2009isduetoararefallintheConsumerPriceIndex.
Official Income
100.0%
104.3
100.2
91.9
85.4
2008
= 10
0%
2008 2009 2010 2011
Family-Level EarningsCEO Income CEO Threshold
80
85
90
95
100
105
110107.4
102.6
92.2
86.3

Chapter II: Poverty in New York City, 2005 - 2011 13
NYC Center for Economic Opportunity nyc.gov/ceo
2.2 The Depth of Poverty and Extent of Near PovertyThepovertyrateisaone-numbersummarymeasure.Itsimplytellsuswhatfractionofthepopulationlivesbelowthepovertythreshold.Becauseitisbasedon abinaryclassification–peopleareeitherpoorornot poor–theratemakesnodistinctionbetweenthepoorwholivefarbelowthepovertylineandthosewholivejustunderit.Bythesametoken,thepovertyratedoesnotindicatewhetherarelativelylargeshareofthenon-poorlivesjustabovethelineorfarbeyondit.Thesecanbeimportantdistinctions.Thedistancebetweenpeoplejustbelowandthosejustabovethepovertylinemayonlybeafewdollars,whilethedistancebetweenthepoorestofthepoorandthosejustbelowthepovertythresholdcanbe$20,000ormore.
TableIIThreecomparesthedistributionofthepopulationbypercentagesofthepovertythresholdundertheofficialandCEOpovertymeasuresfor2011.Forbothmeasuresweclassifythepopulationaslivingbelow50percent,50through74percent,75through99percent,100through124percent,and125through149percentofthepovertyline.Werefertothesecategoriesasdegreesofpoverty.Becausethetwomeasures’thresholdsdiffer,thetableprovidesthecorrespondingvaluesofthereferencefamily’spovertythresholdthatdefineeachinterval.
Thetableindicatesthat,althoughalargershareofthepopulationlivesbelow100percentoftheCEOpovertythresholdthantheofficialpovertyline,asmallershareofthepopulationundertheCEOmeasureislivinginextremepoverty,below50percentofthepovertythreshold(5.6percentagainst7.9percent).ThisdifferenceisparticularlystrikinggiventhehigherCEOthreshold.Atthe50percentlevelitequals$15,472,while50percentoftheofficialthresholdisonly$11,406.Itresultsfromthedifferencesinthemeasures’definitionsofincome.BecausethemoreinclusiveCEOmeasureaccountsforresourcesomittedintheofficialdefinitionofincome,itprovidesamoreinformativegaugeoftheabilityofthesocialsafetynettoprotectvulnerablefamiliesfromextremepoverty.
Therelativelysmallerproportionofthepopulationthatislivingbelow50percentofthepovertythresholdimplies,ofcourse,thatusingtheCEOmeasure,alargershareoftheCitypopulationliesbetween50through99percentofthepovertythresholdthanwiththeofficialmeasure.ThetableshowsthatundertheCEOmeasure,5.7
percentand10.0percentofthepopulationwereinthe50through74percentand75through99percentintervals,respectively.Thecorrespondingsharesundertheofficialmeasurewere5.3percentand6.1percent.
Inadditiontoclassifyingalargershareofthepoorcloseto100percentofthepovertyline,theCEOmeasurealsoplacesalargerproportionofthenon-poornearpoverty.The“nearpoor”–peoplewhoareinthe100through124percentand125through149percentofthepovertythresholdgroups–are12.9percentand11.7percent,respectively,oftheCitypopulationwiththeCEOmeasure.Undertheofficialmeasure,thesetwocategoriescontainonly5.8percentand5.5percentofthepopulation,respectively.AgreatershareofthepopulationisnearpoorusingtheCEOmeasurethantheofficialmeasurefortworeasons.First,theCEOthresholdcreateswiderincomebands;allelseequaltheywouldcontainmorepeople.Second,familiesthatlieabove,butcloseto,theCEOthresholdareinthephase-outrangeoftaxcreditsandincomecutoffpointsformeans-testedassistance.TheirCEOincome,therefore,canbelessthantheirpre-taxcashincome,makingthemmorelikelytobenearthepovertythreshold.
table ii three Distribution of the Population by Degrees of Poverty, Official and CEO, 2011
A. Official Poverty Measure
Percent of Poverty Threshold
Reference Family Threshold Range Percent
Cumulative Percent
Less than 50 Less than $11,406 7.9% 7.9%
50-74 $11,406 - $17,107 5.3% 13.1%
75-99 $17,108 - $22,810 6.1% 19.3%
100-124 $22,811 - $28,513 5.8% 25.1%
125-149 $28,514 - $34,216 5.5% 30.6%
B. CEO Poverty Measure
Percent of Poverty Threshold
Reference Family Threshold Range Percent
Cumulative Percent
Less than 50 Less than $15,472 5.6% 5.6%
50-74 $15,472 - $23,208 5.7% 11.3%
75-99 $23,209 - $30,944 10.0% 21.3%
100-124 $30,945 - $38,680 12.9% 34.1%
125-149 $38,681 - $46,416 11.7% 45.8%
Source: American Community Survey Public Use Micro Sample as augmented by CEO.Note: Official poverty rates are based on the CEO poverty universe and unit of analysis.

NYC Center for Economic Opportunity nyc.gov/ceo
14 The CEO Poverty Measure, 2005 - 2011
Giventhesimilaritiesintrendsinthepovertyratesnotedinthepriorsection,doesthisfiner-grainedperspectiverevealdifferencesinthepovertymeasures’changeovertime?TableIIFourfocusesontheriseinpovertyfrom2008to2011andsimplifiesTableIIThree’sgroupings.Wetracktheshareofpopulationthatisbelow50percent,50through99percent,and100through149percentofthepovertythreshold.Thefinalcolumninthetablegivesthepercentagepointchangeinthesharesfrom2008to2011.Thetable’sPanelAindicatesthat,fortheofficialpovertymeasure,alloftheincreasesinthisperiodarestatisticallysignificant,includingthe1.0percentagepointriseintheshareofthepopulationthatisbelow50percentofthepovertythreshold.PanelBrevealsthattherewasalsoanincreaseinextremepovertyusingtheCEOmethodology,of0.5percentagepoints.27Whiletheincreasesinthepovertyratesforthedifferentdegreesofofficialpovertyarefairlysimilar,theincreaseinnearpovertyusingtheCEOmeasureisnotablylargerthantheuptickinextremepoverty.
table ii four Distribution of the Population by Degrees of Poverty, Official and CEO, 2008 - 2011(Numbers are Percent of the Population)
A. Official Poverty MeasurePercentage
Point Change*2008 2009 2010 2011 2008 - 2011
Below 50 percent
6.9 7.3 7.7 7.9 1.0
50 through 99 percent
9.9 10.0 11.1 11.4 1.5
100 through 149 percent
9.8 10.1 10.5 11.4 1.5
B. CEO Poverty Measure
Below 50 percent
5.1 4.8 5.6 5.6 0.5
50 through 99 percent
13.9 14.8 15.3 15.7 1.7
100 through 149 percent
22.0 22.6 24.1 24.6 2.6
*Changes are percentage point changes. Those in bold are statistically significant.Source: American Community Survey Public Use Micro Sample as augmented by CEO. Note: Official poverty rates are based on the CEO poverty universe and unit of analysis.
27.Thedifferencebetweenthetwoincreasesinextremepovertyfrom2010to2011isnotstatisticallysignificant.
2.3 The Effect of Non-Cash Resources on the CEO Poverty RateTheincomedatareportedinTableIITwoindicatethatfrom2008to2010,pre-taxcashincomeplungedby8.1percent.Wenotedhowthesharpdropinthisincomemetriccloselytrackedtherecession-relateddeclineinearnings.Overthesameperiod,CEOincomewasessentiallyunchanged.From2010to2011,thetwoincomemeasurescontinuedalongdifferentpaths.Officialincomewasunchanged,whileCEOincomerose.Clearly,componentsofCEOincomeotherthanpre-taxcashsoftenedtheblowtheeconomicdownturndeliveredtolow-incomefamiliesandwereresponsiblefortheriseinincomeinthelatestdata.Whichincomesourcesandwhatprogramshavehadthemostimportantimpact?
Theeffectsoftheadditional(non-pre-taxcash)incomesourcesareidentifiedinTableIIFive.Thetable’sPanelAreportspovertyrates.Thefirstrow,labeled“TotalCEOIncome,”givesthepovertyrateusingthefullCEOincomemeasure.Thisisfollowedbypovertyratescalculatedbyomittingoneofthenon-pre-taxcashelementsofCEOincome.ThepovertyratesthatarebasedontheomissionofanitemthataddsresourcestoCEOincome–beginningwiththerowforthehousingadjustmentandendingwiththeHomeEnergyAssistanceProgram(HEAP)–arehigherthanthetotalincomerates.Likewise,thepovertyratesthatresultfromleavingoutitemsthatreduceresources–payrolltaxesthroughmedicalout-of-pocketexpenditures(MOOP)–arelowerthanthefullresourcepovertyrate.
Theeffectofomittingeachincomeelement,reportedinthetable’sPanelB,isthedifferencebetweenthepovertyratewithouttheincomeelementandthefullresourcepovertyrate.ItgaugesthepercentoftheCitypopulationthatismovedinoroutofpovertybytheinclusionoftheitemintheCEOdefinitionofincome.Forexample,the2011povertyratethatisnetofthehousingadjustmenttoincomeis27.5percent.Thedifferencebetweenthispovertyrateandthetotalincomepovertyrateof21.3indicatesthat,allelseequal,thehousingadjustmentlifted6.2percentofthepopulationovertheCEOpovertythreshold.(Themarginaleffectofeachincomeelementin2011isalsoillustratedinFigureIIThree.)

Chapter II: Poverty in New York City, 2005 - 2011 15
NYC Center for Economic Opportunity nyc.gov/ceo
Thetableprovidesthisinformationfor2005to2011,andallowsustolookatchangeovertime.Duringtheseyearstherankingsofthemarginaleffectsarequitestable.Thehousingadjustmenthasthelargestpoverty-reducingeffectineachyear,followedbyincometaxesandFoodStamps.(Theincometaxsystemreducespoverty becausesomanylow-incometaxfilersbenefitfrom taxcreditsthatnotonlyeliminatetheirtaxliability, butgeneraterefundsthatcreateanetadditiontotheir after-taxincome.)Theotherpoverty-reducingincome elements–schoolmeals,theSupplementalNutritionalProgramforWomen,Infants,andChildren(WIC),andHEAP–haverelativelyminoreffectsontheCitywidepovertyrate,eitherbecausetheyarenarrowlytargeted(WIC)orbecausetheirbenefitlevelsaresosmall(HEAP).
Ontheothersideoftheledger,MOOPconsistentlyhasthelargestpoverty-increasingeffectofthenon-discretionaryexpensesthatreducefamilyincomes.28Thisisfollowedbypayrolltaxes(FICA)andcommutingcosts,whichhavenotable,andnearlyequal,effects.Although
28.Themarginaleffectformedicalout-of-pocketexpendituresdropsafter2007.ThismaybearesultofachangeintheACSquestionnaireaswellastheimplementationofprescriptiondrugcoverageforMedicareenrollees.SeeAppendixGformorediscussion.
childcarecostscanbeaconsiderabledrainonafamily’sresources,theyareincurredbytoosmallashareofthetotalpopulationtohavemucheffectontheCitywidepovertyrate.
Thestabilityoftherankings,however,doesnotmeanthattherewerenoimportantchangesinthesemarginaleffects.Incometaxprogramsbrought2.9percentofthepopulationoutofpovertyin2007,butthiseffectleaptto4.3percentagepointsin2008andstayedatthislevelthrough2010.Thedropoffintheincometaxeffectin2011reflectstheexpirationofseveralincometaxcreditprograms,particularlytheMakingWorkPayCredit.However,thechangeintheincometaxeffectwasoffsetbya2.0percentagepointreductioninthepayrolltaxrate.Themarginal,povertyincreasing,effectofpayrolltaxesfellfrom2.1percentagepointsin2010to1.8percentagepointsin2011.TheincreasingimportanceofFoodStampsalsobeganin2007,risingfrom1.8percentagepointsinthatyearto3.6percentagepoints in2011.

NYC Center for Economic Opportunity nyc.gov/ceo
16 The CEO Poverty Measure, 2005 - 2011
table ii five Marginal Effects of Non-Cash Resources on CEO Poverty Rates, 2005 - 2011 (Numbers are Percent of the Population)
2005 2006 2007 2008 2009 2010 2011A. Poverty Rates
Total CEO Income 20.3 19.8 19.8 19.0 19.7 20.9 21.3
Net of:
Housing Adjustment 25.5 25.2 25.4 24.6 25.5 26.4 27.5
Income Taxes 23.3 22.7 22.7 23.3 24.0 25.2 24.9
Food Stamps 22.3 21.8 21.6 21.2 22.3 24.4 24.9
School Meals 20.9 20.4 20.3 19.6 20.2 21.4 21.8
WIC 20.4 19.9 19.9 19.1 19.7 21.0 21.3
HEAP 20.3 19.8 19.8 19.0 19.7 20.9 21.3
FICA (Payroll Taxes) 18.5 17.6 17.7 17.0 17.6 18.8 19.5
Commuting 19.0 18.4 18.1 17.5 18.0 19.2 19.5
Childcare 20.1 19.5 19.6 18.8 19.5 20.6 21.1
MOOP 16.9 16.3 15.9 15.8 16.5 18.1 18.3
B. Marginal Effects
Housing Adjustment -5.2 -5.4 -5.6 -5.5 -5.8 -5.5 -6.2
Income Taxes -3.0 -2.9 -2.9 -4.3 -4.3 -4.3 -3.6
Food Stamps -2.0 -2.0 -1.8 -2.1 -2.7 -3.5 -3.6
School Meals -0.6 -0.6 -0.5 -0.6 -0.5 -0.5 -0.5
WIC -0.1 -0.1 -0.1 -0.1 -0.1 -0.1 -0.1
HEAP 0.0 0.0 0.0 0.0 0.0 0.0 0.0
FICA (Payroll Taxes) 1.8 2.2 2.1 2.0 2.0 2.1 1.8
Commuting 1.3 1.4 1.7 1.5 1.7 1.6 1.7
Childcare 0.2 0.3 0.2 0.2 0.2 0.3 0.2
MOOP 3.4 3.5 3.9 3.2 3.2 2.8 2.9
Source: American Community Survey Public Use Micro Sample as augmented by CEO.

Chapter II: Poverty in New York City, 2005 - 2011 17
NYC Center for Economic Opportunity nyc.gov/ceo
figure ii threeMarginal Effects of Income Elements on CEO Poverty Rate, 2011
Source: American Community Survey Public Use Micro Sample as augmented by CEO. Note: See Chapter I for definition of resources.
ThegrowingeffectivenessoftaxcreditsandtheFoodStampprogramsarefurtherexploredinChapterFive.29 Beforeturningtotheseissues,thenextchapterexploreshowpovertyrateshavechangedacrossdemographicgroupsandtheCity’sfiveboroughs.ThisisfollowedbyacomparisonofpovertymeasuresinNewYorkCitytosimilarmeasuresfortheUnitedStates.
29.TableIIFivealsoindicatesajumpintheeffectofthehousingadjustmentfrom2010to2011.UnlikethechangeswehavenotedfortaxprogramsandFoodStamps,thisdoesnotappeartobedrivenbyanychangeinpolicy.Rather,aswenoteinAppendixC,itisareflectionofseveralfactorsincludingagreatershareofthepopulationparticipatinginmeans-testedhousingprogramsinthe2011versusthe2008HousingandVacancySurveys.
-6.2
-3.6 -3.6
-0.5-0.1 0.0
0.2
1.7 1.8
2.9
Perc
enta
ge P
oint
Eff
ect
Housing Adjustment
Income Taxes
Food Stamps
School Meals
WIC
Energy Assistance
Payroll Taxes
Commuting
Childcare
Medical Expenses
-8
-6
-4
-2
0
2
4

NYC Center for Economic Opportunity nyc.gov/ceo
18 The CEO Poverty Measure, 2005 - 2011

Chapter III: CEO Poverty Rates in Demographic Detail, 2005 - 2011 19
NYC Center for Economic Opportunity nyc.gov/ceo
ChaPTer iii: Ceo PoverTy raTes in demograPhiC deTail, 2005 - 2011AsnotedinChapterOne,CEOemploystheAmericanCommunitySurveyasourprincipaldatasetbecauseitprovidesalargeannualsampleofNewYorkCityresidents,allowingustotrackpovertyratesforkeypopulationgroups.Thischapterreportspovertyratesbydemographiccharacteristic,familycomposition,workexperience,andboroughoverthe2005to2011period.Wheretheyarestatisticallysignificantwenotedifferencesbetweengroups,suchasthedisparitybetweenpovertyratesbyraceandHispanicethnicity.Thechapter’stextandtablesalsonotechangesovertime.Byandlargethepatternofchangeforsub-groupsoftheCity’spopulationparallelsthechangesdescribedinChapterTwo.Povertyratesfallfrom2005to2008,thenriseinthecontextofaweaklabormarket.Becausesofewofthechangesfrom2010to2011arestatisticallymeaningful,wefocusonchangesinpovertyratesbetween2008and2011.(Wheretherearesignificantchangesfrom2010to2011,theyarenotedinthetext.)TableIIIOneprovidespovertyratesbydemographiccharacteristic.TableIIITworeportspovertyratesbyfamilycompositionandworkexperience.PovertyratesbyborougharegiveninTableIIIThree.Statisticallysignificantchangesareidentifiedinthetableswithboldtype.Thefinalcolumnofeachofthetables’rowsprovidescontextbygivingthesub-group’sshareoftheCitywidepopulation.
3.1 Poverty Rates by Demographic Characteristic of the IndividualWhentheyarestatisticallysignificant,changesinpovertyratesfrom2005to2008and2008to2011almostalwaysfollowthecyclicalpatternevidentintheCitywidepovertyrate.Oneexceptionwasariseinpovertyamongworkingageadultswithsome,butlessthanfull-time,year-roundwork,whichroseduringtheeconomicexpansion.Allthestatisticallysignificantchangesinpovertyratesbetween2008and2011havebeenincreases.
Poverty Rates by Gender: Femalesaremorelikelytoliveinpovertythanmales.In2011,forexample,thepovertyrateforfemaleNewYorkerswas22.2percentwhileitstoodat20.2percentfortheirmalecounterparts.Bothmaleandfemalepovertyratesdeclinedfrom2005
to2008,by1.1percentagepointsand1.4percentagepoints,respectively.From2008to2011,bothmaleandfemalepovertyratesrose,by2.3percentagepointsformalesandby2.2percentagepointsforfemales.
Poverty Rates by Age:Childrenarepoorerthanadults.In2011,thepovertyrateforchildrenunder18was24.7percent,significantlyhigherthanthe19.9percentrateforworking-age(18through64yearsofage)adultsandthe22.4percentrateforelderly(65andolder)adults.Allthreeagegroupsexperiencedpovertyratedeclinesfrom2005to2008.From2008to2011,thepovertyrateforchildrenandworking-ageadultsincreasedby1.6percentagepointsand3.0percentagepoints,respectively.
Poverty Rates for Children by Presence of Parent: Childreninsingle-parentfamiliesarealmosttwiceaslikelytobeinpovertyaschildrenlivinginatwo-parentfamily,34.7percentversus18.7percentin2011.Thepovertyrateforchildrenlivingwithtwoparentsfellfrom2005to2008,whilethepovertyrateforchildrenlivingwithonlyoneparentdidnotdeclineoverthisperiod.Since2008thepovertyrateforchildrenintwo-parentfamiliesincreasedby3.2percentagepoints.Thepovertyrateforchildreninsingle-parentfamilieswasunchanged.
Poverty Rates by Race/Ethnicity: In2011,thepovertyrateforNon-HispanicWhiteswas15.4percent,thelowestrateofanymajorrace/ethnicgroupintheCity.Non-HispanicBlackshavetheCity’snextlowestpovertyrate,21.4percentin2011.ThepovertyratesforNon-HispanicAsiansandHispanicsarestatisticallyequivalentandaretheCity’shighest,at26.5percentand25.3percent,respectivelyin2011.
From2005to2008,povertyratesdeclinedforNon-HispanicWhites(by1.6percentagepoints)andforHispanics(by2.0percentagepoints).ThepovertyratesforNon-HispanicWhites,Non-HispanicAsians,andHispanicsrosefrom2008to2011,by2.2percentagepoints,4.1percentagepoints,and1.8percentagepoints,respectively.Throughoutthe2005to2011period,thepovertyrateforNon-HispanicBlackshasbeenremarkablystable.

NYC Center for Economic Opportunity nyc.gov/ceo
20 The CEO Poverty Measure, 2005 - 2011
Race/Ethnicity
Race/Ethnicity categories are constructed as follows: First, individuals are categorized by Hispanic ethnicity into Non-Hispanic and Hispanic ethnic groups; Non-His-panic individuals are then categorized by race. We use three racial categories: White, Black, and Asian. Each only includes persons who identify themselves as mem-bers of one racial group. This sorting of the population omits 2.5 percent of the City population that is Non-Hispanic and multi-racial or Non-Hispanic and a member of some other race, such as Native American. We omit this residual category from Table III One.
Poverty Rates by Nativity/Citizenship: The 2011 povertyratefornon-citizenswas28.9percent,whichissignificantlyhigherthanpovertyratesforbothcitizensbybirth(19.7percent)andnaturalizedcitizens(19.1percent).Duringthe2005to2008economicexpansion,onlycitizensbybirthrecordedadeclineinpoverty(of1.3percentagepoints).From2008to2011,citizensbybirthandnon-citizensexperiencedpovertyrateincreasesof2.1and4.2percentagepoints,respectively.
Poverty Rates for Persons 18 through 64 by Educational Attainment: Forworkingageadults,theprobabilityofbeinginpovertyisinverselyproportionaltoeducationalattainment.Thosewithlessthanahighschooleducationareoverthreetimesmorelikelytobeinpovertythanthosewithabachelor’sdegreeorhigher(31.8percentagainst9.4percent).The2011povertyratesforthosewithahighschooldegreeandsomecollegefellbetweenthesetwoextremes,at24.6percentand16.7percent,respectively.
Povertyratesbyeducationalattainmentwereunchangedfrom2005to2008.From2008to2011,povertyratesroseforworkingageadultswithonlyahighschooldegree(by5.4percentagepoints),thosewithsomecollege(by3.1percentagepoints),andthosewithatleastabachelor’sdegree(by1.8percentagepoints).
Poverty Rates for Persons 18 through 64 by Work Experience: Povertyratesvarymarkedlybyworkexperience.In2011thepovertyratefornon-elderlyadultsthatworkedfull-time,year-roundwas7.5percent;forthosewithnoworkitstoodat38.7percent.Workingageadultswithsomeworkhadapovertyrateof24.4percent.Workingageadultswithsomeworkwastheonlycategorywhosepovertyraterose(3.0percentagepoints)duringthe2005to2008economicexpansion.Allthreeworkexperiencegroupssawstatisticallysignificantincreasesfrom2008to2011.Thepovertyrateforfull-time,year-roundworkersroseby1.2percentagepoints;thepovertyratefornon-elderlyadultswithsomeworkroseby1.7percentagepoints;andthepovertyrateforthosewithnoworkroseby2.4percentagepoints.

Chapter III: CEO Poverty Rates in Demographic Detail, 2005 - 2011 21
NYC Center for Economic Opportunity nyc.gov/ceo
1. Category excludes people enrolled in school.2. A change in the 2008 ACS questionnaire regarding work experience affects the comparability of estimates for 2008 and after with those for prior years. See text for definition of work experience categories.Source: American Community Survey Public Use Micro Sample as augmented by CEO.Notes: Differences are taken from unrounded numbers; those in bold type are statistically significant. Shares may not sum to 100 percent due to rounding error or exclusion of small sub-groups in the population.
table iii oneCEO Poverty Rates for Persons, by Demographic Characteristic, 2005 - 2011(Numbers are Percent of the Population)
Year Percentage Point Change Group Share of
2011 Pop.2005 2006 2007 2008 2009 2010 2011 2005-2008 2008-2011Total New York City 20.3 19.8 19.8 19.0 19.7 20.9 21.3 -1.3 2.2 100.0Gender
Males 19.0 18.5 18.3 17.9 18.7 19.7 20.2 -1.1 2.3 47.5Females 21.5 21.0 21.2 20.1 20.5 21.9 22.2 -1.4 2.2 52.5Age Group
Under 18 25.0 25.0 25.2 23.1 23.8 25.6 24.7 -1.9 1.6 21.918 through 64 17.8 17.3 17.4 16.9 17.7 19.3 19.9 -0.9 3.0 66.265 and Older 24.1 22.7 22.5 22.7 22.3 21.1 22.4 -1.5 -0.3 12.0Children (under 18), by Presence of Parent
One Parent 36.7 37.7 37.8 35.5 38.7 37.3 34.7 -1.3 -0.7 37.0Two Parents 17.4 17.0 17.6 15.6 15.7 19.0 18.7 -1.8 3.2 63.0Race/Ethnicity
Non-Hispanic White 14.8 14.0 14.2 13.2 13.6 15.4 15.4 -1.6 2.2 33.0Non-Hispanic Black 20.6 21.6 20.5 20.8 21.1 21.5 21.4 0.1 0.7 22.7Non-Hispanic Asian 23.4 24.0 25.5 22.4 24.6 26.1 26.5 -1.1 4.1 12.8Hispanic, Any Race 25.5 23.8 24.3 23.5 24.1 24.6 25.3 -2.0 1.8 28.9Nativity/Citizenship
Citizen by Birth 19.0 18.4 18.6 17.7 18.2 19.9 19.7 -1.3 2.1 62.5Naturalized Citizen 18.6 18.0 18.2 18.2 18.3 17.8 19.1 -0.4 0.9 19.6Not a Citizen 26.6 26.3 25.5 24.7 26.6 27.5 28.9 -1.9 4.2 17.9Working Age Adults (18 through 64), by Educational Attainment1
Less than High School 31.8 29.9 29.8 29.8 30.3 31.2 31.8 -1.9 2.0 18.2High School Degree 20.1 20.7 21.0 19.2 21.1 23.1 24.6 -0.9 5.4 25.6Some College 14.1 13.5 14.5 13.6 14.9 15.6 16.7 -0.5 3.1 20.8Bachelor’s Degree or Higher
7.2 6.9 6.9 7.6 7.6 9.2 9.4 0.3 1.8 35.4
Working Age Adults (18 through 64), by Work Experience in Past 12 Months1,2
Full-Time, Year-Round 6.4 6.5 6.7 6.3 6.7 7.1 7.5 -0.1 1.2 53.1Some Work 19.7 19.9 20.4 22.7 22.1 23.5 24.4 3.0 1.7 22.6No Work 37.5 36.6 36.4 36.3 36.6 38.1 38.7 -1.2 2.4 24.3
NYC Center for Economic Opportunity nyc.gov/ceo
22 The CEO Poverty Measure, 2005 - 2011
3.2 Poverty Rates by Family CharacteristicTableIIITwoprovidespovertyratesforpersonsbasedonthecharacteristicsofthefamilyunitinwhichtheylive.AsdescribedinAppendixA,“Family,”fromtheperspectiveoftheCEOpovertymeasure,isabroaderconceptthanthatusedintheofficialpovertymeasure(personswholivetogetherandarerelatedbyblood,marriage,oradoption).TheCEO“Family”isthe“PovertyUnit,”personslivingtogetherwhosharecostsandresources.Thisincludesrelatedpersons,butextendstounmarriedpartners,theirchildren,andotherpersons webelievetobeeconomicallydependentonothermembersofthehouseholdeveniftheyarenotkin. (SeeAppendixA.)
PanelAinTableIIITwobeginsbycategorizingpeopleaslivinginfamiliesheadedbyahusband-wife/unmarriedpartnerorinasingle-headfamily.Athirdcategoryisunrelatedindividuals.Eachfamily-typecategoryincludeseveryonethatisamemberofthefamily.Ifahusbandandwifehavetwochildrenandtwoin-lawslivingwiththem,forexample,thenallsixfamilymemberswouldbecharacterizedaslivinginahusband-wife/unmarriedpartnerfamily.Singleheadsare“householders”whodonothaveaspouseorunmarriedpartnerbutarelivinginfamilies,forinstance,asinglemotherwithherchildren.30 Withineachofthesefamilytypeswedistinguishbetweenthosethatdoordonotincludechildrenunder18.Becausetheyhavebeenaparticularfocusofpublicpolicy,wealsoprovidethepovertyratesformembersofsingle-motherfamilies(householdsheadedbyasinglefemalewithchildrenunder18)aswellasmembersofallfamilieswithchildrenunder18regardlessofthenumberofparentsinthefamily.
Noteveryoneisinafamilyorpovertyunitwithotherpersons.Unrelatedindividualsarepeoplethatdonothavefamilymembersintheirhousehold.Thiswouldincludepersonsthatlivealone(thetypicalcase)andsomepersonslivingwithothers,suchasroommatesorboarders,whowetreataseconomicallyindependentfromthepeopletheylivewith.Unrelatedindividualsareone-personpovertyunits.
TableIIITwoisorganizedinasimilarfashiontoTableIIIOne,reportingpovertyrates,thechangeinthepovertyrate,andthegroupshareofthepopulation.Thechangesinthepovertyratesfrom2005to2008and2008to2011inTableIIITwoarealsoconsistentwiththeCitywide
30.Thehouseholderistypicallythepersoninwhosenamethedwellingisownedorrented.
pattern.From2005to2008allthestatisticallysignificantchangesaredeclines,withtheexceptionofpersonslivinginfamilieswiththeequivalentoflessthanonefull-time,year-roundworker.Allthestatisticallymeaningfulchangesinthepovertyratefrom2008to2011areincreases.
Husband-Wife/Unmarried Partner: In2011,thepovertyrateforpersonslivinginhusband-wife/unmarriedpartnerfamilieswithoutchildrenunder18wasthelowestofanyfamilytypedescribedinPanelA,13.3percent.The2011povertyrateforhusband-wife/unmarriedpartnerfamilieswithchildrenwashigherat17.8percent.Bothhusband-wife/unmarriedpartnerfamilytypesexperiencedanincreaseinpovertybetween2008and2011,withtheformergrouprisingby1.3percentagepointsandthelatterby3.5percentagepoints.
Single Head: Thepovertyrateforsingle-headedhouseholdswithnochildunder18was19.8percentin2011,wellbelowthe30.9percentrateforsingle-headedhouseholdswithchildrenandthe32.6percentpovertyrateforfamiliesinwhichthesingleparentisfemale.31 Singlemotherfamiliesexperiencedastatisticallysignificantdeclineinpoverty,of2.9percentagepoints,from2005to2008.Single-headhouseholdswithoutchildrenunder18sawtheirpovertyrateriseby3.7percentagepointsfrom2008to2011.Muchofthatincreasewasduetotheriseinthegroup’spovertyratefrom2010to2011.Althoughthe2011povertyrateforpersonslivinginsingle-headedfamilieswithchildrenwasstatisticallyunchangedfrom2008,thisgroupdidexperiencea2.5percentagepointfallinitspovertyratefrom2010to2011.
All Families with Children: The2011povertyrateforpersonslivinginafamilywithchildren(agroupthatincludesnearlyhalftheCity’spopulation)was22.4percent.Thetrendinthisgroup’spovertyratehasbeenU-shaped.From2005to2008,itspovertyratedecreasedby2.1percentagepoints.Butthiswasmirroredbyanincreaseofequalmagnitudefrom2008to2011.
Unrelated Individuals:Individualsinone-person“family”unitsareanotherhighpovertygroup.In2011,welloveronequarterofthisgroupwaspoor(28.5percent).Unrelatedindividualsdidnotexperienceadeclineintheirpovertyratefrom2005to2008.Butfrom2008to2011theirpovertyrateroseby2.8percentagepoints.
31.Some85percentofsingleparentfamiliesaresinglemotherfamilies.

Chapter III: CEO Poverty Rates in Demographic Detail, 2005 - 2011 23
NYC Center for Economic Opportunity nyc.gov/ceo
Work Experience of Family:PanelBinTableIIITwogroupsindividualsbytheworkexperienceofthefamilyinwhichtheyreside.(WorkExperienceofFamilycategoriesaredefinedintheaccompanyingtextbox.)
Povertyratesaresteeplygradedbylevelsofworkactivity,rangingfrom4.9percentforfamilieswiththeequivalentoftwofull-time,year-roundworkers,to52.0percentforpersonsinfamilieswithnoworkin2011.However,evenaconsiderablelevelofworkdoesnotalwayssparepeoplefrompoverty.Considertheone-fourthoftheCity’spopulationthatlivesinafamilywiththeequivalentofonefull-time,year-roundworker;in2011,overone-in-six(17.3percent)ofpersonsinthiscategorywerepoor.
Ofthefiveworkexperiencecategories,twoexperiencedastatisticallysignificantchangefrom2005to2008:lessthanonefull-time,year-round(a4.1percentagepointincrease)andnowork(a2.1percentagepointdecline).Povertyratesrosefrom2008to2011forpersonslivinginfamilieswiththeequivalentoftwofull-time,year-roundworkers(by0.9percentagepoints)andinfamilieswiththeequivalentofonefull-timeandonepart-timeworker(by1.8percentagepoints).
Work Experience of Family
Work Experience of Family categories are constructed by summing the number of hours worked in the prior 12 months by persons 18 and older for each family. Fami-lies with over 3,500 hours of work are labeled as having the equivalent of “Two Full-Time, Year-Round Workers.” Families with 2,341 through 3,499 hours are labeled “One Full-Time, Year-Round and One Part-Time Worker.” Families with at least 1,750 through 2,340 hours are identified as “One Full-Time, Year-Round Worker.” Fami-lies with at least one hour of work, but less than 1,750 hours, are called “Less than One Full-Time, Year-Round Worker.” And finally, there are families that have “No Work.”

NYC Center for Economic Opportunity nyc.gov/ceo
24 The CEO Poverty Measure, 2005 - 2011
tabl
e iii
tw
oCE
O P
over
ty R
ates
for P
erso
ns L
ivin
g in
Var
ious
Fam
ily T
ypes
, 200
5 - 2
011
(Num
bers
are
Per
cent
of t
he P
opul
atio
n)Ye
arPe
rcen
tage
Poi
nt C
hang
eGr
oup
Sh
are
of
2011
Pop
.20
0520
0620
0720
0820
0920
1020
1120
05-2
008
2008
-201
1To
tal N
ew Y
ork
City
20.3
19.8
19.8
19.0
19.7
20.9
21.3
-1.3
2.2
100.
0A
. Fam
ily C
ompo
siti
on
Husb
and
Wife
/Unm
arrie
d Pa
rtne
r1
No
Chi
ldre
n un
der 1
811
.711
.612
.112
.012
.712
.813
.30.
21.
321
.4
With
Chi
ldre
n un
der 1
816
.515
.616
.514
.414
.617
.817
.8-2
.13.
532
.3
Sing
le H
ead
of H
ouse
hold
No
Chi
ldre
n un
der 1
816
.816
.415
.416
.116
.517
.819
.8-0
.73.
711
.2
With
Chi
ldre
n un
der 1
833
.433
.233
.131
.134
.033
.430
.9-2
.3-0
.217
.3
Sin
gle
Mot
her F
amily
35.7
35.0
35.2
32.8
34.8
35.2
32.6
-2.9
-0.2
14.8
All F
amili
es w
ith C
hild
ren
unde
r 18
22.4
21.9
22.4
20.3
21.0
23.0
22.4
-2.1
2.1
49.6
Unre
late
d In
divi
dual
s26
.225
.224
.025
.726
.227
.228
.5-0
.52.
817
.8
B. W
ork
Expe
rien
ce o
f the
Fam
ily2
Two
Full-
Tim
e, Y
ear-
Roun
d W
orke
rs4.
04.
35.
33.
94.
15.
04.
9-0
.10.
931
.6On
e Fu
ll-Ti
me,
Yea
r-Ro
und,
One
Par
t-Ti
me W
orke
r12
.814
.613
.512
.212
.413
.814
.0-0
.61.
815
.8On
e Fu
ll-Ti
me,
Yea
r-Ro
und
Wor
ker
14.8
14.1
16.1
16.1
16.5
16.3
17.3
1.2
1.2
25.2
Less
than
One
Ful
l-Tim
e, Y
ear-
Roun
d W
orke
r40
.542
.140
.544
.641
.345
.043
.34.
1-1
.312
.3No
Wor
k52
.951
.849
.850
.852
.151
.252
.0-2
.11.
215
.0 1.
In th
e CE
O m
easu
re, u
nmar
ried
part
ners
are
trea
ted
as sp
ouse
s. S
ee te
xt fo
r exp
lana
tion.
2. S
ee te
xt fo
r exp
lana
tion
of w
ork
expe
rienc
e ca
tego
ries.
Sour
ce: A
mer
ican
Com
mun
ity S
urve
y Pub
lic U
se M
icro
Sam
ple
as a
ugm
ente
d by
CEO
.No
tes:
Diff
eren
ces a
re ta
ken
from
unr
ound
ed n
umbe
rs; t
hose
in b
old
type
are
stat
istic
ally
sign
ifica
nt. S
hare
s may
not
sum
to 1
00 p
erce
nt d
ue to
roun
ding
err
or. A
chan
ge in
the
2008
ACS
qu
estio
nnai
re re
gard
ing
work
expe
rienc
e af
fect
s the
com
para
bilit
y of e
stim
ates
for 2
008
and
late
r with
thos
e fo
r prio
r yea
rs.
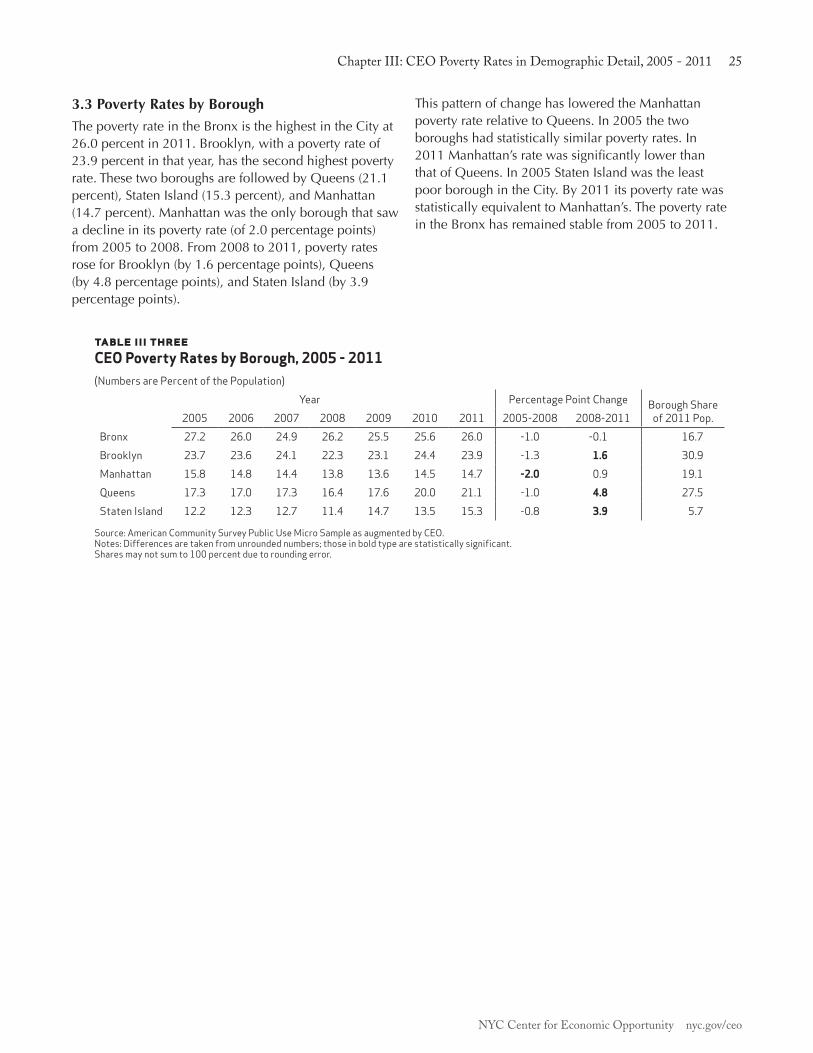
Chapter III: CEO Poverty Rates in Demographic Detail, 2005 - 2011 25
NYC Center for Economic Opportunity nyc.gov/ceo
3.3 Poverty Rates by BoroughThepovertyrateintheBronxisthehighestintheCityat26.0percentin2011.Brooklyn,withapovertyrateof23.9percentinthatyear,hasthesecondhighestpovertyrate.ThesetwoboroughsarefollowedbyQueens(21.1percent),StatenIsland(15.3percent),andManhattan(14.7percent).Manhattanwastheonlyboroughthatsawadeclineinitspovertyrate(of2.0percentagepoints)from2005to2008.From2008to2011,povertyratesroseforBrooklyn(by1.6percentagepoints),Queens(by4.8percentagepoints),andStatenIsland(by3.9percentagepoints).
ThispatternofchangehasloweredtheManhattanpovertyraterelativetoQueens.In2005thetwoboroughshadstatisticallysimilarpovertyrates.In2011Manhattan’sratewassignificantlylowerthanthatofQueens.In2005StatenIslandwastheleastpoorboroughintheCity.By2011itspovertyratewasstatisticallyequivalenttoManhattan’s.Thepovertyrate intheBronxhasremainedstablefrom2005to2011.
table iii three CEO Poverty Rates by Borough, 2005 - 2011(Numbers are Percent of the Population)
Year Percentage Point Change Borough Share of 2011 Pop.2005 2006 2007 2008 2009 2010 2011 2005-2008 2008-2011
Bronx 27.2 26.0 24.9 26.2 25.5 25.6 26.0 -1.0 -0.1 16.7Brooklyn 23.7 23.6 24.1 22.3 23.1 24.4 23.9 -1.3 1.6 30.9Manhattan 15.8 14.8 14.4 13.8 13.6 14.5 14.7 -2.0 0.9 19.1Queens 17.3 17.0 17.3 16.4 17.6 20.0 21.1 -1.0 4.8 27.5Staten Island 12.2 12.3 12.7 11.4 14.7 13.5 15.3 -0.8 3.9 5.7
Source: American Community Survey Public Use Micro Sample as augmented by CEO. Notes: Differences are taken from unrounded numbers; those in bold type are statistically significant. Shares may not sum to 100 percent due to rounding error.

NYC Center for Economic Opportunity nyc.gov/ceo
26 The CEO Poverty Measure, 2005 - 2011

Chapter IV: Alternative Poverty Measures in the U.S. and New York City 27
NYC Center for Economic Opportunity nyc.gov/ceo
ChaPTer iv: alTernaTive PoverTy measures in The u.s. and new york CiTy
AstheIntroductionnoted,CEOmadeanumberofrevisionstoourmethodologyinlightofthedevelopmentoftheFederalSupplementalPovertyMeasure(SPM).Therevisionsmakeuseofrecentresearchtoimproveourmeasure.32AnotherimportantmotiveistomaketheCEOpovertyratesmorecomparabletothoseprovidedbytheCensusBureau’snewapproach.Numbersbecomemoremeaningfulwhentheyaregivencontext;nowwecancompareourportraitofpovertyintheCitytoaU.S.-widepicture.
ThischaptercomparessomeoftheprincipalfindingsintheCensusBureau’smostrecentreportontheSupplementalPovertyMeasurewithourfindingsforNewYorkCity.TheBureau’sreportprovidedcomparisonsbetweenthenewSPMandtheofficialpovertyratesfortheU.S.,muchaswehavedonewiththeCEOmeasureinChaptersIandII.WefindthatthepatternofdifferencesbetweentheofficialandNationalAcademyofSciences(NAS)-stylepovertyratesinthenationandtheCityarequitesimilar.ChangesintheSPMandCEOpovertyratesfrom2010to2011arealsoalike.TheonlynotabledifferencebetweentheCEOandSPMestimatesliesintheabsolutemagnitudeoftheirdifferencesfromtheofficialmeasure.ThisisprimarilyaresultofthegeographicadjustmentoftheCEOpovertythreshold.For2011,theCEOthresholdis$30,945whiletheU.S.-wideSPMthresholdis$24,999.
4.1 Poverty Rates by Age GroupGiventhefocusthatpolicymakinghashadonchildren,differencesinpovertyratesbyagegroupareaparticularlyimportantsetofcomparisons.TableIVOneprovides2011povertyratesbyageusingtheofficialandNAS-stylemeasures.PanelAreportsthesefortheU.S.33
32.SeeAppendicesfordetails.33.TheU.S.-levelpovertyratescitedinthischapteraretakenfromShort,Kathleen.The Research Supplemental Poverty Measure: 2011. U.S.BureauoftheCensus.November2012.Availableat:www.census.gov/hhes/povmeas/methodology/supplemental/research/Short_ResearchSPM2011.pdf
Thetable’sPanelBprovidestheNewYorkCitydata.DifferencesbetweentheofficialandSPMmeasuresforthenationanddifferencesbetweentheofficialandCEOmeasuresfortheCityfollowthesamepattern.Thepovertyratesforthetotalpopulationusingthealternativemeasuresexceedthepovertyratesusingtheofficialmeasure.FortheU.S.,thedifferenceis1.0 percentagepointswhiletheCity’sdifferenceis 2.0percentagepoints.
Anotherimportantdifferencebetweentheofficialandalternativepovertymeasures–commontotheCityandthenation–isthat,despitethehigherpovertyrateoverall,thealternativemeasuresyieldpovertyratesforchildrenthatarebelowtheofficialpovertyrates.TheU.S.SPMpovertyrateforchildrenis18.1percent,4.2percentagepointsbelowtheofficialrateof22.3percent.TheNewYorkCityCEOpovertyrateforchildrenis24.7percent,4.0percentagepointsbelowtheofficialrateof28.7percent.ThelowerpovertyrateforchildrenusingtheNAS-stylepovertymeasuresisaresultoftheirmoreinclusiveaccountofresources.Thealternativemeasurescapturetheeffectoftaxcreditsandin-kindbenefits,manyofwhicharetargetedtowardfamilieswithchildren.34
PovertyisalsomarkedlymoreprevalentamongtheelderlyusingthetwoNAS-stylemeasuresthanitisundertheofficialmeasure.Thisisprimarilyaresultofthealternativemeasures’deductionofmedicalout-of-pocketexpenditures(MOOP)fromtheirmeasureofincome.WithoutthisdeductiontheNAS-basedmeasureswouldyieldpovertyratesthatarequiteclosetothosefromtheofficialmeasure.FortheU.S.SPM,thepovertyrateforpersons65andolderwouldbe8.0percentin2011,closetothe8.7percentderivedfromtheofficialmethodology.FortheCEOmeasure,the2011elderlypovertyratesnetofMOOPis17.1percentwhiletheofficialpovertyrateis17.5percent.35
34.AlthoughtheSPMandCEOpovertyratesforchildrenarelowerthantheofficialrates,boththeSPMandCEOchildpovertyratesexceedthoseofworkingageandelderlyadults.35.SeeShort,Table3A,andAppendixHinthisreportfordetailsaboutourmodelforestimatingMOOPandfortheimpactofMOOPonthepovertyrate.

NYC Center for Economic Opportunity nyc.gov/ceo
28 The CEO Poverty Measure, 2005 - 2011
table iv one Comparison of Poverty Rates by Age Group Using Different Measures, 2011(Numbers are Percent of the Population.)
A. United States
Official SPM
Percentage Point
DifferenceTotal 15.1 16.1 1.0
Under 18 22.3 18.1 -4.2
18 through 64 13.7 15.5 1.8
65 and Older 8.7 15.1 6.4
B. New York City
Official CEO
Percentage Point
DifferenceTotal 19.3 21.3 2.0
Under 18 28.7 24.7 -4.0
18 through 64 16.5 19.9 3.4
65 and Older 17.5 22.4 4.9 Sources: U.S. Bureau of the Census and American Community Survey Public Use Micro Sample as augmented by CEO. Note: Differences are measured in percentage points and are taken from unrounded numbers; those in bold type are statistically significant.
4.2 Extreme PovertyInChapterTwowenotedthattheproportionofthepopulationlivinginextremepoverty(below50percentofthepovertyline)issmallerundertheCEOpovertymeasurethanitiswiththeofficialmeasure.TableIVTworeportsextremepovertyratesfortheU.S.andNewYorkCitybyage.Forthenation,asfortheCity,asmallerfractionofthepopulationisinextremepovertyusingthealternativepovertymeasure.FortheU.S.asawholethedifferenceis1.5percentagepoints,notunlikethe2.3percentagepointdifferenceinNewYorkCity.Thepatternofdifferencesacrosstheagegroupsisalsoquitesimilar.ForthenationandtheCity,thelargestdifferencebetweentheofficialandalternativemeasuresofextremepovertyisforchildren,5.2percentagepointsand7.6percentagepoints,respectively.Differencesbetweenthemeasuresforworkingageadultsaremoremodest:0.8percentagepointsfortheU.S.and1.1percentagepointsforNewYorkCity.
Thispatternoflowerratesofextremepovertywiththealternativemeasures,however,isreversedfortheelderly.Thealternativemeasuresfindahigherincidenceofextremepovertyforpersons65andolderthandotheofficialmeasures.FortheU.S.,theSPMextremepovertyrateis2.0percentagepointsabovetheofficialrate.FortheCity,theCEOextremepovertyratefortheelderlyis0.9percentagepointsabovetheofficialrate.
table iv two Comparison of Extreme Poverty Rates by Age Group Using Different Measures, 2011(Numbers are Percent of the Population.)
A. United States
Official SPM
Percentage Point
DifferenceTotal 6.7 5.2 -1.5
Under 18 10.3 5.1 -5.2
18 through 64 6.3 5.5 -0.8
65 and Older 2.3 4.3 2.0
B. New York City
Official CEO
Percentage Point
DifferenceTotal 7.9 5.6 -2.3
Under 18 12.8 5.2 -7.6
18 through 64 7.1 5.9 -1.1
65 and Older 3.5 4.4 0.9 Sources: U.S. Bureau of the Census and American Community Survey Public Use Micro Sample as augmented by CEO. Note: Differences are measured in percentage points and are taken from unrounded numbers; those in bold type are statistically significant.
4.3 Changes in the SPM and CEO Poverty Rates, 2009-2011TheCensusBureau’sreportprovidespovertyratesfor2009-2011.TableIVThreereproducestheBureau’sestimatesfortheseyearsalongwithcomparabledataforNewYorkCity.From2009to2011,theSPMroseby0.9percentagepoints,whiletheCEOpovertyrateclimbedby1.6percentagepoints.Povertyratesderivedfromthesemeasuresincreasedby0.9percentagepointsforchildrenintheU.S.andby0.8percentagepointsforchildreninNewYorkCity(thoughthelatternumberwasnotstatisticallysignificant).Forworkingageadultsthepovertyratesincreased(1.0percentagepointsintheU.S.and2.2percentagepointsinNewYorkCity).ChangesinthepovertyratesfortheelderlywerenotstatisticallysignificantineitherthenationortheCity.
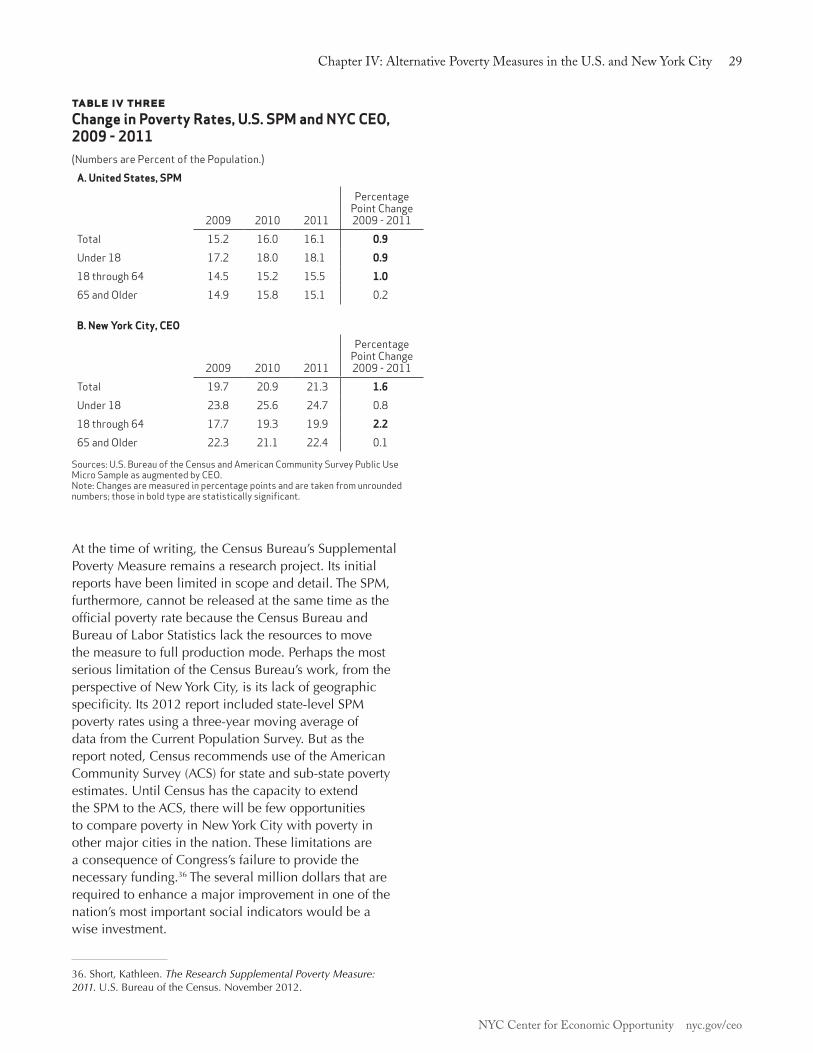
Chapter IV: Alternative Poverty Measures in the U.S. and New York City 29
NYC Center for Economic Opportunity nyc.gov/ceo
Atthetimeofwriting,theCensusBureau’sSupplementalPovertyMeasureremainsaresearchproject.Itsinitialreportshavebeenlimitedinscopeanddetail.TheSPM,furthermore,cannotbereleasedatthesametimeastheofficialpovertyratebecausetheCensusBureauandBureauofLaborStatisticslacktheresourcestomovethemeasuretofullproductionmode.PerhapsthemostseriouslimitationoftheCensusBureau’swork,fromtheperspectiveofNewYorkCity,isitslackofgeographicspecificity.Its2012reportincludedstate-levelSPMpovertyratesusingathree-yearmovingaverageofdatafromtheCurrentPopulationSurvey.Butasthereportnoted,CensusrecommendsuseoftheAmericanCommunitySurvey(ACS)forstateandsub-statepovertyestimates.UntilCensushasthecapacitytoextendtheSPMtotheACS,therewillbefewopportunitiestocomparepovertyinNewYorkCitywithpovertyinothermajorcitiesinthenation.TheselimitationsareaconsequenceofCongress’sfailuretoprovidethenecessaryfunding.36Theseveralmilliondollarsthatarerequiredtoenhanceamajorimprovementinoneofthenation’smostimportantsocialindicatorswouldbeawiseinvestment.
36.Short,Kathleen.The Research Supplemental Poverty Measure: 2011.U.S.BureauoftheCensus.November2012.
table iv three Change in Poverty Rates, U.S. SPM and NYC CEO, 2009 - 2011(Numbers are Percent of the Population.)
A. United States, SPM
2009 2010 2011
Percentage Point Change 2009 - 2011
Total 15.2 16.0 16.1 0.9
Under 18 17.2 18.0 18.1 0.9
18 through 64 14.5 15.2 15.5 1.0
65 and Older 14.9 15.8 15.1 0.2 B. New York City, CEO
2009 2010 2011
Percentage Point Change 2009 - 2011
Total 19.7 20.9 21.3 1.6
Under 18 23.8 25.6 24.7 0.818 through 64 17.7 19.3 19.9 2.2
65 and Older 22.3 21.1 22.4 0.1 Sources: U.S. Bureau of the Census and American Community Survey Public Use Micro Sample as augmented by CEO. Note: Changes are measured in percentage points and are taken from unrounded numbers; those in bold type are statistically significant.
NYC Center for Economic Opportunity nyc.gov/ceo
30 The CEO Poverty Measure, 2005 - 2011

Chapter V: Policy Affects Poverty 31
NYC Center for Economic Opportunity nyc.gov/ceo
ChaPTer v: PoliCy affeCTs PoverTy
ChapterIInotedtheincreasedeffectofincometaxcreditsandtheFoodStampprogramontheCEOpovertyratesince2008.Thelargereffectswerenotonlyareflectionofanincreaseinprogramparticipationduetotheeconomicdownturn;theyalsoresultedfromdeliberatepolicychoices.Inresponsetothenationwiderecessioninlate2007,Federalpolicymakerstookavarietyofinitiativestostimulatetheeconomy.Theseincludedprogramsthatpromotedconsumerspendingbydirectlybolsteringfamilyincomes.Oftentheinitiativestargetedfamiliesthatalreadywere,orwereindangerofbecoming,poor.TheexpansionofUnemploymentInsurancebenefits,newandincreasedtaxcreditprograms,andanincreaseinFoodStampbenefitlevelsfallintothiscategory.WiththeexceptionofUnemploymentInsurance,noneoftheseincome-supportingprogramsarereflectedintheofficialpovertymeasure.Theirabsenceexplainswhytherewasasharpdeclineinpre-taxcashincomefrom2008to2010(theresourcemeasureusedintheofficialpovertyrate)whileincomeinCEO’smoreinclusivedefinition(whichaccountsforalltheseprograms)didnotfall.Thedifferenttrajectoriesofthesetwomeasuresofincomearealsoevidentinthemostrecentdata;from2010to2011,pre-taxcashincomewasstatisticallyunchanged,whileCEOincomeroseby2.5percent.37
ThepurposeofthischapteristomeasuretheextenttowhichtheexpansionofthetaxcreditandFoodStampprogramsoffsetwhatwouldhaveotherwisebeenamuchsharperdropinincomeandanevenmoredramaticincreaseinthepovertyrate.WedothisbycreatingestimatesofwhatFoodStampbenefitsandtaxprogramswouldhavecontributedtofamilyincomeintheabsenceofthenewpolicies.Thesehypothetical(whatwouldhavehappened)estimatescanbecomparedagainstwhatactuallydidhappen,allowingustoisolatethepolicyeffects.
ThefirstsectionofthechapterbeginswithanoverviewofthetaxpolicychangesintheBushandObamastimulusprograms.Itthenisolatestheeffectofthenewtaxcreditprograms.AsecondsectionmeasurestheeffectoftheincreasedFoodStampbenefitlevelsandtheCity’soutreacheffort.Next,wecompareestimatesofCEOincomeabsenttheinfluenceofthenewpoliciesagainstactualCEOincome.Wefindthatatthe20thpercentile,CEOincomewouldhavefallenby2.1percentfrom
37.SeeTableIITwo.
2008to2010withoutthenewpolicies.Overthesameperiod,actualCEOincomeheldsteadyfrom2008to2010andthenrosefrom2010to2011by2.5percent.ThedifferenceintheseincometrendscreatesamuchsteeperriseforahypotheticalCEOpovertyratecomparedagainsttheactualone;haditnotbeenforthepolicyinitiatives,theNewYorkCitypovertyratewouldhavereached23.6percentin2011ratherthan21.3percent.
5.1 Measuring the Effects of New and Expanded Tax CreditsInFebruary2008,PresidentBushsignedtheEmergencyEconomicStimulusAct.Theactincludedorextendedthreeincometaxinitiativesrelevanttoourpovertymeasure:
•TheEconomicRecoveryTaxRebate(RecoveryRebate),whichprovidedupto$1,200tomarriedcouplefilersand$600toindividualfilers.TheRecoveryRebatewasgiventoeveryonethatcompleteda2007taxreturn.38
•Anadditionalstandarddeductionforrealestatetaxesthatallowedfilerstoincreasetheirstandarddeductionbytheamounttheypayinstateandlocalpropertytaxes,byupto$1,000formarriedcouplefilersand$500forsinglefilers.
•AlowerminimumincomeeligibilitythresholdfortheAdditionalChildTaxCredit.
Ayearlater,PresidentObamasignedtheAmericanRecoveryandReinvestmentAct(ARRA).TheARRAincluded:
•AcontinuationofthestandarddeductionforrealestatetaxesandafurtherexpansionoftheAdditionalChildTaxCredit.
•TheestablishmentofaMakingWorkPay(MWP)taxcreditthatprovidesarefundable$800creditperworker,designedtooffsetpayrolltaxesin2009and2010.
•AnEconomicRecoveryPayment(ERP):aone-time$250paymentin2009torecipientsofSocialSecurity,SupplementalSecurityIncome,RailroadRetirementbenefits,andveteran’sdisabilitycompensation.
•AnexpansionoftheEarnedIncomeTaxCredit(EITC)toincludeathirdtierofbenefitsforfamilieswiththreeormorechildren.Inaddition,themaximumincomeformarriedcouplestoremaineligibleforthecreditincreased.
38.TheCEOtaxmodelassumesthatallrebateswerereceivedin2008.

NYC Center for Economic Opportunity nyc.gov/ceo
32 The CEO Poverty Measure, 2005 - 2011
•Achangeincollegetuitiontaxcreditstomakethempartlyrefundable.
TheARRAwasfollowedbytheTaxReliefActof2010andJobCreationActof2010.ThislegislationextendedtheChildCare,ChildTax,RefundableChildTax,andEITCexpansionsthrough2012.TheMWPcreditwasallowedtoexpireattheendof2010.InitsplaceallwageandsalaryearnersreceivedaPayrollTaxCut(PTC),atwopercentagepointreductionintheirFICApayrolltaxrate.The2010incometaxextensionswereeithermadepermanentorcontinuedto2017undertheAmericanTaxpayerReliefAct(ATRA)of2012.ThePTC,however,expiredattheendof2012.
Toillustratetheconnectionbetweentaxpolicyandthepovertyratewefocusonlow-incometaxfilers–thosewithFederaladjustedgrossincome(AGI)nohigherthan$50,000–thathavedependents.TableVOneshowsmeantaxprogramamountsfortheroughly790,000filersinthisgroup.39PanelA,labeled“Actual,”containsCEOestimatesfortheyears2007-2011andthepercentagechangeoverthattimeperiod.PanelB,labeled“Hypothetical,”showswhatthemeanvalueswouldhavebeenabsentthechangesintaxpolicyfrom2008through2011,andthepercentagechangefromactual2007tohypothetical2011.Bothpanelsshowspecifictaxprogramsaswellasasummaryoftaxliabilitiesandcredits.
Theaverage,perfiler,additiontoincomeaftercreditsareappliedagainstliabilitiesisfoundontheline,“NetIncomeTaxEffect.”Thetotalvalueofgainsfromnettaxesacrossallfilersisshowninthenextline,“SumofNetIncomeTaxEffect.”Thelasttwolinesofeachpanel,“FICAMean”and“FICATotal,”illustratetheeffectofthePTCimplementedin2011.PanelAshowsthemeanandtotalFICApaymentsafterthetaxcut,whilePanelBshowswhatFICApaymentswouldhavebeenintheabsenceofapayrolltaxcut.
ThepanelsbeginwithFederal,State,andCityEarnedIncomeTaxCredits(EITC).Thevaluesinthepanelsdivergein2009aschangesinEITCpolicyoccur.OverthefiveyearsdisplayedinPanelA,theFederalEITCgrew
39.ThisisthenumberoffilersestimatedbyCEOfor2011.Meansarethetotalvalueofthetaxitemforthisgroupoffilersdividedbynumberoffilersinthisgroup.
by31.2percent.BecausetheyarepercentagesoftheFederalCredit,theStateandCityEITCgrewatanearlyidenticalpace.Theremainingrowsinthepanelhighlightothertaxinitiativesinthistimeperiod.TheMakingWorkPaycredit,forexample,generatedanaveragetaxcreditof$464in2010.
The“SummaryofTaxEffect”portionofPanelAmakestwokeypoints.First,taxliabilitiesdeclinedasincomesshrankintheeconomicdownturn.Second,thetotalofFederal,State,andCitytaxcreditsincreasedasstimulusprogramsrespondedtothedeclineinincome.Totalcreditsexpandedby28.6percentfrom2007to2011,andtheNetIncomeTaxEffectincreasedby60.3percent.TheonlydeclineincreditsoccurredattheCitylevelasaresultofadecreaseintheSchoolTaxCredit(STAR)in2009.PanelBshowswhatwouldhavehappenedabsentthetaxpolicychangesthatbeganin2008.AsmallerEITCcombinedwithalackofotherstimuluscreditsgeneratesagrowthofonly20.5percentintheNetIncomeTaxEffect.
AfinaldifferencebetweentheactualandthehypotheticalscenarioistheamountofFICAtaxesowed.TheannualFICAtaxpaymentis,onaverage,$418lessfortaxpayersaftertheFICAcutswereimplementedin2011($1,318foractualcomparedto$1,736forhypothetical).ThesumofFICApaymentsinPanelA(roughly$1billion)is$323millionlessthanthesuminPanelB(over$1.3billion).40
Taxcreditsunderthestimulusprogramdidnotsimplybecomemoregenerous.Thenewpoliciesalsoraisedincomeeligibilityceilingsinseveralcases,increasingthepooloffilerswhocouldclaimthecredit.Unemployedfilersarenoteligibleforthewage-basedEITC,butraisingtheincomelimittoclaimthecreditmakestheEITCavailabletoagreaternumberofwageearners.WeseethiseffectintheAddendumtoTableVOne.ThelossoffilerswhocouldnolongerqualifyfortheEITCbecausetheywerejoblesswasmorethanoffsetbytheincreaseinnewlyeligibleEITCclaimantsnearthetopofthe$50,000AGIrange.
40.FICApaymentsinTableVOneareshownwithanegativesignto indicatetheyareasubtractionfromthenetincometaxeffect.

Chapter V: Policy Affects Poverty 33
NYC Center for Economic Opportunity nyc.gov/ceo
table v one Actual and Hypothetical Tax Program Effects, 2007 - 2011 Filers with Dependents and Federal AGI up to $50,000(Numbers are Means for All Filers in this Group, Except Where Specified)*
A. Actual Percentage Change
2007-2011Selected Credits 2007 2008 2009 2010 2011Federal EITC $1,709 $1,803 $2,077 $2,160 $2,242 31.2%State EITC $488 $517 $598 $623 $648 32.8%City EITC $85 $90 $104 $108 $112 31.8%Recovery Rebate N.A. $907 N.A. N.A. N.A. N.A.Making Work Pay N.A. N.A. $459 $464 N.A. N.A.Summary of Tax Effect
Total Pre-Credit Liability $1,679 $1,664 $1,692 $1,577 $1,543 -8.1% Federal Credits $2,540 $3,632 $3,819 $3,868 $3,507 38.1% State Credits $797 $826 $898 $915 $949 19.1% City Credits $287 $289 $198 $200 $206 -28.2%Total Credits $3,624 $4,747 $4,915 $4,983 $4,662 28.6%Net Income Tax Effect $1,945 $3,083 $3,223 $3,406 $3,118 60.3%Sum of Net Income Tax Effect (in $1,000s)
$1,530,173 $2,408,249 $2,502,095 $2,593,790 $2,423,820 58.4%
FICA Mean N.A. N.A. N.A. N.A. -$1,318Sum of FICA (in $1,000s) N.A. N.A. N.A. N.A. -$1,024,462
B. Hypothetical Percentage Change
2007-2011Selected Credits 2007 2008 2009 2010 2011Federal EITC N.A. $1,803 $1,929 $2,024 $2,090 22.3%State EITC N.A. $517 $554 $582 $603 23.6%City EITC N.A. $90 $97 $101 $105 23.5%Recovery Rebate N.A. $0 N.A. N.A. N.A. N.A.Making Work Pay N.A. N.A. $0 $0 N.A. N.A.Summary of Tax Effect
Total Pre-Credit Liability N.A. $1,670 $1,684 $1,554 $1,530 -8.9% Federal Credits N.A. $2,629 $2,640 $2,669 $2,746 8.1% State Credits N.A. $832 $877 $898 $929 16.6% City Credits N.A. $289 $190 $193 $198 -31.0%Total Credits N.A. $3,750 $3,707 $3,760 $3,873 6.9%Net Income Tax Effect N.A. $2,080 $2,023 $2,205 $2,343 20.5%Sum of Net Income Tax Effect (in $1,000s)
N.A. $1,625,107 $1,587,635 $1,709,155 $1,842,361 20.4%
FICA Mean N.A. N.A. N.A. N.A. -$1,736Sum of FICA (in $1,000s) N.A. N.A. N.A. N.A. -$1,365,074
Addendum Percent of Filers Receiving Earned Income Tax Credit** Percentage
Point Change 2007-20112007 2008 2009 2010 2011
A. Actual 72.9% 74.8% 77.6% 80.7% 81.1% 8.2B. Hypothetical N.A. 74.8% 75.5% 78.9% 79.4% 6.5
*Means are aggregated values of each tax item divided by number of filers with income up to $50,000 and dependents. **CEO’s model assumes all Federal EITC claimers get State and City EITC. Source: American Community Survey Public Use Micro Sample as augmented by CEO. Notes: N.A. - Not applicable in that tax year. Percentage change in hypothetical value is the change from Actual 2007 to Hypothetical 2011.

NYC Center for Economic Opportunity nyc.gov/ceo
34 The CEO Poverty Measure, 2005 - 2011
5.2 Measuring the Effect of Changes in Food Stamp PolicyFederalandlocalFoodStamppolicychangedintwoimportantwayssince2007:1)a13.6percentincreaseinFoodStampbenefitsincludedinthe2009ARRA;and2)anoutreachinitiativeinNewYorkCityaimedatincreasingprogramparticipationamongeligiblehouseholds.InordertoidentifytheimpactofthesechangesonCEOincomeandtheCEOpovertyrate,weseparatethemfromtheincreaseinFoodStampbenefitlevelsthatwouldhaveoccurredwithouttheARRAandfromthegrowthinFoodStampparticipationthatwouldhaveoccurredsimplybecauseofthedeterioratingconditionoftheCitylabormarket.
WedothisbycreatingahypotheticaldataseriestogoalongwiththeactualACSdata.41Inthehypotheticalestimates,wefirstassumethatFoodStampbenefitlevelswouldhavegrownasprescribedbypre-ARRAFederal
41.SeeAppendixEforadetaileddescriptionofthemethodsusedtoconstructthehypotheticaldata.
law.ThemeanFoodStampbenefit(perFoodStampcase)isshowninTableVTwo.WefindthatactualFoodStampbenefitlevelsgrewby43.6percentfrom2007to2011.WithouttheARRA,benefitspercasewouldhavebeenonly25.0percenthigher.42
WealsoconstructedhypotheticalestimatesforthegrowthrateoftheFoodStampcaseload,basedonthehistoricalrelationshipbetweenprogramparticipationandlabormarketconditions.Thisdataapproximatesthegrowthofcaseloadsabsenttheoutreacheffortandincreaseinbenefitlevels.43TheactualFoodStampcaseloadgrewby50.5percentfrom2007to2011.Absentthepolicyinitiatives,thenumberofcaseswouldhavegrownby42.6percent.Overall,thesepoliciesincreasedtheaggregatelevelofFoodStampbenefitsbyover$600millionin2011,comparedwiththehypotheticalestimate.
42.ReadersshouldbearinmindthatthechangeinbenefitlevelsreflectsdifferencesinthecompositionoftheFoodStampcaseloadaswellaschangesinthelaw.43.Amoregenerousbenefitlevelwould,allelseequal,increasetheFoodStampparticipationrate.
table v twoActual and Hypothetical Food Stamp Estimates, 2007 - 2011
A. Actual Percentage Change
2007-20112007 2008 2009 2010 2011Food Stamp Cases 695,494 771,225 873,127 1,025,575 1,046,968 50.5%Mean Benefit per Case $1,978 $1,966 $2,391 $2,774 $2,840 43.6%Aggregate Benefits* $1,290,000 $1,440,000 $2,005,275 $2,713,824 $2,860,000 121.7%
B. Hypothetical Percentage Change
2007-20112007 2008 2009 2010 2011Food Stamp Cases N.A. 751,974 836,576 968,153 991,639 42.6%Mean Benefit per Case N.A. $1,968 $2,009 $2,406 $2,472 25.0%Aggregate Benefits* N.A. $1,386,830 $1,619,758 $2,115,810 $2,259,314 75.1%
* In thousands.Source: American Community Survey Public Use Micro Sample as augmented by CEO.Notes: Percentage change in Panel B is the change from actual 2007 to hypothetical 2011.N.A. - Not applicable because hypothetical not calculated in that year.
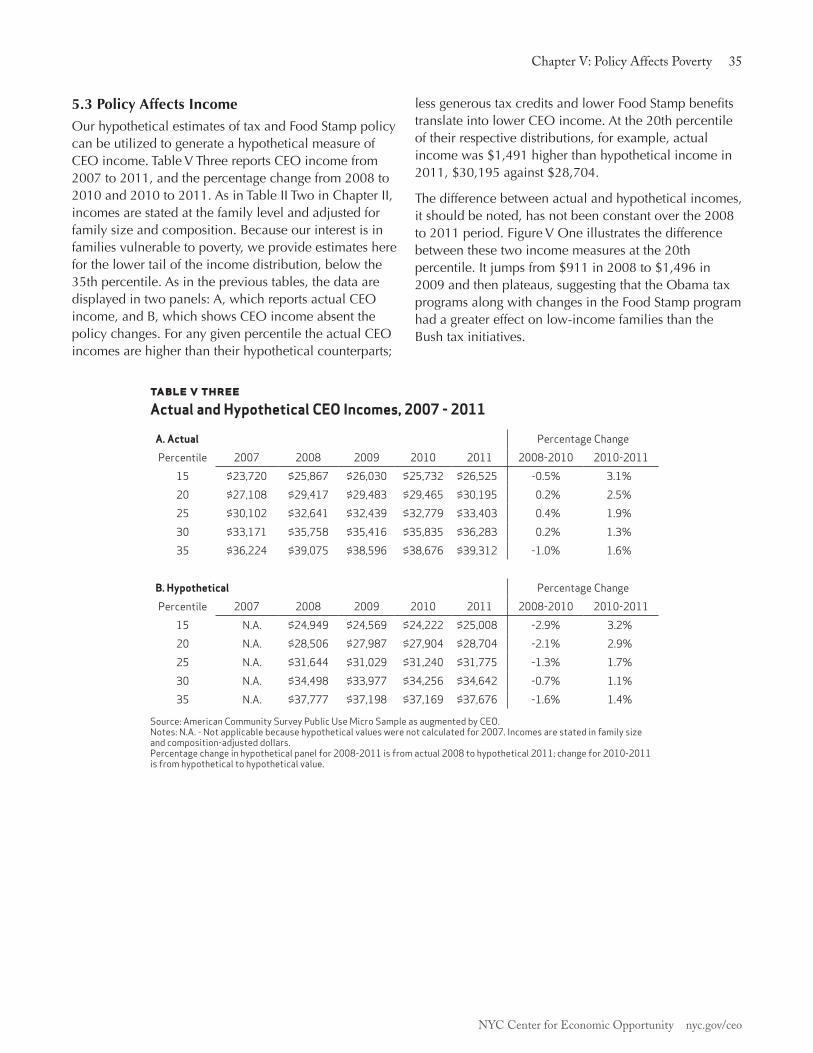
Chapter V: Policy Affects Poverty 35
NYC Center for Economic Opportunity nyc.gov/ceo
5.3 Policy Affects IncomeOurhypotheticalestimatesoftaxandFoodStamppolicycanbeutilizedtogenerateahypotheticalmeasureofCEOincome.TableVThreereportsCEOincomefrom2007to2011,andthepercentagechangefrom2008to2010and2010to2011.AsinTableIITwoinChapterII,incomesarestatedatthefamilylevelandadjustedforfamilysizeandcomposition.Becauseourinterestisinfamiliesvulnerabletopoverty,weprovideestimateshereforthelowertailoftheincomedistribution,belowthe35thpercentile.Asintheprevioustables,thedataaredisplayedintwopanels:A,whichreportsactualCEOincome,andB,whichshowsCEOincomeabsentthepolicychanges.ForanygivenpercentiletheactualCEOincomesarehigherthantheirhypotheticalcounterparts;
lessgeneroustaxcreditsandlowerFoodStampbenefitstranslateintolowerCEOincome.Atthe20thpercentileoftheirrespectivedistributions,forexample,actualincomewas$1,491higherthanhypotheticalincomein2011,$30,195against$28,704.
Thedifferencebetweenactualandhypotheticalincomes,itshouldbenoted,hasnotbeenconstantoverthe2008to2011period.FigureVOneillustratesthedifferencebetweenthesetwoincomemeasuresatthe20thpercentile.Itjumpsfrom$911in2008to$1,496in2009andthenplateaus,suggestingthattheObamataxprogramsalongwithchangesintheFoodStampprogramhadagreatereffectonlow-incomefamiliesthantheBushtaxinitiatives.
table v three Actual and Hypothetical CEO Incomes, 2007 - 2011
A. Actual Percentage ChangePercentile 2007 2008 2009 2010 2011 2008-2010 2010-2011
15 $23,720 $25,867 $26,030 $25,732 $26,525 -0.5% 3.1%20 $27,108 $29,417 $29,483 $29,465 $30,195 0.2% 2.5%25 $30,102 $32,641 $32,439 $32,779 $33,403 0.4% 1.9%30 $33,171 $35,758 $35,416 $35,835 $36,283 0.2% 1.3%35 $36,224 $39,075 $38,596 $38,676 $39,312 -1.0% 1.6%
B. Hypothetical Percentage ChangePercentile 2007 2008 2009 2010 2011 2008-2010 2010-2011
15 N.A. $24,949 $24,569 $24,222 $25,008 -2.9% 3.2%20 N.A. $28,506 $27,987 $27,904 $28,704 -2.1% 2.9%25 N.A. $31,644 $31,029 $31,240 $31,775 -1.3% 1.7%30 N.A. $34,498 $33,977 $34,256 $34,642 -0.7% 1.1%35 N.A. $37,777 $37,198 $37,169 $37,676 -1.6% 1.4%
Source: American Community Survey Public Use Micro Sample as augmented by CEO. Notes: N.A. - Not applicable because hypothetical values were not calculated for 2007. Incomes are stated in family size and composition-adjusted dollars.Percentage change in hypothetical panel for 2008-2011 is from actual 2008 to hypothetical 2011; change for 2010-2011 is from hypothetical to hypothetical value.

NYC Center for Economic Opportunity nyc.gov/ceo
36 The CEO Poverty Measure, 2005 - 2011
figure v oneDifference Between Actual and Hypothetical CEO Income, 2008 - 2011
Source: American Community Survey Public Use Micro Sample as augmented by CEO. Note: Incomes are measured in family size and composition-adjusted dollars at the 20th percentile of their respective distributions.
From2008to2010,theperiodinwhichemploymentratesandearningswerefalling,actualCEOincomeatthe20thpercentilewasunchanged.Hypotheticalincomefell;haditnotbeenforthechangesintaxandtheFoodStampprogram,CEOincomewouldhavedeclinedatthe20thpercentile,by2.1percent.From2010to2011,theincreasesinthetwoincomemeasuresarenearlyidentical,by2.5percentforactualincomeand2.9percentforhypotheticalincome.
FigureVTwotracesthepathofactualandhypotheticalCEOincomesoverthe2007to2011period.Eachincomeismeasuredrelativetoactualincomein2007,theyearpriortothefirstroundofFederalstimulusprograms.From2007to2008thetwoincomemeasuresrise;therecessionhadyettocometotheCityandearningsweregrowing.TheincreaseforhypotheticalincomeissmallerthantheactualincreaseinCEOincomebecauseitdoesnotincludetheeffectoftheBushstimulusprograms.From2008to2010actualincomeheldsteady.Bycontrast,hypotheticalincomeregistersdeclines.BothCEOincomemeasuresincreasedfrom2010to2011.
figure v twoComparison of Income Measures, 2007 - 2011
Source: American Community Survey Public Use Micro Sample as augmented by CEO.
20082007 2009 2010 2011
HypotheticalActual
2007
= 10
0%
103.2
108.5
105.2
108.8 108.7
102.9
111.4
105.9
96%
98%
100%
102%
104%
106%
108%
110%
112%
100.0
$1,499$1,562
$1,496
$911
$0
$200
$400
$600
$800
$1,000
$1,200
$1,400
$1,600
$1,800
2008 2009 2010 2011
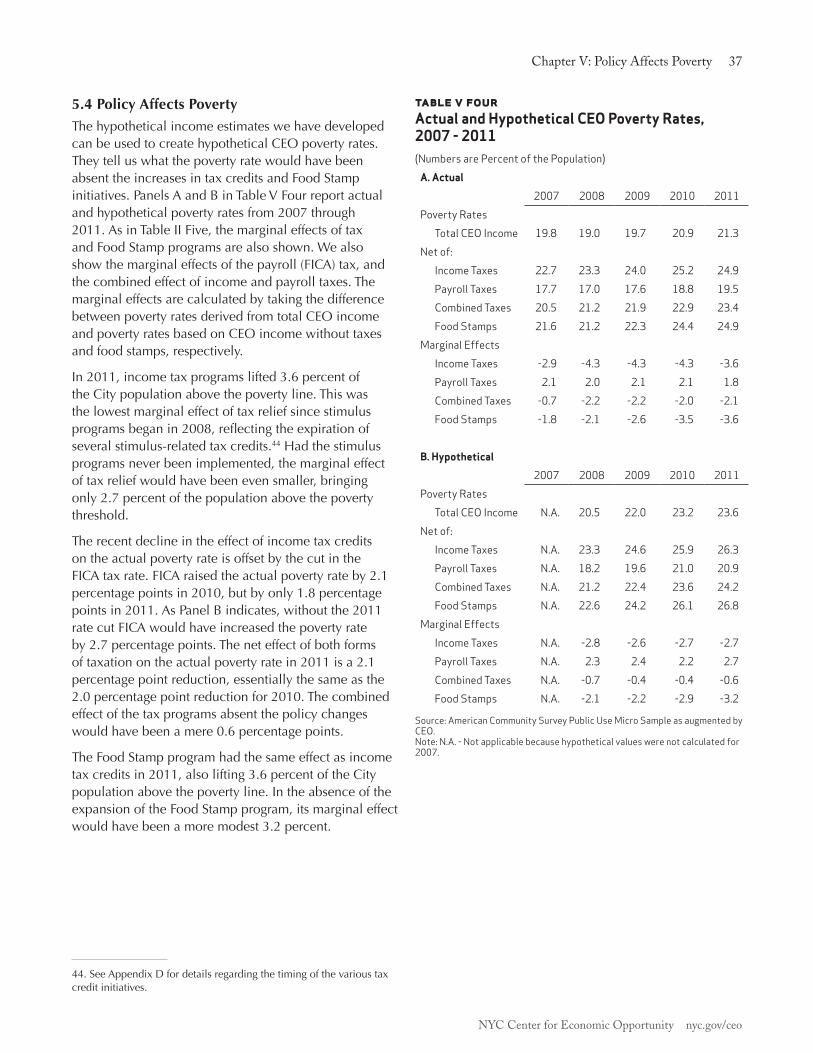
Chapter V: Policy Affects Poverty 37
NYC Center for Economic Opportunity nyc.gov/ceo
5.4 Policy Affects PovertyThehypotheticalincomeestimateswehavedevelopedcanbeusedtocreatehypotheticalCEOpovertyrates.TheytelluswhatthepovertyratewouldhavebeenabsenttheincreasesintaxcreditsandFoodStampinitiatives.PanelsAandBinTableVFourreportactualandhypotheticalpovertyratesfrom2007through2011.AsinTableIIFive,themarginaleffectsoftaxandFoodStampprogramsarealsoshown.Wealsoshowthemarginaleffectsofthepayroll(FICA)tax,andthecombinedeffectofincomeandpayrolltaxes.ThemarginaleffectsarecalculatedbytakingthedifferencebetweenpovertyratesderivedfromtotalCEOincomeandpovertyratesbasedonCEOincomewithouttaxesandfoodstamps,respectively.
In2011,incometaxprogramslifted3.6percentoftheCitypopulationabovethepovertyline.Thiswasthelowestmarginaleffectoftaxreliefsincestimulusprogramsbeganin2008,reflectingtheexpirationofseveralstimulus-relatedtaxcredits.44Hadthestimulusprogramsneverbeenimplemented,themarginaleffectoftaxreliefwouldhavebeenevensmaller,bringingonly2.7percentofthepopulationabovethepovertythreshold.
TherecentdeclineintheeffectofincometaxcreditsontheactualpovertyrateisoffsetbythecutintheFICAtaxrate.FICAraisedtheactualpovertyrateby2.1percentagepointsin2010,butbyonly1.8percentagepointsin2011.AsPanelBindicates,withoutthe2011ratecutFICAwouldhaveincreasedthepovertyrateby2.7percentagepoints.Theneteffectofbothformsoftaxationontheactualpovertyratein2011isa2.1percentagepointreduction,essentiallythesameasthe2.0percentagepointreductionfor2010.Thecombinedeffectofthetaxprogramsabsentthepolicychangeswouldhavebeenamere0.6percentagepoints.
TheFoodStampprogramhadthesameeffectasincometaxcreditsin2011,alsolifting3.6percentoftheCitypopulationabovethepovertyline.IntheabsenceoftheexpansionoftheFoodStampprogram,itsmarginaleffectwouldhavebeenamoremodest3.2percent.
44.SeeAppendixDfordetailsregardingthetimingofthevarioustaxcreditinitiatives.
table v four Actual and Hypothetical CEO Poverty Rates, 2007 - 2011(Numbers are Percent of the Population)
A. Actual
2007 2008 2009 2010 2011Poverty Rates Total CEO Income 19.8 19.0 19.7 20.9 21.3Net of: Income Taxes 22.7 23.3 24.0 25.2 24.9 Payroll Taxes 17.7 17.0 17.6 18.8 19.5 Combined Taxes 20.5 21.2 21.9 22.9 23.4 Food Stamps 21.6 21.2 22.3 24.4 24.9Marginal Effects Income Taxes -2.9 -4.3 -4.3 -4.3 -3.6 Payroll Taxes 2.1 2.0 2.1 2.1 1.8 Combined Taxes -0.7 -2.2 -2.2 -2.0 -2.1 Food Stamps -1.8 -2.1 -2.6 -3.5 -3.6
B. Hypothetical
2007 2008 2009 2010 2011Poverty Rates Total CEO Income N.A. 20.5 22.0 23.2 23.6Net of: Income Taxes N.A. 23.3 24.6 25.9 26.3 Payroll Taxes N.A. 18.2 19.6 21.0 20.9 Combined Taxes N.A. 21.2 22.4 23.6 24.2 Food Stamps N.A. 22.6 24.2 26.1 26.8Marginal Effects Income Taxes N.A. -2.8 -2.6 -2.7 -2.7 Payroll Taxes N.A. 2.3 2.4 2.2 2.7 Combined Taxes N.A. -0.7 -0.4 -0.4 -0.6 Food Stamps N.A. -2.1 -2.2 -2.9 -3.2
Source: American Community Survey Public Use Micro Sample as augmented by CEO. Note: N.A. - Not applicable because hypothetical values were not calculated for 2007.

NYC Center for Economic Opportunity nyc.gov/ceo
38 The CEO Poverty Measure, 2005 - 2011
FigureVThreesummarizesouranalysisoftheeffectsofpolicyonpoverty.BothactualCEOandhypotheticalCEOpovertyratesareplottedfortheyears2007-2011.TheactualCEOpovertyratefellfrom2007to2008,whilethehypotheticalraterose.ThiswasprimarilyduetoBushAdministrationtaxinitiatives.From2008to2011,bothrateshaveanupwardtrend.ButtheactualCEOpovertyrateincreaseslessthanonepercentagepointfrom2008to2009,aneffectofthemanystimuluscreditsenactedintheObamaRecoveryAct;bycontrast,thehypotheticalrateincreases1.5percentagepoints.From2009to2011,bothpovertymeasuresincreaseatthesameratebuttheactualCEOpovertyrate,at 21.3percent,isafull2.3percentagepointslower thanthehypotheticalrateof23.6percentattheend ofthisperiod.
figure v three Actual and Hypothetical CEO Poverty Rates, 2007 - 2011
Source: American Community Survey Public Use Micro Sample as augmented by CEO.
20082007 2009 2010 2011
HypotheticalActual
Perc
ent o
f the
Pop
ulat
ion
19.7
20.5
19.0
22.0
23.2
20.9
23.6
21.3
18
20
22
24
19.8

Chapter VI: In Conclusion 39
NYC Center for Economic Opportunity nyc.gov/ceo
ChaPTer vi: in ConClusion
Thisreportmarksaturningpoint.CEO’stwopriorannualreportsonpovertyinNewYorkCitydocumentedthegrowingimportanceofthesocialsafetynetatatimewhenthejobmarketwascontractingandearnedincomewasindecline.Formanylow-incomefamilies,thedistancebetweentheirearningsandthepovertythresholdwidened.Atthesametime,thesafetynetexpanded,fillingsome,butnotall,ofthegap.Asaconsequence,from2008to2010,thepovertyraterose.Itwouldbetoosimple,wehavepointedout,tocitethisincreaseasevidencethattheFederalandCityresponsestotherecessionwerefailures.OurworkalsodemonstratedhowmuchhigherthepovertyratewouldhaveclimbedintheabsenceoftheexpansionoftaxprogramsandFoodStampbenefits.
The2011datawepresentedinthisreportcoincidewithashiftintheeconomicandpolicyenvironments.Afteratwo-yearfall,theproportionofworkingageNewYorkersholdingajobrose.Althoughearnedincomedidnotriseforfamiliesinthebottomhalfofthedistribution,itssharpdeclinewasarrested.Thetrendinearnings,coupledwithexpandedtaxinitiatives(especiallythepayrolltaxcutin2011)andacontinuingincreaseinenrollmentintheFoodStampprogram,pushedourbroadestmeasureoffamilyresources–CEOincome–higher.Theincreasewaslargeenoughtooffsettheyear-to-yearriseintheCEOthreshold.Asaresult,the2011CEOpovertyratewasstatisticallyunchangedfromtheprioryear.Lookingahead,thereisgoodreasontoexpectthatthe2012AmericanCommunitySurveywillrevealfurthergainsinjobholding,increasingthelikelihoodthatalevelingoffofthepovertyratein2011couldbefollowedbyafallin2012,allelseequal.
Buttheturningpointinthejobmarketisnottheonlychangeweneedtonote.Alongwiththeendoftheslumpinthejobmarketistheendoftherecession-relatedexpansionofthesafetynet.FoodStampbenefitlevelshavenotincreasedsince2009and,asaresultoflegislationenactedin2010,theywillbereducedonNovember1,2013.45Someoftheeconomicstimulus-relatedincometaxcreditprogramsexpiredattheendof2010.ThenumberofweeksthatUnemploymentInsuranceisavailabletothelong-termjoblesswascutin2012.Thereductioninthepayrolltaxrateexpiredattheendof2012.
Thesequester–thecutsinFederalgovernmentspendingthatbeganonMarch1,2013–alsothreatensprogramsimportanttolow-incomeAmericans.UnemploymentInsurancebenefitlevelsforthelong-termjoblesswhoarereceivingFederally-fundedbenefitscouldfallby11percent.46TheCenteronBudgetandPolicyPrioritiesestimatesthatbetween575,000and750,000womenandchildrenwillbedeniedWICbenefitsbytheendofthecurrentFederalfiscalyear.47FundingforFederalhousingprograms,thebackboneofthemeans-testedhousingassistancesovitaltolow-incomeNewYorkers,willalsosufferstiffreductions.48
Insum,thedynamicthatspurred,butalsolimited,therecentriseinpoverty–decliningearningsbufferedbyanexpandedsafetynet–isshifting.InthecontextofpoliticalstalemateandapolicyenvironmentthatisfocusedonreducingtheFederalbudgetdeficit,progressinreducingpovertywilldependtoalargedegreeonarisingeconomictideliftingenoughboats.ProgresswillalsorestonthecontinuedeffortsbyCitypolicymakerstobuild“on-ramps”tothejobmarketforthosegroupsofNewYorkersthatprosperitysooftenleavesbehind.
45.Dean,StaceyandDorothyRosenbaum.SNAP Benefits Will Be Cut for All Participants in November 2013.CenteronBudgetandPolicyPriorities.February8,2013.Availableat:www.cbpp.org/files/2-8-13fa.pdf46. The Sequester’s Devastating Impact on Families of Unemployed Workers and the Struggling Unemployment Insurance System.NationalEmploymentLawProject.BriefingPaper.February27,2013.Availableat:http://www.nelp.org/page/-/UI/2013/Briefing-Paper-Sequester-Unemployment-Insurance.pdf?nocdn=147.Neuberger,ZoeandBobGreenstein.The Impact of the Sequester on WIC: 575,000 to 750,000 Eligible Low-Income Women and Children at Nutritional Risk Could Be Denied Benefits.CenteronBudgetandPolicyPriorities.March5,2013.Availableat:www.cbpp.org/files/2-26-13fa.pdf48. Estimated Cuts in Federal Housing Assistance and Community Development Programs Due to Sequestration, 2013.CenteronBudgetandPolicyPriorities.March5,2013.Availableat:www.cbpp.org/files/1-28-13hous.pdf

NYC Center for Economic Opportunity nyc.gov/ceo
40 The CEO Poverty Measure, 2005 - 2011

Appendix A 41
NYC Center for Economic Opportunity nyc.gov/ceo
Appendix A: The poverTy Universe And UniT of AnAlysis
The Introduction to this report noted that a measure of poverty must establish a threshold, a line that demarcates the poor from the rest of society. It must also define what resources a family can draw on to meet its needs. Once these are in place, a method for measuring poverty needs to assess which groups in the population it can be meaningfully applied to. The “poverty universe” is the population whose poverty status can be determined.
Another important task is to create a “poverty unit of analysis.” People live together for a variety of reasons. The ones that are relevant to poverty measurement are that they pool economic resources and satisfy material needs as a unit. As described below, CEO expands the definition of the unit of analysis beyond the family-based unit that is employed by the official measure.
Who Is Counted When Measuring Poverty?Not everyone can be counted when measuring poverty. For example, the poverty universe used by the Census Bureau in its official poverty measure excludes most people living in “group quarters” such as college dormitories, nursing homes, military bases, and prisons.1
It is easy to see why. Much of this population is in no position to earn income. At the same time, group quarters residents typically receive housing, meals, and other services that are provided by the institutions they reside in. The former condition could be used to judge that every individual in an institutionalized setting is poor. The latter condition could be used to judge that these persons’ basic material needs are being met and that they are not poor. Either choice reveals that a concept of poverty as material deprivation is an awkward fit for this group.
An additional challenge to determining the poverty status of group quarters residents is the lack of information the American Community Survey (ACS) provides about them, particularly their relationship with others. A college student living in a dormitory, for example, may have little or no personal income, but might be comfortably supported by her parents. That information is unavailable in the survey. All of these reasons make it very difficult to determine the poverty status of group quarters residents. CEO, therefore, excludes the entire group quarters population from our measure.
1. For a definition of group quarters, see: www.census.gov/acs/www/Downloads/data_documentation/SubjectDefinitions/2011_ ACSSubject Definitions.pdf
Another group that is excluded from the official poverty measure is unrelated persons living in households who are under 15 years of age. They are not assigned a poverty status because, as unrelated individuals, whether they would be poor or not poor would depend on their personal income. The ACS, however, does not collect data on the incomes of persons under 15 years of age. CEO, by contrast, includes this group in our poverty universe. As explained below, unrelated individuals under 15 are placed in a poverty unit with other members of the household they reside in and their poverty status is determined by the income of the unit as a whole.
In sum, the CEO poverty universe excludes the entire group quarters population, but includes the entire household population in the ACS sample for New York City. As Table A One illustrates, the universe for this study includes 8.071 million out of the 8.244 million City residents in 2011. All of the excluded, over 173,000 people or 2.1 percent of the population, are living in group quarters.
The Poverty Unit of Analysis: Who Is Sharing Income and Expenses?From the perspective of the current official methodology, individuals are considered poor if the total income of the family they live in fails to reach the appropriate poverty threshold for their family’s size and type. The rationale for this is straightforward: family members who reside in the same household share resources and living expenses. Spouses typically pool their income and make joint decisions about major expenditures. Parents provide financial support to their children. Treating family members as lone individuals whose poverty status is determined by their own income would place nearly every non-working spouse and child in poverty.
Families in the official poverty measure are composed of people who are related to the household head by blood,
table a oneThe CEO Poverty Universe, 2011
Number PercentHousehold Population 8,071,057 97.9%Group Quarters Population 173,369 2.1%Total Population 8,244,426 100.0%
Source: American Community Survey Public Use Micro Sample as augmented by CEO.

NYC Center for Economic Opportunity nyc.gov/ceo
42 The CEO Poverty Measure, 2005 - 2011
marriage, or adoption.2 CEO modifies this definition of the family unit in three ways:
1. People who are unmarried partners of the household head are considered part of that head’s family rather than separate unrelated individuals.3 Following a recommendation by the National Academy of Sciences (NAS) Panel, such people are treated as the householder’s spouse.4 If the household also includes children of the partner who have not already been identified as children of the reference person, they are included as children in the householder-unmarried partner family.
2. CEO creates additional family units, referred to as “unrelated subfamilies.” These are family units within households that do not include someone who is related to the householder. An example of such a unit would be two persons who are married to each other and are boarders in someone else’s home. Because of data limitations, unrelated subfamilies can only be observed when they are composed of married couple families, with or without their own children, or single persons with children.
3. We place other unrelated individuals who we identify as being claimed as dependents for tax filing purposes into the poverty unit of those claiming them. Individuals claimed as dependents are being supported by others in the household. Given that relationship, we judge that they should be members of the poverty unit of the person(s) whom they are dependent upon. This step assigns non-relative indigent adults and nearly all the unrelated children in private households to a poverty unit. In the few instances where the tax program cannot connect an unrelated child to a tax unit (see Appendix D describing the CEO tax model), the child joins the poverty unit of the household’s reference person.5
Together, these three modifications bring slightly over 215,000 individuals who would have been treated as single-person poverty units or excluded from the poverty
2. The ACS does not identify unrelated subfamilies. See below for a definition of this group.3. The ACS Subject Definitions defines an unmarried partner as “a person age 15 years and over, who is not related to the householder, who shares living quarters, and who has a close personal relationship with the householder.” The gender of the partners is irrelevant to this designation.4. Citro and Michael, p. 306.5. For a detailed description of how these units are created and evaluation of the accuracy of CEO’s methods, see Virgin, Vicky. “Creating the CEO Poverty Unit: An Evaluation Using the CPS ASEC.” June 2011. Available at: www.irp.wisc.edu/research/povmeas/Poverty_unit_analysis_CEO_2011.pdf
universe in the official measure into multi-person poverty units in the CEO measure.
Thus, the poverty unit of analysis for this study is composed of:
1. Expanded families: all persons residing in the same household who are related to the household’s reference person by blood, marriage, adoption, or are the reference person’s unmarried partner (and any children and dependents of that partner not already identified as related to the reference person), or others who are claimed by the household head as dependents for tax filing purposes. As Table A Two reports, this group accounts for 83.4 percent of the total poverty universe. Persons living in families that include an unmarried partner, a subgroup within the expanded family category, comprise 5.5 percent of the poverty universe.
2. Unrelated subfamilies. This subgroup accounts for only 0.4 percent of the poverty universe.
3. The remainder of the poverty universe is composed of “unrelated individuals.” These are people who are either living alone (12.2 percent of the universe) or are living in a household with others, but with whom they have no familial or obvious economic relationship (4.4 percent of the universe). Both groups of unrelated individuals are treated as “single-person families” and their poverty status is determined using their individual CEO incomes.
A poverty threshold is assigned to each unit based on its size and composition. (See Appendix B.) The sum of the resources of all the people in the unit is computed and compared to the appropriate threshold to determine whether the members of the unit are poor.
table a twoThe Unit of Analysis for Poverty Measurement, 2011
Number of Persons
Share of Poverty Universe
People in CEO Expanded Families 6,727,675 83.4% People in Unmarried Partner
Families443,962 5.5%
People in Unrelated Subfamilies
29,777 0.4%
Unrelated Individuals Living with Others
358,995 4.4%
Unrelated Individuals Living Alone
984,387 12.2%
Total Poverty Universe 8,071,057 100.0% Source: American Community Survey Public Use Micro Sample as augmented by CEO.
NYC Center for Economic Opportunity nyc.gov/ceo
Appendix B 43
Appendix B: deriving A poverTy Threshold for new york CiTy
One of the primary goals of the CEO poverty measure is to establish a realistic standard of need for New York City. In our first three reports we created a poverty threshold that was based on the 1995 recommendations of the National Academy of Sciences (NAS). The Interagency Technical Working Group’s (ITWG) March 2010 guidelines called for a similar, but not identical, approach to drawing the poverty line.6 These recommendations are reflected in the Supplemental Poverty Measure (SPM) the Census Bureau first released in November 2011.7
For last year’s and this year’s report, CEO revised the method we use to construct a New York City-specific threshold in light of the ITWG’s guidelines. Bringing our threshold into closer alignment with the SPM makes our poverty rates more commensurable with those issued by the Census Bureau. However, we have not followed the SPM in all respects. This appendix briefly describes the SPM threshold and the ways in which CEO has followed or diverged from the SPM method. It then provides the steps we take to create our New York City-specific threshold. Because year-to-year changes in the threshold are important to understanding changes in poverty rates over time, it also compares growth in CEO’s New York City threshold with the U.S.-wide SPM and the official thresholds.
From NAS to SPMThe NAS recommended that the first step in creating the poverty threshold was to compute a nationwide threshold based on the distribution of expenditures on food, clothing, shelter, and utilities by a reference unit composed of two-adult, two-child families.8
6. Observations from the Interagency Technical Working Group on Developing a Supplemental Poverty Measure. March 2010. Available at: www.census.gov/hhes/www/poverty/SPM_TWGObservations.pdf7. Short, Kathleen. The Research Supplemental Poverty Measure: 2010. U.S. Bureau of the Census. November 2011. Available at: www.census.gov/hhes/povmeas/methodology/supplemental/research/Short_ResearchSPM2010.pdf8. Two-adult, two-child units are referred to as the reference family because, as we discuss below, the thresholds for other families are calculated in reference to families of this type. This family was chosen by the NAS because it is the most common structure among families that include children less than 18 years of age.
An additional factor is included to account for miscellaneous expenses, such as non-work-related travel, household supplies, and personal care products. Expenditures are measured using a three-year moving average of data available in the Bureau of Labor Statistics’ Consumer Expenditure Survey (CE).
The NAS did not recommend a specific poverty line; instead it suggested that the threshold fall between the 30th and 35th percentile of the distribution of what families spend on the items in the threshold. (These percentiles were equivalent to 78 percent and 83 percent of the median level of spending on these goods at the time of the report.)9 The NAS also offered an upper and lower bound for the factor that accounts for miscellaneous necessities, a multiplier ranging from 1.15 to 1.25 times the food, clothing, shelter, and utilities expenditure estimate.10
The SPM threshold is also based on CE measures of expenditures on the same group of necessities. However, the SPM differs from the prior NAS method in four respects:
1. The SPM expands the reference family to include all Consumer Units in the CE with exactly two children, not just those with two adults.
2. The SPM is based on the 33rd percentile of the expenditure distribution, not a fixed percentage of the median of the distribution.
3. The SPM uses a five-year moving average of expenditure data. The NAS had proposed a three-year moving average.
4. The SPM creates separate thresholds to reflect differences in housing status for owners with a mortgage, owners free and clear of a mortgage, and renters. The NAS-based research had used a common threshold for these groups.11
9. The relationship between the percentiles of the distribution and the percentages of the median may have changed since the NAS Panel report.10. Citro and Michael, p. 106.11. The NAS report was aware of the limitations of this approach and suggested that one remedy would be to develop a separate threshold for homeowners with low or no housing costs. Citro and Michael, p. 245.
NYC Center for Economic Opportunity nyc.gov/ceo
44 The CEO Poverty Measure, 2005 - 2011
Accounting for Housing StatusCEO has adopted the first three of the changes listed above. CEO, however, does not follow the ITWG guidelines that call for the creation of separate thresholds by housing status. Instead, CEO continues to account for differences in housing status on the income side of the poverty measure, applying a housing status adjustment to all households that reside in “non-market rate” housing. This includes homeowners without a mortgage, renters living in rent-regulated units, and renters who do not pay cash rent, along with renters participating in means-tested housing assistance programs.
The different approaches reflect the availability of data that describe the unique features of the New York City housing market. The SPM method has been created for use with the Census Bureau’s Current Population Survey (CPS). The CPS indicates whether respondents own or rent their housing. A newly added question identifies homeowners who make or do not make mortgage payments. The CPS, however, does not provide information about housing expenditures, and the Survey provides little other information (such as the size or condition of the housing unit) that would make estimating these feasible. The SPM’s recourse is to create separate thresholds, by housing status, which are derived from the housing expenditure data available in the CE.
CEO, by contrast, uses the American Community Survey (ACS) as its principal data set. The ACS identifies homeowners who make mortgage payments, homeowners free and clear of a mortgage, renters who pay rent, and renters who do not pay cash for their shelter. In addition, the ACS provides data on what nearly all households pay out-of-pocket for their shelter and utilities.12 The unique-to-New York City Housing and Vacancy Survey provides CEO with the ability to identify households that are participating in the wide variety and far-reaching array of housing affordability programs available to renters in the City. This creates the opportunity to account for the advantages of home ownership free of a mortgage and participation in housing affordability programs on a household-by-household basis without having to construct separate thresholds that try to capture them “on average.” Given the wealth of data available to us, CEO concluded that we should take advantage of it. Our income-side
12. The exception is renters participating in tenant-based subsidy programs. CEO imputes their expenditures by a statistical match with the New York City Housing and Vacancy Survey.
method for accounting for housing status is detailed in Appendix C.
Geographic AdjustmentThe NAS argued that because living costs are not uniform across the United States, the poverty thresholds should be geographically adjusted. Since research indicates that the largest source of the disparity in inter-area living costs is a result of differences in housing costs, the Panel recommended that only the part of the threshold that is made up of shelter and utilities expenditures should be adjusted. It further suggested that the ratio of area-specific to U.S.-wide Fair Market Rents developed by the U.S. Department of Housing and Urban Development (HUD) could be used as the adjustment factor.13
Following the ITWG Guidelines, the SPM uses the ratio of median rents for two-bedroom units for its adjustment factor, but computes these from the ACS. CEO continues to use HUD’s Fair Market Rents (FMR) for two-bedroom units. The FMR ratio for New York City differs from the ACS ratio (1.48243 vs.1.36786) because they measure different things. Fair Market Rents are representative of recently rented units of standard quality. The rent data from the ACS covers all rental units except the very small number that lack complete plumbing and kitchen facilities. Because rent regulation is so widespread in New York City, rents at the median of the ACS distribution are not an accurate reflection of the market rate rental housing market. This creates two inconsistencies. First, the SPM method compares a New York City median rent that is influenced by housing affordability programs against a U.S.-wide median that (because of the very narrow scope of these programs nationally) is not. The impact of rent regulation on the ACS-based rents for New York City creates a second inconsistency in that CEO is accounting for the effect of housing affordability programs on the income side of the poverty measure. CEO, therefore, continues to use the FMRs to create the adjustment factor.
Table B One provides the steps taken in creating the CEO threshold for 2011. The 2011 U.S.-wide SPM threshold (before the housing adjustment) is $24,999.14 Housing (shelter and utilities) makes up nearly half (49.3 percent) of this threshold. The housing portion is multiplied by the ratio of U.S. to New York City Fair Market Rents
13. Citro and Michael, pp. 182-201. The NAS Panel regarded this approach as provisional, pending further research.14. For 2011, the Bureau of Labor Statistics did not report a pre-housing status adjustment SPM threshold. CEO calculated it from the data provided at: www.bls.gov/pir/spmhome.htm#threshold

NYC Center for Economic Opportunity nyc.gov/ceo
Appendix B 45
(1.48243) and comes to $18,270. This is added together with the (unadjusted) non-housing portion of the threshold, yielding a New York City-specific threshold of $30,945. This CEO threshold is 23.8 percent higher than the U.S.-wide SPM threshold. The geographic adjustment implies that a New York City resident needs $1.24 to obtain a standard of living equivalent to what $1.00 would obtain, on average, across the United States.
table b oneCreation of CEO Threshold, 2011
U.S.-wide SPM Threshold $24,999 Housing Portion of Threshold 49.3%Geographic Adjustment Factor 1.48243Adjusted Housing Portion of Threshold $18,270 CEO Threshold $30,945
Sources: U.S. Bureau of Labor Statistics and U.S. Department of Housing and Urban Development.Note: See text for explanation of concepts.
Adjustment for Poverty Unit Size Once a threshold for the reference family has been set, thresholds need to be calculated for families (or poverty units) of other sizes and compositions (i.e., number of children and number of adults). This study uses the three-parameter scale developed by David Betson after the release of the NAS report.15 The scale has been used in the Census Bureau’s NAS-based poverty reports and in the new SPM.
Table B Two provides a selection of family size adjustments using Betson’s scale. These are known as equivalence scales because they are used to compute the amounts of income needed by families of different types to be equivalently well-off. The scales give the adjustments that are needed to convert the threshold for the reference family of two adults and two children to thresholds for other family sizes. For example, to calculate the threshold for a family of two adults and one child, the table indicates that the reference family threshold of $30,945 would have to be multiplied by 0.88, which would yield a threshold of $27,231.
15. Betson, David. Is Everything Relative? The Role of Equivalence Scales in Poverty Measurement. University of Notre Dame. March 1996. Available at: www.aspe.hhs.gov/poverty/papers/escale.pdf
table b two Factors Used by CEO to Adjust Reference Family Thresholds for Units of Other Sizes and Types
Number of Children Under 18
Number of Adults None One Two ThreeOne 0.463 0.699 0.830 0.953
Two 0.653 0.880 1.000 1.114
Three 1.000 1.114 1.223 1.328
Four 1.223 1.328 1.430 1.529 Source: Computed by CEO based on Betson, David. Is Everything Relative? The Role of Equivalence Scales in Poverty Measurement. University of Notre Dame. 1996.
Table B Three lists the resulting CEO poverty thresholds for a variety of families and compares them to the official thresholds for families of corresponding sizes and compositions. The CEO thresholds are always higher, but not by the same factor. This reflects the differences between the Betson scale and the scale implicit in the official thresholds. An important difference between the scaling methods (not reported in the table) is that the official method creates a different, and lower, poverty threshold for individuals and some families with a householder who is age 65 or older. The official threshold for a single adult is $11,702 if he or she is under 65, but $10,788 if that person is older. The CEO threshold makes no distinction by age. While the CEO threshold for a single, non-elderly person is 1.224 times the official threshold, it is 1.328 times the official threshold for a single, elderly person.
table b threeComparison of Poverty Thresholds, 2011
Poverty Unit Composition CEO OfficialCEO/
OfficialOne Adult*, No Child $14,327 $11,702 1.224
Two Adults*, No Child $20,207 $15,063 1.341
One Adult*, One Child $21,630 $15,504 1.395
One Adult, Two Children $25,684 $18,123 1.417
One Adult, Three Children $29,490 $22,891 1.288
Two Adults, One Child $27,231 $18,106 1.504
Two Adults, Two Children $30,945 $22,811 1.357
Two Adults, Three Children $34,472 $26,844 1.284 *Adult is non-elderly in official threshold. Sources: U.S. Bureau of the Census and CEO calculations from Tables B One and B Two.

NYC Center for Economic Opportunity nyc.gov/ceo
46 The CEO Poverty Measure, 2005 - 2011
Changes in the Poverty Thresholds Over TimeMeasuring poverty is an exercise in comparing incomes to thresholds. Thus, part of understanding changes in poverty rates over time is tracking how the thresholds are changing from one year to the next. Table B Four provides the official, U.S.-wide SPM, and CEO reference family thresholds for 2005 through 2011. It also reports the percentage change in the thresholds from the prior year and the ratio of the SPM to official, CEO to official, and CEO to SPM thresholds. With the exception of the change from 2010 to 2011, the SPM and CEO thresholds grew at a faster rate than the official threshold during the 2005-2011 period. Over this time span the CEO threshold increased at a somewhat faster rate than the U.S.-wide SPM threshold. The ratio of the two alternative thresholds to the official threshold rose from 2005 to 2010 and the CEO poverty threshold rose relative to the U.S.-wide SPM threshold.
table b fourPoverty Thresholds, 2005 - 2011
Reference Family Thresholds
Year Official US-Wide SPM CEO2005 $19,806 $20,492 $24,532 2006 $20,444 $21,320 $25,615 2007 $21,027 $22,317 $26,979 2008 $21,834 $23,608 $28,822 2009 $21,756 $23,854 $29,265 2010 $22,113 $24,343 $30,055 2011 $22,811 $24,999 $30,945
Percentage Change from Prior Year
Year Official US-Wide SPM CEO2006 3.2% 4.0% 4.4%2007 2.9% 4.7% 5.3%2008 3.8% 5.8% 6.8%2009 -0.4% 1.0% 1.5%2010 1.6% 2.0% 2.7%2011 3.2% 2.7% 3.0%
Ratio of Thresholds
Year SPM/Official CEO/Official CEO/SPM2005 1.035 1.239 1.1972006 1.043 1.253 1.2012007 1.061 1.283 1.2092008 1.081 1.320 1.2212009 1.096 1.345 1.2272010 1.101 1.359 1.2352011 1.096 1.357 1.238
Sources: U.S. Bureau of Labor Statistics and U.S. Department of Housing and Urban Development.

NYC Center for Economic Opportunity nyc.gov/ceo
Appendix C 47
Appendix C: AdjUsTmenT for hoUsing sTATUs
Housing plays a central role in National Academy of Sciences (NAS)-type poverty measures. As noted in Appendix B, housing needs are represented in the creation of the threshold and account for nearly one-half of the U.S.-wide Supplemental Poverty Measure (SPM) poverty line. Differences in housing expenditures are also the basis for adjusting the SPM poverty thresholds to account for inter-area differences in living costs.
An ongoing concern among poverty researchers is how to account for differences in housing status. This has often been thought of as two distinct issues. One is the need to account for the lower spending needs that homeowners who are free and clear of a mortgage have relative to homeowners who are carrying a mortgage.16 A second issue is how to value means-tested housing assistance, such as residence in public housing or participation in tenant-based subsidy programs.17
The Interagency Technical Working Group (ITWG) Observations addressed these concerns. The new SPM accounts for the first housing status issue by creating distinct thresholds for owners with a mortgage, owners without a mortgage, and renters. In addition, recent research by Census Bureau staff has established an approach to valuing means-tested housing assistance that has been incorporated into the SPM.18
Appendix B explained why CEO believes that a household-by-household adjustment on the income side of the poverty measure is the most appropriate way for us to measure the advantages of ownership free and clear of a mortgage, residence in rent-regulated housing units, or participation in a means-tested housing assistance program. This appendix begins with the conceptual issue of how best to define “advantage” in a way that can be measured in dollars that are added to a family’s income. After describing our approach, the appendix details the steps we take to create the estimates needed to
16. See, for example: Garner, Thesia I. and David Betson. Housing and Poverty Thresholds: Different Potions for Different Notions. March 2010. Available at: www.bls.gov/pir/spm/spm_pap_housing10.pdf17. A variety of approaches to valuing housing subsidies are discussed in Renwick, Trudi. Improving the Measurement of Family Resources in a Modernized Poverty Measurement. U.S. Bureau of the Census. January 2010. Available at: www.census.gov/hhes/povmeas/publications/overview/RenwickSGE2010.pdf18. Johnson, Paul D., Trudi Renwick, and Kathleen Short. Estimating the Value of Federal Housing Assistance for the Supplemental Poverty Measure. SEHSD Working Paper #2010-13. July 2011. Available at: www.census.gov/hhes/povmeas/methodology/supplemental/research/SPM_HousingAssistance.pdf
implement it. We conclude with a note about the housing adjustment for homeowners without a mortgage.
Measuring Advantage Not all New Yorkers require the same level of expenditure to obtain shelter of comparable size and quality. Renters in public housing or rent-regulated units, renters who receive a tenant-based subsidy, and homeowners free and clear of a mortgage have lower housing costs than residents of “market rate” housing. To account for this advantage, the CEO poverty measure makes an adjustment to the income of the non-market rate households.19
The housing adjustment for non-market rate renters is calculated as the lesser of:
Either,
(1) Adjustment = The estimated market rate gross rent of their housing unit minus their actual out-of-pocket housing expenditures.
Or,
(2) Adjustment = The housing portion of the threshold minus their actual out-of-pocket housing expenditures.
The estimated market rate gross rent of a rent-regulated or subsidized unit is what the household would be paying for the unit if its costs equaled that of a market rate unit of similar size and quality.
The housing adjustment for homeowners who are free and clear of a mortgage is always calculated using the second alternative. (The reason why we take a somewhat different approach for this group is taken up below.)
This approach rests on several judgments. The first is that the quality of non-market housing units is not inferior to market rate units of similar size and quality. If non-market housing residents were simply paying less for their housing because they were living in poorer quality
19. If more than one poverty unit resides in a household, the housing adjustment is prorated across the units according to their relative size.

NYC Center for Economic Opportunity nyc.gov/ceo
48 The CEO Poverty Measure, 2005 - 2011
homes, there would be little or no advantage to their housing status. As we demonstrate below, our modeling of market rate rents indicates that many non-market rate renters, particularly those that are participants in means-tested housing programs, are able to secure housing whose market value is well in excess of what they actually spend to meet their housing needs.
A second judgment is that residence in non-market rate housing can make resources which would have been devoted to housing available to meet other non-housing needs. However, the advantage of residence in non-market rate housing is not fully fungible. By its construction, the adjustment cannot exceed the value of the housing portion of the threshold. Even if a household is enjoying shelter that would cost many times the value of the housing portion of the threshold, the entire difference between what it is paying for its housing and the housing’s market value does not represent a resource it can use for other purposes. Thus a family will be counted as poor if its income, after meeting its housing needs, is not sufficient to meet its non-housing needs.
Finally, we do not allow for negative adjustments. If out-of-pocket expenditures exceed the housing portion of the threshold, the difference is not deducted from the poverty unit’s income. This rule rests on the judgment that housing of adequate quality is available at a level of expenditure equal to the housing portion of the threshold. Or, more simply put, that the housing portion of the threshold is not too low. Expenditures in excess of the housing portion of the threshold, therefore, are discretionary and do not belong in a measure of poverty.
In order to implement this approach we need to: 1) Distinguish market from non-market rate housing units; 2) Measure out-of-pocket housing costs; and 3) Estimate market rents for non-market rate units. We begin with a description of how we make use of the New York City Housing and Vacancy Survey (HVS) to create the necessary data.20
Identifying Housing Status and Out-of-Pocket RentsParticipants in means-tested housing assistance programs, tenants in rent stabilized/controlled apartments, tenants who pay no rent, and homeowners
20. A complete description of the HVS can be found at: www.census.gov/hhes/www/housing/nychvs/nychvs.html
free and clear of a mortgage receive a housing adjustment to their income. The American Community Survey (ACS) provides some of the information needed to identify these groups. The survey indicates which households own their home and whether or not they are carrying a mortgage. It also identifies those renter households who do not pay any cash rent.
There are, however, two crucial pieces of information that the ACS does not contain, both of which pertain to renters. First, the ACS does not indicate whether the household resides in public housing, a rent-regulated unit, or is receiving a tenant-based subsidy. The second piece of missing information is that the ACS does not identify a tenant-based subsidy recipient’s out-of-pocket expenditures for shelter and utilities. There are two rent variables in the ACS – contract rent and gross rent. Contract rent is the rent received each month by the landlord. Gross rent is contract rent plus utility payments. These two variables do not represent renter out-of pocket expenditures for shelter and utilities, if the household is participating in a rental subsidy program.21
To address these deficiencies we turn to the HVS, which collects detailed information on geographic, demographic, and housing-related characteristics of housing units and their occupants. By matching renter households in the ACS to renter households in the HVS we are able to impute the missing housing program status and the out-of-pocket expenditures data to the ACS. Our matching routine is based on a set of household and head-of-household characteristics that identify corresponding households between the ACS and HVS. Listed below are characteristics used for matching renter households in the matching algorithm:
1. Neighborhoods: Community District (CD) or Public Use Microdata Area (PUMA).
2. Race/Ethnicity of the householder (Non-Hispanic White, Non-Hispanic Black, Hispanic, Non-Hispanic Other Race).
3. Whether the householder was 65 or older.
4. Equivalized household income as a ranking based on the distribution. (Income is banded into septiles, sextiles, quintiles, and quartiles calculated for each respective data set.)
21. Although ACS respondents are instructed to provide the rent received by the landlord, it is unclear whether subsidy recipients include the portion of the rent they do not pay in their answers. See: Parker, Julie. “Rent: A Story of Misreporting?” NAWRS 2010. Available at: www.nawrs.org/LA2010/Papers/t1c3.pdf
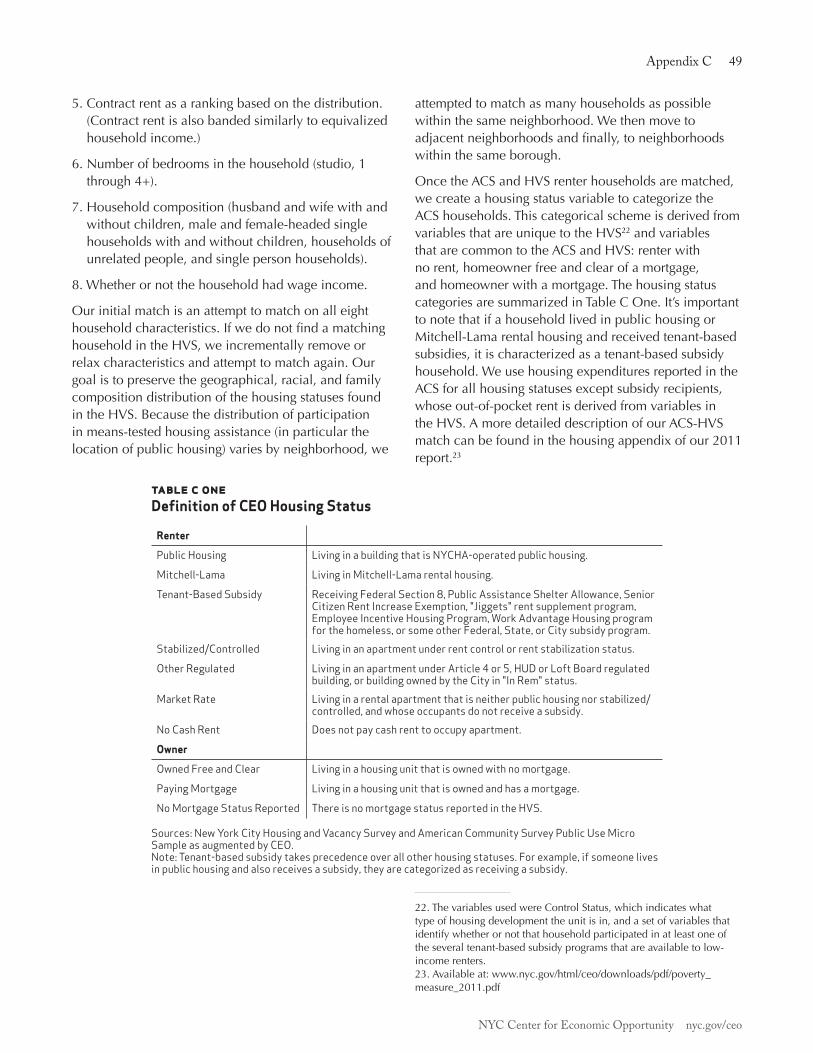
NYC Center for Economic Opportunity nyc.gov/ceo
Appendix C 49
5. Contract rent as a ranking based on the distribution. (Contract rent is also banded similarly to equivalized household income.)
6. Number of bedrooms in the household (studio, 1 through 4+).
7. Household composition (husband and wife with and without children, male and female-headed single households with and without children, households of unrelated people, and single person households).
8. Whether or not the household had wage income.
Our initial match is an attempt to match on all eight household characteristics. If we do not find a matching household in the HVS, we incrementally remove or relax characteristics and attempt to match again. Our goal is to preserve the geographical, racial, and family composition distribution of the housing statuses found in the HVS. Because the distribution of participation in means-tested housing assistance (in particular the location of public housing) varies by neighborhood, we
attempted to match as many households as possible within the same neighborhood. We then move to adjacent neighborhoods and finally, to neighborhoods within the same borough.
Once the ACS and HVS renter households are matched, we create a housing status variable to categorize the ACS households. This categorical scheme is derived from variables that are unique to the HVS22 and variables that are common to the ACS and HVS: renter with no rent, homeowner free and clear of a mortgage, and homeowner with a mortgage. The housing status categories are summarized in Table C One. It’s important to note that if a household lived in public housing or Mitchell-Lama rental housing and received tenant-based subsidies, it is characterized as a tenant-based subsidy household. We use housing expenditures reported in the ACS for all housing statuses except subsidy recipients, whose out-of-pocket rent is derived from variables in the HVS. A more detailed description of our ACS-HVS match can be found in the housing appendix of our 2011 report.23
22. The variables used were Control Status, which indicates what type of housing development the unit is in, and a set of variables that identify whether or not that household participated in at least one of the several tenant-based subsidy programs that are available to low-income renters.23. Available at: www.nyc.gov/html/ceo/downloads/pdf/poverty_measure_2011.pdf
table c oneDefinition of CEO Housing Status
Renter
Public Housing Living in a building that is NYCHA-operated public housing.
Mitchell-Lama Living in Mitchell-Lama rental housing.
Tenant-Based Subsidy Receiving Federal Section 8, Public Assistance Shelter Allowance, Senior Citizen Rent Increase Exemption, "Jiggets" rent supplement program, Employee Incentive Housing Program, Work Advantage Housing program for the homeless, or some other Federal, State, or City subsidy program.
Stabilized/Controlled Living in an apartment under rent control or rent stabilization status.
Other Regulated Living in an apartment under Article 4 or 5, HUD or Loft Board regulated building, or building owned by the City in "In Rem" status.
Market Rate Living in a rental apartment that is neither public housing nor stabilized/controlled, and whose occupants do not receive a subsidy.
No Cash Rent Does not pay cash rent to occupy apartment.
Owner
Owned Free and Clear Living in a housing unit that is owned with no mortgage.
Paying Mortgage Living in a housing unit that is owned and has a mortgage.
No Mortgage Status Reported There is no mortgage status reported in the HVS. Sources: New York City Housing and Vacancy Survey and American Community Survey Public Use Micro Sample as augmented by CEO. Note: Tenant-based subsidy takes precedence over all other housing statuses. For example, if someone lives in public housing and also receives a subsidy, they are categorized as receiving a subsidy.

NYC Center for Economic Opportunity nyc.gov/ceo
50 The CEO Poverty Measure, 2005 - 2011
Table C Two provides the results of the match between the 2011 HVS and 2011 ACS. The percentage distribution of households between the donor HVS and the recipient ACS by housing status categories is extremely close. In no case does the difference between the distributions exceed 1.3 percentage points.
Estimating Market RentsMarket value is a hypothetical level of expenditure that must be estimated. In the economics literature the value of housing services is often thought of as a bundle of different physical and location-specific characteristics of a given unit.24 We can, therefore, estimate the market rent of non-market rate housing by fitting a regression model accounting for these factors to a sample consisting of market rate units, and then apply the resulting coefficients to the same set of characteristics of non-market rate units.
Before describing the model, a clarification should be made. The dependent variable in the regression is the gross rent currently paid for the unit. Thus, market value is not necessarily equal to what a unit would rent for if it were placed on today’s market. Since our concern is differences in current spending needs between residents of market and non-market housing units, the former
24. An application of this approach in New York City can be found in Roistacher, Elizabeth A. “Rent Regulation in New York City: Simulating Decontrol Options.” Journal of Housing Economics 2, pp.107-138. 1992.
sense of market value is what we need to measure.
To estimate market rate rents, we rely on the 2005, 2008, and 2011 New York City Housing and Vacancy Surveys, which contain detailed information on the location and physical condition of rental units. For these years, we estimate a regression model on the subset of observations
that are in market rate rental units. We employ variables that measure housing quality at three levels: the unit/tenant, the building, and the neighborhood. The unit/tenant-specific indicators are the number of rooms and the length of the tenant’s tenure, which captures the negotiating power accrued by long-term tenants. At the building level, we use measures of building conditions, building size, building age, and whether the owner lives in the building. To capture neighborhood effects, we include a subjective “neighborhood quality” measure as reported by the tenant, as well as median PUMA income and dummy variables for the super-PUMA in which the building is located.25 We use super-PUMA dummies rather than PUMA dummies due to the limited number of market-rate units in some of the PUMAs. By including median PUMA income in the model, however, we are able to capture some of the variation in neighborhood effects at the PUMA level.
25. Super-PUMAs are Census-defined geographic units that represent approximately 400,000 residents. In their level of geographic detail, New York City’s 15 super-PUMAs stand between the City’s five boroughs and its 55 PUMAs.
table c twoComparison of Housing Status Between 2011 HVS and 2011 ACS
2011 HVS 2011 ACS Percentage Point
DifferenceHousing Status Frequency Percent Frequency PercentRenter
Public Housing 161,519 5.2% 166,207 5.5% -0.3Mitchell-Lama Rental 30,925 1.0% 36,761 1.2% -0.2Tenant-Based Subsidy 267,374 8.7% 229,684 7.6% 1.1Stabilized/Controlled 840,077 27.2% 830,301 27.5% -0.3Other Regulated 35,069 1.1% 72,900 2.4% -1.3Market Rate 723,664 23.4% 689,035 22.8% 0.6No Cash Rent 46,188 1.5% 50,340 1.7% -0.2Owner
Owned Free and Clear 351,095 11.4% 351,426 11.6% -0.3Paying Mortgage 632,970 20.5% 596,678 19.7% 0.8Total 3,088,881 100.0% 3,023,332 100.0%
Sources: New York City Housing and Vacancy Survey and American Community Survey Public Use Micro Sample as augmented by CEO.

NYC Center for Economic Opportunity nyc.gov/ceo
Appendix C 51
The relationship between gross rent and many of its predictor variables is complex and non-linear. In order to achieve the best possible fit to the data, we employ non-parametric techniques via a Generalized Additive Regression Model (GAM). A GAM is a regression model that allows different functional forms for each independent variable. Some of the variables used in the regression are included as dummy variables, while others are fit non-parametrically, using smoothing spline functions.26 The regression variables are defined in Table C Three.27
26. Smoothing splines are a particular type of non-parametric smoothing technique. For an overview of smoothing spline functions and GAM, see Keele, Luke John. Semiparametric Regression for the Social Sciences. West Sussex, England. John Wiley and Sons, Ltd. 2008. 27. Non-parametric variables do not have reported coefficients, but rather have smoothed bivariate plots. These plots are available from the authors upon request.
table c threeRegression Variables
Variable DescriptionTenant Tenure Years in ApartmentRooms Number of Rooms
4+ Stories, No Elevator Dummy (1= Four or More Stories and No Elevator)
Median PUMA Income Median Income within PUMA, in Thousands of Dollars
Tenant Rating Indicators Rated Fair Omitted
Rated Excellent Buildings in Neighborhood Rated by Tenant
Rated Poor Buildings in Neighborhood Rated by Tenant
Year Built Indicators
Built before 1947 OmittedBuilt 2000+Built 1990-1999Built 1980-1989Built 1970-1979Built 1960-1969Built 1947-1959Built 1930-1946Built 1920-1929Built 1901-1919Built 1900 and earlier
VariableUnits
DescriptionNumber of Units
Super-PUMA Indicators
Northern Bronx OmittedSouthern BronxNorthern KingsWestern KingsCentral KingsEastern KingsSouth KingsEastern ManhattanNorthern ManhattanWestern ManhattanRichmondNorthern QueensEastern QueensSouth Eastern QueensSouthern Queens

NYC Center for Economic Opportunity nyc.gov/ceo
52 The CEO Poverty Measure, 2005 - 2011
The results of the regression for 2011 are shown in Table C Four. The models for 2005 and 2008 (not shown) have a similar fit. The widest divergence in the coefficients across the years is in variables that are not statistically significant. In particular, the relationship between gross rent and median PUMA income in all three years’ models is quite close and highly significant.
table c fourRegression Models of Market Rate Rents, 2011
Dummy Variables Estimate t-Statistic
Intercept 1441.14 25.81
4+ Stories, No Elevator -241.95 -3.81
Rated Excellent 127.94 4.08
Rated Poor 143.18 1.63
Southern Bronx 77.98 0.55
Northern Kings 162.91 2.25
Western Kings 410.57 5.73
Central Kings 84.42 1.10
Eastern Kings -31.48 -0.45
South Kings 73.80 1.03
Northern Manhattan 745.58 7.92
Eastern Manhattan 1299.22 13.92
Western Manhattan 1501.90 15.40
Richmond -331.98 -3.77
Northern Queens 145.70 2.15Eastern Queens -68.88 -0.89
South Eastern Queens -262.35 -3.25
Southern Queens -130.51 -1.73
Non-Parametric Variables EDF F-Statistic
Log of Median PUMA Income
6.78 7.15
Tenant Tenure 2.06 59.23
Year Built 8.32 8.40
Number of Rooms 6.69 126.55
Number of Units 11.56 11.88
N 3,715
R2 0.574 Source: 2011 New York City Housing and Vacancy Survey. Notes: Dependent variable is monthly gross rent. Data weighted with the New York City Housing and Vacancy Survey household weight.
We then use the regression models to compute estimated market rate rent values for the non-market rental units. Table C Five shows the reported gross rent, estimated market rent, and their difference for various categories of renters in the 2011 HVS. The data are presented as rent per number of bedrooms since the average number
of bedrooms tends to vary across rental groups. The small difference between the reported and estimated rents for market rate units highlights the quality of the model’s fit. By contrast, there are large per-bedroom differences between the reported out-of-pocket rent and the estimated market rate rents for all the non-market rate groups. This is especially the case for public housing units, with a mean per-room difference of $461 in 2011. The considerably higher market rate estimates are consistent with our assumption that non-market renters are, indeed, advantaged relative to market rate renters.
table c fiveMean Reported Gross Out-of-Pocket Rent and Estimated Market Rate Rent, Per Bedroom, 2011
Housing StatusGross Out-of-Pocket Rent
Estimated Market Rent Difference
Market Rate $756 $765 -$8Public Housing $177 $638 -$461Mitchell-Lama Housing $472 $837 -$365Tenant-Based Subsidy $490 $587 -$97Stabilized/Controlled $600 $752 -$152Other Regulated $442 $920 -$478No Cash Rent $0 $583 -$583
Source: 2011 New York City Housing and Vacancy Survey.
Table C Six reports the mean difference between households’ out-of-pocket housing expenditures and two values: 1) the housing portion of the threshold and 2) the estimated market rent. These two differences correspond to the two income adjustment equations described previously. The differences that are based on the estimated market rate rents are uniformly higher (on average) than those using the housing portion of the threshold for all groups.28 When we apply the rule of taking the smaller of the two differences to compute the housing adjustment to income, Equation (1) is used in the majority of cases, ranging from 61.4 percent of the time for renters in stabilized/controlled units to 85.4 percent of the time for renters in Mitchell-Lama housing. This indicates that, for the most part, renters of non-market units are not “paying” for their cheaper rents by living in housing that is of such low quality that it would rent for less than the housing portion of the threshold.
28. The mean adjustment using the housing portion of the threshold for rent-stabilized and controlled units is negative, indicating that a majority of these households’ housing expenditures exceed that standard. This is not surprising as rent control and stabilization are not means-tested programs.

NYC Center for Economic Opportunity nyc.gov/ceo
Appendix C 53
Impact of the Housing Adjustment on the Poverty RateThe housing adjustment continues to have the largest impact on the CEO poverty rate of all the non-cash resource components. In 2011, it reduced the Citywide poverty rate by 6.2 percentage points. As Table C Seven indicates, the reductions for recipients of means-tested assistance are particularly large. For example, valuing housing assistance reduces the poverty rates for individuals in public housing and those receiving tenant-based subsidies by 26.7 and 26.9 percentage points, respectively.
As we noted in Chapter One, the effect of our housing status adjustment on the Citywide poverty rate grew markedly from 5.5 percentage points in 2010 to 6.2 percentage points in 2011. The increase reflects a 6.9 percent rise in the value of the housing status adjustment over that time period. What would have accounted for such a large increase? One possible explanation for the rise is that there was an unusual jump in the housing portion of the CEO threshold between the two years. Since the threshold caps the value of the housing adjustment, an unusually large rise in this part of the poverty threshold might explain a rise in the value of the housing adjustment and its effect on the poverty rate. However, no such jump occurred. From 2010 to 2011 the housing portion of the threshold for the reference family increased by 2.7 percent. This is smaller than the 3.4 percent increase from 2009 to 2010.
A second explanation might be found in our use of the 2011 Housing and Vacancy Survey (HVS) for our 2011 estimates. The HVS is conducted every three years by the Census Bureau. We use the 2008 HVS for imputing housing status for the 2008, 2009, and 2010 ACS. The 2011 HVS is matched with the 2011 ACS. This creates the risk that a new survey would create an abrupt shift in the distribution of housing statuses and generate a marked change in the influence of the housing status adjustment on the poverty rate. To investigate this possibility we matched the 2008 HVS to the 2011 ACS and computed the before and after housing status adjustment poverty rates. We found that there was only a 0.1 percentage point difference (6.1 percentage points compared to 6.2 percentage points) in the effect of the adjustment on the New York City poverty rate.
This suggests that the jump in the housing status adjustment effect is the result of something intrinsic to
table c sixHousing Portion of the Threshold vs. Estimated Market Rate Rent, 2011
Adjustment using Housing Portion of the Threshold
Adjustment using Estimated Market Rate
Housing Status Mean Median Mean MedianShare using Housing
Portion of the ThresholdPublic Housing $7,043 $5,827 $14,461 $12,712 81.0%Mitchell-Lama Housing $734 $779 $10,972 $9,349 85.4%Tenant-Based Subsidy $7,835 $6,967 $11,101 $10,250 63.6%Rent-Stabilized/Controlled -$1,415 -$893 $4,467 $3,051 61.4%Other Regulated $4,242 $4,987 $10,980 $11,404 75.9%No Cash Rent $11,297 $10,139 $17,731 $16,236 75.1%
Source: American Community Survey Public Use Micro Sample as augmented by CEO.Note: Data weighted by the ACS household weight.
table c seven Effect of Housing Adjustment on the Poverty Rate, 2011
Poverty Rate Based
on Total CEO Income
Poverty Rate
without Housing
Adjustment
Percentage Point
DifferenceTotal Population 21.3% 27.5% -6.2Renter
Public Housing 28.7% 55.3% -26.7Mitchell-Lama Rental 26.4% 31.8% -5.4Tenant-Based Subsidy 37.3% 64.2% -26.9Stabilized/Controlled 24.0% 29.0% -5.0Other Regulated 28.3% 46.8% -18.5Market Rate 24.6% 24.6% 0.0No Cash Rent 20.9% 38.0% -17.2Owner
Owned Free and Clear 10.0% 17.1% -7.1Paying Mortgage 12.2% 12.2% 0.0
Source: American Community Survey Public Use Micro Sample as augmented by CEO.
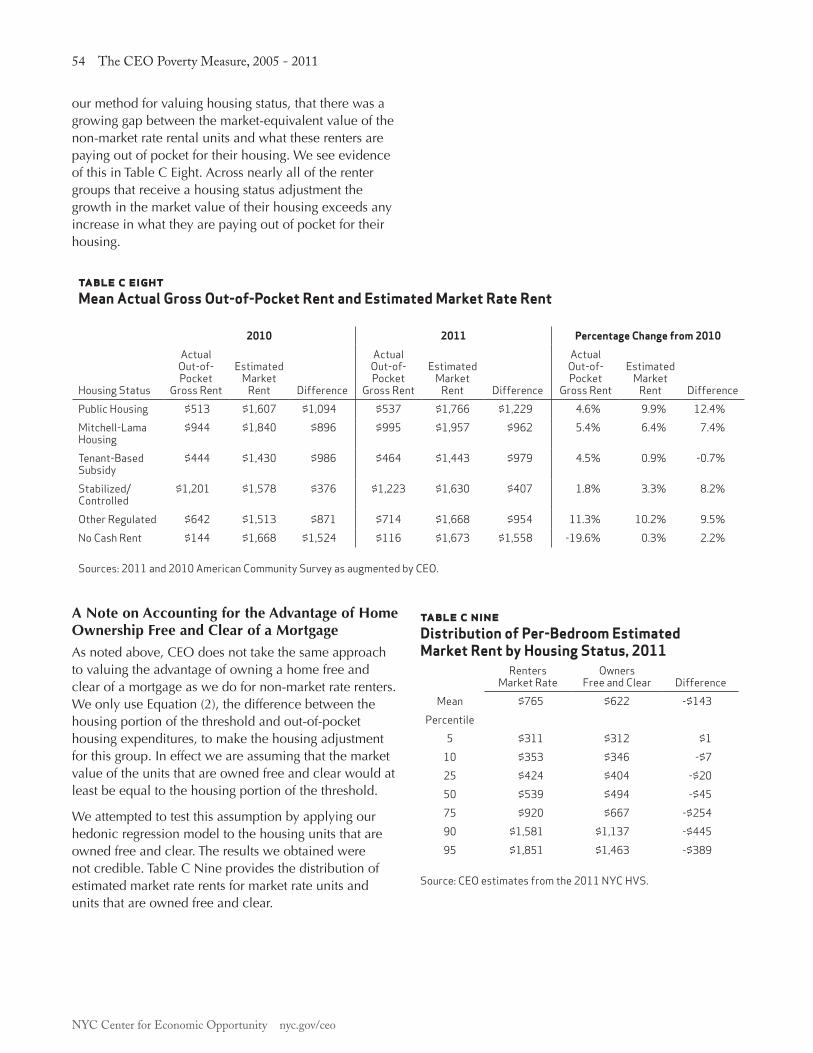
NYC Center for Economic Opportunity nyc.gov/ceo
54 The CEO Poverty Measure, 2005 - 2011
our method for valuing housing status, that there was a growing gap between the market-equivalent value of the non-market rate rental units and what these renters are paying out of pocket for their housing. We see evidence of this in Table C Eight. Across nearly all of the renter groups that receive a housing status adjustment the growth in the market value of their housing exceeds any increase in what they are paying out of pocket for their housing.
A Note on Accounting for the Advantage of Home Ownership Free and Clear of a MortgageAs noted above, CEO does not take the same approach to valuing the advantage of owning a home free and clear of a mortgage as we do for non-market rate renters. We only use Equation (2), the difference between the housing portion of the threshold and out-of-pocket housing expenditures, to make the housing adjustment for this group. In effect we are assuming that the market value of the units that are owned free and clear would at least be equal to the housing portion of the threshold.
We attempted to test this assumption by applying our hedonic regression model to the housing units that are owned free and clear. The results we obtained were not credible. Table C Nine provides the distribution of estimated market rate rents for market rate units and units that are owned free and clear.
table c nineDistribution of Per-Bedroom Estimated Market Rent by Housing Status, 2011
Renters Market Rate
Owners Free and Clear Difference
Mean $765 $622 -$143Percentile
5 $311 $312 $110 $353 $346 -$725 $424 $404 -$2050 $539 $494 -$4575 $920 $667 -$25490 $1,581 $1,137 -$44595 $1,851 $1,463 -$389
Source: CEO estimates from the 2011 NYC HVS.
table c eightMean Actual Gross Out-of-Pocket Rent and Estimated Market Rate Rent
2010 2011 Percentage Change from 2010
Housing Status
Actual Out-of-Pocket
Gross Rent
Estimated Market
Rent Difference
Actual Out-of-Pocket
Gross Rent
Estimated Market
Rent Difference
Actual Out-of-Pocket
Gross Rent
Estimated Market
Rent DifferencePublic Housing $513 $1,607 $1,094 $537 $1,766 $1,229 4.6% 9.9% 12.4%Mitchell-Lama Housing
$944 $1,840 $896 $995 $1,957 $962 5.4% 6.4% 7.4%
Tenant-Based Subsidy
$444 $1,430 $986 $464 $1,443 $979 4.5% 0.9% -0.7%
Stabilized/Controlled
$1,201 $1,578 $376 $1,223 $1,630 $407 1.8% 3.3% 8.2%
Other Regulated $642 $1,513 $871 $714 $1,668 $954 11.3% 10.2% 9.5%No Cash Rent $144 $1,668 $1,524 $116 $1,673 $1,558 -19.6% 0.3% 2.2% Sources: 2011 and 2010 American Community Survey as augmented by CEO.
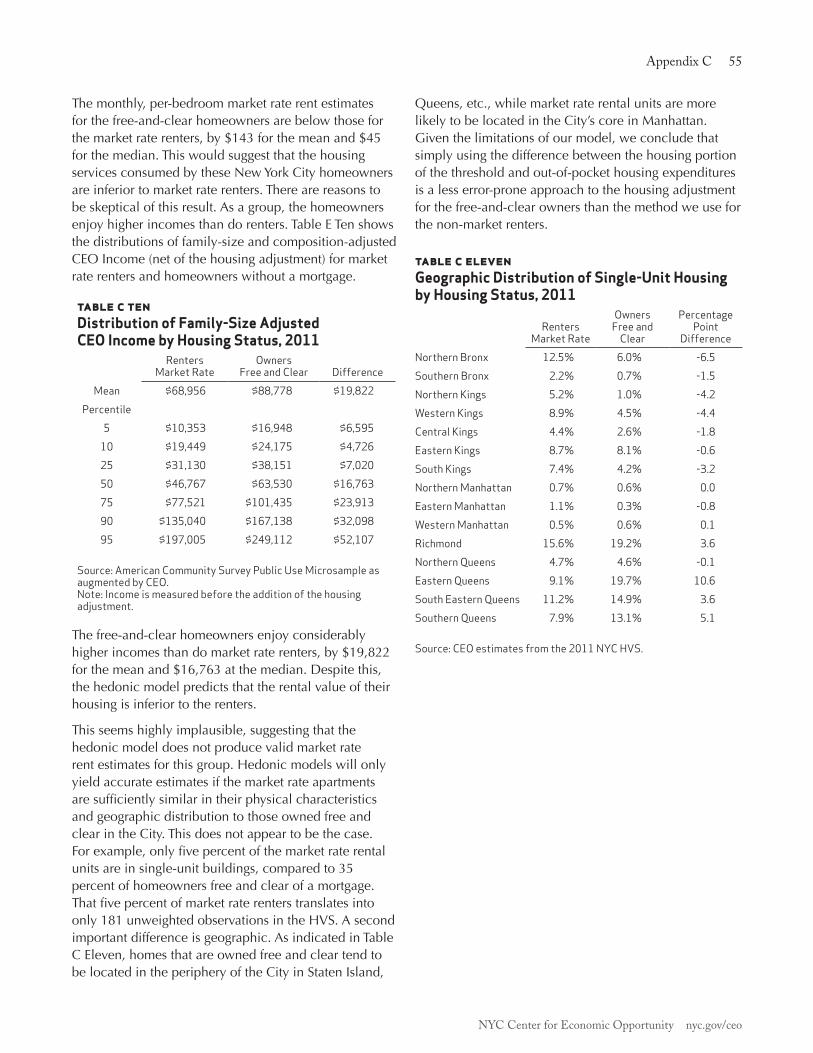
NYC Center for Economic Opportunity nyc.gov/ceo
Appendix C 55
The monthly, per-bedroom market rate rent estimates for the free-and-clear homeowners are below those for the market rate renters, by $143 for the mean and $45 for the median. This would suggest that the housing services consumed by these New York City homeowners are inferior to market rate renters. There are reasons to be skeptical of this result. As a group, the homeowners enjoy higher incomes than do renters. Table E Ten shows the distributions of family-size and composition-adjusted CEO Income (net of the housing adjustment) for market rate renters and homeowners without a mortgage.
table c tenDistribution of Family-Size Adjusted CEO Income by Housing Status, 2011
Renters Market Rate
Owners Free and Clear Difference
Mean $68,956 $88,778 $19,822Percentile
5 $10,353 $16,948 $6,59510 $19,449 $24,175 $4,72625 $31,130 $38,151 $7,02050 $46,767 $63,530 $16,76375 $77,521 $101,435 $23,91390 $135,040 $167,138 $32,09895 $197,005 $249,112 $52,107
Source: American Community Survey Public Use Microsample as augmented by CEO.Note: Income is measured before the addition of the housing adjustment.
The free-and-clear homeowners enjoy considerably higher incomes than do market rate renters, by $19,822 for the mean and $16,763 at the median. Despite this, the hedonic model predicts that the rental value of their housing is inferior to the renters.
This seems highly implausible, suggesting that the hedonic model does not produce valid market rate rent estimates for this group. Hedonic models will only yield accurate estimates if the market rate apartments are sufficiently similar in their physical characteristics and geographic distribution to those owned free and clear in the City. This does not appear to be the case. For example, only five percent of the market rate rental units are in single-unit buildings, compared to 35 percent of homeowners free and clear of a mortgage. That five percent of market rate renters translates into only 181 unweighted observations in the HVS. A second important difference is geographic. As indicated in Table C Eleven, homes that are owned free and clear tend to be located in the periphery of the City in Staten Island,
Queens, etc., while market rate rental units are more likely to be located in the City’s core in Manhattan. Given the limitations of our model, we conclude that simply using the difference between the housing portion of the threshold and out-of-pocket housing expenditures is a less error-prone approach to the housing adjustment for the free-and-clear owners than the method we use for the non-market renters.
table c elevenGeographic Distribution of Single-Unit Housing by Housing Status, 2011
Renters Market Rate
Owners Free and
Clear
PercentagePoint
DifferenceNorthern Bronx 12.5% 6.0% -6.5Southern Bronx 2.2% 0.7% -1.5Northern Kings 5.2% 1.0% -4.2Western Kings 8.9% 4.5% -4.4Central Kings 4.4% 2.6% -1.8Eastern Kings 8.7% 8.1% -0.6South Kings 7.4% 4.2% -3.2Northern Manhattan 0.7% 0.6% 0.0Eastern Manhattan 1.1% 0.3% -0.8Western Manhattan 0.5% 0.6% 0.1Richmond 15.6% 19.2% 3.6Northern Queens 4.7% 4.6% -0.1Eastern Queens 9.1% 19.7% 10.6South Eastern Queens 11.2% 14.9% 3.6Southern Queens 7.9% 13.1% 5.1 Source: CEO estimates from the 2011 NYC HVS.

NYC Center for Economic Opportunity nyc.gov/ceo
56 The CEO Poverty Measure, 2005 - 2011
Appendix d: The Ceo TAx model
The expansion of tax credits has been a key component of Federal economic stimulus programs since 2008. As a result, tax programs have become an increasingly important component of the resources available to families to meet their needs. Families with income above a minimal level incur income tax liabilities, but low-income families – especially if they have children – often find their tax credits are refundable in an amount greater than the taxes they owe. The result is that many low-income families have a negative tax rate – they receive more from the income tax system than they pay into it.
All working families are also subject to payroll taxes under the Federal Insurance Contribution Act (FICA). FICA offsets some of the gains derived from income tax credits. But even when payroll taxes are accounted for, the total tax effect on income leads to a reduction in the CEO poverty rate. The negative effect of FICA on after-tax income was reduced in 2011, the most recent year of our analysis, due to implementation of a two percentage point payroll tax cut.
The Tax Model The American Community Survey (ACS), our primary source of data, does not include information about taxes. CEO, therefore, has created a tax model. The model’s first task is to create tax filing units within the ACS’s households. Then it applies the tax code to estimate the taxes owed and tax credits received for New York City tax filers.
Creating Tax Filing UnitsACS households consist of all persons residing in the same housing unit. Within the household, each member is identified only through their relationship to the person answering the ACS questionnaire. This person is designated as the reference person and is usually, but not always, the primary owner or renter of the household. The remaining residents of the household may form a complex network of relationships. Occupants can include a family embodying several generations; families unrelated to the respondent; and one or more unrelated individuals, including roomers and boarders. Because residents are only identified in relation to the reference person, we cannot always see how they may be related to each other.
For tax purposes, this presents a challenge. We need to use the information available in the ACS to estimate how many tax returns are filed from each household, and identify who on each return is the filer (along with their spouse and dependents). CEO addresses this problem by first dividing ACS households into Minimal Household Units (MHUs) that create a richer set of information about how persons in the household are related to each other. For example, two boarders individually listed as married will be linked together, using age and other demographic characteristics. The children of unmarried partners (unless they are coded as children of the respondent) are identified in a similar manner and are then coded as the child of a specific parent.29
The tax model then identifies MHU members who are tax filers, along with their spouse or dependent(s). Additional decisions are made about allocating children and indigent household members to filers as dependents.30 Based on these decisions, each tax filer is then given a status of Married Filing Joint, Head of Household, Single, or Married Filing Separate.31
The Tax CalculatorA simulated Federal, New York State, and New York City tax return is prepared for each tax filing unit based on income and other data provided in the ACS.32 We identify adjusted gross income (AGI) for the tax unit, which is the sum of all earned income, interest income, and other income sources. Social Security income is included to the extent it is taxable. Personal exemptions and standard deductions are then subtracted from AGI to find taxable income. The Federal tax liability on that income is calculated and then – going through the steps of a Federal 1040 tax return – we compute each of the tax credits for which filers are eligible. Once the 1040
29. The MHU methodology is derived from Jeffery Passel. “Editing Family Data in Census 2000 Public-Use Microdata Samples: Creating Minimal Household Units (MHUs).” August 23, 2002. The application of Passel’s method to the CEO model is explained in Virgin, Vicky. “Creating the CEO Poverty Unit: An Evaluation Using the CPS ASEC.” June 2011. Available at: www.irp.wisc.edu/research/povmeas/ Poverty_unit_analysis_CEO_2011.pdf30. The methodology used to create tax filing units is discussed at length in NYC Center for Economic Opportunity. The CEO Poverty Measure, 2005-2008. New York, NY. Center for Economic Opportunity. 2010.31. The ACS does not provide enough information to identify widows, the other filing status used by the IRS.32. Due to a lack of data in the ACS, tax estimates for middle to higher income households are less accurate than estimates for lower income households. We do not estimate itemized deductions, capital gains, and other tax items more common to higher income returns. For this reason, we confine our analysis to filers with AGI under $50,000.

NYC Center for Economic Opportunity nyc.gov/ceo
Appendix D 57
is completed, an IT-201 New York State tax return is created, which relies on income and credit calculations from the Federal return. The IT-201 generates New York State and City tax liabilities and credits. In a final step, FICA payroll taxes are applied to all wage and salary income, and self- employment taxes are deducted from self-employment earnings.
Tax PolicyEstimates for the years 2008 to 2011 contain deductions, credits, or expansion of existing credits that were a key feature of the Bush and Obama Administrations’ economic stimulus programs. We describe these policy initiatives in detail below. Table D One lists these tax programs and notes the years they were in effect.
• Recovery Rebate Tax Credit for Individuals: A one-time tax rebate included in the Economic Stimulus Act of 2008. The credit was based on information provided in the 2007 tax return, to be paid out in 2008. The maximum payment was $600 for single filers, $1,200 for married filers, and an additional $300 per qualifying child.33
• Additional Standard Deduction for Real Estate: Passed as part of the Housing Assistance Act of 2008 and extended for 2009 by the Emergency Economic Stabilization Act of 2009. Filers who took the standard deduction (all filers in the CEO tax model) and were homeowners could claim an additional standard deduction of up to $500 ($1,000 for married filers) against their local property taxes.
• Additional Child Tax Credit: The Additional Child Tax Credit is a refundable supplement to the Child Tax Credit. Prior to passage of the Emergency Economic Stabilization Act of 2008, the credit required a minimum earned income of over $12,050 in 2008 and $12,550 in 2009. The Act lowered the income threshold to $8,500 for 2008 and reduced it again to $3,000 in 2009. The result is that more filers with lower incomes receive a refundable credit.
33. The Stimulus Act became law in early 2008, just as returns were being filed for 2007 taxes. It was paid as a tax refund, using 2007 income as an estimate for 2008 income. Filers who had already sent in a tax return could claim it retroactively, carrying their rebate into calendar year 2009. Filers whose 2008 income generated a different credit than that based on their 2007 return had to reconcile the difference in their 2008 return, filed in early 2009. We assume that all filers received the credit in calendar year 2008, at an amount based on the model’s 2008 returns. We include no rebate credit in 2009. We assume this overestimates the amount of credit that was actually awarded in 2008 and underestimates it for 2009.
• Making Work Pay Tax Credit (MWP): A credit of up to $400 ($800 for married filers). The CEO model added it as a refundable tax credit in 2009 and 2010. In 2009, the Economic Recovery Payment was deducted from the MWP for eligible recipients (see below).
• Economic Recovery Payment: A payment of $250 distributed in 2009 to recipients of Social Security or Supplemental Security Income (SSI) payments and Veterans or Railroad Retirement benefits. The ACS allows us to identify only Social Security and SSI recipients. Although not technically a tax credit, we included this payment as a tax offset.
• Expansion of the Earned Income Tax Credit (EITC): Two changes occurred in 2009. First, the maximum credit for married filers increased in an acceleration of the already ongoing elimination of the marriage penalty in the EITC. Second, a third tier of credits was added to allow filers with more than two children to claim a larger credit. The maximum possible credit for a married couple with three children was $4,824 in 2008. In 2011, the maximum credit for this family rose to $5,751.
• College Tuition Credits: The tuition credit in the CEO model combines the Lifetime Learning Credit and, prior to 2009, the Hope Credit for college students in the tax unit. In 2009 the Hope Credit was replaced by the American Opportunity Credit. The new credit is up to 40 percent refundable.
• Payroll Tax Cut: The Making Work Pay Tax Credit expired and was replaced by a two percentage point cut in the payroll (FICA) tax in 2011. For most filers in the CEO model, this represented a cut in the tax rate for the Social Security portion of FICA from 6.2 to 4.2 percent of earned income.
Other changes occurred at the State and City level.
• School Tax Relief Credit: A credit against the income tax for New York City residents and funded by New York State. The credit was reduced significantly in 2009.
• New York State and City Earned Income Credit: No legislative change was made to these credits, but they are calculated at 30.0 percent and 5.0 percent of the Federal EITC, respectively. Thus, changes at the Federal level beginning in 2009 resulted in an expansion of the State and City EITC.

NYC Center for Economic Opportunity nyc.gov/ceo
58 The CEO Poverty Measure, 2005 - 2011
Taxes in DetailThis section compares tax liabilities and tax credits from 2007 to 2011. Tables D Two and D Three divide tax filers into two groups: Panel A consists of those filers with AGI from $1 to $25,000 and Panel B consists of filers with AGI from $25,001 to $50,000. This divides filers into those who are most likely to be poor, with incomes close to or below the poverty threshold, and those filers with incomes close to or somewhat above the poverty line. The division roughly illustrates the impact of tax programs as income rises.
Major Tax ComponentsTable D Two shows the major components of the tax model. Taxable Income is Adjusted Gross Income after standard deductions and exemptions. Pre-Credit Liability is the total Federal, State, and City income tax due on Taxable Income before any credits are applied. Federal, State, and City credits are the sum of tax credits received from each level of government. The Net Income Tax Effect is the total effect of the income tax system on resources. A positive value for Net Income Tax Effect indicates that tax credit refunds are greater than the taxes owed. In other words, the tax system generates a net gain to the taxpayer. A negative number indicates a net loss to the taxpayer, since taxes paid are greater than taxes refunded. In the case of FICA, we also use a negative sign indicating that payroll taxes are a subtraction from household resources.
Table D Two shows a decline in AGI from 2008 to 2011 in both panels. This in turn generates a lower Taxable
Income and a lower Pre-Credit Liability.34 The table also shows a downward drift in the total value of tax credits received for all filers. Because credits are tied to the level of earnings, this is not surprising. The effect is compounded by the elimination of many stimulus credits by 2011, as shown in Tables D One and D Three.
Panel A of Table D Two shows that filers with AGI up to $25,000 have a positive value for their Net Income Tax Effect for each of the years shown, representing a net gain to CEO income after taxes. Prior to the expansion of tax credits in 2008, most filers in our lower income bracket had a relatively slight gain from total taxes. The Net Income Tax effect peaks in 2010.
Filers with AGI over $25,000 and up to $50,000, shown in Panel B, have an annual net loss to their household resources in all years after income taxes. This loss was greatest, $3.6 billion, in 2009, our peak wage year for this group.
In addition to income taxes, FICA (payroll taxes for Social Security and Medicare) is another piece of the total tax picture. The combined rate for both is 7.65 percent of wages, with the exception of 2011 when the combined rate was 5.65 percent.
The final line of each panel, Net Income Tax + Net FICA Effect, shows the combined effect of income and payroll taxes, including tax credits. Again, a positive number represents a net gain to the taxpayer and a negative number a net loss to the taxpayer. The greatest net gain
34. The Real Estate Standard Deduction, applicable in 2008 and 2009, is the only tax policy in our model that impacts Taxable Income and Pre-Credit Liability.
table d oneTiming of Stimulus Tax Credits, 2008 - 2011
Years in Effect
Tax/Credit 2008 2009 2010 2011Recovery Rebate Credit XAdditional Standard Deduction for Real Estate
X X
Additional Child Tax Credit Expansion (Refundable Part of Child Tax Credit)
X X X X
Making Work Pay Credit X XEconomic Recovery Payment XEITC Marriage Penalty Elimination X X XEITC Third Child Tier X X XAmerican Opportunity Credit (Refundable Tuition Credit)
X X X
Payroll Tax Cut X

NYC Center for Economic Opportunity nyc.gov/ceo
Appendix D 59
for lower income tax payers occurred in 2010. Taxpayers in the higher income panel sustained the greatest loss of income in 2007 due to combined FICA and income taxes before the stimulus credits were in effect.
Changes in each of the individual tax credits from 2008 to 2011 are detailed in Table D Three. Total Tax Relief is the sum of all credits. Table D Three illustrates the
timing of each of the Federal stimulus tax credits. The Recovery Rebate Credit, Economic Recovery Payment, Making Work Pay Credit, and Real Estate Standard Deduction all expired by 2011. In 2011 what remained of the stimulus was the expanded and partly refundable Education Credit, Earned Income Tax Credit, and Additional Child Tax Credit – in addition to the FICA tax cut. At the City level, the School Tax Credit (STAR)
table d twoComponents of Net Income Tax Effect, 2007 - 2011Total Dollar Value (in $1,000s)A. Adjusted Gross Income, $1 - $25,000
2007 2008 2009 2010 2011Percentage Change
2007-2011Adjusted Gross Income 16,036,286 15,731,659 16,865,640 15,636,576 15,620,526 -2.6%Taxable Income 4,527,177 4,227,371 4,518,635 3,976,937 3,826,554 -15.5%Pre-Credit Liability 904,764 855,792 941,983 821,874 807,557 -10.7%Federal Credits 1,310,765 1,978,182 2,132,280 2,035,463 1,764,221 34.6%State Credits 456,504 467,508 491,610 488,840 510,781 11.9%City Credits 257,107 253,949 155,999 151,107 154,534 -39.9%Net Income Tax Effect** 1,119,612 1,843,847 1,837,907 1,853,537 1,621,979 44.9%
Payroll Tax (FICA) -1,079,970 -1,049,073 -1,129,458 -1,039,471 -1,050,292† -2.7%FICA Tax Cut N.A. N.A. N.A. N.A. 228,535 N.A.
Net Income Tax + Net FICA Effect
39,642 794,774 708,449 814,066 800,222 1918.6%
B. Adjusted Gross Income, $25,001 - $50,000
2007 2008 2009 2010 2011Percentage Change
2007-2011Adjusted Gross Income 37,918,283 38,328,575 39,634,232 36,384,290 34,888,967 -8.0%Taxable Income 23,812,653 23,988,192 24,546,518 21,994,918 20,670,389 -13.2%Pre-Credit Liability 5,260,524 5,319,350 5,517,927 4,883,460 4,599,268 -12.6%Federal Credits* 785,936 1,687,474 1,507,986 1,492,909 1,078,601 37.2%State Credits 235,789 246,770 281,553 286,127 297,151 26.0%City Credits 201,610 201,101 100,932 98,177 97,800 -51.5%Net Income Tax Effect** -4,037,189 -3,184,006 -3,627,456 -3,006,246 -3,125,716 -22.6%
Payroll Tax (FICA) -2,767,443 -2,783,842 -2,880,777 -2,629,931 -2,540,607† -8.2%FICA Tax Cut N.A. N.A. N.A. N.A. 597,094 N.A.
Net Income Tax + Net FICA Effect
-6,804,632 -5,967,847 -6,508,233 -5,636,177 -5,069,229 -25.5%
Source: American Community Survey Public Use Micro Sample as augmented by CEO. * Includes Economic Recovery Payment to Social Security Recipients in 2009.**Net Income Tax differs slightly from pre-credit liability net of credits due to rounding and limits on some non-refundable credits by tax liability.†Payroll Tax in 2011 is estimated as if there were no tax cut; the tax cut is then estimated separately and included in the Net Income Tax and FICA Effect. The sign of net income tax effect indicates effect of taxes on household income.

NYC Center for Economic Opportunity nyc.gov/ceo
60 The CEO Poverty Measure, 2005 - 2011ta
ble
d th
ree
Sele
cted
Tax
Cre
dits
, 200
7 - 2
011
Tota
l Dol
lar V
alue
(in
$1,0
00s)
A
. Adj
uste
d G
ross
Inco
me
$1 -
$25,
000
Perc
enta
ge
Chan
geB.
Adj
uste
d G
ross
Inco
me
$25,
001
- $50
,000
Perc
enta
ge
Chan
geFe
dera
l20
0720
0820
0920
1020
1120
07-2
011
2007
2008
2009
2010
2011
2007
-201
1Ch
ild a
nd
Depe
nden
t Car
e Cr
edit
2,76
71,
984
2,30
51,
248
2,24
5-1
8.9%
16,2
3715
,119
17,7
9613
,460
14,7
01-9
.5%
Child
Tax C
redi
t (+
ACTC
)*15
7,01
021
6,13
233
2,65
131
9,39
633
7,16
911
4.7%
398,
617
394,
021
407,
915
390,
837
397,
920
-0.2
%
Elde
rly a
nd
Depe
nden
t Cre
dit
1,15
081
691
81,
025
1,09
6-4
.7%
00
00
0N.
A.
Educ
atio
n Cr
edit*
*32
,407
34,2
8411
4,52
711
5,11
811
5,68
725
7.0%
132,
295
149,
021
217,
178
217,
692
213,
838
61.6
%Ea
rned
Inco
me
Cred
it Fe
dera
l1,
117,
430
1,14
6,78
81,
256,
403
1,24
4,59
11,
309,
275
17.2
%23
8,78
827
5,08
437
4,43
941
5,52
845
2,14
189
.3%
Real
Est
ate
Stan
dard
De
duct
ion
N.A.
92,3
6194
,848
N.A.
N.A.
N.A.
N.A.
89,7
4096
,180
N.A.
N.A.
N.A.
Reco
very
Reb
ate
Cred
itN.
A.61
9,72
8N.
A.N.
A.N.
A.N.
A.N.
A.85
4,22
8N.
A.N.
A.N.
A.N.
A.
Econ
omic
Re
cove
ry P
aym
ent
N.A.
N.A.
98,2
67N.
A.N.
A.N.
A.N.
A.N.
A.21
,292
N.A.
N.A.
N.A.
Mak
ing W
ork
Pay
Cred
itN.
A.N.
A.36
3,56
135
6,02
4N.
A.N.
A.N.
A.N.
A.46
9,36
645
5,39
1N.
A.N.
A.
Payr
oll T
ax C
utN.
A.N.
A.N.
A.N.
A.25
1,41
1N.
A.N.
A.N.
A.N.
A.N.
A.59
7,09
4N.
A.
New
Yor
k St
ate
Hous
ehol
d Cr
edit
37,4
3236
,712
40,5
54 3
7,49
5 38
,009
1.5%
7,14
17,
016
6,19
2 6
,751
6,
830
-4.4
%Ch
ild a
nd
Depe
nden
t Car
e Cr
edit
3,04
42,
182
2,53
51,
372
2,47
0-1
8.9%
16,7
8715
,632
18,3
1013
,914
15,1
95-9
.5%
Child
Tax C
redi
t40
,690
33,8
5823
,853
20,5
8120
,797
-48.
9%89
,461
88,9
7988
,321
77,
628
79,0
48-1
1.6%
Tuiti
on C
redi
t70
,850
84,2
6787
,184
94,7
9510
1,88
143
.8%
55,4
3957
,173
60,3
5767
,642
64,9
4917
.2%
Real
Pro
pert
y Tax
Cr
edit
1,68
51,
819
1,98
31,
786
2,13
626
.8%
00
00
0N.
A.
Earn
ed In
com
e Cr
edit
NYS
318,
430
327,
168
358,
171
356
,423
37
5,10
817
.8%
66,9
6177
,969
108,
372
120
,193
13
1,12
995
.8%
New
Yor
k Ci
ty
Hous
ehol
d Cr
edit
9,73
39,
613
9,91
99,
513
9,82
91.
0%0
00
00
N.A.
Scho
ol Ta
x Cre
dit
(STA
R)23
4,55
923
1,39
210
3,79
2 1
01,7
83
104,
232
-55.
6%18
9,03
218
6,48
881
,447
77,1
3774
,567
-60.
6%
Child
and
De
pend
ent C
are
Cred
it
1,10
871
398
925
91,
038
-6.3
%63
985
976
326
462
6-2
.1%
Earn
ed In
com
e Cr
edit
NYC
55,8
7157
,339
62,8
2062
,230
65,4
6417
.2%
11,9
3913
,754
18,7
2220
,776
22,6
0789
.3%
Tota
l Tax
Rel
ief
2,08
4,16
72,
897,
157
2,95
5,28
02,
723,
638
2,73
7,84
731
.4%
1,22
3,33
52,
225,
084
1,98
6,65
11,
877,
214
2,07
0,64
669
.3%
Sour
ce: A
mer
ican
Com
mun
ity S
urve
y Pub
lic U
se M
icro
Sam
ple
as a
ugm
ente
d by
CEO
.*In
clud
es re
fund
able
add
ition
al ch
ild ta
x cre
dit.
**Co
mbi
nes A
mer
ican
Opp
ortu
nity
Cre
dit a
nd H
ope
Cred
it in
200
8; A
mer
ican
Opp
ortu
nity
Cre
dit a
nd L
ifetim
e Le
arni
ng C
redi
t in
2009
and
201
0.No
tes:
N.A.
- N
ot a
pplic
able
in th
at ta
x yea
r. Th
e su
m o
f non
refu
ndab
le cr
edits
may
be
limite
d by
tota
l tax
liab
ility
at t
he le
vel o
f ind
ivid
ual fi
lers
.

NYC Center for Economic Opportunity nyc.gov/ceo
Appendix D 61
was cut nearly in half in 2009. Only New York State tax credits continued to rise. There were no changes in State tax policy, but the State (and City) EITC grew as a function of the rise in the Federal EITC.
For lower income taxpayers in Panel A, the greatest assistance from tax credits occurred in 2009 at nearly $3 billion in total credits from Federal, State, and City sources. For the higher income group in Panel B, tax relief peaked in 2008 at over $2 billion. The most notable increases in tax credits were the changes in the Federal EITC described above and the tuition credit, which was no longer capped by tax liability and instead was made partially refundable.35
Comparing the Make Work Pay Credit to the Payroll Tax CutIn 2011 the Making Work Pay Credit was replaced with the Payroll Tax Cut. The MWP credit was designed to provide greater after tax income in 2009 and 2010. Most wage earners received the maximum allowable MWP Credit of $400 per person ($800 for married couples filing a joint return). But the lowest earning filers received less. The maximum credit only occurs when income reaches $6,451 ($12,903 if married). Below this amount, the credit phased in at a rate of 6.5 percent of income.36
35. This is solely an increase in the tuition tax credit and does not include the itemized tuition deduction. The CEO tax model does not include itemized deductions.36. Those with earnings over $75,000 ($150,000 if married) also received less. The MWP phased out to zero as incomes rose.
The Payroll Tax Cut (PTC) was not a cut in income taxes. Instead, it affected Social Security payments. The Social Security component of FICA withholding is normally 6.2 percent of wages. In 2011 this was temporarily lowered to 4.2 percent. In essence the PTC was a two percentage point tax cut on all earned income under $106,800 (the point where Social Security taxable income was capped in 2011). The maximum cut was $2,136.
For tax filers, the shift in tax programs constituted a difference between a tax credit equal to 6.5 percent of earned income, up to $400 per person, and a credit equal to two percent of earned income but not capped until income reached $106,800. For filers near the poverty threshold, the Payroll Tax Cut was less generous than the Making Work Pay Credit.
We illustrate the difference between the MWP and PTC by estimating a hypothetical MWP Credit for 2011. This allows us to use the same earnings data to compare the two tax programs. Table D Four compares the mean value of the two credits. Earned income is shown in $5,000 increments for each type of filer. For married couples, the payroll tax cut is consistently smaller until household combined income passes $45,000. Single parent households don’t benefit from the program change until income passes $20,000. Single filers need income over $25,000 to reap more benefit from the change.

NYC Center for Economic Opportunity nyc.gov/ceo
62 The CEO Poverty Measure, 2005 - 2011
Taxes and the Poverty Rate
The poverty rate would be higher in the absence of net taxation. For low income New Yorkers, payroll and income taxes are offset by tax credits large enough that the tax system creates an addition to their total resources. Table D Five illustrates the impact of taxation on the poverty rate. The table compares poverty rates that are calculated net of the tax effect to poverty rates calculated with total CEO income including a tax effect. The benefit of stimulus programs is apparent. The effect of income tax credits was consistent during the years of peak stimulus credits, 2008-2010, generating a 4.3 percentage point effect on the poverty rate in each year. This fell to a 3.6 percentage point effect by 2011. Compare this to the years 2005-2007, before the enactment of tax stimulus programs. In those years, the marginal impact of income taxes in offsetting poverty averaged 2.9 percentage
points. Chapter Five of this report provides more details on the effect of the stimulus-related credits.
Some of the income tax benefit is offset by mandatory payroll taxes. The marginal effect of FICA reduces the poverty rate on average by 2.0 percentage points from 2005 to 2011, yet taxes still have an overall positive effect on household resources. The FICA tax cut in 2011 provided some relief from the payroll tax, as shown in Tables D Two and D Three. Thus the effect of FICA on the poverty rate declines from 2.1 percentage points in 2010 to 1.8 percentage points in 2011. The net effect on the poverty rate was minimal. Measuring the combined effect of payroll and income taxes we find that taxes account for a 2.1 percent decline in the CEO poverty rate in 2011. In the absence of payroll and income tax, the CEO poverty rate of 21.3 percent in 2011 would have been 23.4 percent.
table d four Comparing a Hypothetical Make Work Pay Credit to Actual Payroll Tax Cut by Type of Filer, 2011 Bold type indicates point where payroll tax cut exceeds Making Work Pay Credit.
Mean Payment ($)
Married Filing Joint Head of Household Single Total
Earned Income ($)Making Work
Pay CreditPayroll Tax Cut
Making Work Pay Credit
Payroll Tax Cut
Making Work Pay Credit
Payroll Tax Cut
Making Work Pay Credit
Payroll Tax Cut
0-5,000 158 6 155 17 162 9 160 105,000-10000 455 132 381 122 379 135 388 13010,000-15,000 739 211 400 226 400 216 455 21815,000-20,000 800 299 399 318 400 308 484 30820,000-25,000 800 422 400 421 399 401 492 41125,000-30,000 799 498 400 511 400 493 491 499
30,000-35,000 800 605 400 618 400 602 488 60635,000-40,000 800 694 400 710 400 701 505 70240,000-45,000 800 772 400 823 400 810 508 80245,000-50,000 798 885 397 922 399 879 511 88750,000 + 754 2,838 357 1,723 343 2,009 553 2,379Total 752 1,741 373 590 369 819 488 1,055
Source: American Community Survey Public Use Micro Sample as augmented by CEO.

NYC Center for Economic Opportunity nyc.gov/ceo
Appendix D 63
table d fiveImpact of Net Taxes on Poverty Rates, 2005 - 2011 (Numbers are Percent of the Population)
2005 2006 2007 2008 2009 2010 2011
A. Poverty Rates
Total CEO Income 20.3 19.8 19.8 19.0 19.7 20.9 21.3
Net of:
Income Taxes 23.3 22.7 22.7 23.3 24.0 25.2 24.9
FICA (Payroll Taxes) 18.5 17.6 17.7 17.0 17.6 18.8 19.5
Income Taxes and FICA 21.5 20.7 20.5 21.2 21.9 22.9 23.4
B. Marginal Effects
Income Taxes -3.0 -2.9 -2.9 -4.3 -4.3 -4.3 -3.6
FICA (Payroll Taxes) 1.8 2.2 2.1 2.0 2.0 2.1 1.8
Income Taxes and FICA -1.2 -0.9 -0.7 -2.2 -2.2 -2.1 -2.1 Source: American Community Survey Public Use Micro Sample as augmented by CEO.

NYC Center for Economic Opportunity nyc.gov/ceo
64 The CEO Poverty Measure, 2005 - 2011
Appendix e: esTimATing The vAlUe of nUTriTionAl AssisTAnCe
Food StampsData in the American Community Survey (ACS) about Food Stamp participation are very limited. First, as of 2008, the ACS only indicates whether a member of a household received Food Stamps at any time in the prior 12 months, providing no information on the value or duration of the benefit.37 This must be estimated. CEO’s decision to make use of New York City administrative data as its source for imputing the value of Food Stamps received leads to a second problem: Food Stamp participation in the ACS is reported at the household level, which differs from a typical Food Stamp case. A household is comprised of persons who share residence in a housing unit. A Food Stamp case, in contrast, includes household members who purchase and prepare food in common. The distinction shows up clearly in the data. In 2011, for example, the average New York City Food Stamp case had 1.85 members, while the average ACS household reporting Food Stamp receipt had 2.99 members. A third problem is underreporting of program participation.
CEO’s method for imputing the yearly value of Food Stamps thus entails three steps: 1) creating Food Stamp units within ACS household units; 2) estimating the value of yearly Food Stamp receipt; and 3) adjusting the number of Food Stamp cases created in the ACS data to correct for underreporting.
To create commensurable units, CEO developed a program to divide ACS households into the maximum number of “Food Stamp units” that the program rules allow. The Supplemental Nutrition Assistance Program (SNAP) uses the following rules to determine who in a household must be in the same Food Stamp case:
37. The decision to drop the question about the value of Food Stamps received was influenced by the Census Bureau’s testing of the ACS questionnaire, which revealed that respondents were more likely to indicate receipt of the benefit if the follow-up question about the value of the benefit did not appear in the survey instrument. See: www.census.gov/acs/www/Downloads/methodology/content_test/H6_Food_Stamps.pdf
1. Spouses.
2. Parents and children under 22, including spouses of these children, and grandchildren.
3. A child under 18 living with, and under the parental control of, an adult that provides 50 percent or more of the minor child’s support.
4. Anyone else in the household that purchases and prepares food together.
The first three of these rules are based on relationships within the household. Some of these are readily described by variables in the ACS. Others are not and must be created. To construct these relationships, we used the minimal household unit (MHU) program, which was originally written by Jeff Passel, Senior Demographer at the Pew Hispanic Center. The MHU program is designed to parse an ACS household into its smallest family units.38 The program loops through the data, linking individuals within the household by kinship and marriage. This work creates Food Stamp units that conform to the first three rules listed above.
Because CEO does not attempt to infer who else in the household is purchasing and preparing food together, the program creates the maximum number of Food Stamp units within each household allowable under SNAP rules. The size and composition of the Food Stamp cases produced with this method accurately reproduce that of the cases in the administrative data. In 2011, for example, the proportion of single-person Food Stamp cases created in the ACS (57.4 percent) is quite close to the proportion of single-person cases in the administrative data (56.7 percent). Using the Food Stamp unit rather than the ACS household also increases the estimated number of Food Stamp cases in the 2011 ACS from 620,132 (55 percent of the administrative total) to 954,310 (85 percent of the administrative total).
38. Passel, Jeffrey. “Editing Family Data in Census 2000 Public-Use Microdata Samples: Creating Minimal Household Units (MHUs).” August 2002.

NYC Center for Economic Opportunity nyc.gov/ceo
Appendix E 65
Once commensurable units are created, we begin the Food Stamp value estimation process by compiling administrative data on Food Stamp cases in New York City from the Human Resources Administration’s internal database. The data includes all cases in New York City that were active for any period between July and June of the appropriate year. This period is chosen because it represents the mid-point in the ACS rolling sample, helping to ensure that the administrative data is comparable to the ACS data. To preserve comparability with our poverty universe, individuals in group quarters are removed from both the administrative data and the ACS sample.
The administrative data set contains demographic information about the Food Stamp case heads and families, as well as relevant budget information such as household income. For each case, we sum the total of Food Stamp payments over the previous year. Using this data, we developed a regression model using the demographic characteristics present in both the administrative and ACS data sets in order to predict the yearly value of Food Stamp payments to families in New York City.
We focus on variables that are strongly predictive of Food Stamp benefits and for which high quality data exists in both the ACS and administrative data sets. Case size is, unsurprisingly, the strongest predictor of benefit level. Further, the number of children, and the dummy variables for elderly case head and elderly or disabled member in the case are also predictive of the benefit
level. This is likely due to the fact that it is easier for these groups to remain on Food Stamps longer since they are not subject to work requirements. Age of the case head is included as a proxy for factors such as work status.39 The coefficient on the age of the case head is positive in all four years, even controlling for elderly status. This may be because the probability of employment among low-income New Yorkers declines after age 50, which would lead to an increasing benefit with age in the administrative data that is independent of elderly status.
The ACS and administrative data are constructed differently and are utilized for very different purposes, a fact that complicates the development of a regression model. This is a particular issue with regard to measuring income, an important determinant of benefit levels. While the ACS reports yearly cash income from all sources, the administrative data only contain the monthly income reported on the Food Stamp application. This creates two challenges. First, families often apply for Food Stamps after an income shock, such as a job loss, yielding a potentially biased estimate of the family’s income over the past year. Second, Food Stamp applicants are allowed to make deductions from their gross income to qualify for the program, further complicating comparisons of the two variables.
39. While the New York City administrative database does contain information on work status of Food Stamp recipients, this data is generally low quality and contains large numbers of missing observations. As a result, we decided to use the age proxy in the regression model.
table e one Percentage Distribution of Food Stamp Cases by Size, 2011
ACS Households CEO Food Stamp Units Administrative Cases
Size Frequency Percent Frequency Percent Frequency Percent1 168,078 27.1% 547,456 57.4% 635,229 56.7%
2 129,641 20.9% 165,872 17.4% 230,933 20.6%
3 105,170 17.0% 103,665 10.9% 133,215 11.9%
4 98,747 15.9% 76,410 8.0% 70,536 6.3%
5 56,357 9.1% 34,143 3.6% 29,283 2.6%
6 31,654 5.1% 13,810 1.4% 11,561 1.0%
7 15,612 2.5% 6,721 0.7% 4,739 0.4%
8 6,902 1.1% 2,683 0.3% 2,531 0.2%
9 3,488 0.6% 1,597 0.2% 1,356 0.1%
10 or More 4,483 0.7% 1,953 0.4% 1,481 0.1%
Total 620,132 100.0% 954,310 100.0% 1,120,864 100.0% Sources: American Community Survey Public Use Micro Sample as augmented by CEO and New York City Human Resources Administration.

NYC Center for Economic Opportunity nyc.gov/ceo
66 The CEO Poverty Measure, 2005 - 2011
In order to address this comparability issue, we construct a net income measure in the ACS that represents an estimate of what a Food Stamp unit would report on a Food Stamp application. We aggregate personal income to the Food Stamp unit and divide it by 12 to get a monthly estimate. We then apply the various income deductions allowed on the Food Stamp application, including a standard deduction and deductions for childcare expenses and medical expenses for elderly applicants.
This constructed net income measure has a similar distribution to that of the income reported in the administrative data, with positive values beginning at the 75th percentile. Given the highly skewed nature of this distribution, where most observations have a value of zero, we feel that a linear model would produce incoherent results. Instead, we convert the income data into a categorical variable with three categories: 1) income between zero and the 74th percentile; 2) income between the 75th and 89th percentile; and 3) income at or above the 90th percentile. We tested numerous
regression specifications, evaluating them on the basis of fit. The final model is generally consistent over the years 2005-2011.
As noted above, the ACS contains data on whether a household received Food Stamps for some period over the previous year, but does not contain data on how many months the household participated in the program. This is, potentially, a source of unexplained variation, as a household receiving Food Stamps for six months will have a lower yearly value than a household receiving them for the full year, holding other factors constant. However, using a model that cannot include a months-of-receipt variable is justified for two reasons. First, the variables included in regression correlate with the months-of-receipt variable in the administrative sample. As a result, a good deal of the variation in the months-of-receipt variable is captured by the coefficients in the included variables. Second, since this model is used for prediction rather than inference, we are less concerned with potential omitted variable bias in the individual coefficients.
table e two Regression Model of Yearly Food Stamp Value, 2005 - 2011
Variable 2005 2006 2007 2008 2009 2010 2011
Intercept -352.64[-6.93]
-473.88[-9.15]
-538.12[-10.94]
-498.71[-10.16]
-514.70[-11.41]
-483.60[-8.80]
-779.10[-16.00]
Income between 75-89th Percentile
-179.44[-10.12]
-117.88[-6.35]
-166.38[-8.93]
-162.43[-8.19]
-478.60[-27.41]
-120.73[-6.05]
-176.30[-11.53]
Income at or above 90th Percentile
-950.89[-46.10]
-899.14[-43.01]
-784.82[-39.51]
-842.82[-39.76]
-1342.00[-61.51]
-874.46[-35.36]
-1222.00[-55.82]
Household Size 860.69[103.83]
874.84[102.70]
834.70[100.75]
846.46[53.45]
1010.00[67.35]
1051.50[64.28]
1239.00[85.37]
Number of Children 108.16[14.86]
120.69[16.00]
162.44[21.69]
144.07[11.23]
170.00[14.21]
137.54[10.49]
130.80[11.43]
Elderly Household Head
70.34[2.51]
101.11[3.47]
98.76[3.55]
120.36[3.93]
118.90[3.75]
140.63[4.10]
43.44[1.45]
Elderly or Disabled Person in Unit
101.34[6.04]
91.31[5.27]
189.05[11.14]
194.13[10.91]
372.00[21.67]
312.45[16.23]
509.70[29.40]
Age of Household Head
15.61[7.61]
22.47[10.53]
23.36[11.59]
24.60[11.51]
27.46[13.30]
35.23[14.82]
35.18[16.88]
Age of Household Head Squared
-0.10[-4.57]
-0.16[-7.16]
-0.16[-7.57]
-0.17[-7.59]
-0.22[-9.49]
-0.27[-10.63]
-0.25[-11.55]
R2 0.588 0.583 0.562 0.553 0.594 0.530 0.593 Source: New York City Human Resources Administration.Notes: The dependent variable is the annual value of Food Stamps. “Income” is net of deductions allowable by Food Stamp program rules. t-statistics in brackets.

NYC Center for Economic Opportunity nyc.gov/ceo
Appendix E 67
We then match the administrative data into the ACS through a predictive mean match (PMM).40 First, we use the regression coefficients to estimate Food Stamp values for observations in the ACS and in the administrative data. These ACS and administrative values are then matched using a nearest neighbor algorithm, whereby an ACS case would be matched with the administrative case with the closest estimated value, with the added constraint that both the host and donor cases are in the same Community District.41 This additional match criterion is designed to capture neighborhood effects that were not explicitly in the model. The ACS case was then given the actual Food Stamp value from the administrative case. Once an administrative case donates its value to an ACS case, it is removed from the donor pool.
The advantage of using PMM rather than simply using the estimated values is that PMM does a better job at preserving the actual distribution of Food Stamp values. Regression estimates accurately capture the mean and aggregate values of the distribution, but yield considerably less variation than seen in the administrative data. This is unsurprising, given the fact that regressions are designed to model means rather than full distributions.
Given the gap between the number of Food Stamp cases in the administrative data and the number of cases in the ACS households reporting Food Stamp receipt, CEO decided to assign participation in the Food Stamp
40. See O’Donnell, Sharon and Rodney Beard, “Imputing Medical Out-of-Pocket (MOOP) Expenditures using SIPP and MEPS,” 2009, for an application of this method in a similar context.41. The ACS’s public use micro sample areas are constructed to match New York City’s Community Districts.
program to some of the apparently eligible units that did not report receipt. There are several possible reasons for not reporting receipt. Unfortunately, none of these factors are directly measureable in the ACS, which limits our ability to model underreporting of participation.
What is known is that Food Stamp participation is highly correlated with participation in other income support programs, such as Public Assistance (PA) and Supplemental Security Income (SSI). Analysis of administrative data shows that nearly all participants in means-tested cash benefit programs also receive Food Stamps. We assign Food Stamp values to individuals who were eligible for Food Stamps and reported PA or SSI receipt, but did not report Food Stamp receipt.42 Adding these cases increased the number of Food Stamp units from 954,310 to 1,046,968 in 2011.
The CEO Food Stamp estimates of the trends in Food Stamp receipt from 2005 to 2011 are reported in Figure E One. They come close to replicating the observed trends in the administrative data, but do not do so exactly. Specifically, while the administrative data shows a consistent upward trend over these years, the CEO estimates show a decrease in cases and aggregate value from 2006 to 2007, which interrupts the overall pattern of increases. This is likely the result of sampling variability in the ACS. Additionally, the CEO estimates show a larger spike in the number of cases between 2007 and 2008 than seen in the administrative data. This may be a result of the change in the question regarding Food Stamps in the 2008 ACS survey, described above.
42. “Eligible” is defined using the SNAP program rules, requiring that the recipient be a citizen or legal resident for five years or more with a gross income less than 130 percent of the official poverty line.
table e three Comparison of Self-Reported and Estimated Food Stamp Values, 2011
Cases Individuals Aggregate Value
Number Ratio Number Ratio Number Ratio
ACS Households, Self-Reported Participation
620,132 0.55 1,853,371 0.89 N.A. N.A.
CEO Food Stamp Units, Self-Reported Participation, Estimated Value
954,310 0.85 1,853,371 0.89 $2,716,464,386 0.94
CEO Food Stamp Units, Estimated Value, Case Adjusted
1,046,968 0.93 2,003,726 0.97 $2,862,232,366 0.99
Administrative 1,120,864 1.00 2,076,255 1.00 $2,904,360,178 1.00 Sources: American Community Survey Public Use Micro Sample as augmented by CEO and New York City Human Resources Administration. Note: “Ratio” compares the estimated value to administrative data.N.A. - Not applicable due to the fact that the unadjusted ACS does not contain data on the value of the Food Stamp benefit.
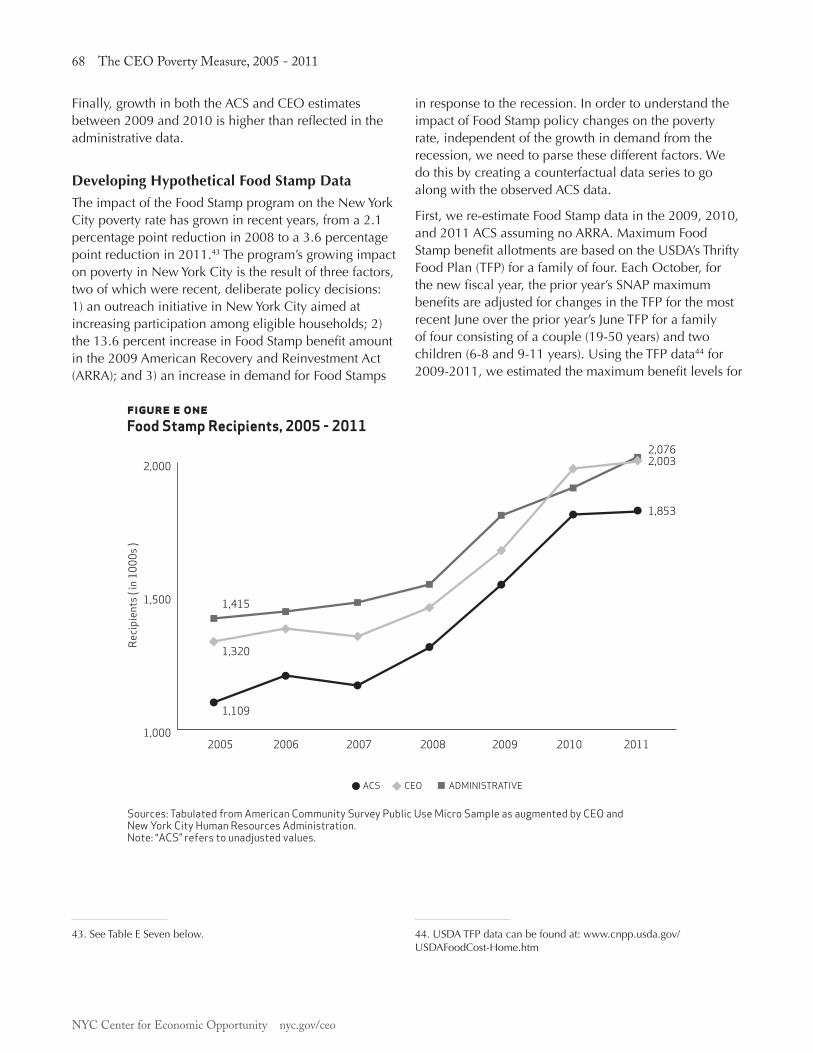
NYC Center for Economic Opportunity nyc.gov/ceo
68 The CEO Poverty Measure, 2005 - 2011
Finally, growth in both the ACS and CEO estimates between 2009 and 2010 is higher than reflected in the administrative data.
Developing Hypothetical Food Stamp DataThe impact of the Food Stamp program on the New York City poverty rate has grown in recent years, from a 2.1 percentage point reduction in 2008 to a 3.6 percentage point reduction in 2011.43 The program’s growing impact on poverty in New York City is the result of three factors, two of which were recent, deliberate policy decisions: 1) an outreach initiative in New York City aimed at increasing participation among eligible households; 2) the 13.6 percent increase in Food Stamp benefit amount in the 2009 American Recovery and Reinvestment Act (ARRA); and 3) an increase in demand for Food Stamps
43. See Table E Seven below.
in response to the recession. In order to understand the impact of Food Stamp policy changes on the poverty rate, independent of the growth in demand from the recession, we need to parse these different factors. We do this by creating a counterfactual data series to go along with the observed ACS data.
First, we re-estimate Food Stamp data in the 2009, 2010, and 2011 ACS assuming no ARRA. Maximum Food Stamp benefit allotments are based on the USDA’s Thrifty Food Plan (TFP) for a family of four. Each October, for the new fiscal year, the prior year’s SNAP maximum benefits are adjusted for changes in the TFP for the most recent June over the prior year’s June TFP for a family of four consisting of a couple (19-50 years) and two children (6-8 and 9-11 years). Using the TFP data44 for 2009-2011, we estimated the maximum benefit levels for
44. USDA TFP data can be found at: www.cnpp.usda.gov/USDAFoodCost-Home.htm
figure e oneFood Stamp Recipients, 2005 - 2011
ACS CEO ADMINISTRATIVE
1,000
1,500
2,000
2005
1,415
2,0032,076
1,853
1,320
1,109
2006 2007 2008 2009 2010 2011
Reci
pien
ts ( i
n 10
00s )
Sources: Tabulated from American Community Survey Public Use Micro Sample as augmented by CEO and New York City Human Resources Administration.Note: “ACS” refers to unadjusted values.

NYC Center for Economic Opportunity nyc.gov/ceo
Appendix E 69
these years in the absence of the ARRA. We estimate that the maximum Food Stamp allotments would have been 12.0 percent lower in 2009, 12.8 percent lower in 2010, and 12.9 percent lower in 2011 without the ARRA.45 We used these estimates to deflate the Food Stamp data in these three years. The mean Food Stamp values (per Food Stamp units) are shown in Table E Four.
table e fourMean Food Stamp Value per Food Stamp Unit, 2009 - 2011
2009 2010 2011
CEO Estimate $2,391 $2,774 $2,840Hypothetical $2,009 $2,406 $2,472
Percentage Difference 16.0% 13.3% 13.0% Source: American Community Survey Public Use Micro Sample as augmented by CEO.
Second, we look at the role of local policy in expanding Food Stamp participation, independent of the impact of the recession. In order to assess the role of local policy, we decompose the growth in Food Stamp cases into two components: increased demand resulting from the recession and increased “supply” from the local outreach campaign. We do so by compiling data on monthly Food Stamp caseloads and monthly payroll employment (seasonally adjusted) for New York City from June 1999 to December 2011. Using this data, we develop a time-series regression model that estimates the relationship between Food Stamp caseloads and labor market conditions. The results of the regression are shown in Table E Five following.
45. In the absence of the ARRA, SNAP benefits for each fiscal year are based on the Thrifty Food Plan for June of the prior year. Since there was a slight decline in food prices from 2008 to 2009 and 2009 to 2010, the maximum benefit levels would have declined as well. This decline leads to a growing difference between the benefit levels with and without the ARRA over this period.
table e fiveRegression Model of Food Stamp Caseload and Employment
Variable Estimate
Intercept 0.002[2.34]
Food Stamp Caseload Growth Rate (lagged one month)
0.329[4.11]
Food Stamp Caseload Growth Rate (lagged two months)
0.294[3.72]
Payroll Employment Growth Rate (lagged one month)
-0.426[-1.88]
Payroll Employment Growth Rate (lagged two months)
0.266[1.17]
N R2
1480.307
Sources: New York City Human Resources Administration and U.S. Bureau of Labor Statistics.Notes: t-statistics in brackets.Data covers the period June 1999 - December 2011.The dependent variable is the month-over-month growth rate in the Food Stamp caseload.
Using this model, we construct predicted values for the growth rate of the Food Stamp caseload, based on the lagged value of the growth in payroll employment and keeping the other factors constant. This data represents a counterfactual series that approximates the growth of caseloads based solely on the employment situation in New York City, absent the outreach effort and increase in benefit level. This alternative scenario yields caseloads 2.5 percent lower than the observed data in 2008, 4.2 percent lower in 2009, 5.6 percent lower in 2010, and 5.3 percent lower in 2011, as is shown in Table E Six below.
table e sixNumber of Food Stamp Cases, 2008 - 2011
2008 2009 2010 2011
CEO Estimate 771,225 873,127 1,025,575 1,046,968
Hypothetical 751,974 836,576 968,153 991,639
Percentage Difference 2.5% 4.2% 5.6% 5.3%
Source: American Community Survey Public Use Micro Sample as augmented by CEO.
The ARRA benefit increase and the Food Stamp outreach initiative had a noticeable impact on the poverty rate in 2009-2011, though not in 2008. Table E Seven shows the total impact of Food Stamps on the poverty rate, as well as the specific impact of Food Stamp policies. These policies lowered the poverty rate by 0.4 percentage points in 2009, and by 0.7 and 0.6 percentage points in 2010 and 2011, respectively.
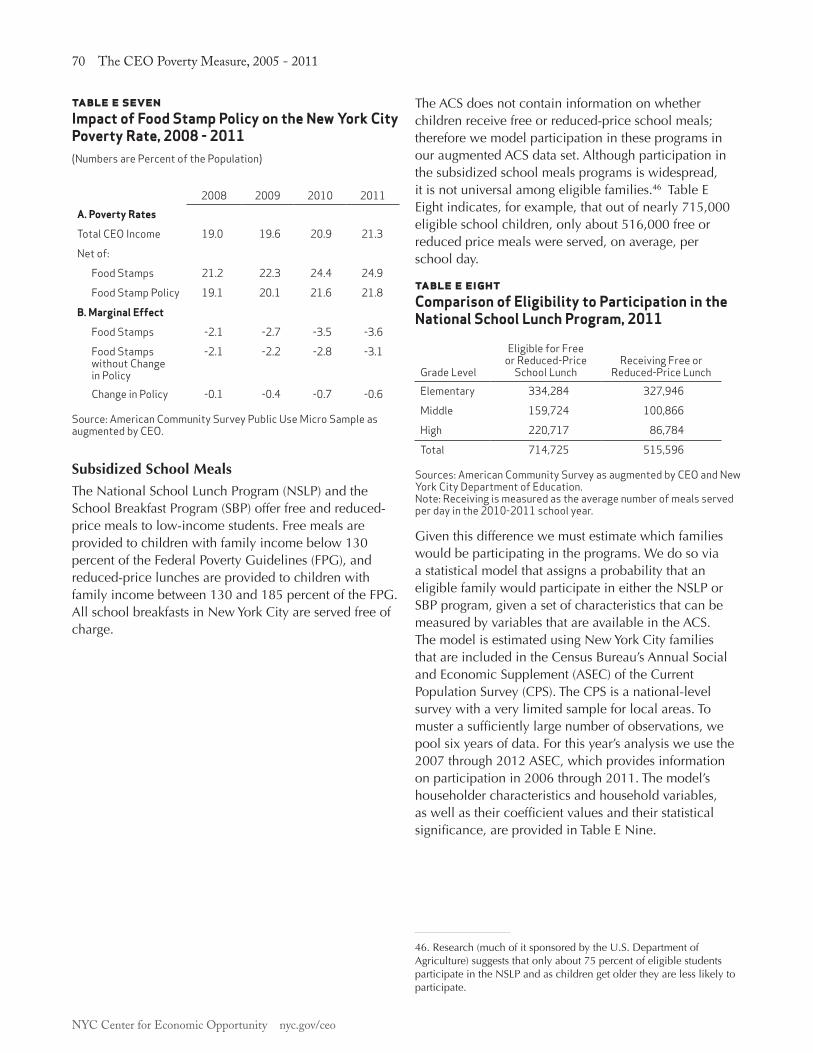
NYC Center for Economic Opportunity nyc.gov/ceo
70 The CEO Poverty Measure, 2005 - 2011
table e sevenImpact of Food Stamp Policy on the New York City Poverty Rate, 2008 - 2011(Numbers are Percent of the Population)
2008 2009 2010 2011A. Poverty Rates
Total CEO Income 19.0 19.6 20.9 21.3
Net of:
Food Stamps 21.2 22.3 24.4 24.9
Food Stamp Policy 19.1 20.1 21.6 21.8
B. Marginal Effect
Food Stamps -2.1 -2.7 -3.5 -3.6
Food Stamps without Change in Policy
-2.1 -2.2 -2.8 -3.1
Change in Policy -0.1 -0.4 -0.7 -0.6 Source: American Community Survey Public Use Micro Sample as augmented by CEO.
Subsidized School MealsThe National School Lunch Program (NSLP) and the School Breakfast Program (SBP) offer free and reduced-price meals to low-income students. Free meals are provided to children with family income below 130 percent of the Federal Poverty Guidelines (FPG), and reduced-price lunches are provided to children with family income between 130 and 185 percent of the FPG. All school breakfasts in New York City are served free of charge.
The ACS does not contain information on whether children receive free or reduced-price school meals; therefore we model participation in these programs in our augmented ACS data set. Although participation in the subsidized school meals programs is widespread, it is not universal among eligible families.46 Table E Eight indicates, for example, that out of nearly 715,000 eligible school children, only about 516,000 free or reduced price meals were served, on average, per school day.
table e eightComparison of Eligibility to Participation in the National School Lunch Program, 2011
Grade Level
Eligible for Free or Reduced-Price
School Lunch Receiving Free or
Reduced-Price LunchElementary 334,284 327,946
Middle 159,724 100,866
High 220,717 86,784
Total 714,725 515,596 Sources: American Community Survey as augmented by CEO and New York City Department of Education. Note: Receiving is measured as the average number of meals served per day in the 2010-2011 school year.
Given this difference we must estimate which families would be participating in the programs. We do so via a statistical model that assigns a probability that an eligible family would participate in either the NSLP or SBP program, given a set of characteristics that can be measured by variables that are available in the ACS. The model is estimated using New York City families that are included in the Census Bureau’s Annual Social and Economic Supplement (ASEC) of the Current Population Survey (CPS). The CPS is a national-level survey with a very limited sample for local areas. To muster a sufficiently large number of observations, we pool six years of data. For this year’s analysis we use the 2007 through 2012 ASEC, which provides information on participation in 2006 through 2011. The model’s householder characteristics and household variables, as well as their coefficient values and their statistical significance, are provided in Table E Nine.
46. Research (much of it sponsored by the U.S. Department of Agriculture) suggests that only about 75 percent of eligible students participate in the NSLP and as children get older they are less likely to participate.
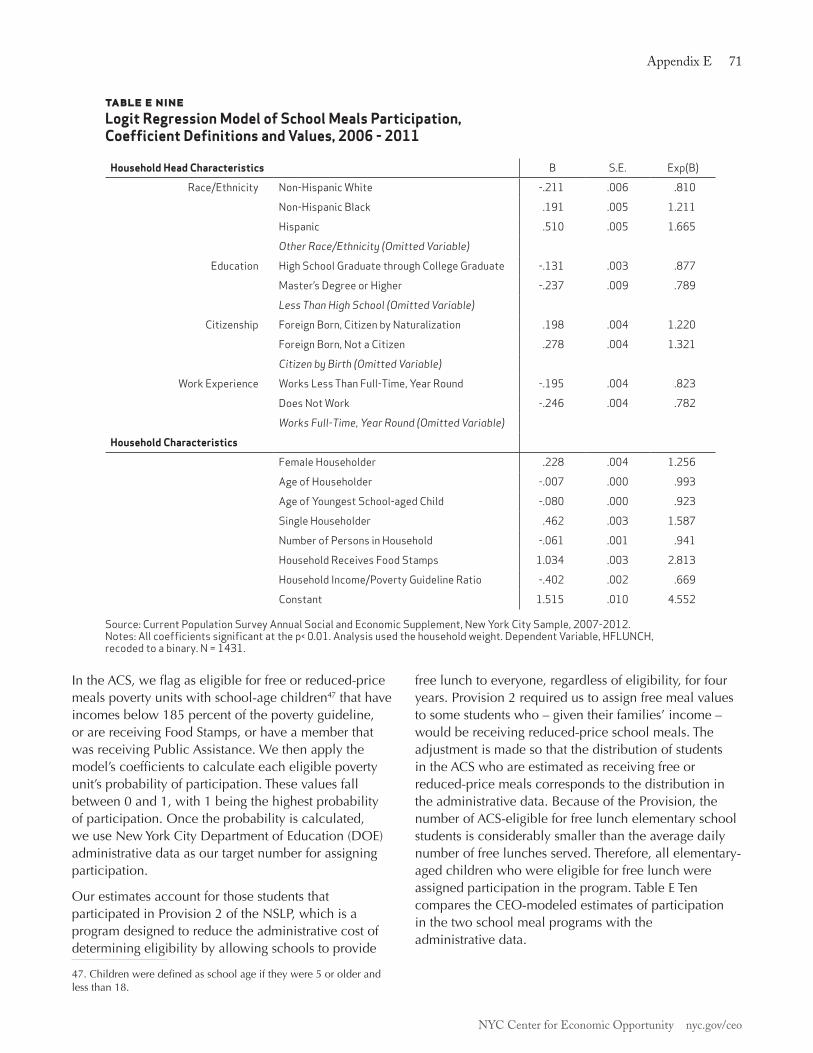
NYC Center for Economic Opportunity nyc.gov/ceo
Appendix E 71
In the ACS, we flag as eligible for free or reduced-price meals poverty units with school-age children47 that have incomes below 185 percent of the poverty guideline, or are receiving Food Stamps, or have a member that was receiving Public Assistance. We then apply the model’s coefficients to calculate each eligible poverty unit’s probability of participation. These values fall between 0 and 1, with 1 being the highest probability of participation. Once the probability is calculated, we use New York City Department of Education (DOE) administrative data as our target number for assigning participation.
Our estimates account for those students that participated in Provision 2 of the NSLP, which is a program designed to reduce the administrative cost of determining eligibility by allowing schools to provide
47. Children were defined as school age if they were 5 or older and less than 18.
free lunch to everyone, regardless of eligibility, for four years. Provision 2 required us to assign free meal values to some students who – given their families’ income – would be receiving reduced-price school meals. The adjustment is made so that the distribution of students in the ACS who are estimated as receiving free or reduced-price meals corresponds to the distribution in the administrative data. Because of the Provision, the number of ACS-eligible for free lunch elementary school students is considerably smaller than the average daily number of free lunches served. Therefore, all elementary-aged children who were eligible for free lunch were assigned participation in the program. Table E Ten compares the CEO-modeled estimates of participation in the two school meal programs with the administrative data.
table e nineLogit Regression Model of School Meals Participation, Coefficient Definitions and Values, 2006 - 2011
Household Head Characteristics B S.E. Exp(B)
Race/Ethnicity Non-Hispanic White -.211 .006 .810
Non-Hispanic Black .191 .005 1.211
Hispanic .510 .005 1.665
Other Race/Ethnicity (Omitted Variable)
Education High School Graduate through College Graduate -.131 .003 .877
Master’s Degree or Higher -.237 .009 .789
Less Than High School (Omitted Variable)
Citizenship Foreign Born, Citizen by Naturalization .198 .004 1.220
Foreign Born, Not a Citizen .278 .004 1.321
Citizen by Birth (Omitted Variable)
Work Experience Works Less Than Full-Time, Year Round -.195 .004 .823
Does Not Work -.246 .004 .782
Works Full-Time, Year Round (Omitted Variable)
Household Characteristics
Female Householder .228 .004 1.256
Age of Householder -.007 .000 .993
Age of Youngest School-aged Child -.080 .000 .923
Single Householder .462 .003 1.587
Number of Persons in Household -.061 .001 .941
Household Receives Food Stamps 1.034 .003 2.813
Household Income/Poverty Guideline Ratio -.402 .002 .669
Constant 1.515 .010 4.552 Source: Current Population Survey Annual Social and Economic Supplement, New York City Sample, 2007-2012.Notes: All coefficients significant at the p< 0.01. Analysis used the household weight. Dependent Variable, HFLUNCH, recoded to a binary. N = 1431.
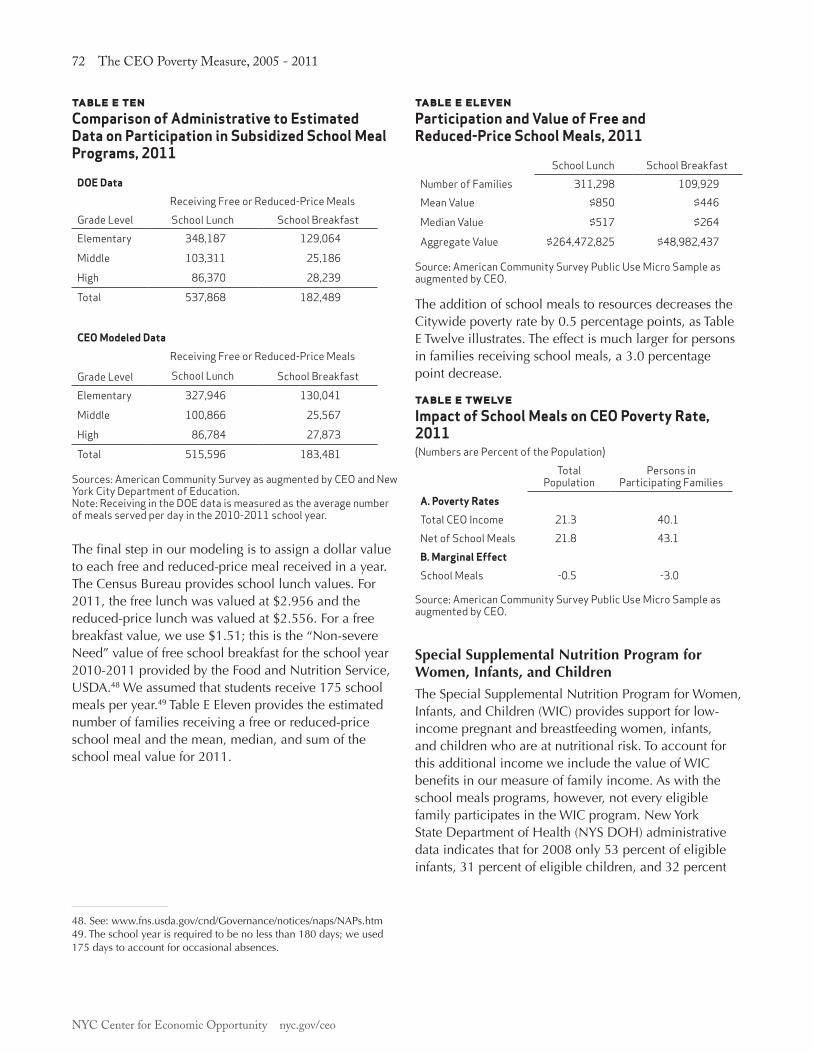
NYC Center for Economic Opportunity nyc.gov/ceo
72 The CEO Poverty Measure, 2005 - 2011
table e tenComparison of Administrative to Estimated Data on Participation in Subsidized School Meal Programs, 2011
DOE Data
Receiving Free or Reduced-Price MealsGrade Level School Lunch School BreakfastElementary 348,187 129,064
Middle 103,311 25,186
High 86,370 28,239
Total 537,868 182,489
CEO Modeled Data
Receiving Free or Reduced-Price Meals
Grade Level School Lunch School BreakfastElementary 327,946 130,041
Middle 100,866 25,567
High 86,784 27,873
Total 515,596 183,481 Sources: American Community Survey as augmented by CEO and New York City Department of Education.Note: Receiving in the DOE data is measured as the average number of meals served per day in the 2010-2011 school year. The final step in our modeling is to assign a dollar value to each free and reduced-price meal received in a year. The Census Bureau provides school lunch values. For 2011, the free lunch was valued at $2.956 and the reduced-price lunch was valued at $2.556. For a free breakfast value, we use $1.51; this is the “Non-severe Need” value of free school breakfast for the school year 2010-2011 provided by the Food and Nutrition Service, USDA.48 We assumed that students receive 175 school meals per year.49 Table E Eleven provides the estimated number of families receiving a free or reduced-price school meal and the mean, median, and sum of the school meal value for 2011.
48. See: www.fns.usda.gov/cnd/Governance/notices/naps/NAPs.htm 49. The school year is required to be no less than 180 days; we used 175 days to account for occasional absences.
table e elevenParticipation and Value of Free and Reduced-Price School Meals, 2011
School Lunch School BreakfastNumber of Families 311,298 109,929Mean Value $850 $446
Median Value $517 $264
Aggregate Value $264,472,825 $48,982,437 Source: American Community Survey Public Use Micro Sample as augmented by CEO.
The addition of school meals to resources decreases the Citywide poverty rate by 0.5 percentage points, as Table E Twelve illustrates. The effect is much larger for persons in families receiving school meals, a 3.0 percentage point decrease.
table e twelve Impact of School Meals on CEO Poverty Rate, 2011 (Numbers are Percent of the Population)
Total Population
Persons in Participating Families
A. Poverty Rates
Total CEO Income 21.3 40.1Net of School Meals 21.8 43.1B. Marginal Effect
School Meals -0.5 -3.0 Source: American Community Survey Public Use Micro Sample as augmented by CEO.
Special Supplemental Nutrition Program for Women, Infants, and ChildrenThe Special Supplemental Nutrition Program for Women, Infants, and Children (WIC) provides support for low-income pregnant and breastfeeding women, infants, and children who are at nutritional risk. To account for this additional income we include the value of WIC benefits in our measure of family income. As with the school meals programs, however, not every eligible family participates in the WIC program. New York State Department of Health (NYS DOH) administrative data indicates that for 2008 only 53 percent of eligible infants, 31 percent of eligible children, and 32 percent

NYC Center for Economic Opportunity nyc.gov/ceo
Appendix E 73
of eligible women participated.50 To account for this, we model participation with a similar statistical match to the one used to model school meal participation.
The model is based on characteristics of WIC-eligible households which are common and consistently defined in the ASEC and the ACS assigns a probability that a given eligible family will participate in WIC. The model is estimated using New York City families that are included in the Census Bureau’s Annual Social and Economic Supplement (ASEC) of the Current Population Survey (CPS). The CPS is a national-level survey with a
50. NYS DOH data shows a higher number of absolute infant and women participants than can even be identified as eligible in ACS. Knowing that not all eligible persons will participate, we decided to use the NYS DOH participation rate as our benchmark and not absolute participant numbers. Please see our last report for reasons why the ACS can not identify all eligible persons.
very limited sample for local areas. To muster a sufficiently large number of observations, we pool six years of data. For this year’s analysis we use the 2007 through 2012 ASEC, which provides information on WIC participation in 2006 through 2011. The model’s householder characteristics and household variables as well as their coefficient values and their statistical significance are provided in Table E Thirteen. For more detailed information about our methodology, please refer to Appendix E of our 2012 report.51
51. See: www.nyc.gov/html/ceo/downloads/pdf/CEO_Poverty_Measure_April_16.pdf
table e thirteenLogit Regression Model of WIC Participation, Coeffecient Definitions and Values, 2006 - 2011
Household Head Characteristics B S.E. Exp(B)Race/Ethnicity Non-Hispanic White -.346 .009 .707
Non-Hispanic Black .408 .008 1.503Hispanic .675 .007 1.964Other Race/Ethnicity (Omitted Variable)
Education High School Graduate through College Graduate -.151 .004 .860Master’s Degree or Higher -1.019 .016 .361Less Than High School (Omitted Variable)
Citizenship Foreign Born, Citizen by Naturalization .185 .006 1.203Foreign Born, Not a Citizen .316 .005 1.371Citizen by Birth (Omitted Variable)
Work Experience Works Less Than Full-Time, Year Round .574 .005 1.776Does Not Work .439 .005 1.551Works Full-Time, Year Round (Omitted Variable)
Household Characteristics
Single Female Houshold Head .138 .005 1.148Infant Present in Household 1.312 .005 3.712Number of Persons in Household .024 .001 1.025Household Receives Food Stamps .799 .004 2.224Household Income/Poverty Guideline Ratio .389 .003 1.476Constant -2.489 .012 .083
Source: Current Population Survey Annual Social and Economic Supplement, New York City Sample, 2007-2012.Notes: All coefficients significant at the p< 0.01 level. Analysis used the household weight. Dependent Variable was HRWICYN, “Does anyone in household participate in WIC program.” N = 690.
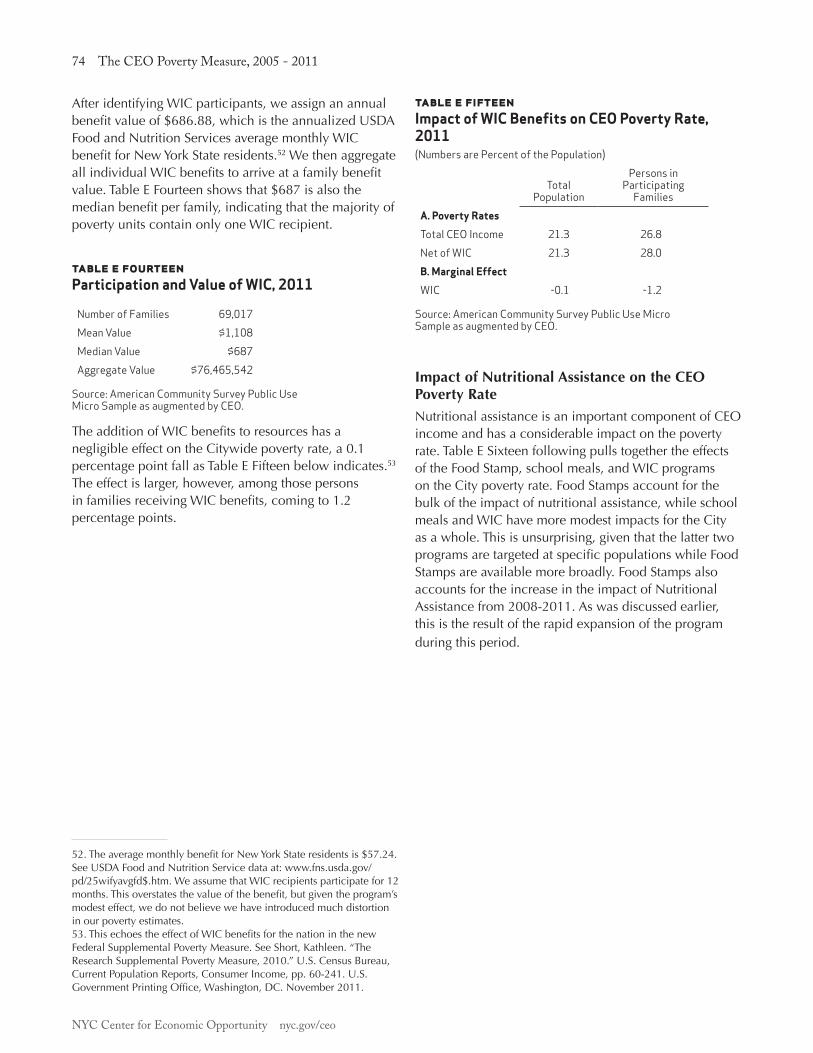
NYC Center for Economic Opportunity nyc.gov/ceo
74 The CEO Poverty Measure, 2005 - 2011
After identifying WIC participants, we assign an annual benefit value of $686.88, which is the annualized USDA Food and Nutrition Services average monthly WIC benefit for New York State residents.52 We then aggregate all individual WIC benefits to arrive at a family benefit value. Table E Fourteen shows that $687 is also the median benefit per family, indicating that the majority of poverty units contain only one WIC recipient.
table e fourteen Participation and Value of WIC, 2011
Number of Families 69,017Mean Value $1,108Median Value $687Aggregate Value $76,465,542
Source: American Community Survey Public Use Micro Sample as augmented by CEO.
The addition of WIC benefits to resources has a negligible effect on the Citywide poverty rate, a 0.1 percentage point fall as Table E Fifteen below indicates.53 The effect is larger, however, among those persons in families receiving WIC benefits, coming to 1.2 percentage points.
52. The average monthly benefit for New York State residents is $57.24. See USDA Food and Nutrition Service data at: www.fns.usda.gov/pd/25wifyavgfd$.htm. We assume that WIC recipients participate for 12 months. This overstates the value of the benefit, but given the program’s modest effect, we do not believe we have introduced much distortion in our poverty estimates.53. This echoes the effect of WIC benefits for the nation in the new Federal Supplemental Poverty Measure. See Short, Kathleen. “The Research Supplemental Poverty Measure, 2010.” U.S. Census Bureau, Current Population Reports, Consumer Income, pp. 60-241. U.S. Government Printing Office, Washington, DC. November 2011.
table e fifteenImpact of WIC Benefits on CEO Poverty Rate, 2011 (Numbers are Percent of the Population)
Total Population
Persons in Participating
FamiliesA. Poverty Rates
Total CEO Income 21.3 26.8Net of WIC 21.3 28.0B. Marginal Effect
WIC -0.1 -1.2 Source: American Community Survey Public Use Micro Sample as augmented by CEO.
Impact of Nutritional Assistance on the CEO Poverty RateNutritional assistance is an important component of CEO income and has a considerable impact on the poverty rate. Table E Sixteen following pulls together the effects of the Food Stamp, school meals, and WIC programs on the City poverty rate. Food Stamps account for the bulk of the impact of nutritional assistance, while school meals and WIC have more modest impacts for the City as a whole. This is unsurprising, given that the latter two programs are targeted at specific populations while Food Stamps are available more broadly. Food Stamps also accounts for the increase in the impact of Nutritional Assistance from 2008-2011. As was discussed earlier, this is the result of the rapid expansion of the program during this period.

NYC Center for Economic Opportunity nyc.gov/ceo
Appendix E 75
table e sixteenImpact of Nutritional Assistance on the Poverty Rate, 2005 - 2011(Numbers are Percent of the Population)
2005 2006 2007 2008 2009 2010 2011A. Poverty Rates
Total CEO Income 20.3 19.8 19.8 19.0 19.6 20.9 21.3Net of: Food Stamps 22.3 21.8 21.6 21.2 22.3 24.4 24.9 School Meals 20.9 20.4 20.3 19.6 20.1 21.4 21.8 WIC 20.4 19.9 19.9 19.1 19.7 21.0 21.3 Total Nutritional
Assistance22.8 22.4 22.1 21.7 22.8 24.9 25.7
B. Marginal Effects
Food Stamps -2.0 -2.0 -1.8 -2.1 -2.7 -3.5 -3.6 School Meals -0.6 -0.6 -0.5 -0.6 -0.5 -0.5 -0.5 WIC -0.1 -0.1 -0.1 -0.1 -0.1 -0.1 -0.1 Total Nutritional
Assistance -2.5 -2.6 -2.3 -2.7 -3.2 -4.0 -4.4
Source: American Community Survey Public Use Micro Sample as augmented by CEO.
NYC Center for Economic Opportunity nyc.gov/ceo
76 The CEO Poverty Measure, 2005 - 2011
Appendix f: esTimATing The vAlUe of heAp BenefiTs
The Home Energy Assistance Program (HEAP) is a federally funded subsidy that offsets the energy costs of low-income households. Unless a household faces a heating emergency, HEAP takes the form of a one-time annual payment. If the household’s heating expenses are included in its rent or mortgage payments, it receives its HEAP benefit directly.54 If the household pays a utility company for its heating fuel, the HEAP payment is sent to the provider, who then reduces the household’s heating bill.
HEAP benefits are available to households whose income falls below the HEAP Benefit Income Guidelines.55 In New York City, households that receive cash assistance, Food Stamps, or are composed of a single person receiving Supplemental Security Income (SSI) benefits are automatically enrolled in the program. Other low-income households can apply for HEAP, but administrative data from the City’s Human Resources Administration (HRA) indicate that the vast majority of HEAP households are those whom it automatically enrolls. In 2010, for example, 689,745 households out of the 702,665 households that received HEAP benefits – 98.2 percent – were automatic enrollees.56
HEAP benefits are very modest. If the eligible household resides in public housing or receives a Section 8 subsidy, as of 2008 it only receives an annual one dollar HEAP payment, receipt of which entitles the household to claim a higher Food Stamp benefit. Otherwise, the household is eligible to receive an annual $40 or $50 payment depending on whether its income is above or below 130 percent of the Federal Poverty Guidelines, or if the household contains a “vulnerable” individual: someone under age six, over age 59, or under age 65 and receiving SSI benefits.57 These payments were lowered from $40 and $50 to $20 and $25, respectively, as of October 1, 2011.
There was no reliable survey data that collected information on HEAP benefits in New York City until
54. Households with a Common Benefit Identification Card receive a HEAP benefit as an electronic benefit transfer.55. These guidelines are based on household size and are available at: www.otda.ny.gov/programs/heap/program.asp#income56. These figures do not include the small number of HEAP participants who pay their home heating bills directly.57. OTDA (Office of Temporary and Disability Assistance), www.otda.ny.gov/programs/heap/program.asp#regular
the 2011 New York City Housing and Vacancy Survey, to which CEO was able to add a question about HEAP recipiency. This question unfortunately had a very low response rate, which is not surprising since HEAP benefits are one-time payments which are usually put on a recipient’s Electronic Benefit Transfer card, and so are easy to overlook.
CEO, therefore, continues to take advantage of the large degree to which beneficiaries are automatically enrolled and the simplicity of the program’s benefit structure to estimate the value of HEAP payments for households in the American Community Survey (ACS). A poverty unit in which any member is receiving Food Stamps or public assistance, or is a single-person household with SSI benefits, is assumed to be receiving a HEAP benefit. One new criterion has been added to our measure: if, as part of the housing imputation process, an ACS household has been matched to an HVS household that reported receiving HEAP payments, it is also assumed to be receiving a HEAP benefit.58
The October reduction in HEAP benefits created a problem in estimating benefit levels for 2011. The ACS uses a rolling sample; one-twelfth of the survey is conducted each month of a calendar year. Because the ACS public use file does not identify the month the household was surveyed, it is impossible to determine whether it would have received the higher or lower benefit. We randomly assigned the benefit value to match the proportion of households in the administrative data that received the reduced benefit level.
Once it has been estimated, the value of the HEAP benefit is added to a poverty unit’s income. Since there can be more than one poverty unit in an ACS-defined household, the benefit is only given to one poverty unit in a multi-poverty unit household. This follows program rules that limit payments to one per household. Table F One compares CEO’s estimates to HRA administrative data for the number of New York City households that received HEAP benefits, the total value of the benefits, and the mean benefit per household in 2011. CEO’s
58. See Appendix C.

NYC Center for Economic Opportunity nyc.gov/ceo
Appendix F 77
estimates come to 81.9 percent of the administrative data for the number of HEAP households, 76.5 percent of the administrative data for total benefits, and 93.4 percent of the administrative data for mean benefit per household. This very low benefit level explains the too-small-to-register effect of HEAP on the CEO poverty rate noted in Chapter Two.
table f oneComparison of CEO Estimates to Administrative Data for HEAP Program, 2011
A. Recipient Households
CEO Estimate 724,314HRA Administrative Data 883,944CEO as a Percentage of HRA 81.9%B. Total Benefits
CEO Estimate $18,613,085HRA Administrative Data $24,322,033CEO as a Percentage of HRA 76.5%C. Mean Benefit per Household
CEO Estimate $26HRA Administrative Data $28CEO as a Percentage of HRA 93.4% Sources: American Community Survey Public Use Micro Sample as augmented by CEO and New York City Human Resources Administration.

NYC Center for Economic Opportunity nyc.gov/ceo
78 The CEO Poverty Measure, 2005 - 2011
Appendix g: work-relATed expenses
Many families with children must pay for childcare in order to work. The expense of getting to and from work is an unavoidable cost for nearly every jobholder. These costs are non-discretionary and limit the ability of families to meet the needs that are represented in the poverty threshold. The National Academy of Sciences recommended that work-related expenses be deducted from family resources.59 The American Community Survey (ACS) does not include data on childcare costs or commuting costs, nor does it contain all the data needed to calculate these expenses. This appendix describes our childcare cost imputation and the methodology used to calculate commuting costs.
Childcare CostsCEO deducts the cost of childcare expenditures from income in the construction of our poverty measure. Because we are only interested in childcare costs that are non-discretionary – that is, necessary for work – we only count the expenses incurred when all of the parents are working. If one or both parents are not working, their childcare spending is uncounted. Since childcare spending is not reported in the ACS, CEO relies on an imputation model to estimate childcare spending. This childcare cost imputation model employs a predicted mean match (PMM) of observations in the Census Bureau’s Survey of Income and Program Participation (SIPP) to observations in the ACS.
Creation of the SIPP Data SetIn order to generate a sufficiently large sample, we pool data from the 2004 and 2008 SIPP childcare module data sets. These surveys cover the periods January 2005 through April 2005 and December 2009 through March 2010, respectively. In our previous reports, we used pooled data from the 2001 and 2004 SIPP. The 2008 SIPP data was released in late 2011; we decided to drop the 2001 SIPP data in favor of this newer data. This way, the SIPP data used for imputation more closely reflects the 2005-2011 period covered by this report.
Setting up the pooled SIPP data involves several steps. First, we remove foster children from this sample, given
59. Citro and Michael, pp. 70-71.
that their childcare costs are subsidized by government programs. Next, we take several steps to ensure that the unit of analysis within the SIPP is consistent with the “poverty units” CEO creates in the ACS.
The SIPP is a longitudinal data set in which participants are sampled over a two-year period. Individual observations in the SIPP are linked by sampling unit, household address, and family. The sampling unit is the original household as of the first round of interviews. A “household” is defined, as in the ACS, as all members living within the household unit, including family members and all unrelated individuals, such as unmarried partners, roommates, or foster children. Over the two-year SIPP sampling period, some members of a sampling unit leave and form their own households at a different address. Thus, in order to form a unique identifier for each household, we concatenate the sampling unit ID (SSUID) and the household address ID (SHHADID). Further, since ID markers can be reassigned to new sampling units between survey panels, we also include panel year as part of the constructed household ID. This yields an unweighted count of 74,047 unique households.
Within a household, a “family” in the SIPP is comprised of a group of two or more persons related by birth, marriage, or adoption who reside together. Unlike the ACS, the SIPP identifies and links members of subfamilies, even if they are unrelated to the reference person. (CEO creates unrelated sub-families in the ACS.)60 Unique families within a sampling unit are identified with the RFID variable. The constructed family ID variable concatenates RFID with the constructed household ID. This yields 80,731 unique families.
The SIPP places unmarried partners of the reference person into a different family within the household, which does not include their own children, if there are any. This is inconsistent with CEO’s unit of analysis, which treats unrelated partners as equivalent to spouses and includes them and their children in the reference person’s poverty unit. Thus, in order to make “families” in the SIPP commensurate with CEO poverty units, we place unmarried partners of the reference person and their children into the reference person’s family.
60. For a more detailed explanation of CEO’s “poverty unit of analysis,” see Appendix A in this report.

NYC Center for Economic Opportunity nyc.gov/ceo
Appendix G 79
Individual relationships to the reference person are designated in the SIPP with a household relationship variable (ERRP). All unmarried partners of the reference person (ERRP = 10) are placed in the same family as the reference person. Additionally, all children of the unmarried partner (including non-biological children) are placed in the reference person’s family.
Finally, we have to address the issue of minors classified as “other non-relatives of the reference person” (ERRP = 13). For this group, we use the following rule: if there is no other parent or guardian in the household, the individual is placed in the reference person’s family; otherwise, they are placed in their parent/guardian’s family.
Placing unmarried partners and unrelated minors in the reference person’s family reduces the number of unique families to 77,220. Out of this number, 20.9 percent of the families (16,160) have all parents working at least part of the year,61 at least one child 12 years of age or younger,62 and live in an urban area. This number represents the sample of SIPP families that is used for the regression model and the match.
Matching SIPP and ACS CasesSince SIPP data is measured for the reference month, the two income variables (total person income and earned income) are annualized and adjusted using the Betson equivalency scales,63 and inflated using the ratio of the Consumer Price Index (CPI) all-items index for the ACS data set year and the periods covered by the SIPP
61. The CEO childcare model caps childcare costs by the weeks worked of the spouse that works less. If one spouse does not work, this family will have no childcare costs. In order to reflect this in the imputation procedure, we narrowed the SIPP sample to mirror the rules we apply to ACS observations.62. The age range is consistent with the tax code, which provides childcare tax credits for children 12 and under.63. See Appendix B for a description.
panels.64 This data is aggregated from the person to the family level.
The SIPP divides childcare payments into 11 categories, organized by provider. These include: grandparents; other relatives; family daycare; daycare; preschool; Head Start; other non-relative; after-school sports; clubs; other after-school activities; and private lessons. These payments are further subdivided in the SIPP by child, yielding a total of 80 childcare payment variables. Childcare payments are measured as the sum of all such childcare payment variables in the SIPP topical module. These values are inflated using the CPI childcare cost index.
This SIPP data set is then used to develop a regression model to predict childcare costs for families. Following work by John Iceland and David Ribar,65 we estimate separate regressions for the two-parent and single-parent sub-samples in the SIPP.
The relationship between childcare spending and many of its predictor variables is complex and non-linear. In order to achieve the best possible fit to the data, we employ non-parametric techniques via a Generalized Additive Regression Model (GAM). A GAM is a regression model that allows different functional forms for each independent variable. Some of the variables used in the regression are included as dummy variables, while others are fit non-parametrically, using smoothing spline functions.66 The regression output is summarized in Table G One.67
64. We took the average of the CPI Index from January 2005 through April 2005 and December 2009 through March 2010 for panel years 2004 and 2008, respectively.65. Iceland, John and David C. Ribar. “Measuring the Impact of Child Care Expenses on Poverty.” Paper presented at the 2001 Population Association of America (PAA) meetings in Washington, D.C., March 29, 2001.66. Smoothing splines are a particular type of non-parametric smoothing technique. For an overview of smoothing spline functions and GAM, see Keele, Luke John. Semiparametric Regression for the Social Sciences. West Sussex, England. John Wiley and Sons, Ltd. 2008. 67. Non-parametric variables do not have reported coefficients, but rather have smoothed bivariate plots. These plots are available from the authors upon request.

NYC Center for Economic Opportunity nyc.gov/ceo
80 The CEO Poverty Measure, 2005 - 2011
These regression models are used to compute predicted means for childcare expenditures in both the SIPP and ACS files. ACS observations are then matched with SIPP observations based on their predicted means, and the actual weekly childcare cost value from the SIPP observation is donated to the ACS observation. We constrain the match so that SIPP observations can only match ACS observations with the same number of parents. Table G Two compares the distributions of the SIPP childcare values and the matched values for the subset of families with at least one working parent and at least one child 12 years of age or younger in the 2011 ACS. The matched values closely reproduce the distribution of childcare costs in the SIPP and percentage of observations with zero childcare costs.
table g oneRegression Model of Weekly Childcare Costs, 2011
A. Married-Parent Sample
Dummy Variables Coefficient t-StatisticIntercept 71.78 37.05Food Stamps -21.01 -4.35High School -25.24 -7.37Some College -18.49 -7.23College -15.70 -6.26
Non-Parametric Variables EDF F-StatisticEarned 8.70 78.52Child 0-5 2.00 629.53Child 13-17 1.85 7.34Adults 3.94 12.40Female Income Proportion 7.29 37.14N 12,319R2 0.240
B. Single-Parent Sample
Dummy Variables Coefficient t-StatisticIntercept 37.51 10.76Food Stamps -16.62 -5.52High School -3.53 -0.86Some College 0.78 0.21College 15.97 3.40
Non-Parametric Variables EDF F-StatisticEarned 7.82 19.29Child 0-5 1.86 107.01Child 13-17 1.51 3.35Adults 2.38 18.81Female Income Proportion 1.94 10.77N 3,841R2 0.158
Sources: 2004 and 2008 Survey of Income and Program Participation (SIPP).Notes: Dependent variable is weekly childcare expenditures in 2011 dollars. Sample comprised of SIPP families with at least one child under 13 and all parents working. Regressions were run using the SIPP person weight of the family head. This weight functions similarly to a family weight for each adjusted family unit within the household. “EDF” is the “equivalent degrees of freedom.”

NYC Center for Economic Opportunity nyc.gov/ceo
Appendix G 81
table g twoComparison of Weekly Childcare Payments, ACS and SIPP, 2011
A. Working Parents
ACS SIPPMean $51 $52
Percent Zero 64.4% 62.7%
Percentile
5 $0 $0
10 $0 $0
25 $0 $0
50 $0 $0
75 $52 $64
90 $169 $177
95 $274 $259
B. Working Parents with Non-Zero Expenditures
ACS SIPPMean $143 $139Percentile5 $10 $1010 $17 $2125 $46 $5250 $103 $10375 $193 $18790 $322 $30795 $417 $393
Sources: American Community Survey Public Use Micro Sample as augmented by CEO, and 2004 and 2008 Survey of Income and Program Participation (SIPP) inflated to 2011 prices using the CPI childcare index.Notes: Sample comprised of ACS and SIPP families with at least one child under 13 and all parents working. Values are reported at the level of the designated parent. Values are unweighted.
The weekly childcare values are then adjusted to reflect annual costs. In order to calculate childcare expenditures that are non-discretionary, we multiply the weekly value by the lowest reported number of weeks worked among the parents and cap the childcare costs for the family by the wages of the lower-earning parent. Table G Three below shows the distributions for the annualized values using the PMM procedure.
table g three Annual Non-Discretionary Childcare Expenditures, 2011
All Working Parents
Working Parents with Non-Zero Expenditures
Mean $2,044 $6,226Percent Zero 67.2% N.A.Percentile5 $0 $214
10 $0 $515
25 $0 $1,701
50 $0 $4,426
75 $1,611 $8,249
90 $6,874 $15,461
95 $11,560 $19,729 Source: American Community Survey Public Use Micro Sample as augmented by CEO. Notes: Samples are comprised of ACS families with at least one child under 13 and all parents working. Values are reported at the level of the designated parent. Data weighted by ACS household weight. N.A. - Not applicable because these families all have positive childcare costs.
Commuting CostsTo estimate commuting costs we employ the ACS variables that provide information about means of transportation, travel time, usual weekly hours, vehicle occupancy, work location, and weeks worked in the past 12 months. We rely on administrative data to calculate the cost per trip of various modes of transportation. Listed below are the means of transportation and the cost per trip:
• Drove: $0.5325 per vehicle mile – the average of the two IRS standard mileage rates68 released in 2011, plus bridge and tunnel tolls.
• Drove with Others: Divide all driving costs by number of carpoolers.
• Motorcycle: IRS standard mileage rate with motorcycle rates for tolls.
• Bus, Subway, or Ferry: $2.10 per trip.69
68. See: www.irs.gov/uac/IRS-Announces-2011-Standard-Mileage-Rates and www.irs.gov/uac/IRS-Increases-Mileage-Rate-to-55.5-Cents-per-Mile69. Metropolitan Transportation Association (MTA) increased fares on December 30, 2010. We use $2.10 as the cost of a subway or bus trip which was a result of a decrease to 7 percent from 15 percent for the “Volume Bonus” on a multi-ride MetroCard. We assume that ferry riders take the free-of-charge Staten Island Ferry and then use an additional form of public transit.
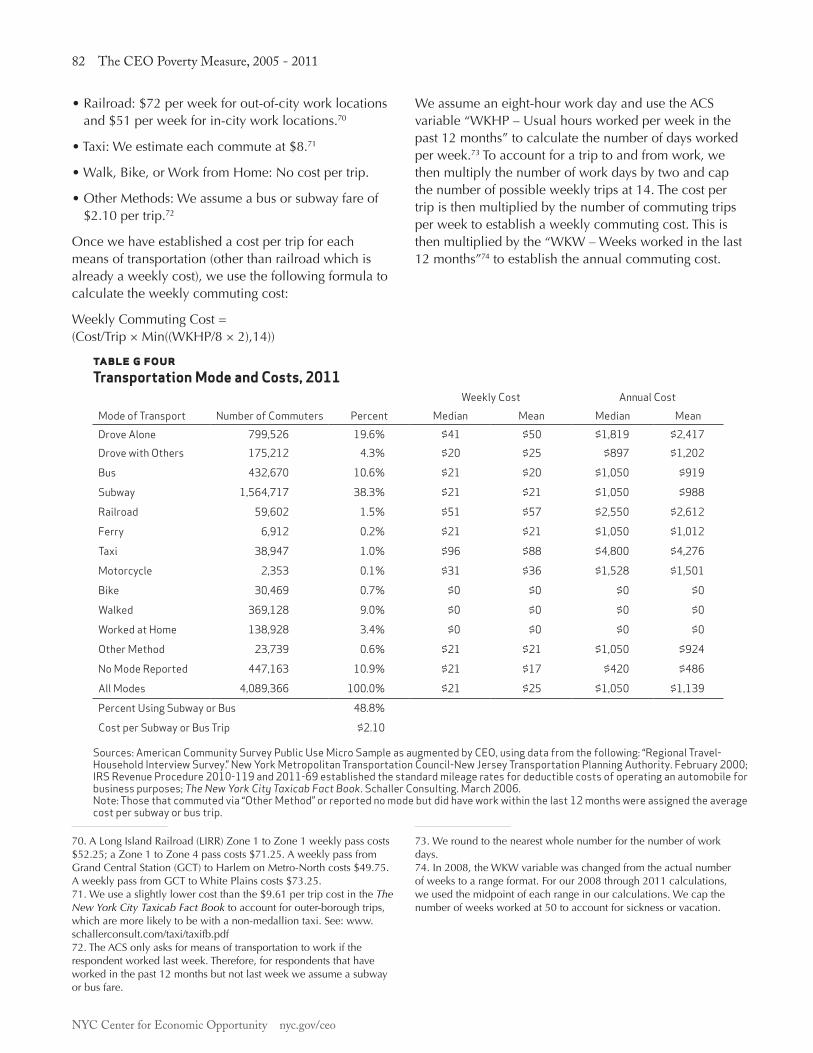
NYC Center for Economic Opportunity nyc.gov/ceo
82 The CEO Poverty Measure, 2005 - 2011
• Railroad: $72 per week for out-of-city work locations and $51 per week for in-city work locations.70
• Taxi: We estimate each commute at $8.71
• Walk, Bike, or Work from Home: No cost per trip.
• Other Methods: We assume a bus or subway fare of $2.10 per trip.72
Once we have established a cost per trip for each means of transportation (other than railroad which is already a weekly cost), we use the following formula to calculate the weekly commuting cost:
Weekly Commuting Cost = (Cost/Trip × Min((WKHP/8 × 2),14))
70. A Long Island Railroad (LIRR) Zone 1 to Zone 1 weekly pass costs $52.25; a Zone 1 to Zone 4 pass costs $71.25. A weekly pass from Grand Central Station (GCT) to Harlem on Metro-North costs $49.75. A weekly pass from GCT to White Plains costs $73.25. 71. We use a slightly lower cost than the $9.61 per trip cost in the The New York City Taxicab Fact Book to account for outer-borough trips, which are more likely to be with a non-medallion taxi. See: www.schallerconsult.com/taxi/taxifb.pdf 72. The ACS only asks for means of transportation to work if the respondent worked last week. Therefore, for respondents that have worked in the past 12 months but not last week we assume a subway or bus fare.
We assume an eight-hour work day and use the ACS variable “WKHP – Usual hours worked per week in the past 12 months” to calculate the number of days worked per week.73 To account for a trip to and from work, we then multiply the number of work days by two and cap the number of possible weekly trips at 14. The cost per trip is then multiplied by the number of commuting trips per week to establish a weekly commuting cost. This is then multiplied by the “WKW – Weeks worked in the last 12 months”74 to establish the annual commuting cost.
73. We round to the nearest whole number for the number of work days.74. In 2008, the WKW variable was changed from the actual number of weeks to a range format. For our 2008 through 2011 calculations, we used the midpoint of each range in our calculations. We cap the number of weeks worked at 50 to account for sickness or vacation.
table g fourTransportation Mode and Costs, 2011
Weekly Cost Annual CostMode of Transport Number of Commuters Percent Median Mean Median MeanDrove Alone 799,526 19.6% $41 $50 $1,819 $2,417Drove with Others 175,212 4.3% $20 $25 $897 $1,202
Bus 432,670 10.6% $21 $20 $1,050 $919
Subway 1,564,717 38.3% $21 $21 $1,050 $988
Railroad 59,602 1.5% $51 $57 $2,550 $2,612
Ferry 6,912 0.2% $21 $21 $1,050 $1,012
Taxi 38,947 1.0% $96 $88 $4,800 $4,276
Motorcycle 2,353 0.1% $31 $36 $1,528 $1,501
Bike 30,469 0.7% $0 $0 $0 $0
Walked 369,128 9.0% $0 $0 $0 $0
Worked at Home 138,928 3.4% $0 $0 $0 $0
Other Method 23,739 0.6% $21 $21 $1,050 $924
No Mode Reported 447,163 10.9% $21 $17 $420 $486
All Modes 4,089,366 100.0% $21 $25 $1,050 $1,139
Percent Using Subway or Bus 48.8%
Cost per Subway or Bus Trip $2.10 Sources: American Community Survey Public Use Micro Sample as augmented by CEO, using data from the following: “Regional Travel-Household Interview Survey.” New York Metropolitan Transportation Council-New Jersey Transportation Planning Authority. February 2000; IRS Revenue Procedure 2010-119 and 2011-69 established the standard mileage rates for deductible costs of operating an automobile for business purposes; The New York City Taxicab Fact Book. Schaller Consulting. March 2006. Note: Those that commuted via “Other Method” or reported no mode but did have work within the last 12 months were assigned the average cost per subway or bus trip.

NYC Center for Economic Opportunity nyc.gov/ceo
Appendix G 83
Table G Four shows that almost half (48.8 percent) of all New York City commuters used either the subway or bus. This results in a median annual commuting cost of $1,050. The highest commuting costs were incurred by those taking a taxi, driving alone, or using the railroad.
The top panel of Table G Five illustrates the impact of work-related expenses on the poverty status of total population. It shows the combined impact, as well as the individual impact of both commuting costs and childcare expenditures. As expected, poverty rates are lower after subtracting work-related expenses from income. The effect of commuting costs is fairly consistent since
reaching 1.7 percentage points in 2007. The impact of childcare expenses is stable, at either 0.2 or 0.3 percentage points from 2005 through 2011.
The second panel of Table G Five shows the impact of work-related expenses for persons living in working families with children. This is the population that would be most effected by work-related expenses. Interestingly, while the impact of commuting costs for this group is notably larger than for the population as whole, this is not true for childcare costs, which continue to have a relatively small effect on the poverty rate.
table g fiveImpact of Work-Related Expenses on Poverty Rates, 2005 - 2011(Numbers are Percent of the Population)
2005 2006 2007 2008 2009 2010 2011A. Total Population
Total CEO Income 20.3 19.8 19.8 19.0 19.6 20.9 21.3Net of:
Commuting Cost 19.0 18.4 18.1 17.5 18.0 19.2 19.5
Childcare Expenses 20.1 19.5 19.6 18.8 19.4 20.6 21.1
Total Work-Related Expenses 18.8 18.1 17.9 17.3 17.8 19.0 19.4
Marginal Effects
Commuting Costs 1.3 1.4 1.7 1.5 1.7 1.6 1.7
Childcare Expenses 0.2 0.3 0.2 0.2 0.2 0.3 0.2
Total Work-Related Expenses 1.5 1.7 1.9 1.7 1.9 1.9 1.9
B. Persons Living in Working Families with Children
Total CEO Income 12.5 12.6 13.3 11.8 12.1 13.1 13.7
Net of:
Commuting Cost 10.2 10.5 10.7 10.0 9.9 10.9 11.2
Childcare Expenses 12.1 11.9 12.9 11.3 11.7 12.5 13.4
Total Work-Related Expenses 9.8 10.0 10.4 9.5 9.5 10.4 10.9
Marginal Effects
Commuting Costs 2.2 2.1 2.6 1.9 2.2 2.2 2.5
Childcare Expenses 0.4 0.6 0.5 0.5 0.4 0.6 0.3
Total Work-Related Expenses 2.7 2.5 2.9 2.3 2.6 2.8 2.7 Source: American Community Survey Public Use Micro Sample as augmented by CEO.

NYC Center for Economic Opportunity nyc.gov/ceo
84 The CEO Poverty Measure, 2005 - 2011
Appendix h: mediCAl oUT-of-poCkeT expendiTUres
Following the National Academy of Sciences’ recommendation, CEO’s measure of income is net of what families spend for their medical care. Medical out-of-pocket expenditures (MOOP) include health insurance premiums, co-pays, deductibles, and the cost of health services that are not covered by insurance. Since the American Community Survey (ACS) does not report this information, it must be imputed from an outside data source. We use the Medical Expenditures Panel Survey (MEPS) to impute MOOP into the ACS. MEPS files have a slightly longer processing lag time than the ACS, so for the 2011 CEO Poverty Measure we use the 2010 MEPS data adjusted by the medical care component of the Consumer Price Index for All Urban Consumers (CPI-U).75
The MEPS contains two files that we use for our MOOP calculations. The Full Year (FY) file contains all the information pertaining to medical expenses except for health insurance premiums. Premiums for persons that are privately insured are contained in the Person Round Plan Public Use (PRPL) file. To calculate MOOP for those on private insurance, we add the PRPL file’s premium values to the FY file’s medical expenses. For those on public insurance, we create premium values based on program rules and add them to the FY file’s medical expenses.
Private Insurance PremiumsThere are five different categories of private insurance in the FY file. They specify if a policyholder has employer/union group insurance, private insurance with the source unknown, a non-group private policy, an “other group” insurance policy, or a self-employed (firm size of one) policy. All FY private insurance policyholders should have a corresponding private insurance premium in the PRPL file. However, there are a number of private insurance holder records in the FY file without
75. For further information about the MEPS please visit the Agency for Healthcare Research and Quality website at: www.meps.ahrq.gov/mepsweb/
corresponding records in the PRPL file. This occurs because health insurance premium values are only collected at the beginning of the year. Therefore, if a person began private insurance coverage in the middle of the year, a premium value would not be recorded in the PRPL file.
For records with missing premiums, we impute values via a hot-deck methodology. To insure that we are assigning an appropriate premium, we identify the policyholders as belonging to either an individual or a multi-person plan based on the number of persons in the FY health insurance unit (HIDUDX). The health insurance unit variable is a MEPS-constructed variable which links adults, their spouses, and any unmarried children age 18 and under who would most likely be covered under one health insurance plan.76 We then randomly assign non-missing premium values to records with missing premiums within their specified categories.
Public Insurance PremiumsWe use program rules to assign appropriate premiums for those on public insurance. We assume all persons identified in the MEPS as Medicare recipients have Medicare Part B. All Medicare recipients with incomes above 135% of the Federal Poverty Guidelines (FPG) are required to pay a monthly premium for Medicare Part B. If the Medicare participant is not married, we use only personal income when calculating their percentage of FPG. For married participants we aggregate the income of both partners.
All persons enrolled in Medicare Part B also have the option of enrolling in Medicare Part C, Medicare Advantage. Medicare Advantage is a type of Medicare administered by a private health insurance company, which usually offers greater benefits and services for an additional premium. For those identified in the MEPS as enrolled in Medicare Part C, we assign an additional annual premium of $528 for 2010.77
76. For the employer/union group, we also include whether or not the policyholder was in a union. 77. “Medicare Advantage.” The Henry J. Kaiser Family Foundation. November 2011: www.kff.org/medicare/upload/2052-15.pdf

NYC Center for Economic Opportunity nyc.gov/ceo
Appendix H 85
Persons also have the option to enroll in Medicare Part D, prescription drug coverage, which also requires a supplemental monthly premium.78 Many Medicare Advantage plans roll prescription drug coverage into their services and, therefore, for persons identified as enrolled in both Medicare Part C and Part D, we assign only the additional Medicare Part C premium.
To assign Child Health Plus premiums, we look at all children identified as public insurance recipients. We aggregate incomes for everyone in the same health insurance unit and compare that against the Federal Poverty Guidelines (FPG). Families are required to pay a monthly per-child premium based on their income’s percentage of the FPG. For all categories of participants, there is also a family cap. For example, families with incomes between 160 percent and 222 percent of the FPG are required to pay a premium of $9 per child per month. The premium is capped at the payment for three children ($27 per family per month).79
New York State’s Family Health Plus program does not have a premium but does require co-payments based on different types of procedures. These co-payments are captured in the MEPS Full Year file.80 Medicaid participants have no premiums or co-pays.
Once the premium data is calculated, we aggregate all premiums within the identified family variable and add that to other medical expenses81 to arrive at total medical out-of-pocket expenditures.
Developing a PMM Model for MOOP ImputationWe developed a regression model to predict MOOP values in the MEPS. All variables are measured for the head of the poverty unit.82 Income, age of the
78. For 2010 we assign an annual premium of $424, which is the weighted average by enrollment of Part D premiums for New York State. “Medicare Part D Spotlight: Part D Plan Availability in 2010 and Key Changes Since 2006.” The Henry J. Kaiser Family Foundation. November 2009: www.kff.org/medicare/upload/7986.pdf79. We used the health insurance unit opposed to the family unit when capping the premium.80. The TOTSLF variable identifies total out-of-pocket expenditures by patient or patient’s family (other than premiums).81. We aggregate each individual TOTSLF variable to the family to arrive at a total medical expenses value for the family.82. See Appendix A for a description of the CEO poverty unit of analysis.
household head, poverty unit size, and number of children are measured as continuous variables, while the race, education, insurance status, and working status categories are included as binary variables.
In 2008, the ACS began measuring insurance status, which is an important covariate in a model of MOOP. Thus, the imputation model for 2008 and onward contains insurance status while the previous years cannot. This may create some discontinuity, over time, in our estimates. We address it by using Food Stamp receipt as a proxy for Medicaid status for the years prior to 2008. In addition, a good deal of the variation in insurance status is picked up by the full-time work and income variables (which proxy for private insurance) and the age of the poverty unit head variable (which proxies for Medicare enrollment). We tested the 2008 data using the model without insurance status and found similar outcomes to the model with insurance status, yielding a mean MOOP value of $2,867 compared with $2,895 for the model including insurance status.83 This proxy method is imperfect, however, and may impact the quality of the statistical match.
The relationship between MOOP and many of its predictor variables is complex and non-linear. In order to achieve the best possible fit to the data, we employ non-parametric techniques via a Generalized Additive Regression Model (GAM). A GAM is a regression model that allows different functional forms for each independent variable. Binary variables used in the regression are included as dummy variables, while continuous ones are fit non-parametrically using smoothing spline functions.84 The regression output is summarized in Table H One.85
83. Additional information on the comparison of imputation models with and without insurance status is available upon request.84. Smoothing splines are a particular type of non-parametric smoothing technique. For an overview of smoothing spline functions and GAM, see Keele, Luke John. Semiparametric Regression for the Social Sciences. West Sussex, England. John Wiley and Sons, Ltd. 2008. 85. Non-parametric variables do not have reported coefficients, but rather have smoothed bivariate plots. These plots are available from the authors upon request.

NYC Center for Economic Opportunity nyc.gov/ceo
86 The CEO Poverty Measure, 2005 - 2011
table h one Regression Model of Medical Out-of-Pocket Spending, 2011
Dummy Variables Estimate t-StatisticIntercept 7.63 196.31Public Insurance -2.10 -32.57No Insurance -2.43 -47.25Work Full-Time -0.13 -3.36
Black -0.55 -11.04
Hispanic -0.62 -11.91
Asian -0.45 -5.52
Other Race/Ethnicity -0.57 -5.22
Bachelor's Degree or Greater 0.24 6.48
Less than High School -0.36 -6.86
Elderly Head -0.63 -5.23
Elderly Present 0.38 3.96
Public Insurance × Elderly 1.79 19.18
No Insurance × Elderly 0.17 0.21
Non-Parametric Variables EDF F-Statistic
Income 6.77 47.17
Family Size 7.04 63.72
Age 2.32 120.61
Children 1.64 15.31
N 13,270
R2 0.888 Source: 2010 Medical Expenditure Panel Survey inflated to 2011 prices using the CPI Medical Index.Notes: Dependent variable is the natural log of family-level MOOP. Income measured as household income divided by 10,000. “EDF” is the “equivalent degrees of freedom.” ACS and MEPS cases are matched based on their predicted means, using the regression model. When cases are matched, the actual MOOP value from the MEPS case is donated. Since there are slightly less than half as many donor cases in the MEPS as cases in the ACS, we allow MEPS observations to donate their value to multiple ACS observations. We also apply a rule that a single MEPS case cannot donate more than three times. This ensures that all ACS cases can be matched and helps preserve the full distribution of MOOP values from the MEPS. After some experimentation, we imposed a further restriction on the match: MEPS and ACS observations can only be paired if they match on health insurance status and the elderly status of their respective
reference person. We did this because initial testing of the imputation model without these conditions yielded poor matches for certain sub-groups. Adding these matching criteria overcomes this problem. The following table, H Two, shows the distribution of MOOP values in the MEPS and the PMM values for 2011.
table h twoComparison of MOOP Distributions, MEPS and ACS, 2011
MEPS ACSMean $3,268 $2,669Aggregate (in $1,000s ) N.A. $8,743,053Percentile
5 $0 $0
10 $29 $4
25 $453 $251
50 $2,027 $1,453
75 $4,636 $3,746
90 $8,106 $6,844
95 $10,529 $9,209
Proportion of families with Zero MOOP Values
7.2% 9.0%
Sources: American Community Survey Public Use Micro Sample as augmented by CEO, and 2010 Medical Expenditure Panel Survey (MEPS) inflated to 2011 prices using the CPI Medical Index.Note: N.A. - Not applicable due to the fact that the MEPS provides data at the U.S. level as opposed to the New York City level.
The matched MOOP values in the ACS are lower than those in the MEPS, particularly at the mean. This does not necessarily mean that the imputation procedure yields a poor match. The MEPS is a nationally representative survey while our estimates are for New York City. Since New York City differs in demographic composition from the rest of the U.S., the overall mean MOOP value may be higher or lower than for the overall population.
A better measure of the match quality is the conditional distributions. By looking at the matched values conditional on the matching variables, we can see whether or not the medical spending patterns are reproduced in the ACS, adjusting for the compositional differences in the data sets. Table H Three reports the mean and median MOOP expenditures in the MEPS and ACS by insurance and elderly status.

NYC Center for Economic Opportunity nyc.gov/ceo
Appendix H 87
table h threeComparison of MEPS and ACS MOOP Values by Age and Insurance Status, 2011
A. MEPS
Non-Elderly ElderlyPrivate Public Uninsured Private Public and
UninsuredMean $4,122 $673 $1,033 $4,439 $2,984Median $2,895 $154 $197 $3,434 $2,224
B. ACS
Non-Elderly Elderly
Private Public Uninsured Private Public and Uninsured
Mean $3,616 $836 $963 $3,982 $2,181
Median $2,535 $167 $210 $2,966 $1,410 Sources: American Community Survey Public Use Micro Sample as augmented by CEO, and 2010 Medical Expenditure Panel Survey (MEPS) inflated to 2011 prices using the CPI Medical Index.
The mean and median values by subgroups are much closer to the MEPS data than the Citywide mean. However, this table only conditions on two variables: elderly status and insurance status. Much of the difference between medical spending in New York and the U.S. is driven by New York’s vastly different demographic profile. Re-computing Table H Three for the non-Hispanic White population in the MEPS and the ACS, for example, yields even closer spending estimates.86
86. This data is available from the authors upon request.
Impact of MOOP on the CEO Poverty RateTable H Four reports the impact of MOOP on the poverty rate. MOOP has a substantial impact on the poverty rate, increasing poverty throughout the City by between 2.8 and 3.9 percentage points. The impact of MOOP on the poverty rate is larger in 2005-2007 than in 2008-2011. This is likely the result of the better statistical match that is generated when insurance status is included as a matching variable.
Table H Four also reports the impact of MOOP on poverty among the elderly, the group most affected by medical spending. The MOOP adjustment raises elderly poverty by a much larger amount, ranging from 4.6 percentage points to 6.7 percentage points. The impact of MOOP on the elderly leads to a considerable change in the way we understand their poverty. The elderly have a higher overall poverty rate than the City as a whole for every year from 2005 through 2011. However, the elderly have a net-of-MOOP poverty rate that is close to the Citywide net-of-MOOP poverty rate from 2005-2009, and a lower net-of-MOOP poverty rate than the Citywide average in 2010 and 2011. The pattern in 2010 and 2011 differs from prior years because poverty rose for younger and more labor-market dependent New Yorkers and because the effect of MOOP declined. Indeed, it declines markedly over the 2005-2011 period. This may be a reflection of implementation of Medicare Part D, the prescription drug coverage program that could be protecting more of the elderly from catastrophic medical costs.
table h fourImpact of MOOP on Poverty Rates, 2005 - 2011(Numbers are Percent of the Population)
2005 2006 2007 2008 2009 2010 2011A. All Persons
Total CEO Income 20.3 19.8 19.8 19.0 19.6 20.9 21.3Net of MOOP 16.9 16.3 15.9 15.8 16.4 18.1 18.3
Marginal Effect of MOOP 3.4 3.5 3.9 3.2 3.2 2.8 2.9
B. Elderly Individuals
Total CEO Income 24.1 22.7 22.5 22.7 22.1 21.1 22.4
Net of MOOP 17.4 16.5 16.0 17.0 16.8 16.5 17.1
Marginal Effect of MOOP 6.7 6.3 6.5 5.7 5.3 4.6 5.3 Source: American Community Survey Public Use Micro Sample as augmented by CEO.

NYC Center for Economic Opportunity nyc.gov/ceo
88 The CEO Poverty Measure, 2005 - 2011
Appendix i: ACCUrACy of The dATA
The principal data set for CEO’s poverty estimates is the American Community Survey (ACS) Public Use Micro Sample (PUMS). The ACS is designed to sample one percent of the households in the U.S. each year. The PUMS is a subset of the full ACS sample. It provides information collected from roughly 25,000 households in New York City annually.
Because the ACS is a survey, it is subject to two types of error: nonsampling error and sampling error.
Nonsampling Error: Nonsampling error is the error within survey data that is not specifically associated with the statistical sampling procedures of the sample data. Nonsampling error can occur because of erroneous responses by survey respondents, for example. Another source of nonsampling error can come from mistakes in the processing of the data by the Census Bureau, such as when data are edited or recoded.
Nonsampling error can affect the data in two ways: either randomly, which increases the variability of the data, or systematically, which introduces bias into the results. To minimize bias in the survey, the Census Bureau conducts extensive research of sampling techniques, questionnaire design, and data collection and processing procedures. For instance, after identifying a systematic underreporting of Food Stamp receipt and benefit dollar values in the ACS, the Census Bureau researched methods to increase the reported participation rate. The Census Bureau concluded, through this research, that changing the
wording of the Food Stamp question to include “Food Stamp benefit card,” as well as not asking about the Food Stamp benefit value, would significantly increase the number of households responding that they received Food Stamps.87
Sampling Error: Sampling error occurs in the ACS, as in other sample survey data, because inferences about the full population (such as the poverty rate for New York City) are derived from a subset of it (the poverty rate for the ACS sample). Another sample drawn from the same population would provide a different estimate of the poverty rate. The sampling error is estimated by the standard error, which can be thought of as a measure of the deviation of an estimate drawn from one sample from the average estimate of all possible samples.
For this report, CEO employed the replicate weight method recommended by the Census Bureau to compute direct standard errors for our estimated poverty rates. The standard errors provide a measure of sampling error and some types of nonsampling error.88 Using the standard errors, we tested the statistical significance of differences and changes in the report’s poverty rates at the ten percent level of significance. In the report’s tables, we highlight, in bold, statistically significant differences between poverty rates.
An additional source of error in the data results from CEO’s need to impute information on items such as the value of Food Stamp benefits, housing status, childcare expenditures, and medical out-of-pocket expenditures from other survey data into the ACS sample. We do not, however, account for the imputation error in this report.
87. John Hisnanick, T. Loveless, and J. Chesnut. U.S. Bureau of the Census. 2006 American Community Survey Content Test Report H.6 - Evaluation Report Covering Receipt of Food Stamps. January 3, 2007. See: www.census.gov/acs/www/AdvMeth/content_test/H6_Food_Stamps.pdf88. U.S. Bureau of the Census. PUMS Accuracy of the Data (2011). 2012. Available at: www.census.gov/acs/www/Downloads/data_documentation/pums/Accuracy/2011AccuracyPUMS.pdf

NYC Center for Economic Opportunity nyc.gov/ceo
Appendix I 89

NYC Center for Economic Opportunity nyc.gov/ceo
90 The CEO Poverty Measure, 2005 - 2011