the supplemental poverty measure and...
TRANSCRIPT
The Supplemental Poverty Measure and MOOP
Kathleen S. Short U.S. Census Bureau
CNSTAT Panel: Measuring Medical Care Risk in Conjunction with the
New Supplemental Income Poverty Measure
September 8, 2011
2
Supplemental Poverty Measure
• Observations from the Interagency Technical Working Group - March 2, 2010
• Based on National Academy of Science (NAS) 1995 recommendations
• Will not replace the official poverty measure, and will not be used for resource allocation or program eligibility
• Without funding, Census Bureau and BLS will produce research SPM national estimates using recommendations from Interagency Technical working group, along with other alternative poverty measures

NAS Report on Medical Care: 1995
Such needs are highly variable across the population, much more variable than needs for such items as food and housing.
Some people may need no medical care at all while others may need very expensive treatments.
Large number of thresholds to reflect different levels of medical care need, thereby complicating the poverty measure.
The result would be that it would be very easy to make an erroneous poverty classification.“
3

NAS Recommendations: 1995
Recommended a two index poverty measure 1. Adequate resources to obtain non-medical necessities:
food, clothing, shelter, utilities (FCSU) - measure of economic poverty
2. Adequate medical insurance coverage or resources to buy
needed treatment - medical care risk index
4

Economic poverty measure
• Thresholds do not include need for medical care
• Subtract medical out of pocket expenses from income to determine resources available for FCSU
• Do not add value of medical benefits to income
5

Open Letter, August 2000
6

Interagency Technical Working Group Document on Medical Care: 2010
• Self-reported out-of-pocket medical expenses will be collected in the Current Population Survey (CPS) for the first time in 2010. If this proves to be reasonably reliable for statistical adjustment purposes, then these data should be used as the MOOP adjustment for each family.
• It is important to emphasize that this approach does nothing to estimate the value of medical care that families are receiving relative to their needs.
• Additional and improved measures of the affordability of medical care and/or the quality of medical care which U.S. families receive may be highly useful and important, but these are different statistics and will need to be separately developed and funded.
7

ITWG and medical needs
• It has been argued in the past that an adjustment to MOOP should be made for the uninsured, who may be spending less than is customary because they lack health insurance and cannot pay for health services.
• The Census Bureau should investigate the pros and cons of such an adjustment and its computation. If policy changes make health insurance coverage more broadly available, those without insurance are more likely to have preferred this status. In this case, an adjustment for lack of insurance seems less attractive.
8

Supplemental Poverty Measure (SPM)
• Thresholds
– Based on spending from CE data for FCSU at BLS
• Separate thresholds by housing status
– Equivalence scales – 3 parameter scale
– Geographic adjustments based on ACS
• Unit of Analysis
– Consumer units and SPM resource units, include cohabitors
and foster children
9

Family Resource Definition • Gross money income
• PLUS value of in-kind NON-MEDICAL benefits for FCSU
– SNAP, school lunch, WIC – Housing subsidies – LIHEAP
• MINUS income and payroll taxes and other
nondiscretionary expenses
10
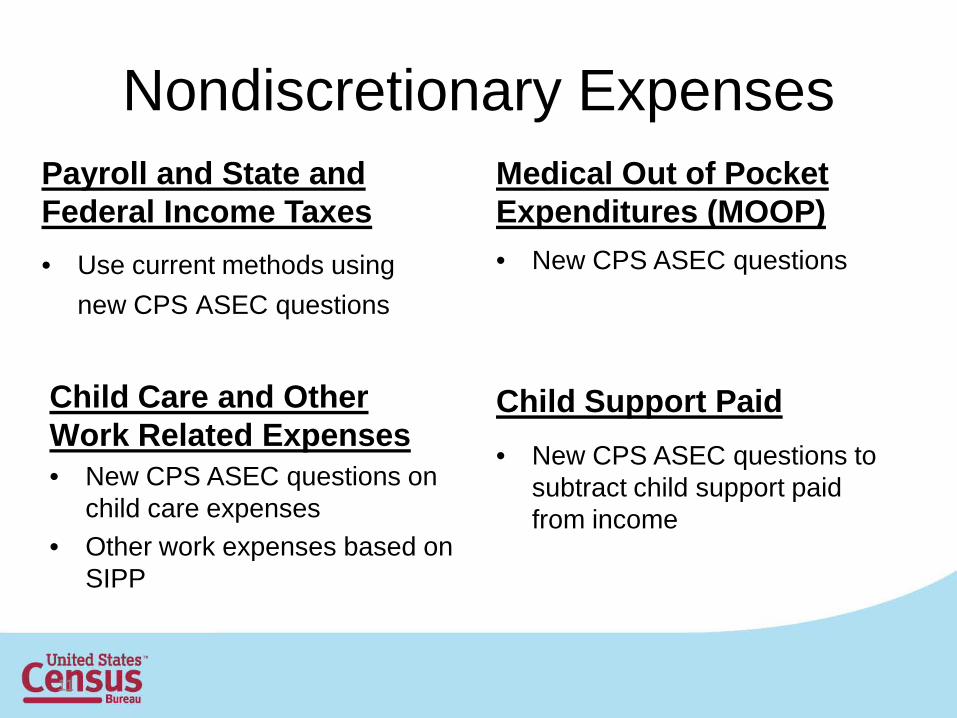
Nondiscretionary Expenses Payroll and State and Federal Income Taxes
• New CPS ASEC questions on child care expenses
• Other work expenses based on SIPP
Medical Out of Pocket Expenditures (MOOP) • New CPS ASEC questions • New CPS ASEC questions to
subtract child support paid from income
11
Child Support Paid
• Use current methods using new CPS ASEC questions
Child Care and Other Work Related Expenses
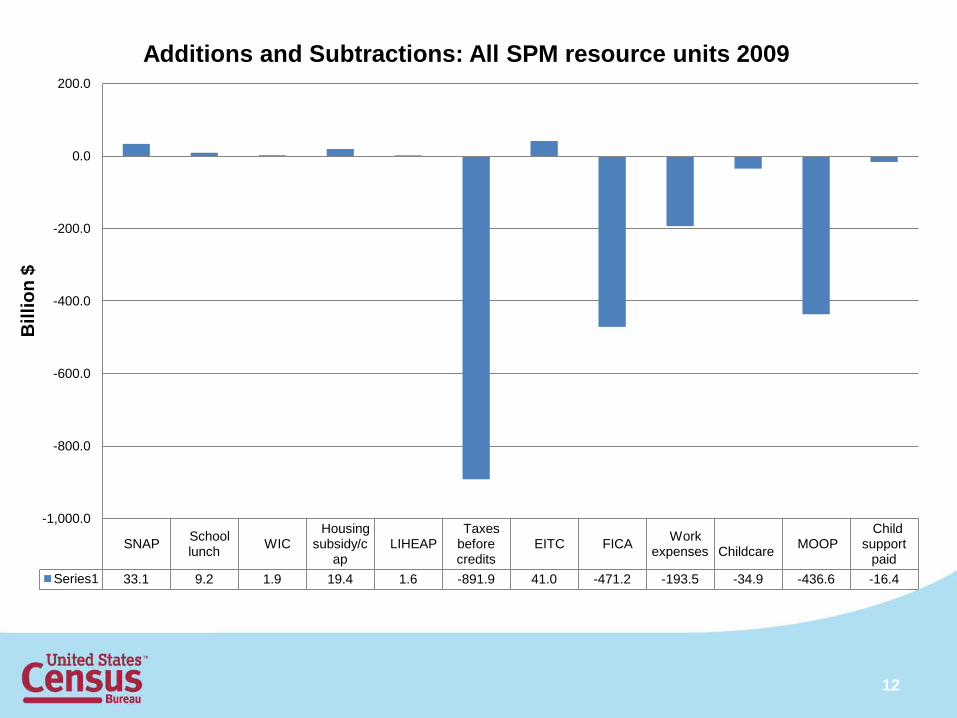
SNAP School lunch WIC
Housing subsidy/c
ap LIHEAP
Taxes before credits
EITC FICA Work expenses
Childcare MOOP
Child support
paid Series1 33.1 9.2 1.9 19.4 1.6 -891.9 41.0 -471.2 -193.5 -34.9 -436.6 -16.4
-1,000.0
-800.0
-600.0
-400.0
-200.0
0.0
200.0
Bill
ion
$ Additions and Subtractions: All SPM resource units 2009
12

SNAP School lunch WIC
Housing subsidy/c
ap LIHEAP
Taxes before credits
EITC FICA Work expenses
Childcare MOOP
Child support
paid Series1 22.3 3.6 1.0 14.9 0.8 -4.4 15.4 -8.9 -10.9 -1.3 -26.9 -1.0
-30.0
-20.0
-10.0
0.0
10.0
20.0
30.0
Bill
ion
$ Additions and Subtractions: Poor*
13

14
14.5
21.2
13.0
8.9
15.8
17.9
14.9 15.6
0.0
5.0
10.0
15.0
20.0
25.0
All People Children Nonelderly Adults Elderly
Poverty rates using two measures: 2009
Official*

15
EITC SNAP Hsg subsidy
School lunch WIC LIHEAP Child
support FICA Work expense MOOP
All persons -1.9 -1.5 -0.8 -0.3 -0.1 0.0 0.2 1.5 1.8 3.4
-3.0
-2.0
-1.0
0.0
1.0
2.0
3.0
4.0
Perc
enta
ge P
oint
Diff
eren
ce
Difference in percent below threshold after including each element

16
EITC SNAP Hsg subsidy
School lunch WIC LIHEAP Child
support FICA Work
expense
MOOP
Children -4.1 -2.9 -1.4 -0.9 -0.2 -0.1 0.1 1.9 2.4 2.9 Elderly -0.1 -0.6 -1.0 0.0 0.0 0.0 0.1 0.3 0.4 7.1
-6.0
-4.0
-2.0
0.0
2.0
4.0
6.0
8.0
Perc
enta
ge P
oint
Diff
eren
ce
Difference in percent below threshold after including each element for Children and Elderly: 2009

Joint Statistical Meetings Miami, Florida August 2, 2011
CHAIR – Kathleen Short, Census Bureau o Thesia Garner, Bureau of Labor Statistics, and Charles Hokayem, Census Bureau, SPM Poverty Threshold
o Ashley Provencher, Census Bureau, SPM Families o Kyle J. Caswell and Kathleen Short, Census Bureau, Medical Out-of-Pocket Spending
among the Uninsured: Differential Spending & the Supplemental Poverty Measure
o Melanie Rapino. Brian McKenzie and, and Matthew Marley, Census Bureau, Commuting and Geographic Adjustments for Poverty Measures
DISCUSSANT – Constance F. Citro, Committee on National Statistics, National Academy of
Sciences
17

Purposes of JSM paper
• Examine poverty rate under different treatments of MOOP – Adjustment for the uninsured
• Assess how SPM responds to policy changes in health care
• SPM – subtract reported MOOP from income • Two counterfactuals
– Uninsured adults & children receive insurance via the non-group market or CHIP
– Key features of the Patient Protection and Affordable Care Act (PPACA)
18

Methods
• Statistical match between insured and uninsured – Non-premium spending – Non-group premiums
• Key PPACA 2014 Provisions Considered
– Adult Medicaid expansion for those with family income up to138 percent of the FPL
– States are to maintain CHIP eligibility levels (FPL) – State health insurance “exchanges" – Insurance premium subsidies for up to 400 percent of the FPL
19

20
0.0
5.0
10.0
15.0
20.0
25.0
Total Population Children (0-18) Non-Elderly Adults (19-64)
SPM poverty rates by select groups and non-elderly uninsured adjustment
SPM
SPM w/ Non-Group/CHIP Uninsured Adjustment
SPM w/ PPACA Uninsured Adjustment
21
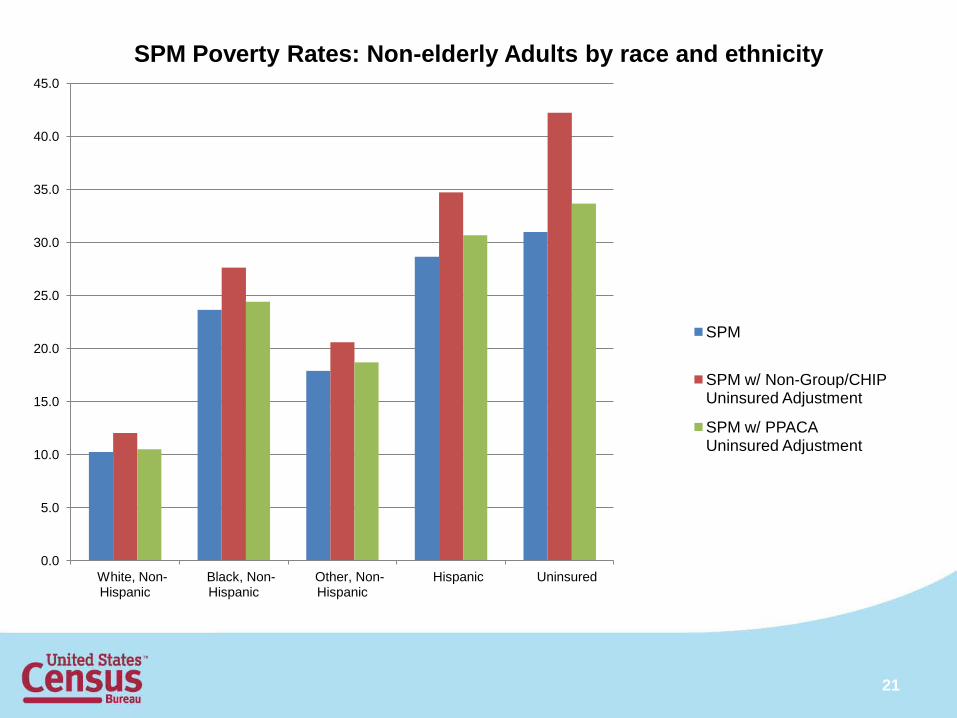
0.0
5.0
10.0
15.0
20.0
25.0
30.0
35.0
40.0
45.0
White, Non-Hispanic
Black, Non-Hispanic
Other, Non-Hispanic
Hispanic Uninsured
SPM Poverty Rates: Non-elderly Adults by race and ethnicity
SPM
SPM w/ Non-Group/CHIP Uninsured Adjustment
SPM w/ PPACA Uninsured Adjustment

Pros and cons of adjustment
• Inconsistent with other elements of the SPM – Compares spending with income – Does not measure “need”
• Health care reform
– Increased spending compared to same income – “Worse off”
22

Complementary measure
• Uninsured who become insured are ‘worse off’ economically
• ‘Better off’ in the domain of health care with health insurance coverage
• Medical care risk index
23

The Conceptual Framework for Measuring Medical Care Economic Risk Sarah Meier and Barbara Wolfe
September 8th, 2011

Why capture medical risk in the measurement of poverty? • Increase accuracy of measurement of poverty
• Medical care as a percentage of GDP has grown substantially since poverty measurement began • In 1965, ~ 5% of GDP (CBO, 2008, p.3)
• In 2010 ~17.6% and expected to grow to nearly 20% by 2020 (Office of the Actuary, 2011, p. 1).
• Thus, capturing medical care expenditure risk increasingly important.
• Risk sensitive to public policy such as Medicaid, Medicare and ACA. • Targeting of programs
• Inclusion make it far easier to evaluate effect of policies on both risk and effectiveness for those with low incomes
• Risk sensitive to all policies that influence medical care coverage

Difference between medical risk and MOOP
• MOOP=medical out of pocket expenditures • Premium and out of pocket medical expenditures
• An ex-post concept
• Refers to expenditures (utilization rather than risk of need)
• Does not adjust for underutilization
• Does not adjust for a defined benefit package
• Does not capture risk.

Big issues • Ex post or ex ante (Prospective)
• Individual or family as core unit (Individual)
• Treatment of over or under utilization (preferable)
• Tie to specific benefit package? (preferable)
• Measurable within relatively short period (data requirements)
• How complex?
• How capture resources (coverage and income)?
• How capture extreme risks – tail expenditures?
Our approach I. Review:
• Treatment of medical need and resources under current poverty measures
• Literature on medical risk measures
II. Identify:
• Design considerations
• Suggested framework
• Framework limitations and challenges to address
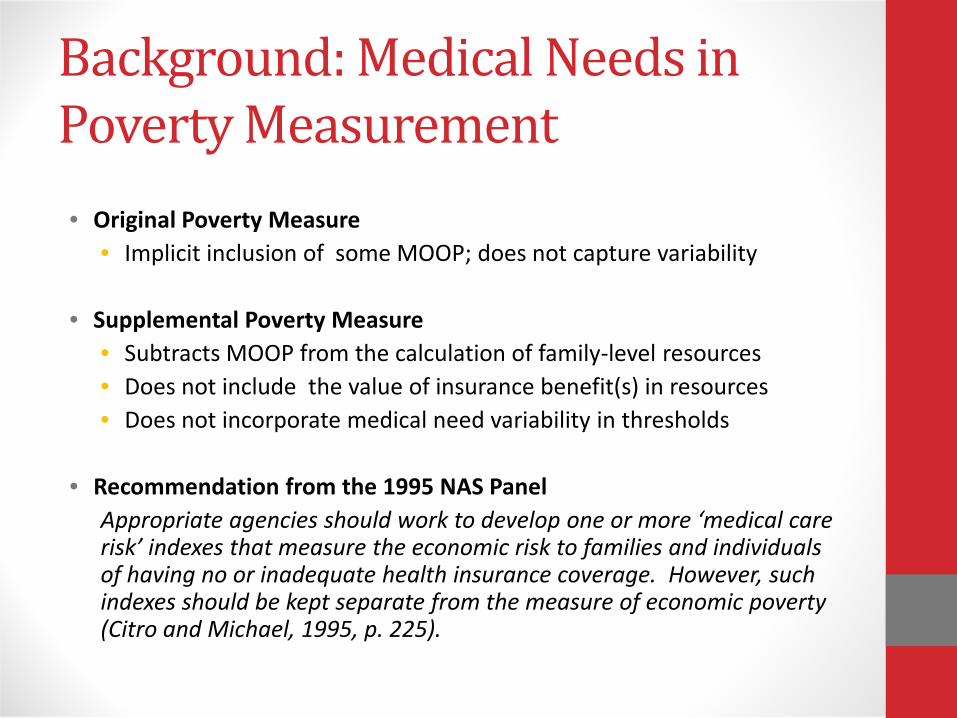
Background: Medical Needs in Poverty Measurement
• Original Poverty Measure
• Implicit inclusion of some MOOP; does not capture variability
• Supplemental Poverty Measure • Subtracts MOOP from the calculation of family-level resources • Does not include the value of insurance benefit(s) in resources • Does not incorporate medical need variability in thresholds
• Recommendation from the 1995 NAS Panel
Appropriate agencies should work to develop one or more ‘medical care risk’ indexes that measure the economic risk to families and individuals of having no or inadequate health insurance coverage. However, such indexes should be kept separate from the measure of economic poverty (Citro and Michael, 1995, p. 225).

Why a separate index?
• Non-fungible nature of medical benefits – computing resources (resolved by separate index)
• Defining medical needs (not directly resolved by separate index!)
• Limited ability to predict future individual expenditures – result in
misclassification
• Variation in medical needs might necessitate a large number of thresholds – tradeoff in accuracy and complexity
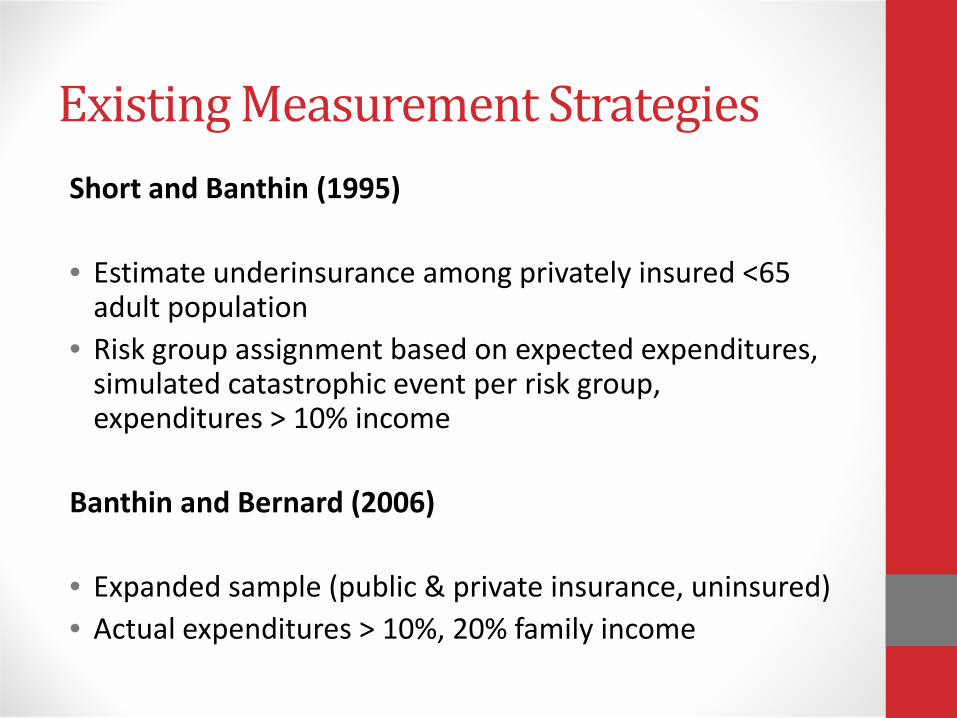
Existing Measurement Strategies Short and Banthin (1995) • Estimate underinsurance among privately insured <65
adult population • Risk group assignment based on expected expenditures,
simulated catastrophic event per risk group, expenditures > 10% income
Banthin and Bernard (2006) • Expanded sample (public & private insurance, uninsured) • Actual expenditures > 10%, 20% family income

Existing Measurement Strategies Handel (2010) Section 5.2: Cost Model • Individuals are assigned to a risk cell for each claim type (4 categories), each cell
includes similarly risky individuals as determined by the Johns Hopkins ACG software.
• Expenditure distributions are fit to risk cell/claim type combinations using actual claims.
• Each individual is assigned a joint claims distribution based on his/her risk profile (e.g. risk cell membership for each claim type) and the respective estimated distributions.
• Joint claims distribution can be “mapped” to a distribution of OOP expenditures.
• Family-level distributions of OOP expenditures are formed using individual distributions and coverage characteristics.
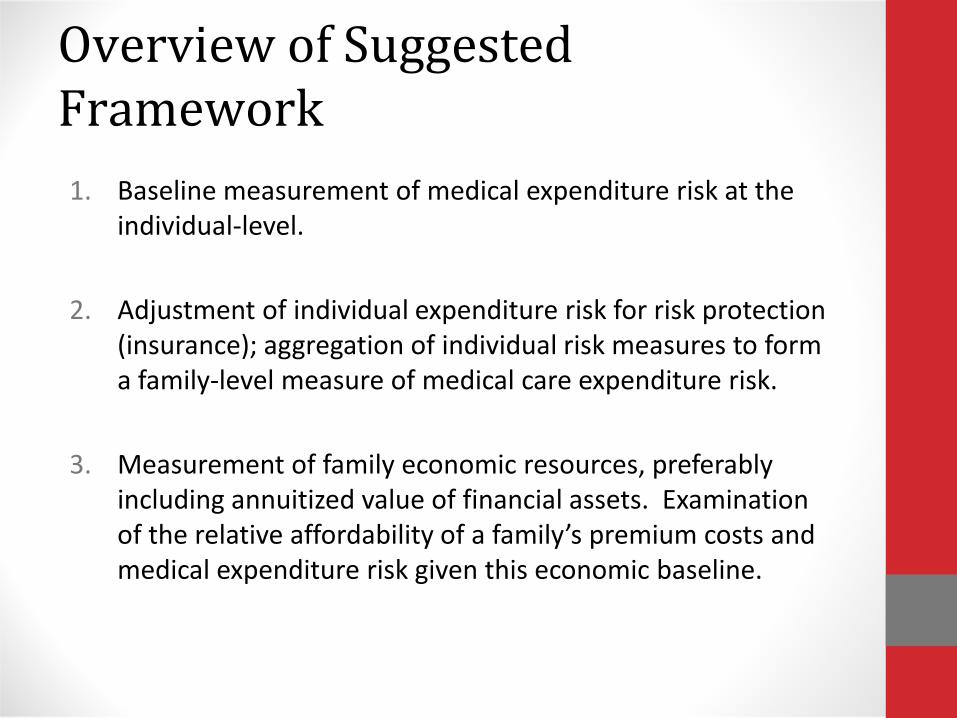
Overview of Suggested Framework 1. Baseline measurement of medical expenditure risk at the
individual-level.
2. Adjustment of individual expenditure risk for risk protection (insurance); aggregation of individual risk measures to form a family-level measure of medical care expenditure risk.
3. Measurement of family economic resources, preferably including annuitized value of financial assets. Examination of the relative affordability of a family’s premium costs and medical expenditure risk given this economic baseline.

Criteria for MCER Design (Prior Literature) Design recommendations from 1995 Panel
• Prospective
• Family-level (official poverty measure or SPM definition)
Doyle (1997) criteria
• Index must reflect risk
• Index must reflect resource and medical need (insurance adequacy, subsidized care and affordability)
• Index must be quantifiable
• Index requires well-defined accounting period
• Index is defined by available data

MCER Design Considerations (Framework Specific)
• Individual health risk classification – selection of risk factors:
• Definition of appropriate medical care coverage
• Selection of a meaningful risk measure
• Modeling expenditures
• Assessing risk protection (insurance)
• Measuring family resources
• The definition of affordability

MCER Design Considerations (Framework Specific) Individual health risk classification – selection of risk factors:
• Predictive capacity of selected characteristics
• Data limitations (availability, observations per risk cell)
• Feasibility (complexity, timeliness, cost)
Definition of appropriate medical care coverage
• Expenditure risk under a standard minimum basket of medical care services. Benefits standard under ACA?
• Adjustment for over/underutilization observed in base data

MCER Design Considerations Selection of a meaningful risk measure
How to move from a range of plausible outcomes to a singular measure of economic impact?
• Probability of expenditures exceeding an unaffordability threshold
• Expected expenditures per family unit
Modeling expenditures
• Fitting loss distributions
• Regression-based methods

MCER Design Considerations Assessing risk protection (insurance)
• Individual-level assessment, followed by family-level aggregation • Deductibles & stop loss (minimum); coinsurance/copayments • Actuarial value?
Measuring family resources
• Income definition consistent with official poverty measure or SPM, plus consideration of assets: • Annuitized value where a family receives the value of an annual flow
of income from their financial assets based on the life expectancy of adults in the family using existing life tables.
• This annuitized value would be added to income and compared to unprotected expenditure risk.
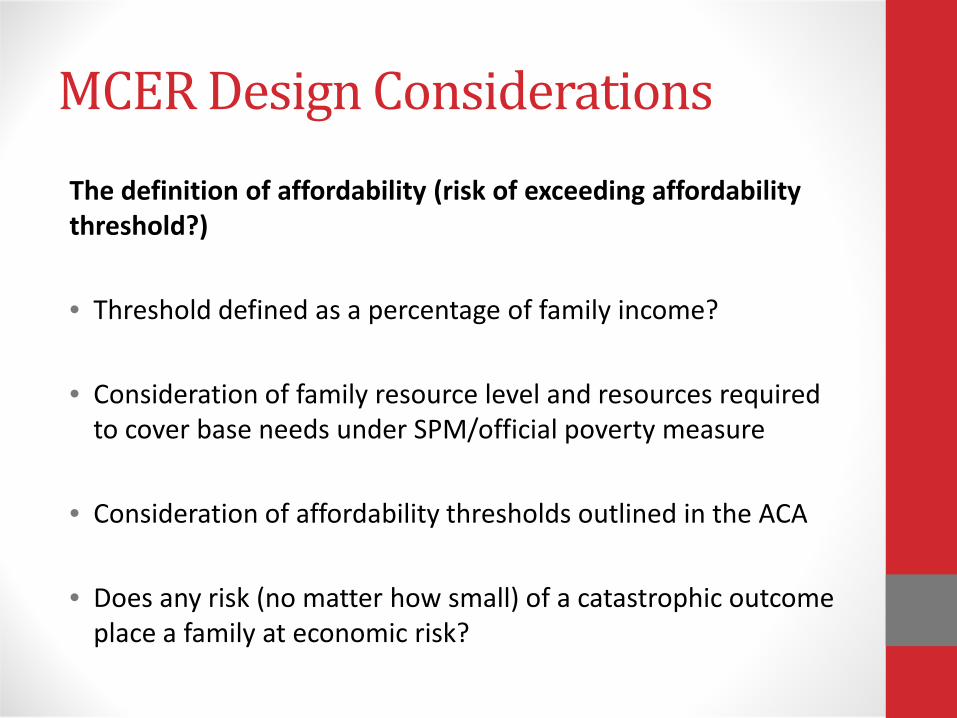
MCER Design Considerations The definition of affordability (risk of exceeding affordability threshold?)
• Threshold defined as a percentage of family income?
• Consideration of family resource level and resources required to cover base needs under SPM/official poverty measure
• Consideration of affordability thresholds outlined in the ACA
• Does any risk (no matter how small) of a catastrophic outcome place a family at economic risk?

Specific Steps - Framework for MCER Development

Stage One: Measuring Individual Medical Expenditure Risk
Specify a risk cell/factor based approach to individual risk classification
• Might include age/gender, high cost chronic condition, disability, and pregnancy.
• Variable availability, model complexity and observations per cell are relevant considerations.
Develop an expenditure risk model
• Expenditures should reflect only those expenditures covered under the specified ‘minimum’ benefits package and should include adjustment for underutilization of uninsured/underinsured.
• Might select a cell-based loss model approach; or model risk factor expenditure effects.
Identify an appropriate measure of medical expenditure risk
• Risk Measure I (Recommended): Probability of exceeding expenditure threshold per risk characteristics.
• Risk Measure II: Expected expenditures and one standard deviation above and below this value.

Stage Two: Adjustment for Insurance and Aggregation to the Family-Level • Assess the impact of an individual’s insurance coverage on
expenditure outcomes (across a modeled distribution, or at an expected expenditure estimate).
• Plan deductible • Out-of-pocket maximum • Estimate of percent post deductible expenses covered before reaching
OOP maximum
• Individual risk measures/loss distributions for the uninsured remain unadjusted.
• Aggregate these adjusted individual risk measures to a family unit
level.
• An econometric approach to modeling the probability of exceeding an expenditure threshold would require alternative methods.

Stage Three: Indexing Economic Resources to Family-Level Risk • Assign the appropriate threshold to a family based on family resources and
characteristics.
• Combine threshold and family-level income (and asset) information to determine the amount of medical expenditures that meets this threshold.
In the case of the loss distribution risk measure I (probability of exceeding the affordability threshold) approach, the next steps include:
• Subtract premium costs (for standard benefits only) from the assigned threshold.
• If premium costs exceed this threshold, the family experiences unaffordable medical care costs (e.g. not a ‘risk’ based outcome).
• If premium costs do not exceed the threshold, determine the amount of OOP expenditures that (with premium costs) places a family at their threshold.
• Determine the family’s probability of exceeding this amount of OOP expenditures using the family-level adjusted loss distribution.

Limitations & Challenges • Important to reach consensus on conceptualization and
measurement of expenditure risk in early stage of development
• Agreement on a minimum benefits standard
• Concrete definition of affordability (what percent income(+annuitized assets)?)
• Adjustments for underutilization?
• Data – Collection/design of new variables (ex: sufficient information to compute actuarial value?)

Conclusions • Medical risk an increasingly important component of poverty
• Risk is prospective & individual but can be aggregated to family or HH
• Recommend that MCER be developed as a separate index: potential for incorporation into single measure left for future after MCER developed.
• MCER not MOOP • Basic framework for MCER development
• Developing MCER Complex
• Normative considerations in the design of an index • Well-formed measure requires attention to numerous
methodological details
• Several areas require particular focus in future work

Citations • Banthin, J.S., and Bernard, D.M. (2006). Changes in financial burdens for health care:
National estimates for the population younger than 65 years, 1996-2003. JAMA, 296(22), 2712-9.
• Citro C.F., and Michael, R. (Eds.), (1995). Measuring poverty: a new approach. Washington, DC: National Academy Press. Available: http://www.census.gov/hhes/povmeas/methodology/nas/report.html.
• Congressional Budget Office. (2008, January). Technological change and the growth of health care spending. Available: http://www.cbo.gov/ftpdocs/89xx/doc8947/01-31-TechHealth.pdf [August 18, 2011].
• Doyle, P. (1997, May 1). Who’s at risk? Designing a medical care risk index. Available: • http://www.census.gov/hhes/povmeas/publications/medical/doyle2.html [August 20,
2011]. • Handel, B. (2010, January 26). Adverse selection and switching costs in health insurance
markets: When nudging hurts. • Office of the Actuary, Centers for Medicare & Medicaid Services. (2011). NHE projections
2010-2020, forecast summary and selected tables. Available: http://www.cms.gov/NationalHealthExpendData/downloads/proj2010.pdf [August 18, 2011].
• Short, P.F., and Banthin, J.S. (1995). New estimates of the underinsured younger than 65 years. JAMA, 274(16), 1302-6.

THE COMMONWEALTH
FUND
Tracking Geographic Variations in Exposure to Medical Care Economic Risk:
Moving Beyond One National Estimate
Sara R. Collins, Ph.D. Vice President, Affordable Health Insurance
The Commonwealth Fund
Developing a Measure of Medical Care Economic Risk National Academies of Sciences
September 8, 2011

THE COMMONWEALTH
FUND
Exhibit 1. Overview of Remarks • High out-of-pocket medical costs are a risk for insured as well as uninsured
– Schoen et al. analysis of national out-of-pocket spending on health care services, not counting premiums, finds rapid increase in the number and percent who are “underinsured” between 2003-2010
• The Affordable Care Act will expand and improve coverage, with Medicaid expansion, income-related premium tax credits and reduced cost-sharing to limit risk of high out-of-pocket costs and enable timely access to care – However, households with low and modest incomes could still be at
risk of high costs depending on the design of health plans, and – State implementation decisions
• The Current Population Survey added questions about medical care out-of-pocket costs, thus enabling estimates of risk at the state level
– Preliminary estimates based on one year of data, 2010, indicate significant variation in percent of families with high out-of-pocket spending across states
• Tracking trends in out-of-pocket costs nationally and by state for those insured, uninsured and by poverty will help inform reform implementation and future policies
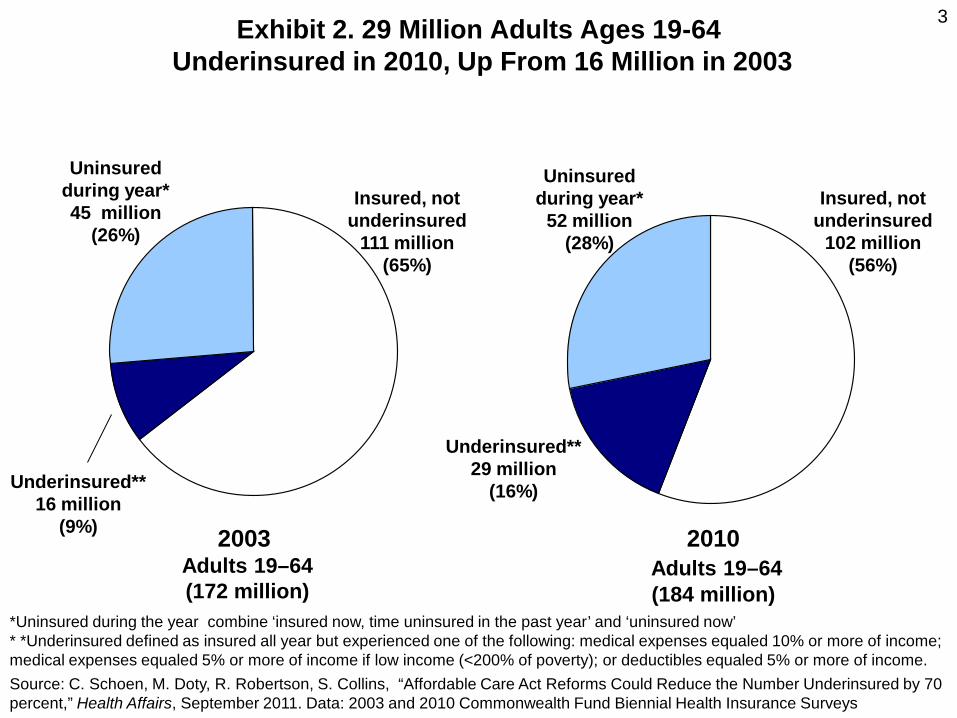
3 Exhibit 2. 29 Million Adults Ages 19-64 Underinsured in 2010, Up From 16 Million in 2003
Uninsured during year*
52 million (28%)
Insured, not underinsured
102 million (56%)
Underinsured** 29 million
(16%)
2010 Adults 19–64 (184 million)
Uninsured during year* 45 million
(26%)
Insured, not underinsured
111 million (65%)
Underinsured** 16 million
(9%) 2003 Adults 19–64 (172 million)
*Uninsured during the year combine ‘insured now, time uninsured in the past year’ and ‘uninsured now’ * *Underinsured defined as insured all year but experienced one of the following: medical expenses equaled 10% or more of income; medical expenses equaled 5% or more of income if low income (<200% of poverty); or deductibles equaled 5% or more of income. Source: C. Schoen, M. Doty, R. Robertson, S. Collins, “Affordable Care Act Reforms Could Reduce the Number Underinsured by 70 percent,” Health Affairs, September 2011. Data: 2003 and 2010 Commonwealth Fund Biennial Health Insurance Surveys
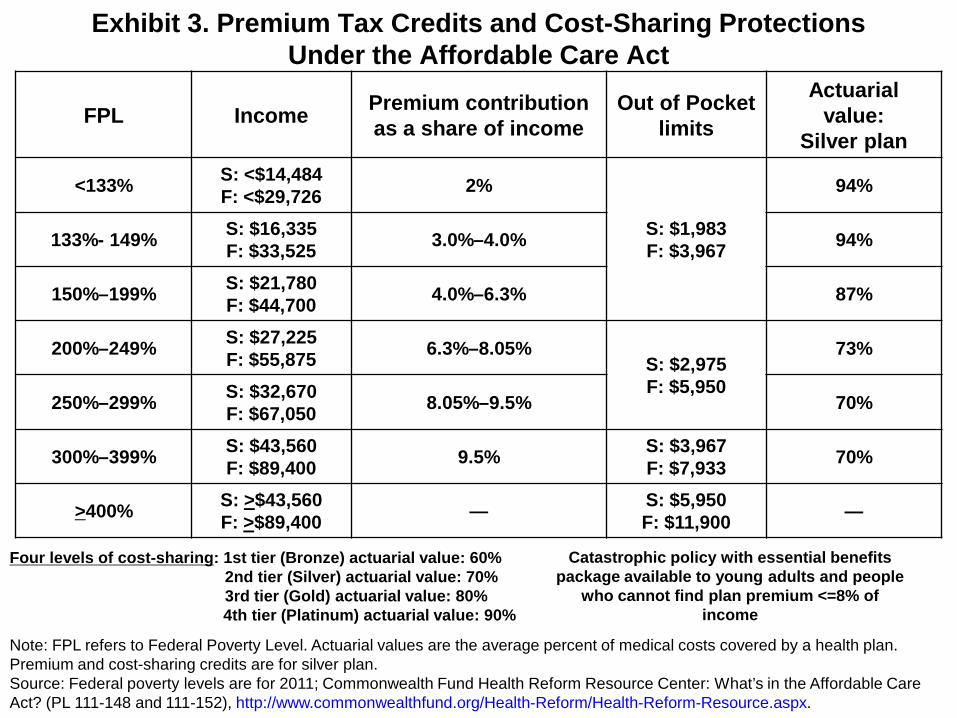
Four levels of cost-sharing: 1st tier (Bronze) actuarial value: 60% 2nd tier (Silver) actuarial value: 70% 3rd tier (Gold) actuarial value: 80%
4th tier (Platinum) actuarial value: 90%
Exhibit 3. Premium Tax Credits and Cost-Sharing Protections Under the Affordable Care Act
FPL Income Premium contribution as a share of income
Out of Pocket limits
Actuarial value:
Silver plan
<133% S: <$14,484 F: <$29,726 2%
S: $1,983 F: $3,967
94%
133%- 149% S: $16,335 F: $33,525 3.0%–4.0% 94%
150%–199% S: $21,780 F: $44,700 4.0%–6.3% 87%
200%–249% S: $27,225 F: $55,875 6.3%–8.05%
S: $2,975 F: $5,950
73%
250%–299% S: $32,670 F: $67,050 8.05%–9.5% 70%
300%–399% S: $43,560 F: $89,400 9.5% S: $3,967
F: $7,933 70%
>400% S: >$43,560 F: >$89,400 — S: $5,950
F: $11,900 —
Note: FPL refers to Federal Poverty Level. Actuarial values are the average percent of medical costs covered by a health plan. Premium and cost-sharing credits are for silver plan. Source: Federal poverty levels are for 2011; Commonwealth Fund Health Reform Resource Center: What’s in the Affordable Care Act? (PL 111-148 and 111-152), http://www.commonwealthfund.org/Health-Reform/Health-Reform-Resource.aspx.
Catastrophic policy with essential benefits package available to young adults and people
who cannot find plan premium <=8% of income

Exhibit 4. Percentage of Households That May Not Have Room in Budget for Health Care Costs, after Full ACA Implementation
0
5
10
15
20
25
30
<100% 101-150%
151-200%
201-250%
251-300%
301-350%
351-400%
401-450%
451-500%
>500%
Necessities, premiums, and 90thprecentile out-of-pocket costNecessities, premium, andmedian out-of-pocket costNecessities and Premiums
Percent of households that would not have room in budgets for premiums and out-of-pocket costs
Source: J. Gruber and I. Perry, Realizing Health Reform’s Potential: Will the Affordable Care Act Make Health Insurance Affordable? The Commonwealth Fund, April 2011.
Percent of Federal Poverty Level

Exhibit 5. Percentage of Households With Median Out-of-Pocket Costs That May Not Have Room in Budget for Health Care, after Full ACA
Implementation, by State Cost of Living
0
5
10
15
20
25
<100% 101-150%
151-200%
201-250%
251-300%
301-350%
351-400%
401-450%
451-500%
>500%
High Cost of Living State
Middle Cost of Living State
Low Cost of Living State
Percent of households that would not have room in budgets for premiums and median out-of-pocket costs
Source: J. Gruber and I. Perry, Realizing Health Reform’s Potential: Will the Affordable Care Act Make Health Insurance Affordable? The Commonwealth Fund, April 2011.
Percent of Federal Poverty Level
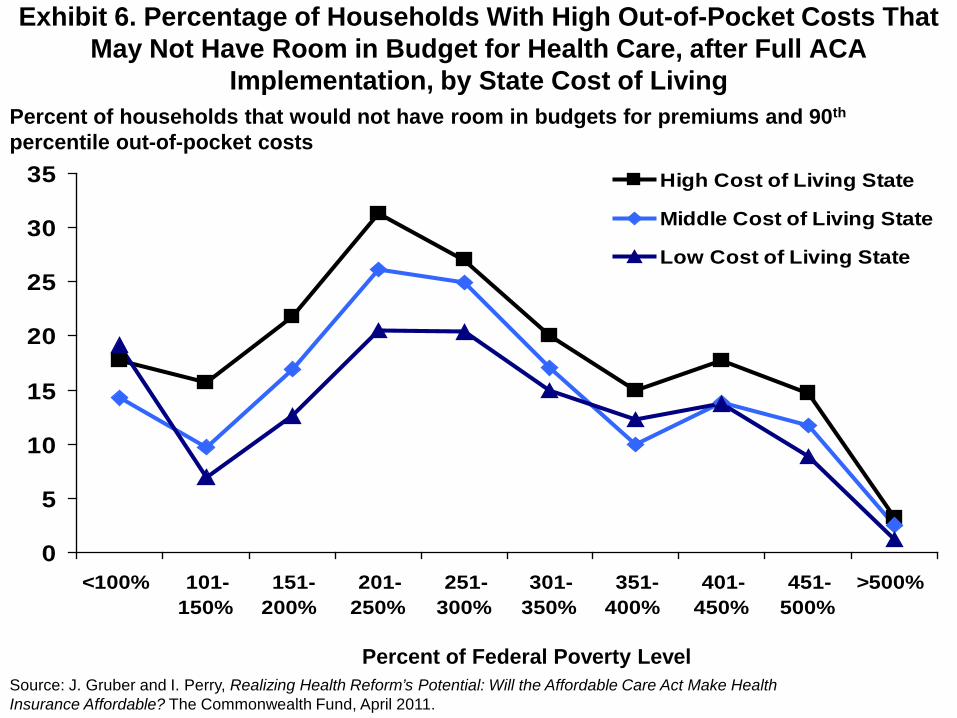
Exhibit 6. Percentage of Households With High Out-of-Pocket Costs That May Not Have Room in Budget for Health Care, after Full ACA
Implementation, by State Cost of Living
0
5
10
15
20
25
30
35
<100% 101-150%
151-200%
201-250%
251-300%
301-350%
351-400%
401-450%
451-500%
>500%
High Cost of Living State
Middle Cost of Living State
Low Cost of Living State
Percent of households that would not have room in budgets for premiums and 90th percentile out-of-pocket costs
Percent of Federal Poverty Level Source: J. Gruber and I. Perry, Realizing Health Reform’s Potential: Will the Affordable Care Act Make Health Insurance Affordable? The Commonwealth Fund, April 2011.

THE COMMONWEALTH
FUND
Exhibit 7. Tracking Out-of-Pocket Medical Spending Risk, Nationally and State by State: Data and Methods
• Data are from the March 2010 Current Population Survey (CPS), analyzed at the household/family level, annual family income
• CPS asks about total out-of-pocket costs for medical care services in 2009, excluding premiums and costs reimbursed by insurance – Where households have more than one member, the data files
aggregate spending for each family member for total family expense
• Insurance coverage: We classify a household as insured if all members in the family are insured. Uninsured families are families where everyone is uninsured or some members are uninsured
• High out-of-pocket thresholds as percent of income, vary by income – 10% or more a year OR – 5% or more a year if annual income is less than 200 percent of poverty
• The results show the percent of families, and the total counts of people in
families, with high medical care expenses compared to income

THE COMMONWEALTH
FUND
Exhibit 8. Families with high medical care spending relative to income, 2009
Note: Households under 65 years old. Expenses are family out-of-pocket for medical care as a share of annual income, not including premiums. 5% threshold applies to incomes below 200% of poverty. Insured families have no uninsured members. Source: Analysis of the 2010 Current Population Survey by N. Tilipman and B. Sampat of Columbia University for The Commonwealth Fund.
Spent 10% or more of income on out-of-pocket medical care
expenses
Spent 10% or more of income on out-of-pocket medical care expenses
or 5% or more if low income
Millions Percent Millions Percent
Total
Family units 14.6 13% 18.8 17%
People in these families 33.0 12% 44.0 16%
Insured families
Family units 9.3 11% 11.9 15%
People in these families 19.7 10% 26.0 13%
Uninsured families
Family units 5.4 18% 7.0 23%
People in these families 13.3 17% 18.0 22%

THE COMMONWEALTH
FUND
Exhibit 9. Percent of Families Who Spent a High Share of Income on Medical Care, 2009
17 15
23
0
10
20
30
40
50
Total Insured Uninsured
Percent of non-elderly families who spent 10% or more of income on out-of-pocket medical care expenses or 5% or more if low income
Note: Households under 65 years old. Expenses are family out-of-pocket for medical care as a share of annual income, not including premiums. 5% threshold applies to incomes below 200% of poverty. Insured families have no uninsured members. Source: Analysis of the 2010 Current Population Survey by N. Tilipman and B. Sampat of Columbia University for The Commonwealth Fund.
THE COMMONWEALTH
FUND
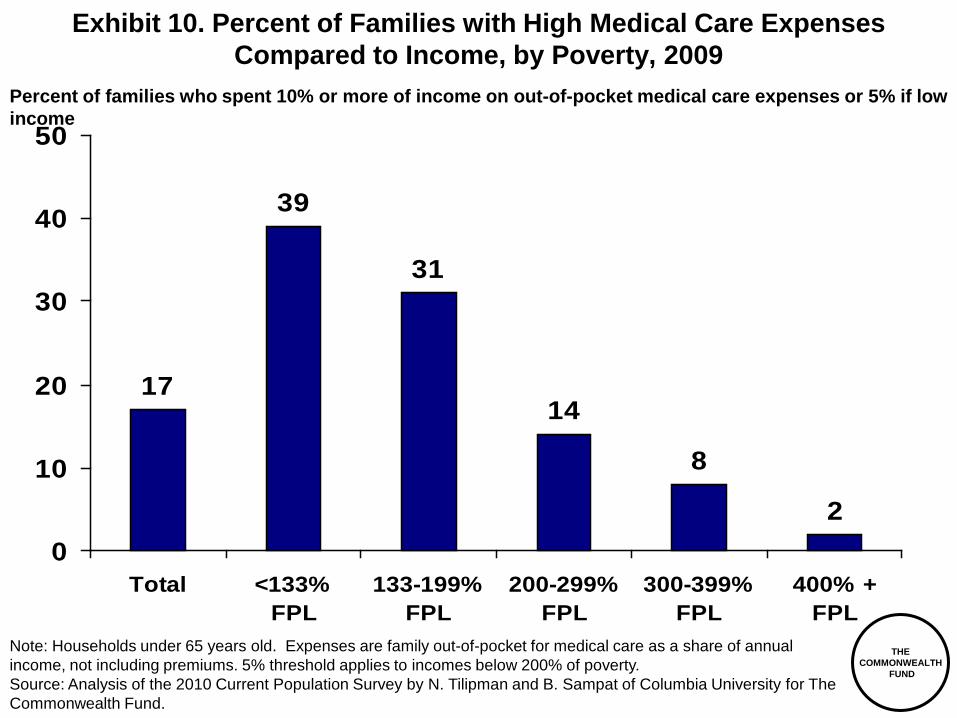
Exhibit 10. Percent of Families with High Medical Care Expenses Compared to Income, by Poverty, 2009
17
39
31
14
8
20
10
20
30
40
50
Total <133%FPL
133-199%FPL
200-299%FPL
300-399%FPL
400% +FPL
Note: Households under 65 years old. Expenses are family out-of-pocket for medical care as a share of annual income, not including premiums. 5% threshold applies to incomes below 200% of poverty. Source: Analysis of the 2010 Current Population Survey by N. Tilipman and B. Sampat of Columbia University for The Commonwealth Fund.
Percent of families who spent 10% or more of income on out-of-pocket medical care expenses or 5% if low income

THE COMMONWEALTH
FUND
Exhibit 11. Share of Insured Families with High Medical Care Expenses Compared to Income, by Poverty Group
15
37 39
15
9
20
10
20
30
40
50
Total <133%FPL
133-199%FPL
200-299%FPL
300-399%FPL
400% +FPL
Note: Households under 65 years old. Expenses are family out-of-pocket for medical care as a share of annual income, not including premiums. 5% threshold applies to incomes below 200% of poverty. Insured families have no uninsured members. Source: Analysis of the 2010 Current Population Survey by N. Tilipman and B. Sampat of Columbia University for The Commonwealth Fund.
Percent of insured families who spent 10% or more of income on out-of-pocket medical care expenses or 5% if low income

THE COMMONWEALTH
FUND
Exhibit 12. Percent of Uninsured Families Who Spent a High Share of Income on Medical Care Expenses, by Poverty, 2009
23
41
20
96
20
10
20
30
40
50
Total <133%FPL
133-199%FPL
200-299%FPL
300-399%FPL
400% +FPL
Note: Households under 65 years old. Expenses are family out-of-pocket for medical care as a share of annual income, not including premiums. 5% threshold applies to incomes below 200% of poverty. Uninsured families have at least one uninsured member. Source: Analysis of the 2010 Current Population Survey by N. Tilipman and B. Sampat of Columbia University for The Commonwealth Fund.
Percent of uninsured families who spent 10% or more of income on out-of-pocket medical care expenses or 5% or more if low income

THE COMMONWEALTH
FUND
TX
FL
NM GA
AZ
CA
WY
NV
AK
OK
MS
LA
MT
TN
Exhibit 13. Percent of Families with High Medical Care Expenses Compared to Income, by State, 2009
WA
OR
ID
UT CO
KS
NE
SD
ND
MN WI
MI
IA
MO
AR
IL IN OH
KY
WV VA
NC
SC
AL
PA
NY
ME
DC MD
DE
NJ CT RI
MA
NH VT
HI
12-13% 14-16% 17-19% 20-24%
Note: Households under 65 years old. Expenses are family out-of-pocket for medical care as a share of annual income, not including premiums. 5% threshold applies to incomes below 200% of poverty. Source: Analysis of the 2010 Current Population Survey by N. Tilipman and B. Sampat of Columbia University for The Commonwealth Fund.
Percent of families who spent 10% or more of income on out-of-pocket medical care expenses or 5% if low income
THE COMMONWEALTH
FUND
TX
FL
NM GA
AZ
CA
WY
NV
AK
OK
MS
LA
MT
TN
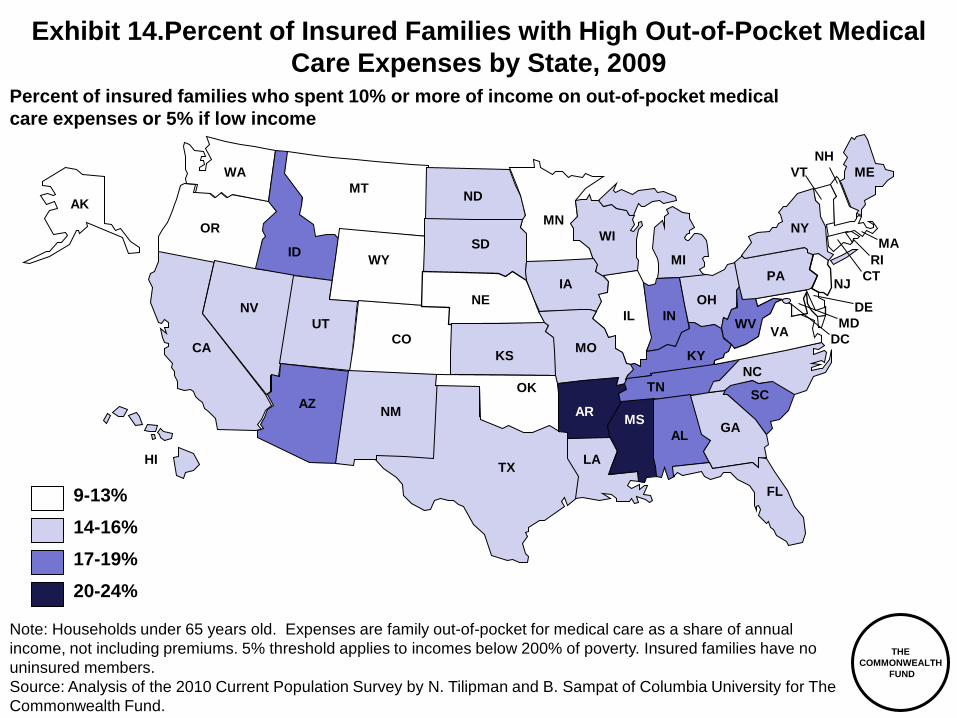
Exhibit 14.Percent of Insured Families with High Out-of-Pocket Medical Care Expenses by State, 2009
WA
OR
ID
UT CO
KS
NE
SD
ND
MN WI
MI
IA
MO
AR
IL IN OH
KY
WV VA
NC
SC
AL
PA
NY
ME
DC MD
DE
NJ CT RI
MA
NH VT
HI
Note: Households under 65 years old. Expenses are family out-of-pocket for medical care as a share of annual income, not including premiums. 5% threshold applies to incomes below 200% of poverty. Insured families have no uninsured members. Source: Analysis of the 2010 Current Population Survey by N. Tilipman and B. Sampat of Columbia University for The Commonwealth Fund.
Percent of insured families who spent 10% or more of income on out-of-pocket medical care expenses or 5% if low income
9-13% 14-16% 17-19% 20-24%

THE COMMONWEALTH
FUND
TX
FL
NM GA
AZ
CA
WY
NV
AK
OK
MS
LA
MT
TN
Exhibit 15. Percent of Low-Income Families with High Out-of-Pocket Medical Expenses, by State, 2009
WA
OR
ID
UT CO
KS
NE
SD
ND
MN WI
MI
IA
MO
AR
IL IN OH
KY
WV VA
NC
SC
AL
PA
NY
ME
DC MD
DE
NJ CT RI
MA
NH VT
HI 24-29% 30-32% 33-34% 35-38%
Note: Households under 65 years old. Expenses are family out-of-pocket for medical care as a share of annual income, not including premiums. 5% threshold applies to incomes below 200% of poverty. *Low income is considered under 250% FPL Source: Analysis of the 2010 Current Population Survey by N. Tilipman and B. Sampat of Columbia University for The Commonwealth Fund.
Percent of low income* families who spent 10% or more of income on out-of-pocket medical care expenses or 5% if under 200% FPL

THE COMMONWEALTH
FUND
Exhibit 16. Out of Pocket Medical Care Costs: Summary and Conclusion • 17% of families – including 44 million people - had high OOP costs in 2009
– 15% of insured families – Most at risk were low-income households: nearly 40% of insured
families <200% FPL had high OOP costs • High OOP costs varied greatly by state, ranging from 12 to 24% of families
– Families most at risk live in the south: combination of high uninsured rates, high percent low income, poor coverage.
– Among insured families, those in southern states still most at risk. – Rates particularly high among low income families <250% FPL, highest
rates in south. • 2014 reforms with Medicaid expansion, lower cost-sharing for qualified
health plans <250% FPL, essential benefit package, market reforms – Should see dramatic reduction in share of families with high OOP costs
as share of income nationally and across states • But risks include:
– Ongoing risk of rapid health care cost growth compared to income – Families with chronic illness – Design of plans and state exchanges, enrollment coordination between
coverage options, pace of implementation, health plan exemptions • A need to monitor over time at state and national level

THE COMMONWEALTH
FUND
18
Acknowledgements and Resources
Tracy Garber Program Associate, Affordable Health Insurance
Cathy Schoen Senior VP for Policy, Research, and Evaluation
C. Schoen, M.M. Doty, R. Robertson, S. R. Collins, “Affordable Care Act Reforms Could Reduce the Number Of Underinsured U.S. Adults by 70 Percent,” Health Affairs, September 2011 J. Gruber and I. Perry, Realizing Health Reform’s Potential: Will the Affordable Care Act Make Health Insurance Affordable? The Commonwealth Fund, April 2011 http://bit.ly/r3etPG Commonwealth Fund Health Reform Resource Center: What’s in the Affordable Care Act? (PL 111-148 and 111-152), http://bit.ly/rjfR1s
Bhaven Sampat, Ph.D. and Nick Tilipman Columbia University, Mailman School of Public Health

Peter Cunningham, Ph.D.
For presentation at Workshop on Developing Measures of Medical Care Economic Risk
High Medical Cost Burdens Among Nonelderly Adults With Chronic Conditions

Center for Studying Health System Change – www.hschange.org
Insurance Coverage by Health Conditions
No conditions
Acute only
1 chronic condition
2 chronic conditions
3+ chronic conditions
ESI private 53.9 66.7 70.1 72.8 66.6
Nongroupprivate
3.5 4.1 4.3 4.2 3.4
Public 8.2 9.4 8.6 9.7 19.2
Uninsured 34.4 19.8 17.0 13.2 10.8
Includes persons age 18-64 Source: 2008 Medical Expenditure Panel Survey

Center for Studying Health System Change – www.hschange.org
Family Income by Health Conditions
No conditions
Acute only
1 chronic condition
2 chronic conditions
3+ chronic conditions
LT 138% 19.9 16.8 15.8 14.2 18.7
138-200% 11.9 11.2 10.1 8.6 9.9
200-300% 19.9 18.0 16.5 15.9 15.8
300-400% 12.6 14.4 14.5 14.5 12.1
400% + 35.6 39.6 43.0 46.8 43.5
Includes persons age 18-64 Source: 2008 Medical Expenditure Panel Survey
Center for Studying Health System Change – www.hschange.org
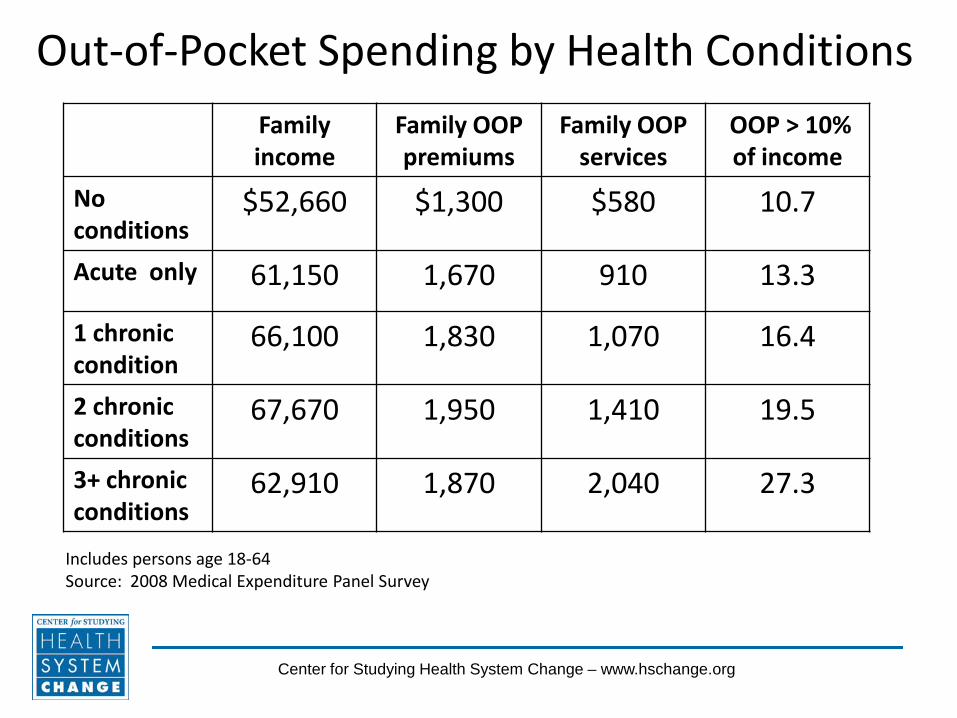
Out-of-Pocket Spending by Health Conditions Family income
Family OOP premiums
Family OOP services
OOP > 10% of income
No conditions
$52,660 $1,300 $580 10.7
Acute only 61,150 1,670 910 13.3
1 chronic condition
66,100 1,830 1,070 16.4
2 chronic conditions
67,670 1,950 1,410 19.5
3+ chronic conditions
62,910 1,870 2,040 27.3
Includes persons age 18-64 Source: 2008 Medical Expenditure Panel Survey

Center for Studying Health System Change – www.hschange.org
Trends in High Financial Burden
7 10
12
27
11 14
17
32
11 14
16
27
0
5
10
15
20
25
30
35
No conditions Acute only 1 chronic 3+ chronic
2001
2006
2008
Includes persons age 18-64 High burden defined as total out-of-pocket spending greater than 10% of family income Source: 2001, 2006, and 2008 Medical Expenditure Panel Survey

Center for Studying Health System Change – www.hschange.org
High Burden by Income
15
21
30 34
46
9 11 12
16 20
0
10
20
30
40
50
No conditions
Acute only 1 chronic 2 chronic 3+ chronic
LT 200% FPL
GT 200% FPL
Includes ages 18-64. High burden defined as total out-of-pocket spending greater than 10% of family income. Source: Medical Expenditure Panel Survey, 2008

Center for Studying Health System Change – www.hschange.org
Persistent Financial Burden (Two Years)
12 15 16
18 22
4 4
6
9
17
0
10
20
30
40
50
No conditions
Acute only 1 chronic 2 chronic 3+ chronic
Both years
One year
Source: Medical Expenditure Panel Survey, panel samples for 2001-2005

Center for Studying Health System Change – www.hschange.org
Problems Paying Medical Bills (by level of out-of-pocket spending relative to income)
No chronic conditions
1 or more chronic conditions
All persons < 65 years 18.5 29.9*
LT 2.5% 13.0 18.6
2.5 – 5.0% 26.9 40.3*
5.0 – 7.5% 30.4 44.1*
7.5 – 10.0% 43.4 63.7*
GT 10% 45.7 60.8*
*Difference with no chronic conditions is statistically significant at .05 level Source: 2007 Health Tracking Household Survey

Center for Studying Health System Change – www.hschange.org
OOP Premium Exceeds 9.5% of income
9 10 10
14 13 16
18 17 17
22
0
10
20
30
40
No conditions
Acute only 1 chronic 2 chronic 3+ chronic
Self-only
Family coverage
Persons age 18-64 with employer-sponsored insurance, and incomes between 138-400% of poverty Source: Medical Expenditure Panel Survey, 2008

Center for Studying Health System Change – www.hschange.org
OOP Premium Exceeds Cap for Subsidies
15 14 16
20 20 23 23
25 23
29
0
10
20
30
40
No conditions
Acute only 1 chronic 2 chronic 3+ chronic
Self-only
Family coverage
Persons age 18-64 with private insurance, and family incomes between 138-400% of poverty Source: Medical Expenditure Panel Survey, 2008

Center for Studying Health System Change – www.hschange.org
Cost – Sharing for Services (Self-Only Coverage, 138-400% of poverty)
% with any
expense
Average OOP
expense
OOP as % of total expenditures
Exceeds
PPACA Max
No conditions
23.7 $96 46.5 0
Acute only 66.2 $258 37.2 0.1
1 chronic 85.3 $462 36.7 3.1
2 chronic 91.7 $512 30.7 3.5
3+ chronic 98.6 $959 28.2 6.4
Persons age 18-64 with private insurance. Source: Medical Expenditure Panel Survey, 2008

Center for Studying Health System Change – www.hschange.org
Cost – Sharing for Services (Family Coverage, 138-400% of poverty)
% with any
expense
Average OOP
expense
OOP as % of total expenditures
Exceeds
PPACA Max
No conditions
23.5 $614 26.6 1.2
Acute only 75.6 $907 25.1 1.1
1 chronic 89.0 $918 24.7 1.2
2 chronic 96.5 $1,304 24.2 2.8
3+ chronic 99.1 $1,676 21.0 4.0
Persons age 18-64 with private insurance. Source: Medical Expenditure Panel Survey, 2008

Trends Exposure to Out-of-Pocket Spending for Medical Care
Gary Claxton
Vice President Kaiser Family Foundation September, 2011

Cumulative Increases in Health Insurance Premiums, Workers’ Contributions to Premiums, Inflation, and Workers’ Earnings
138%
159%
42%
31%
0%
20%
40%
60%
80%
100%
120%
140%
160%
180%
1999 2000 2001 2002 2003 2004 2005 2006 2007 2008 2009 2010
Health Insurance Premiums Workers' Contribution to Premiums
Workers' Earnings Overall Inflation
Source: Kaiser/HRET Survey of Employer-Sponsored Health Benefits, 1999-2010. Bureau of Labor Statistics, Consumer Price Index, U.S. City Average of Annual Inflation (April to April), 1999-2010; Bureau of Labor Statistics, Seasonally Adjusted Data from the Current Employment Statistics Survey, 1999-2010 (April to April).
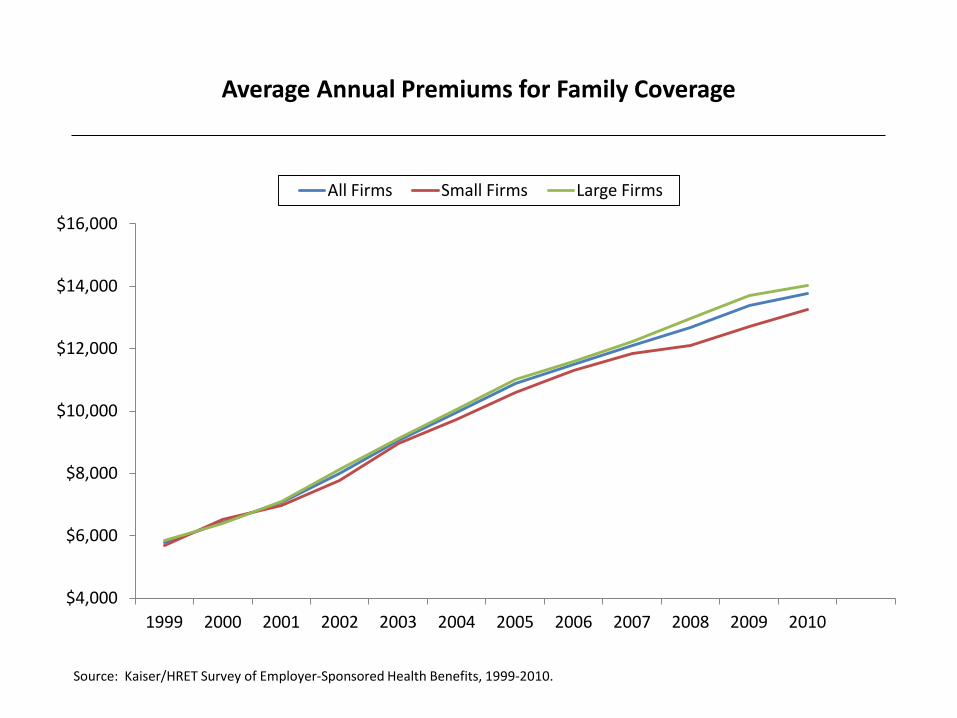
Average Annual Premiums for Family Coverage
$4,000
$6,000
$8,000
$10,000
$12,000
$14,000
$16,000
1999 2000 2001 2002 2003 2004 2005 2006 2007 2008 2009 2010
All Firms Small Firms Large Firms
Source: Kaiser/HRET Survey of Employer-Sponsored Health Benefits, 1999-2010.

Average Annual Worker Contributions Towards Premiums Single and Family Coverage, by Firm Size
$0
$500
$1,000
$1,500
$2,000
$2,500
$3,000
$3,500
$4,000
$4,500
$5,000
1999 2000 2001 2002 2003 2004 2005 2006 2007 2008 2009 2010
Single Small Firm Single Large Firm Family Small Firm Family Large Firm
Source: Kaiser/HRET Survey of Employer-Sponsored Health Benefits, 1999-2010.

Average Percentage Worker Contributions Towards Premiums Single and Family Coverage, by Firm Size
0%
5%
10%
15%
20%
25%
30%
35%
40%
1999 2000 2001 2002 2003 2004 2005 2006 2007 2008 2009 2010
Single Small Firm Single Large Firm Family Small Firm Family Large Firm
Source: Kaiser/HRET Survey of Employer-Sponsored Health Benefits, 1999-2010.

Percent of Covered Workers Contributing at Least 50% of Premium, Single and Family Coverage, by Firm Size
0%
5%
10%
15%
20%
25%
30%
35%
40%
45%
1999 2000 2001 2002 2003 2004 2005 2006 2007 2008 2009 2010
Single Small Firm Single Large Firm Family Small Firm Family Large Firm
Source: Kaiser/HRET Survey of Employer-Sponsored Health Benefits, 1999-2010.
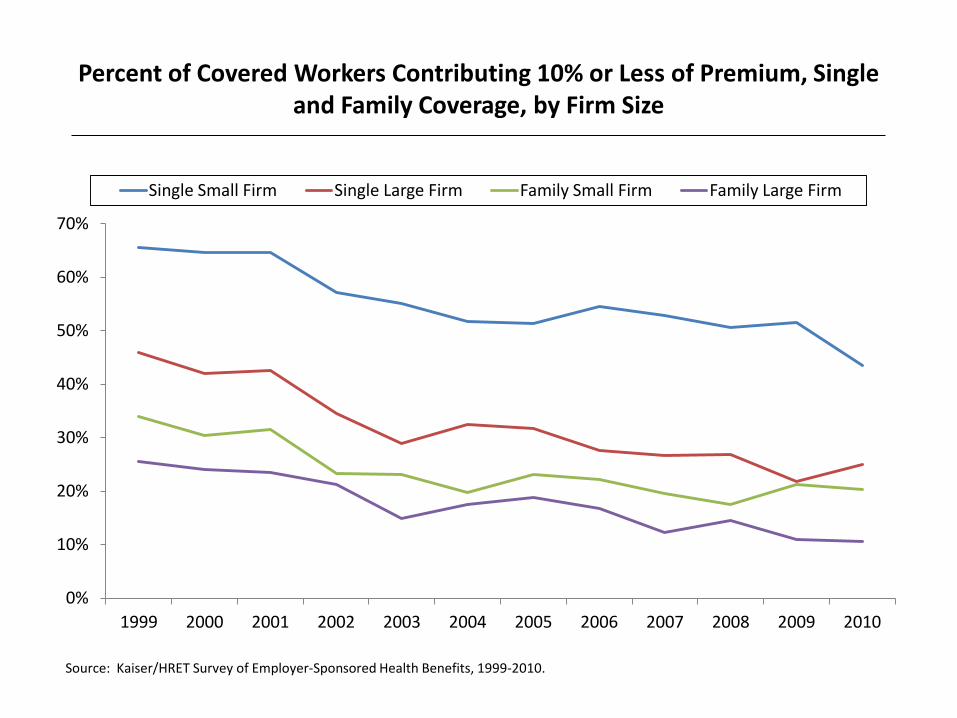
Percent of Covered Workers Contributing 10% or Less of Premium, Single and Family Coverage, by Firm Size
0%
10%
20%
30%
40%
50%
60%
70%
1999 2000 2001 2002 2003 2004 2005 2006 2007 2008 2009 2010
Single Small Firm Single Large Firm Family Small Firm Family Large Firm
Source: Kaiser/HRET Survey of Employer-Sponsored Health Benefits, 1999-2010.

2% 2% 4% 3% 3%
5% 3% 4%*
8%*
3% 6%
8% 7%* 6%
13%*
0%
10%
20%
30%
40%
50%
HDHP/HRA HSA-Qualified HDHP HDHP/SO
2006 2007 2008 2009 2010
Percent of Covered Workers Enrolled in an HDHP/HRA or HSA-
Qualified HDHP
* Estimate is statistically different from estimate for the previous year shown (p<.05). Source: Kaiser/HRET Survey of Employer-Sponsored Health Benefits, 2006-2010.

16% 21%*
35%* 40%
46%
6% 8% 9% 13%*
17% 10% 12%*
18%*
22%*
27%*
0%
10%
20%
30%
40%
50%
2006 2007 2008 2009 2010
Small Firms Large Firms All Firms
Percent of Covered Workers in a Plan with a General Annual Deductible of $1,000 or More for Single Coverage, By Firm Size
*Estimate is statistically different from estimate for the previous year shown (p<.05).
Note: These estimates include workers enrolled in HDHP/SO and other plan types. Because we do not collect information on the attributes of conventional plans, to be conservative, we assumed that workers in conventional plans do not have a deductible of $1,000 or more. Because of the low enrollment in conventional plans, the impact of this assumption is minimal. Average general annual health plan deductibles for PPOs, POS plans, and HDHP/SOs are for in-network services. Source: Kaiser/HRET Survey of Employer-Sponsored Health Benefits, 2006-2011.

6% 7%
12%*
16% 20%
1% 1% 2%
3%* 4%
3% 3%
5%* 7%*
10%
0%
10%
20%
30%
40%
50%
2006 2007 2008 2009 2010
Small Firms Large Firms All Firms
Percent of Covered Workers in a Plan with a General Annual Deductible of $2,000 or More for Single Coverage, By Firm Size
*Estimate is statistically different from estimate for the previous year shown (p<.05).
Note: These estimates include workers enrolled in HDHP/SO and other plan types. Because we do not collect information on the attributes of conventional plans, to be conservative, we assumed that workers in conventional plans do not have a deductible of $2,000 or more. Because of the low enrollment in conventional plans, the impact of this assumption is minimal. Source: Kaiser/HRET Survey of Employer-Sponsored Health Benefits, 2006-2011.

7%
6%
6%
4%
21%
23%
18%
13%
23%
20%
18%
18%
18%
18%
21%
21%
9%
9%
11%
13%
22%
23%
26%
31%
0% 10% 20% 30% 40% 50% 60% 70% 80% 90% 100%
2007
2008
2009
2010
$999 or Less $1,000-$1,499
$1,500-$1,999 $2,000-$2,499
$2,500-$2,999 $3,000 or More (with a Specified Limit)
Among Covered Workers with an Out-of-Pocket Maximum for Single Coverage, Distribution of Out-of-Pocket Maximums, by Plan Type
2007-2010
Note: Distributions are among covered workers facing a specified limit for out-of-pocket maximum amounts. Source: Kaiser/HRET Survey of Employer-Sponsored Health Benefits, 2007-2011.
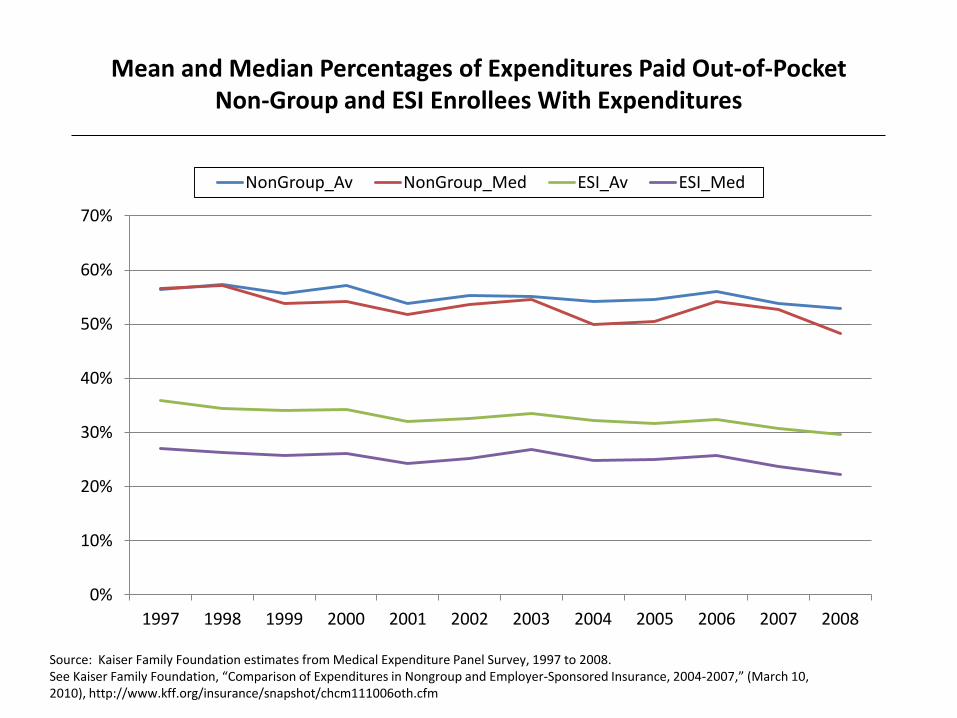
Mean and Median Percentages of Expenditures Paid Out-of-Pocket Non-Group and ESI Enrollees With Expenditures
0%
10%
20%
30%
40%
50%
60%
70%
1997 1998 1999 2000 2001 2002 2003 2004 2005 2006 2007 2008
NonGroup_Av NonGroup_Med ESI_Av ESI_Med
Source: Kaiser Family Foundation estimates from Medical Expenditure Panel Survey, 1997 to 2008. See Kaiser Family Foundation, “Comparison of Expenditures in Nongroup and Employer-Sponsored Insurance, 2004-2007,” (March 10, 2010), http://www.kff.org/insurance/snapshot/chcm111006oth.cfm
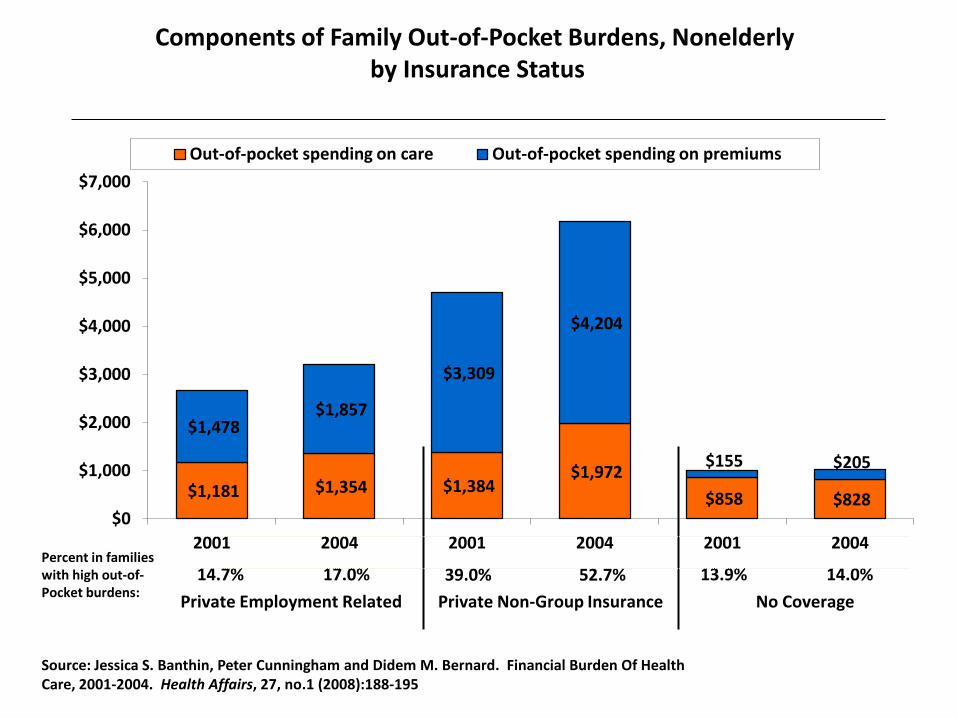
$1,181 $1,354 $1,384 $1,972
$858 $828
$1,478 $1,857
$3,309
$4,204
$155 $205
$0
$1,000
$2,000
$3,000
$4,000
$5,000
$6,000
$7,000
2001 2004 2001 2004 2001 2004
Out-of-pocket spending on care Out-of-pocket spending on premiums
Private Employment Related Private Non-Group Insurance No Coverage
Components of Family Out-of-Pocket Burdens, Nonelderly by Insurance Status
Source: Jessica S. Banthin, Peter Cunningham and Didem M. Bernard. Financial Burden Of Health Care, 2001-2004. Health Affairs, 27, no.1 (2008):188-195
Percent in families with high out-of- Pocket burdens:
14.7% 17.0% 39.0% 52.7% 13.9% 14.0%
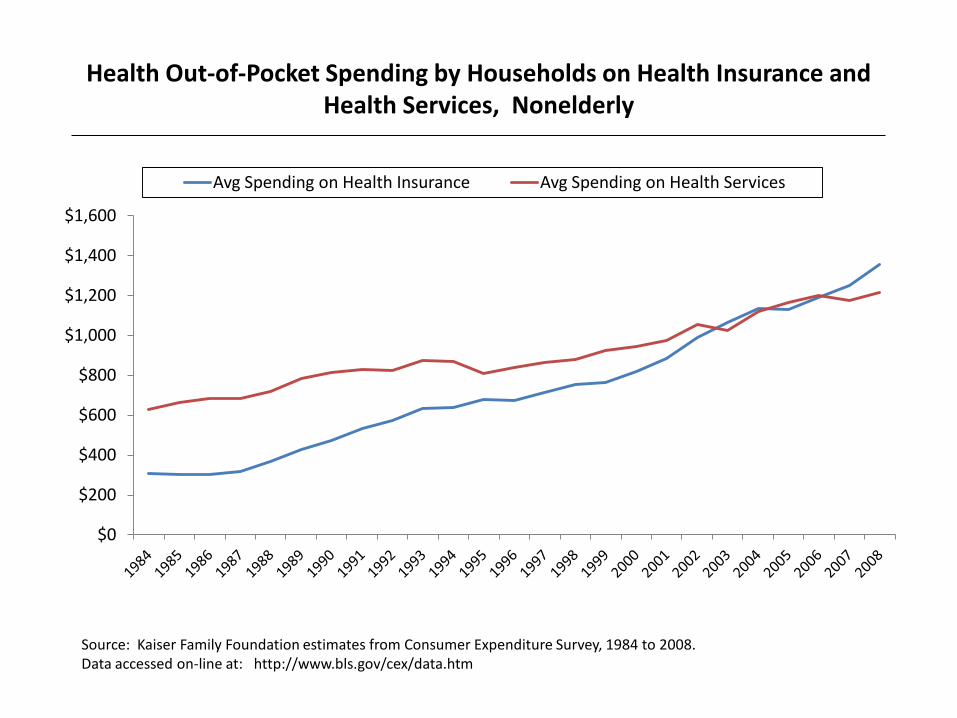
Health Out-of-Pocket Spending by Households on Health Insurance and Health Services, Nonelderly
$0
$200
$400
$600
$800
$1,000
$1,200
$1,400
$1,600
Avg Spending on Health Insurance Avg Spending on Health Services
Source: Kaiser Family Foundation estimates from Consumer Expenditure Survey, 1984 to 2008. Data accessed on-line at: http://www.bls.gov/cex/data.htm

Share of Out-of-Pocket Spending by Households on Health Insurance and Health Services, Nonelderly
0%
10%
20%
30%
40%
50%
60%
70%
80%
Share of Health Spending on Insurance Share of Health Spending on Services
Source: Kaiser Family Foundation estimates from Consumer Expenditure Survey, 1984 to 2008. Data accessed on line at: http://www.bls.gov/cex/data.htm
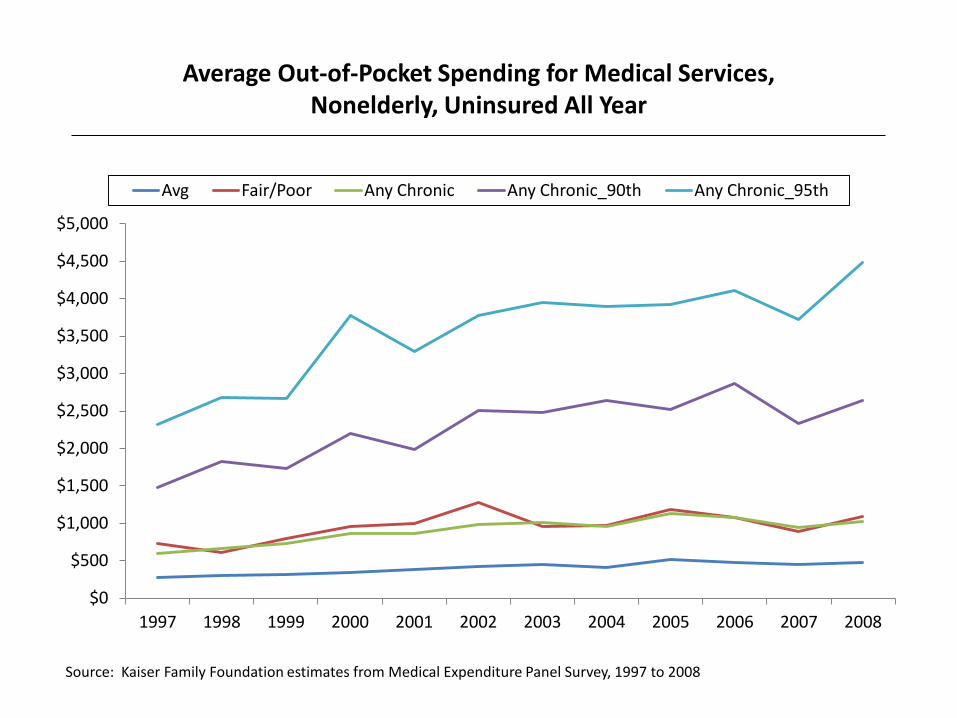
Average Out-of-Pocket Spending for Medical Services, Nonelderly, Uninsured All Year
$0
$500
$1,000
$1,500
$2,000
$2,500
$3,000
$3,500
$4,000
$4,500
$5,000
1997 1998 1999 2000 2001 2002 2003 2004 2005 2006 2007 2008
Avg Fair/Poor Any Chronic Any Chronic_90th Any Chronic_95th
Source: Kaiser Family Foundation estimates from Medical Expenditure Panel Survey, 1997 to 2008

Incorporating Assets into Calculations of Financial Burdens
for Health
Jessica Banthin
And
Didem Bernard
Views expressed in this presentation are those of the authors and no official endorsement by the CBO, AHRQ, or HHS is intended or should be inferred.
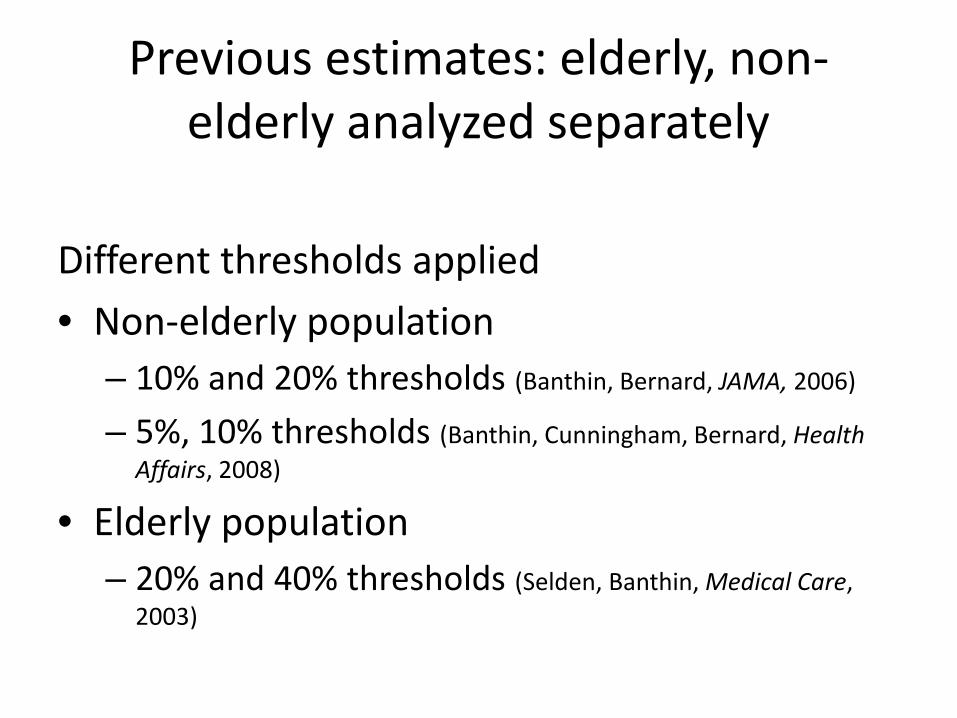
Previous estimates: elderly, non-elderly analyzed separately
Different thresholds applied
• Non-elderly population – 10% and 20% thresholds (Banthin, Bernard, JAMA, 2006)
– 5%, 10% thresholds (Banthin, Cunningham, Bernard, Health Affairs, 2008)
• Elderly population – 20% and 40% thresholds (Selden, Banthin, Medical Care,
2003)

Why differentiate between elderly and non-elderly?
• Younger families have – Higher incomes – Higher expenses (work, children) – Expected to save for future retirement – Better health
• Older families have – Lower incomes (retired) – Fewer expenses (no work, children) – Worse health – Expected to draw down assets in later years

Two questions
• How is a reasonable threshold defined for both elderly and non-elderly populations that indicates high burden (or high medical risk)?
• How do we incorporate the accumulated savings of retired families into our measure of resources available for financing health care expenditures?

Self-employed
• Do the self-employed have such high levels of assets (including business assets) that they warrant a separate approach in measuring health care burdens?
Data and Methods
• Medical Expenditure Panel Survey
• Pooled Panels 10-12, 2005-2008
• Information on income, assets, out of pocket expenditures on health care services, out of pocket premium payments
Construction of OOP Burden
• Followed methods of previous papers
• Family level concept
• Numerator = sum of all family member OOP spending on services and premiums
• Denominator = family income
• Burden is the share of family income spent on medical care
• We do not truncate resulting values

Adding 5% of Net Asset Value to Income
• We add 5% of total net family assets to family income for elderly families only
• No adjustment for non-elderly
• Better measure of total resources available to elderly individuals for medical care

Table 1: Median and 75th percentile OOP burdens elderly vs non-elderly, 2008
Elderly median
Elderly 75th pctl
Non-Elderly median
Non-Elderly 75th pctl
All 10.7 20.7 2.9 7.0
Poor 13.5 58.0 2.7 19.1
Low Income 16.5 28.0 2.6 9.0
Middle Income 13.2 20.3 3.7 8.1
High Income 6.4 10.5 2.6 5.0

Table 2. Distribution of Total Net Family Assets, Elderly vs Non-elderly, 2008$
Percentile Elderly Non-elderly
10 -8 -300
20 5,000 0
30 37,400 1,500
40 88,200 6,400
50 146,300 20,200
60 215,100 53,800
70 298,600 111,100
80 450,600 210,200
90 796,600 432,100
95 1,226,400 729,100

Table 2A: Median Total Net Assets by Poverty Group, Elderly v Non-elderly, 2008$
Poverty Group Elderly Non-Elderly
All groups 146,300 20,200
Poor 20,700 0
Low Income 77,300 2,300
Middle Income 136,500 15,500
High Income 355,400 133,800

Table 3A. Percent of individuals with high OOP burdens, elderly v non-elderly, 2008
Poverty Group 10% of family income 20% of family income
All Elderly 52.5 26.1
Non-elderly 17.0 7.7
Poor Elderly 54.1 43.5
Non-Elderly 33.2 24.5
Low Income Elderly 70.8 40.7
Non-Elderly 22.4 10.2
Middle Income Elderly 63.5 26.0
Non-elderly 18.8 5.9
High Income Elderly 27.4 7.8
Non-elderly 7.5 2.1

Table 3B. Family income before and after addition of 5% of assets, 2008
Poverty Group Family Income Adjusted Family Income
All Elderly 41,600 57,600
Non-elderly 53,800
Poor Elderly 6,600 12,000
Non-Elderly 7,300
Low Income Elderly 15,400 22,600
Non-Elderly 20,500
Middle Income Elderly 30,300 41,800
Non-elderly 40,100
High Income Elderly 85,200 116,200
Non-elderly 96,100

Table 3C. Percent of individuals with high OOP burdens, elderly v non-elderly, 2008
Poverty Group 10% of adjusted family income
20% of adjusted family income
All Elderly 40.0 16.5
Non-elderly 17.0 7.7
Poor Elderly 43.5 28.6
Non-Elderly 33.2 24.5
Low Income Elderly 57.4 26.6
Non-Elderly 22.4 10.2
Middle Income Elderly 48.5 15.4
Non-elderly 18.8 5.9
High Income Elderly 17.0 4.9
Non-elderly 7.5 2.1

Table 3D. Percent of individuals with high OOP burdens, elderly v non-elderly, 2008
Poverty Group Non-elderly 10% of family income
Elderly 20% of adjusted family income
All 17.0 16.5
Poor 33.2 28.6
Low Income 22.4 26.6
Middle Income 18.8 15.4
High Income 7.5 4.9

Self-employed vs non-self-employed
• Slightly higher burdens
• Higher levels of assets
• Higher average incomes

Table 4: Median and 75th percentile OOP burdens self-employed vs non, 2008
Self-employed median
Self-employed 75th pctl
Non-S/E median
Non-S/E 75th pctl
All 3.3 8.1 2.9 6.8
Poor 2.4 22.6 2.7 19.0
Low Income 3.3 12.6 2.5 8.6
Middle Income 4.2 9.9 3.7 7.9
High Income 3.0 6.6 2.5 4.8

Table 5A. Distribution of Total Net Family Assets, Self-employed v Non-S/E, 2008$
Percentile Self-employed Non-S/E
10 -100 -600
20 5,300 0
30 29,100 800
40 71,500 4,800
50 131,800 13,800
60 211,100 39,500
70 333,700 86,900
80 543,700 173,400
90 985,400 357,900
95 1,702,500 581,300

Table 5B. Distribution of Net Family Business Assets, Self-employed v Non-S/E, 2008$
Percentile Self-employed Non-S/E
10 -1800 -
20 -1500 -
30 -1300 -
40 -1100 -
50 -800 -
60 -600 -
70 -300 -
80 -40 -
90 213,600 -
95 468,800 -

Table 6. Percent of individuals with high OOP burdens, self-employed v non-S/E, 2008
Poverty Group 10% of family income 20% of family income
All Self-employed 20.1 7.6
Non-S/E 16.6 7.7
Poor Self-employed 33.2 27.3
Non-S/E 33.2 24.3
Low Income Self-employed 29.6 15.1
Non-S/E 21.5 9.6
Middle Income Self-employed 25.0 7.0
Non-S/E 17.9 5.7
High Income Self-employed 12.2 2.6
Non-S/E 6.5 1.9

Conclusion
• Further work needed to refine method of incorporating assets into income for elderly families
• Defining different thresholds for elderly vs. non-elderly age groups is another approach worth consideration
• Self-employed do not warrant special methods for assessing their medical care risk

The Measurement of Health Care Spending Risk in the Health and Retirement Study
Michael D. Hurd
RAND, NBER, NETSPAR, MEA
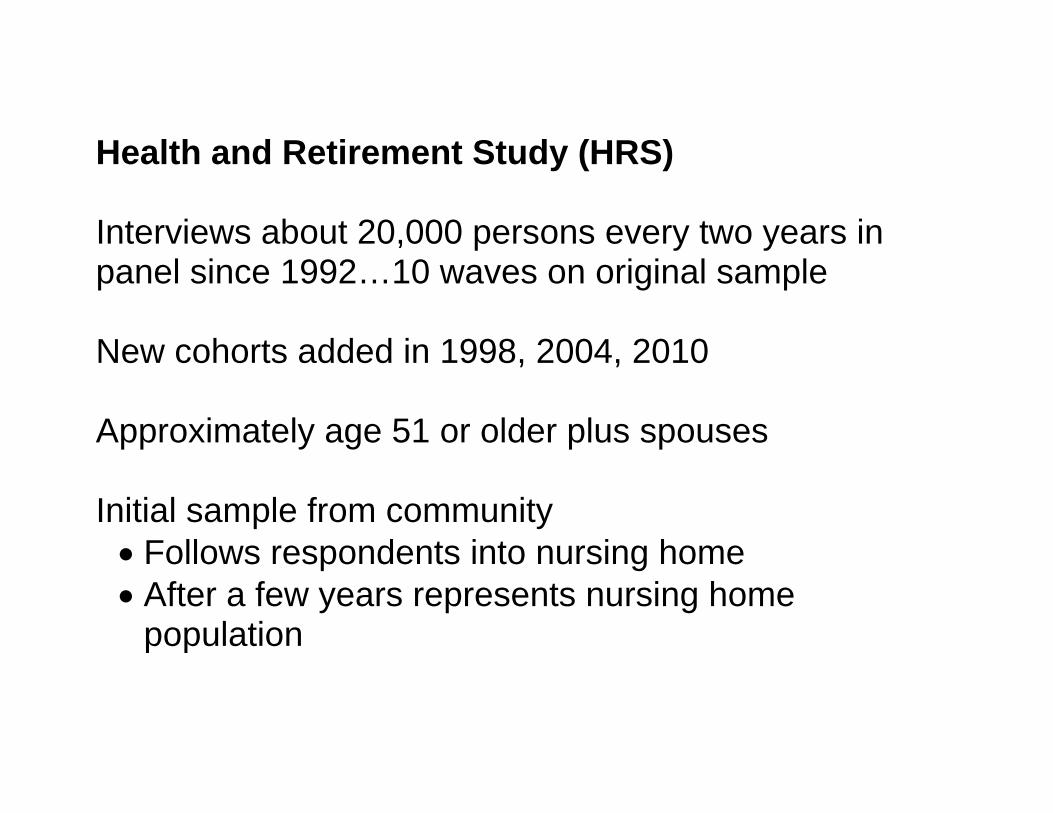
Health and Retirement Study (HRS) Interviews about 20,000 persons every two years in panel since 1992…10 waves on original sample New cohorts added in 1998, 2004, 2010 Approximately age 51 or older plus spouses Initial sample from community Follows respondents into nursing home After a few years represents nursing home
population

Health and Retirement Study (HRS) Considerable effort to measure income and wealth, including pensions. Matches CPS income very well Matches Survey of Consumer Finances pretty well expect at top. Linked to Social Security records

HRS additional content labor market activity family linkages health conditions including cognition use of health care services out-of-pocket spending for health care services formal and informal help
o who gives care: spouse, daughter etc or paid o out-of-pocket cost if paid
linked at individual level to Medicare data etc…

Out-of-pocket spending from HRS core interview “Did you have any nights in hospital?” (last two years) If “yes” were all costs paid by insurance? If “no” what were out-of-pocket costs? Hospital Nursing home Doctor Dentist Outpatient surgery Average monthly prescription drugs Home health care Special services/facilities (adult day care etc.)

HRS out-of-pocket spending compared with MEPS and MCBS Standardize on age 75-79
Annual per person out-of-pocket spending by non-institutionalized population. Age 75-79. Year 2003 (HRS
2004) n mean p50 p90 p95 p99
HRS 1982 2387 880 4075 6015 21650
MCBS 1934 1658 923 3373 5038 11908
MEPS 762 1626 887 3553 5016 9826
HRS has higher mean due to large values above median. Due to prescription drug costs.
Measurement of prescription drug costs is difficult
Improved in HRS 2006 and later

Non-drug out-of-pocket spending for health care
Annual per person non-drug out-of-pocket spending by non-institutionalized population. Age 75-79. Year 2003.
Mean P90 P95 P99HRS 661 1500 2424 6600MEPS 695 1451 2936 4961MCBS 1104 2390 4100 10999
HRS and MEPS comparable except at very top

But need institutionalized population also
Annual per person out-of-pocket spending by non-institutionalized and institutionalized population. Age 75-
79. Year 2003
N mean p50 p75 p90 p95 p99
HRS 2024 2566 892 2080 4200 6426 30050MCBS 2016 2136 946 1924 3897 6189 29939
HRS and MCBS very close. But HRS has much higher prescriptions drug costs.

Annual per person non-drug out-of-pocket spending by non-institutionalized and institutionalized population.
Age 75-79. Year 2003 N mean p50 p75 p90 p95 p99HRS 2024 828 150 542 1500 2500 12861MCBS 2016 1599 393 1040 2935 5403 29058

Conclusion about measurement in HRS
Non-institutionalized population HRS 2004 compared with 2003 MEPS and 2003 MCBS
Total in HRS higher due to much higher drug costs in right tail of distribution
Non-drug out-of-pocket spending
HRS and MEPS similar; MCBS considerably higher

Non-institutionalized and institutionalized population HRS 2004 compared with 2003 MCBS
Total spending similar
Non-drug out-of-pocket spending considerably higher in MCBS

Persistence of spending over time
Percent distribution of out-of-pocket spending in wave t conditional on spending quartile in wave t-1, HRS
waves 1998, 2000, 2002 and 2004. Single persons. Panel
quartile in wave t quartile in wave t-1
lowest 2nd 3rd highest all
lowest 58.8 20.8 11.8 8.7 100.02nd 19.9 41.2 24.7 14.1 100.03rd 9.3 23.9 39.9 26.9 100.0highest 8.6 12.3 24.7 54.5 100.0

Percent distribution of spending in wave t conditional on spending quartile in wave t-1, HRS waves 1998, 2000,
2002 and 2004. Married persons. Panel quartile in wave t quartile in wave t-1
lowest 2nd 3rd highest all
lowest 47.1 26.4 15.6 11.0 100.02nd 22.2 33.0 26.1 18.8 100.03rd 13.3 24.1 34.3 28.2 100.0highest 10.9 17.4 26.5 45.1 100.0

Application: economic preparation for retirement with and without health care spending risk

Economic Preparation for Retirement
Michael D. Hurd
RAND, NBER, NETSPAR and MEA
Susann Rohwedder
RAND and NETSPAR

Initial population 66-69 Individuals and couples follow life-cycle spending paths estimated from panel spending data
o Paths differ by marital status o Differ by education level o Individual or couples life-cycle spending path
anchored at observed initial spending Can their economic resources support that path with high probability?

Account for Stochastic mortality: differs by sex, age, education
and marital status Taxes Returns-to-scale in consumption
o At death of one spouse surviving spouse reduces spending, follows spending path of single persons
Level and risk of out-of-pocket spending for health care
o Serial correlation that varies with sex, age, education and marital status (estimated from MCBS)
Simulation of consumption and out-of-pocket spending. Individual or couple is adequately prepared if chances of dying with positive wealth are 95% or greater. Allow for 10% reduction in initial spending.

Couples. 66-69. Rest-of-lifetime resources (thousands
2008$)
Ninitial
wealth
PV future
earningsPV
annuities Total< high-school 187 284.6 14.0 265.4 564high-school 474 499.2 16.5 395.7 911.4some college 223 1,024.5 22.7 477.6 1524.8college + 208 1,406.7 56.7 651.0 2114.4all 1,092 742.6 25.0 438.7 1206.3

Couples. 66-69. Rest-of-lifetime spending (thousands
2008$) PV
taxesPV
consumption PV total
spendingExcess
resources< high-school
27.9 321.2 349.1 214.9
high-school 75.7 441.9 517.6 393.8some college
227.9 595.9 823.8 701.0
college + 319.2 880.4 1199.6 914.8all 145 536.2 681.2 525.1

Economic preparation for retirement with and without health–care spending risk. Mean spending for health care unchanged

Percent of single persons age 66-69 adequately
prepared for retirement, with and without health care spending risk
without with Less than high-school 43.3 36.0High-school 66.9 62.1Some college 63.6 53.8College and above 74.2 68.5All 61.1 54.5 Just 29% of single women lacking high school adequately prepared.

Percent of married persons age 66-69 adequately
prepared for retirement, with and without health care spending risk
without withLess than high-school 72.7 70.1High-school 82.3 79.5Some college 86.1 80.7College and above 89.4 88.5All 82.8 79.9

Conclusions Health care spending risk has noticeable effects but possibly not as great as expected First-order serial correlation may not allow enough life-time risk.
Have enough data (almost) to estimate nonparametrically rest-of-lifetime risk E.g. Age 61 in 1992 will be 81 in next HRS wave

Financial Burden of Medical Care Among the Elderly in Transitioning to
Long-Term Care: Estimates from the National Long Term
Care Survey
Eric Stallard
Center for Population Health and Aging Duke Population Research Institute & Social Science Research
Institute, Duke University
Workshop on Developing a Measure of Medical Care Economic Risk National Academies Keck Center, Washington, DC
September 8, 2011
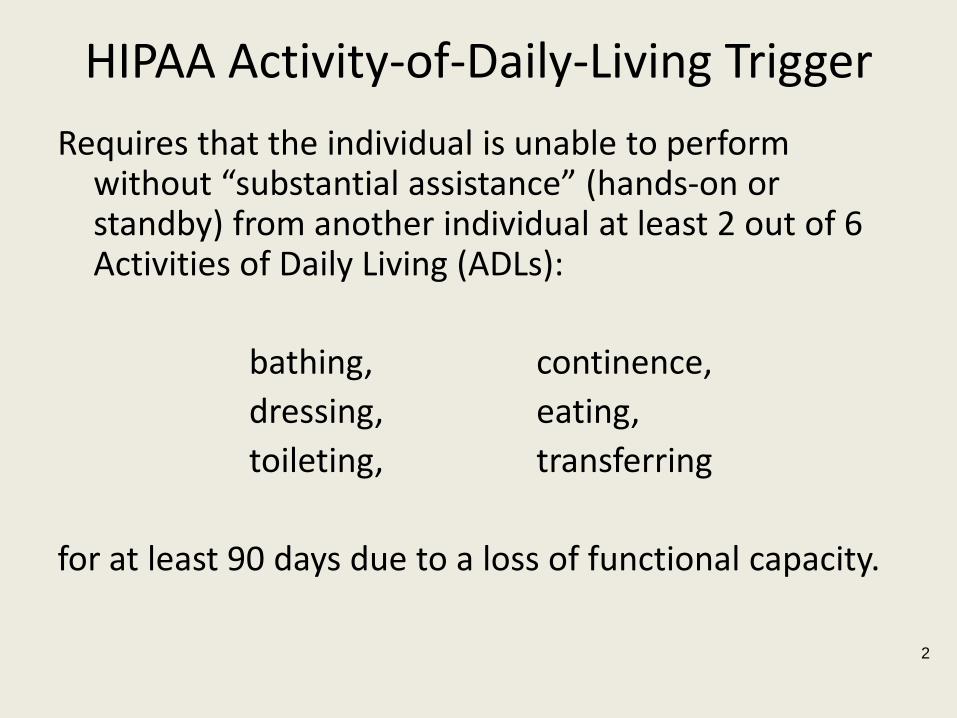
HIPAA Activity-of-Daily-Living Trigger
Requires that the individual is unable to perform without “substantial assistance” (hands-on or standby) from another individual at least 2 out of 6 Activities of Daily Living (ADLs):
bathing, continence, dressing, eating, toileting, transferring
for at least 90 days due to a loss of functional capacity.
2

HIPAA Cognitive-Impairment Trigger Requires that the individual requires “substantial supervision” to protect him/herself from threats to health and safety due to “severe cognitive impairment,” defined as:
A loss or deterioration in intellectual capacity that is (a) comparable to (and includes) Alzheimer’s disease and similar
forms of irreversible dementia, and
(b) measured by clinical evidence and standardized tests that reliably measure impairment in the individual’s
(i) short-term or long-term memory,
(ii) orientation as to people, places, or time, and
(iii) deductive or abstract reasoning. 3
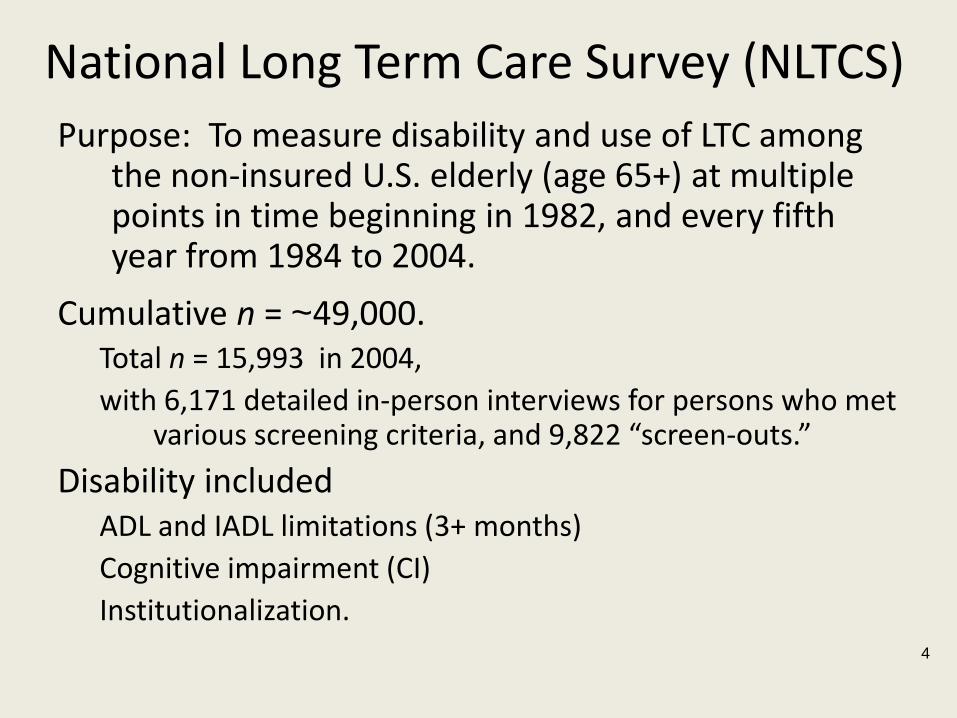
National Long Term Care Survey (NLTCS) Purpose: To measure disability and use of LTC among
the non-insured U.S. elderly (age 65+) at multiple points in time beginning in 1982, and every fifth year from 1984 to 2004.
Cumulative n = ~49,000. Total n = 15,993 in 2004, with 6,171 detailed in-person interviews for persons who met
various screening criteria, and 9,822 “screen-outs.”
Disability included ADL and IADL limitations (3+ months) Cognitive impairment (CI) Institutionalization.
4

NLTCS IADLs
1. Doing laundry 2. Doing light housework 3. Getting around outdoors 4. Going places outside of walking distances 5. Making telephone calls 6. Managing money 7. Preparing meals 8. Shopping for groceries 9. Taking medications
5

NLTCS ADLs
1. Bathing 2. Continence 3. Dressing 4. Eating 5. Toileting 6. Transferring (in/out bed) 7. Inside mobility
– not included in the HIPAA ADL Trigger
6

7
Item & Sex Nondisabled ADL Only CI Only ADL & CITotal
Population
Mean AgeMales 75.2 79.5 82.5 81.7 75.7
Females 76.3 82.1 84.1 86.0 77.3
Standard DeviationMales 6.7 7.7 7.4 7.8 6.9
Females 7.1 8.6 7.9 7.3 7.7
*Note: The CI trigger was based on 3+ errors on the SPMSQ.
Source: Authors' calculations based on the 2004 NLTCS.
Mean and Standard Deviation of Current Age by HIPAA Disability Status -- Age 65 and Above, United States 2004, by
SexHIPAA Trigger*

Age No Yes Total Percent Std Error (Pct)65-69 8,249,343 239,296 8,488,639 2.8% 0.3%70-74 8,353,574 383,573 8,737,147 4.4% 0.4%75-79 7,023,298 600,636 7,623,934 7.9% 0.5%80-84 5,230,199 798,648 6,028,847 13.2% 0.7%85-89 2,602,925 849,078 3,452,003 24.6% 1.2%90-94 951,734 530,500 1,482,233 35.8% 2.0%95+ 178,647 253,875 432,523 58.7% 3.9%Total 32,589,719 3,655,606 36,245,325 10.1% 0.2%
Note: HIPAA Triggers are 2+ ADL Impariments or Severe Cognitive Impairment
Source: Authors' calculations based on the 2004 NLTCS.
Number and Percent of Persons Meeting Either HIPAA Trigger, United States 2004, Unisex, Age 65
and Above, by AgeMeets Either HIPAA Trigger
8

Age No Yes Total Percent Std Error (Pct)65-69 8,302,057 186,582 8,488,639 2.2% 0.3%70-74 8,404,035 333,111 8,737,147 3.8% 0.3%75-79 7,139,472 484,462 7,623,934 6.4% 0.5%80-84 5,389,370 639,477 6,028,847 10.6% 0.7%85-89 2,782,747 669,256 3,452,003 19.4% 1.1%90-94 1,058,680 423,553 1,482,233 28.6% 1.9%95+ 211,606 220,917 432,523 51.1% 4.0%Total 33,287,967 2,957,359 36,245,325 8.2% 0.2%
Note: HIPAA Triggers are 2+ ADL Impariments or Severe Cognitive Impairment
Source: Authors' calculations based on the 2004 NLTCS.
Number and Percent of Persons Meeting HIPAA ADL Trigger, United States 2004, Unisex, Age 65 and
Above, by AgeMeets HIPAA ADL Trigger
9

10
Age No Yes Total Percent Std Error (Pct)65-69 8,384,960 103,679 8,488,639 1.2% 0.2%70-74 8,539,577 197,570 8,737,147 2.3% 0.3%75-79 7,247,763 376,171 7,623,934 4.9% 0.4%80-84 5,482,051 546,796 6,028,847 9.1% 0.6%85-89 2,840,985 611,018 3,452,003 17.7% 1.1%90-94 1,086,664 395,569 1,482,233 26.7% 1.9%95+ 239,316 193,207 432,523 44.7% 3.9%Total 33,821,316 2,424,010 36,245,325 6.7% 0.2%
Note: HIPAA Triggers are 2+ ADL Impariments or Severe Cognitive Impairment
Source: Authors' calculations based on the 2004 NLTCS.
Number and Percent of Persons Meeting HIPAA CI Trigger, United States 2004, Unisex, Age 65 and
Above, by AgeMeets HIPAA CI Trigger
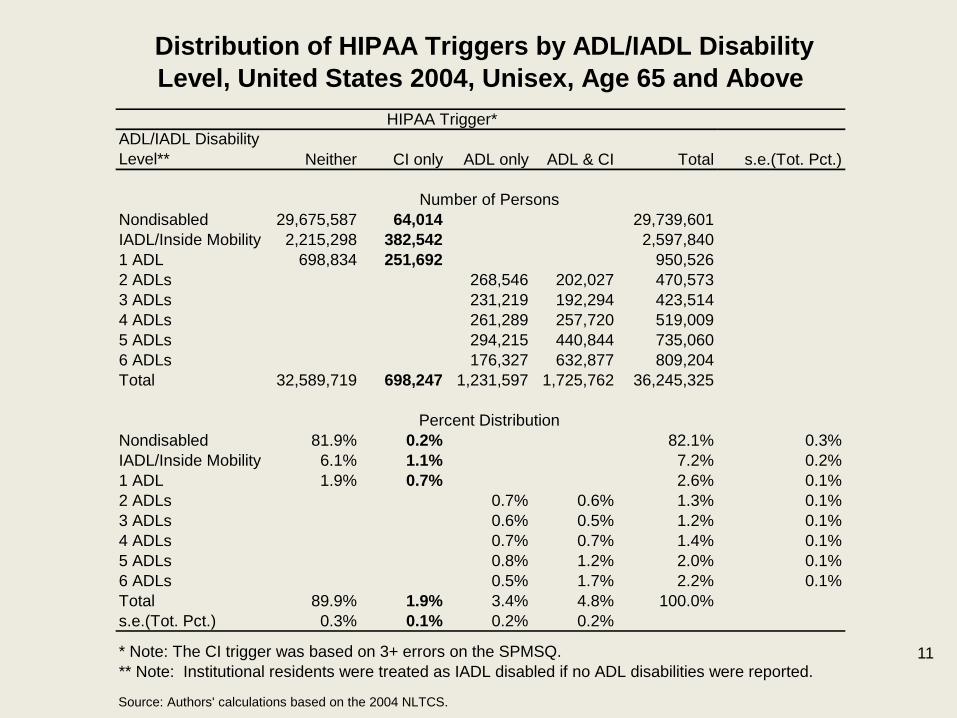
ADL/IADL Disability Level** Neither CI only ADL only ADL & CI Total s.e.(Tot. Pct.)
Number of PersonsNondisabled 29,675,587 64,014 29,739,601IADL/Inside Mobility 2,215,298 382,542 2,597,8401 ADL 698,834 251,692 950,5262 ADLs 268,546 202,027 470,5733 ADLs 231,219 192,294 423,5144 ADLs 261,289 257,720 519,0095 ADLs 294,215 440,844 735,0606 ADLs 176,327 632,877 809,204Total 32,589,719 698,247 1,231,597 1,725,762 36,245,325
Percent DistributionNondisabled 81.9% 0.2% 82.1% 0.3%IADL/Inside Mobility 6.1% 1.1% 7.2% 0.2%1 ADL 1.9% 0.7% 2.6% 0.1%2 ADLs 0.7% 0.6% 1.3% 0.1%3 ADLs 0.6% 0.5% 1.2% 0.1%4 ADLs 0.7% 0.7% 1.4% 0.1%5 ADLs 0.8% 1.2% 2.0% 0.1%6 ADLs 0.5% 1.7% 2.2% 0.1%Total 89.9% 1.9% 3.4% 4.8% 100.0%s.e.(Tot. Pct.) 0.3% 0.1% 0.2% 0.2%
Source: Authors' calculations based on the 2004 NLTCS.
Distribution of HIPAA Triggers by ADL/IADL Disability Level, United States 2004, Unisex, Age 65 and Above
HIPAA Trigger*
* Note: The CI trigger was based on 3+ errors on the SPMSQ.** Note: Institutional residents were treated as IADL disabled if no ADL disabilities were reported.
11

SPMSQ Score Neither CI only ADL only ADL & CI Total s.e.(Tot. Pct.)
Number of PersonsMissing 24,546,440 149,057 302,665 1,100,733 26,098,8960-2 Errors 7,875,225 928,932 8,804,1563+ Errors 168,054 549,190 625,029 1,342,273Total 32,589,719 698,247 1,231,597 1,725,762 36,245,325
Percent DistributionMissing 67.7% 0.4% 0.8% 3.0% 72.0% 0.4%0-2 Errors 21.7% 2.6% 24.3% 0.4%3+ Errors 0.5% 1.5% 1.7% 3.7% 0.2%Total 89.9% 1.9% 3.4% 4.8% 100.0%s.e.(Tot. Pct.) 0.3% 0.1% 0.2% 0.2%
Source: Authors' calculations based on the 2004 NLTCS.
Distribution of HIPAA Triggers by SPMSQ Score, United States 2004, Unisex, Age 65 and Above
HIPAA Trigger*
* Note: The CI trigger was based on 3+ errors on the SPMSQ.
12

Disability Status 5 Years LaterInitial Disability Status I. Non-
disabled II. Mild/ Moderate Disability
III. HIPAA
ADL only
IV. HIPAA CI only
V. HIPAA
ADL + CI
VI. Dead Sample Size
I. Nondisabled 66.3 9.5 3.6 1.3 2.5 16.7 18,683 II. Mild/moderate disability 7.0 34.0 10.9 3.5 8.4 36.2 5,551 III. HIPAA ADL only 1.1 7.7 18.2 0.8 8.5 63.8 2,931 IV. HIPAA CI only 3.4 10.2 5.8 10.6 24.9 45.1 783 V. HIPAA ADL + CI --- 1.2 3.6 1.0 22.8 71.1 1,953
I. Nondisabled 65.2 7.1 3.0 1.3 1.7 21.8 8,096 II. Mild/moderate disability 8.6 27.0 8.9 3.2 7.4 44.9 1,658 III. HIPAA ADL only --- 7.0 14.0 --- 9.4 67.1 938 IV. HIPAA CI only --- 9.3 5.0 6.4 18.6 53.4 237 V. HIPAA ADL + CI --- --- --- --- 16.1 79.3 529
I. Nondisabled 67.3 11.3 4.1 1.3 3.1 12.9 10,587 II. Mild/moderate disability 6.3 37.0 11.7 3.6 8.9 32.5 3,893 III. HIPAA ADL only 0.9 8.0 20.4 0.6 7.9 62.2 1,993 IV. HIPAA CI only --- 10.7 6.2 12.7 27.9 41.0 546 V. HIPAA ADL + CI --- 1.2 4.3 1.1 25.4 67.9 1,424
Source: Stallard (2011), based on 1984-1994 NLTCS.
Unisex and Sex-Specific Disability Transition Rates (%)
Unisex
Males
Females
Note: "---" denotes suppressed cell with fewer than 11 sample persons. Suppression was applied only to the printed tables; the actual values were used in subsequent analyses.
13

Disability Group
Item
Mild/ Moderate Disability
HIPAA ADL only
HIPAA CI only
HIPAA ADL + CI
For Services Provided in a Nursing Home Percent Residing in Nursing Home 3.8% 39.3% 13.4% 64.0%
Annual Cost of Nursing Home Services Per Capita $1,482 $24,146 $4,842 $45,241
For Services Provided in the Community Percent Residing in Community 96.2% 60.7% 86.6% 36.0% Percent with One or More Community Helpers 78.9% 60.5% 74.7% 36.0% Average Annual Hours of Community Care Per Capita 639 1703 805 1427 Percent with Paid Community Helpers 23.1% 26.1% 20.3% 15.2% Average Annual Hours of Paid Community Care Per Capita 95 418 96 359
Average Annual Cost of Paid Community Care Per Capita $1,320 $5,754 $1,320 $5,050
Percent with Out-Of-Pocket (OOP) Payments for Community Care 15.5% 13.7% 11.6% 8.2%
Average Annual Cost of OOP Payments for Community Care Per Capita $402 $1,643 $598 $1,360
Average Annual Hours of Unpaid Community Care Per Capita 544 1286 709 1068
Source: Based on Stallard (2011).
LTC Intensity and Cost Parameters for Disabled Persons, by Disability Group, Unisex
Note: All costs were converted from nominal 1994 dollars to constant 2010 dollars using an inflation factor of 1.290 based on the CPI-U Hospital and Related Services Index (inflation factor = 1.103 for Sept. 1994 to Dec. 1996) and the CPI-U Nursing Homes and Adult Day Services Index (inflation factor = 1.770 for Dec. 1996 to CY 2010).
14

Disability Group
Item
Mild/ Moderate Disability
HIPAA ADL only
HIPAA CI only
HIPAA ADL + CI
For Services Provided in a Nursing Home Percent Residing in Nursing Home 4.1% 30.4% 11.9% 55.9%
Annual Cost of Nursing Home Services Per Capita $1,496 $18,747 $4,564 $34,021
For Services Provided in the Community Percent Residing in Community 95.9% 69.6% 88.1% 44.1% Percent with One or More Community Helpers 80.8% 69.1% 73.3% 44.1% Average Annual Hours of Community Care Per Capita 828 2001 912 1689 Percent with Paid Community Helpers 15.3% 25.0% 18.8% 14.8% Average Annual Hours of Paid Community Care Per Capita 69 349 89 267
Average Annual Cost of Paid Community Care Per Capita $1,051 $4,945 $1,265 $3,875
Percent with Out-Of-Pocket (OOP) Payments for Community Care 10.1% 12.4% 11.0% 8.5%
Average Annual Cost of OOP Payments for Community Care Per Capita $235 $772 $405 $1,254
Average Annual Hours of Unpaid Community Care Per Capita 759 1652 823 1422
Source: Based on Stallard (2011).
LTC Intensity and Cost Parameters for Disabled Persons, by Disability Group, Males
Note: All costs were converted from nominal 1994 dollars to constant 2010 dollars using an inflation factor of 1.290 based on the CPI-U Hospital and Related Services Index (inflation factor = 1.103 for Sept. 1994 to Dec. 1996) and the CPI-U Nursing Homes and Adult Day Services Index (inflation factor = 1.770 for Dec. 1996 to CY 2010).
15

Disability Group
Item
Mild/ Moderate Disability
HIPAA ADL only
HIPAA CI only
HIPAA ADL + CI
For Services Provided in a Nursing Home Percent Residing in Nursing Home 3.7% 43.5% 14.2% 67.0%
Annual Cost of Nursing Home Services Per Capita $1,468 $26,727 $5,049 $49,296
For Services Provided in the Community Percent Residing in Community 96.3% 56.5% 85.8% 33.0% Percent with One or More Community Helpers 78.2% 56.4% 75.4% 33.0% Average Annual Hours of Community Care Per Capita 558 1562 743 1329 Percent with Paid Community Helpers 26.5% 26.6% 21.0% 15.3% Average Annual Hours of Paid Community Care Per Capita 107 451 99 393
Average Annual Cost of Paid Community Care Per Capita $1,440 $6,137 $1,347 $5,487
Percent with Out-Of-Pocket (OOP) Payments for Community Care 17.8% 14.3% 11.9% 8.1%
Average Annual Cost of OOP Payments for Community Care Per Capita $474 $2,069 $697 $1,403
Average Annual Hours of Unpaid Community Care Per Capita 452 1111 643 937
Source: Based on Stallard (2011).
LTC Intensity and Cost Parameters for Disabled Persons, by Disability Group, Females
Note: All costs were converted from nominal 1994 dollars to constant 2010 dollars using an inflation factor of 1.290 based on the CPI-U Hospital and Related Services Index (inflation factor = 1.103 for Sept. 1994 to Dec. 1996) and the CPI-U Nursing Homes and Adult Day Services Index (inflation factor = 1.770 for Dec. 1996 to CY 2010).
16

Lifetime LTC Costs – Age 65+
Expected lifetime costs (constant 2010 $s ) of LTC services at age 65 and above: Unisex $89K; males $44K; females $124K.
Overwhelming majority (92%, both sexes) of LTC costs
incurred during episodes of severe disability that meet HIPAA ADL/CI triggers.
Remaining costs (8%) incurred during episodes of
mild/moderate disability. Source: Stallard (North American Actuarial Journal 15(1):32–58, 2011).
17

Type of Enrollment Neither CI only ADL only ADL & CI Total
Number of Persons
Medicare Only 23,887,016 413,391 682,294 642,054 25,624,756Dual Eligibles 2,275,308 117,867 212,469 257,867 2,863,511Total 26,162,324 531,257 894,763 899,922 28,488,267
Average Annual Medicare Program Payments (2010 $'s)
Medicare Only 8,174 14,090 20,039 19,267 8,761 Dual Eligibles 10,175 11,270 19,558 23,831 11,954 Total 8,344 13,500 19,919 20,625 9,071
Source: Authors' calculations based on the 2004 NLTCS.
Estimated Number of FFS Community Residents and Average Annual Medicare HCC Payments (excluding ESRD, LTI, and Hospice), by Type of Enrollment and HIPAA Triggers,
United States 2004, Unisex, Age 65 and Above
HIPAA Trigger*
* Note: The CI trigger was based on 3+ errors on the SPMSQ.
18

Type of Enrollment Neither CI only ADL only ADL & CI Total
Number of Persons
Medicare Only 10,566,538 146,408 277,627 217,877 11,208,450Dual Eligibles 688,241 45,361 44,135 68,101 845,838Total 11,254,779 191,769 321,763 285,977 12,054,289
Average Annual Medicare Program Payments (2010 $'s)
Medicare Only 8,996 17,062 20,043 24,783 9,559 Dual Eligibles 10,957 14,815 24,882 27,024 12,981 Total 9,110 16,551 20,739 25,357 9,787
Source: Authors' calculations based on the 2004 NLTCS.
Estimated Number of FFS Community Residents and Average Annual Medicare HCC Payments (excluding ESRD, LTI, and Hospice), by Type of Enrollment and HIPAA Triggers,
United States 2004, Males, Age 65 and Above
HIPAA Trigger*
* Note: The CI trigger was based on 3+ errors on the SPMSQ.
19
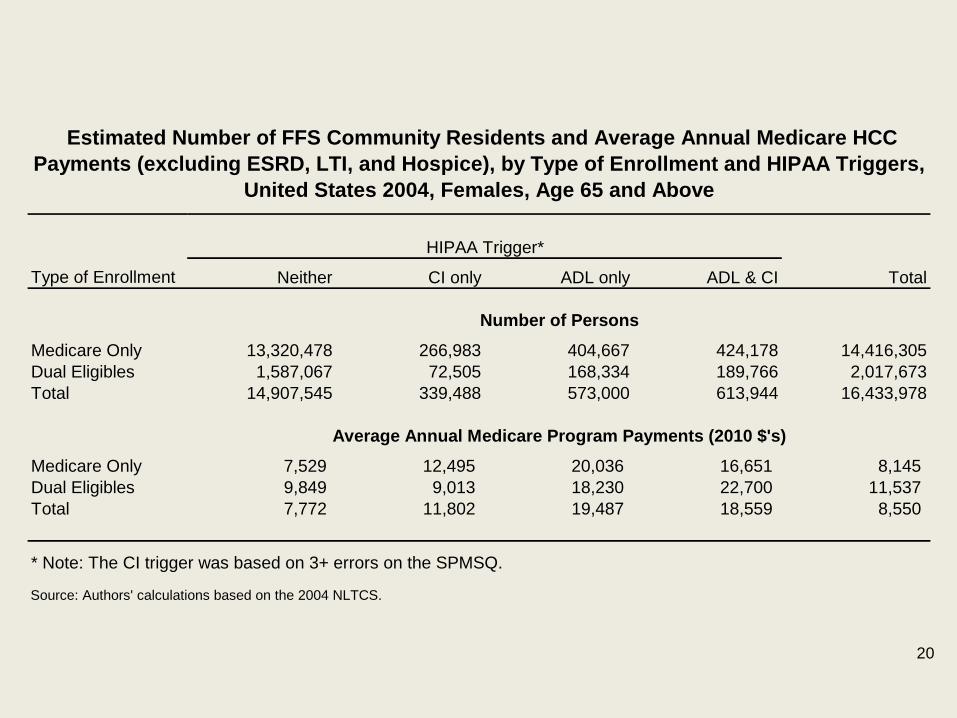
Type of Enrollment Neither CI only ADL only ADL & CI Total
Number of Persons
Medicare Only 13,320,478 266,983 404,667 424,178 14,416,305Dual Eligibles 1,587,067 72,505 168,334 189,766 2,017,673Total 14,907,545 339,488 573,000 613,944 16,433,978
Average Annual Medicare Program Payments (2010 $'s)
Medicare Only 7,529 12,495 20,036 16,651 8,145 Dual Eligibles 9,849 9,013 18,230 22,700 11,537 Total 7,772 11,802 19,487 18,559 8,550
Source: Authors' calculations based on the 2004 NLTCS.
Estimated Number of FFS Community Residents and Average Annual Medicare HCC Payments (excluding ESRD, LTI, and Hospice), by Type of Enrollment and HIPAA Triggers,
United States 2004, Females, Age 65 and Above
HIPAA Trigger*
* Note: The CI trigger was based on 3+ errors on the SPMSQ.
20

Type of Enrollment Neither CI only ADL only ADL & CI Total
Number of Persons
Medicare Only 11,833,668 40,682 194,340 78,006 12,146,696Dual Eligibles 1,232,575 38,684 82,867 54,929 1,409,055Total 13,066,243 79,367 277,207 132,935 13,555,752
Average Annual Medicare Program Payments (2010 $'s)
Medicare Only 7,028 12,101 19,051 17,357 7,270 Dual Eligibles 8,933 11,348 23,973 18,208 10,174 Total 7,204 11,758 20,597 17,710 7,564
Source: Authors' calculations based on the 2004 NLTCS.
Estimated Number of FFS Community Residents and Average Annual Medicare HCC Payments (excluding ESRD, LTI, and Hospice), by Type of Enrollment and HIPAA Triggers,
United States 2004, Unisex, Age 65–74
HIPAA Trigger*
* Note: The CI trigger was based on 3+ errors on the SPMSQ.
21

Type of Enrollment Neither CI only ADL only ADL & CI Total
Number of Persons
Medicare Only 9,224,448 174,787 260,715 260,724 9,920,674Dual Eligibles 800,037 37,979 64,911 102,736 1,005,664Total 10,024,485 212,766 325,627 363,460 10,926,338
Average Annual Medicare Program Payments (2010 $'s)
Medicare Only 8,805 12,949 19,648 24,118 9,452 Dual Eligibles 10,429 10,737 19,020 31,940 12,994 Total 8,931 12,607 19,520 26,485 9,765
Source: Authors' calculations based on the 2004 NLTCS.
Estimated Number of FFS Community Residents and Average Annual Medicare HCC Payments (excluding ESRD, LTI, and Hospice), by Type of Enrollment and HIPAA Triggers,
United States 2004, Unisex, Age 75–84
HIPAA Trigger*
* Note: The CI trigger was based on 3+ errors on the SPMSQ.
22

Type of Enrollment Neither CI only ADL only ADL & CI Total
Number of Persons
Medicare Only 2,828,901 197,922 227,238 303,324 3,557,385Dual Eligibles 242,695 41,203 64,691 100,203 448,792Total 3,071,596 239,125 291,929 403,527 4,006,177
Average Annual Medicare Program Payments (2010 $'s)
Medicare Only 11,010 15,614 21,457 15,518 12,142 Dual Eligibles 15,780 11,630 13,808 17,855 15,513 Total 11,381 14,906 19,682 16,105 12,505
Source: Authors' calculations based on the 2004 NLTCS.
Estimated Number of FFS Community Residents and Average Annual Medicare HCC Payments (excluding ESRD, LTI, and Hospice), by Type of Enrollment and HIPAA Triggers,
United States 2004, Unisex, Age 85 and Above
HIPAA Trigger*
* Note: The CI trigger was based on 3+ errors on the SPMSQ.
23

Thank You! Acknowledgments
This research was funded primarily by the National Institute on Aging through Grants R01AG028259, R01AG030612, R01AG032319, and R01AG030198-01A2. Funding from the National PACE Association supported additional analysis of the NLTCS-linked Medicare data.
Funding for the NLTCS was provided by the National Institute on Aging, most recently through Grant U01-AG07198.
24

Measuring Medical Care Economic Risk: An Assessment of Data Sources
John L. Czajka Mathematica Policy Research
Background paper prepared for the Workshop on Developing a
Measure of Medical Care Economic Risk September 8, 2011, Washington, DC
Considerations in This Review
While the design of a medical care risk index (MCRI) need not be constrained by currently available data, any such measure produced in the next few years must be based almost exclusively on data collected currently
– Adding a modest number of new items to an existing survey is possible
– Funding to support significant additions is not available
The panel sponsor, ASPE, has indicated: – MCRI should be constructed from variables available in the
Current Population Survey Annual Social and Economic Supplement (CPS ASEC) to allow direct comparison to the new supplemental poverty measure (SPM)
– Medical Expenditure Panel Survey (MEPS) should serve as the data source for modeling medical care risk, with results transported to the CPS ASEC through common variables

Factors Affecting Data Requirements
Alternative design choices – Retrospective versus prospective measurement of risk – Whether resources include assets or only income
Development versus production of the MCRI – Development requires data that, ideally, will support alternative
measures and enable evaluation – Longitudinal data would be valuable for evaluation and
validation—especially with a prospective measure – Production requires data to support one, not multiple measures;
but timeliness, representativeness, and statistical precision become more important

Measures of Resources
CPS ASEC is the official source for estimates of income and poverty for the U.S. population and will also be used to construct the SPM
– Includes official measure of money income—used to estimate poverty
– Also provides the measure of disposable income that will be used in the SPM
• Some components imputed or modeled • Medical out-of-pocket expenditures and certain other components
were added in 2010
CPS ASEC collects no asset data of any kind – Adding questions to collect, at a minimum, financial assets would
be preferable to imputation, but quality of data cannot be assured without careful testing
– Good asset data are most important for people with low income relative to their medical needs/risk

Measures of Resources cont’d
MEPS collects sources of income that correspond reasonably closely to CPS concept of money income
– MEPS income questions follow the federal tax form and include capital gains and state tax refunds, which are not counted in CPS money income
– Respondents who refer to their tax returns would omit earnings and possibly social security benefits excluded from taxation
MEPS collects fewer of the expenses that differentiate money income from disposable income; like the CPS, however, MEPS does not capture taxes paid (or EITC received)
Unlike the CPS, MEPS collects data on assets – Assets are divided into six broad types; amounts are
collected for all six

Measures of Medical Care Risk
CPS ASEC added medical out-of-pocket expenditures in 2010; data compare favorably to MEPS and SIPP despite the more detailed measurement in these other surveys
CPS ASEC collects sources of health insurance coverage in “past year” but no additional information on what expenditures are covered
CPS ASEC also collects basic work and activity limitations and general health status—potentially useful in defining risk groups and matching to MEPS

Measures of Medical Care Risk cont’d
MEPS collects extensive data on: – Health conditions – Health status – Use of medical services – Charges and payments – Access to care – Health insurance coverage over time – Detailed information on what types of care are covered in private
health insurance plans
MEPS can support retrospective or prospective measures of medical care risk

Data Quality
Limited information on data quality suggests some areas where improvement would be desirable
Despite its overall strength, CPS ASEC income data have notable weaknesses
– Reporting of retirement income other than Social Security is well below SIPP
– SNAP (formerly food stamp) benefits—received by 15 percent of population—may be understated by nearly one-half
– Nonresponse to income questions is high; 30 percent of total income is imputed
• If imputation procedures do not account for covariates of medical risk, the MCRI is weakened
Limitations of CPS ASEC health insurance measures are well known

Data Quality cont’d
Measures of private health plan content, medical service use, and medical out-of-pocket expenditures in MEPS are unique in their detail; MEPS data set the standard, but there is little out there to compare to MEPS
Because of MEPS’ panel design, attrition may be the principal concern; are persons with high medical risk overrepresented among attriters?
After tracking the estimates from the National Health Interview Survey and CPS ASEC for most of the last decade, MEPS uninsured rates for adults and children rose sharply in 2007 and 2008 while the other surveys showed stable or declining rates

Other Surveys--SIPP
Panel on Poverty and Family Assistance viewed SIPP as survey of choice for a new poverty measure
– SIPP had been designed expressly to support policy analysis – SIPP collected more detailed income data than any other federal
survey; quality of these data was almost uniformly high – SIPP design, with collection of substantial core data in every wave
and supplemental topical modules with varying content was ideally suited to a new poverty measure that would require new data but not in every wave
A decade later the view was different – 1996 redesign replaced overlapping panels, critical to consistent
cross-sectional representativeness – Evidence of deterioration in income and asset data emerged – Timeliness issues and repeated budget/sample cuts detracted
from the stability needed to support a key national indicator

Other Surveys—SIPP cont’d
SIPP was terminated in 2007 but then restored in response to objections from users
– 2004 panel extended but with sample cut of one-half and without topical modules
– New panel started in 2008; will continue until replaced by a re-engineered SIPP to be fielded in early 2014
Design of re-engineered SIPP – Annual interviews will replace the three-time yearly interviews – Event history calendar methods will be used to collect monthly
data with 12-month recall – Most of SIPP core content retained; key items from annual topical
modules—such as assets and medical and work-related expenditures—will be added to annual interviews

Other Surveys—SIPP cont’d
Issues in using SIPP for development or initial production of MCRI
– To monitor implementation of health care reform, MCRI must be in production before we see first new SIPP data
– Initial, small sample tests of new design are encouraging, but we cannot fully assess the survey as yet
– Nonoverlapping panels, if maintained, do not address declining representativeness over time with current design
– SIPP’s funding history and current budget climate raise concerns about sustained funding
– Current SIPP, with panels longer than MEPS, could play role in evaluation of retrospective but not prospective MCRI

American Community Survey (ACS)
Attractive because of large sample size: 2 million households interviewed each year would offer unmatched geographic detail
Captures similar kinds of content to CPS ASEC but more limited in depth
Areas where ACS data are richer than CPS ASEC are not relevant to MCRI
ACS questionnaire will not be open to new items for several years, and contents are restricted by law
Bottom line: ACS is not a viable option for developing or producing an MCRI

National Health Interview Survey (NHIS)
NHIS provides sampling frame for MEPS; is larger, and most content released on a more timely basis
NHIS collects detailed information on health status, which could enrich a prospective measure of risk
On most other possible components of an MCRI, NHIS data are more limited than MEPS or nonexistent
Because NHIS provides the frame for MEPS, NHIS data can be linked to MEPS sample records; thus NHIS would add no new content
Bottom line: NHIS is not a resource for developing or producing an MCRI

Conclusion
Questions about data sources reduce to what is collected in two surveys: CPS ASEC and MEPS
MEPS collects essentially all data elements needed to construct alternative versions of MCRI where CPS ASEC is missing critical variables for certain variants
Yet CPS ASEC will be used to produce the new SPM, to which the MCRI is intended as a companion measure
Having both measures in the same survey will allow researchers to compare and contrast how families and individuals are classified by the two measures
Such comparisons may be helpful in establishing the value added by an MCRI
Conclusion cont’d
Other advantages of CPS ASEC – A CPS-based MCRI could be released concurrently or shortly after
SPM or 10 to 11 months after end of survey reference period (prior calendar year); MEPS would require an additional year
– CPS ASEC sample size is five times the largest recent MEPS sample
– CPS ASEC sample combines independent, representative samples of the 50 states and DC; state estimates, while lacking in precision, could be important in monitoring implementation of Affordable Care Act
A prospective MCRI would depend on data collected in MEPS; these data would have to lag a year or release of MCRI delayed a year
Data and methodology should be reassessed within a few years of implementation
