understanding the supplemental poverty measure - census · measure (spm) rate in 2015 was 14.3...
TRANSCRIPT
Understanding the Supplemental Poverty Measure
Trudi Renwick, Ph.D.United States Census Bureau
Presented atWestern Economic Association 13th International Conference
3‐6 January 2017Pontifical Catholic University of Chile, Santiago
Session 84: Contemporary Economic Policy: Public Policy and Inequality Series
Poverty and Social Policy: Poverty and Inequality Measurement –Empirical Approach II
2
The views expressed in this research, including those related to statistical, methodological, technical, or operational issues, are solely those of the author and do not necessarily reflect the official positions or policies of the Census Bureau. The author accepts responsibility for all errors.
This presentation is released to inform interested parties of ongoing research and to encourage discussion of work in progress. This presentation reports the results of research and analysis undertaken by Census Bureau staff. It has undergone more limited review than official publications.

Official Poverty and Supplemental Poverty Estimates for 2015 released in September 2016
Highlights• The official poverty rate in
2015 was 13.5 percent, down 1.2 percentage points from 2014. In 2015, there were 43.1 million people in poverty, 3.5 million fewer than in 2014.
• The Supplemental Poverty Measure (SPM) rate in 2015 was 14.3 percent, 1 percentage point lower than the SPM estimate for 2014.
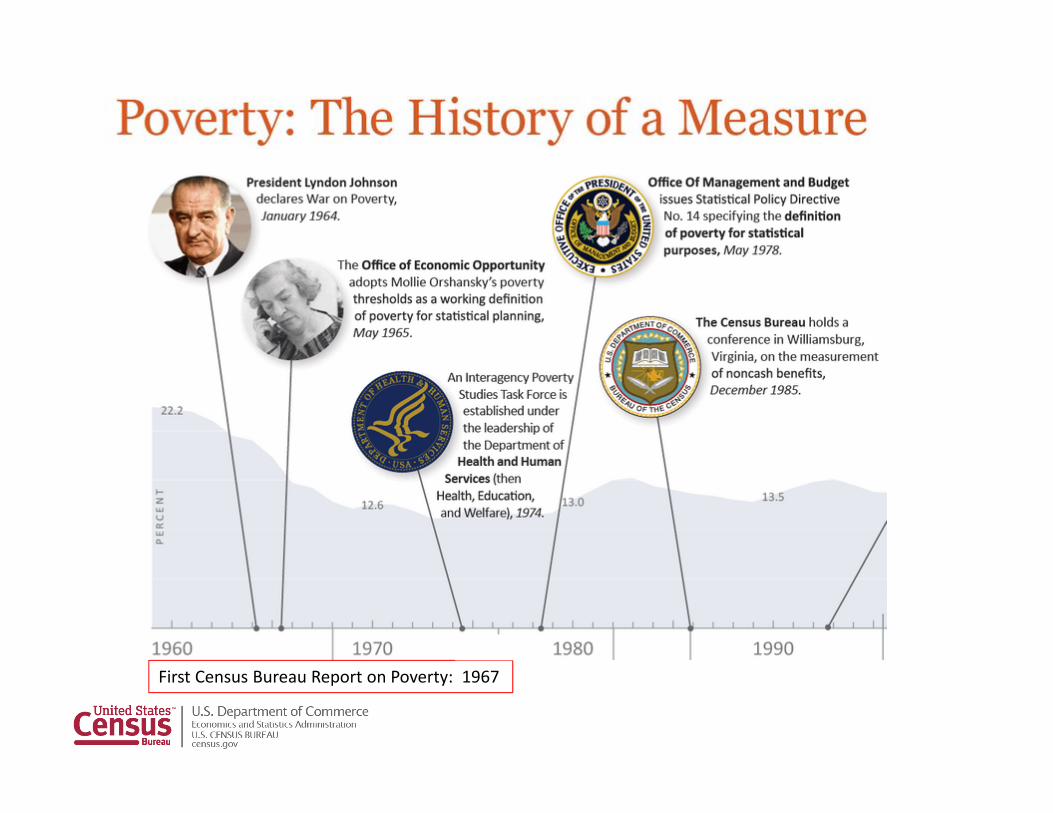
First Census Bureau Report on Poverty: 1967

Supplemental Poverty Measure (SPM)
Observations from the Interagency Technical Working Group (ITWG) ‐March 2, 2010 Will not replace the official
poverty measure Will not be used for resource
allocation or program eligibility Census Bureau and BLS
responsible for improving and updating the measure
Continued research and improvement
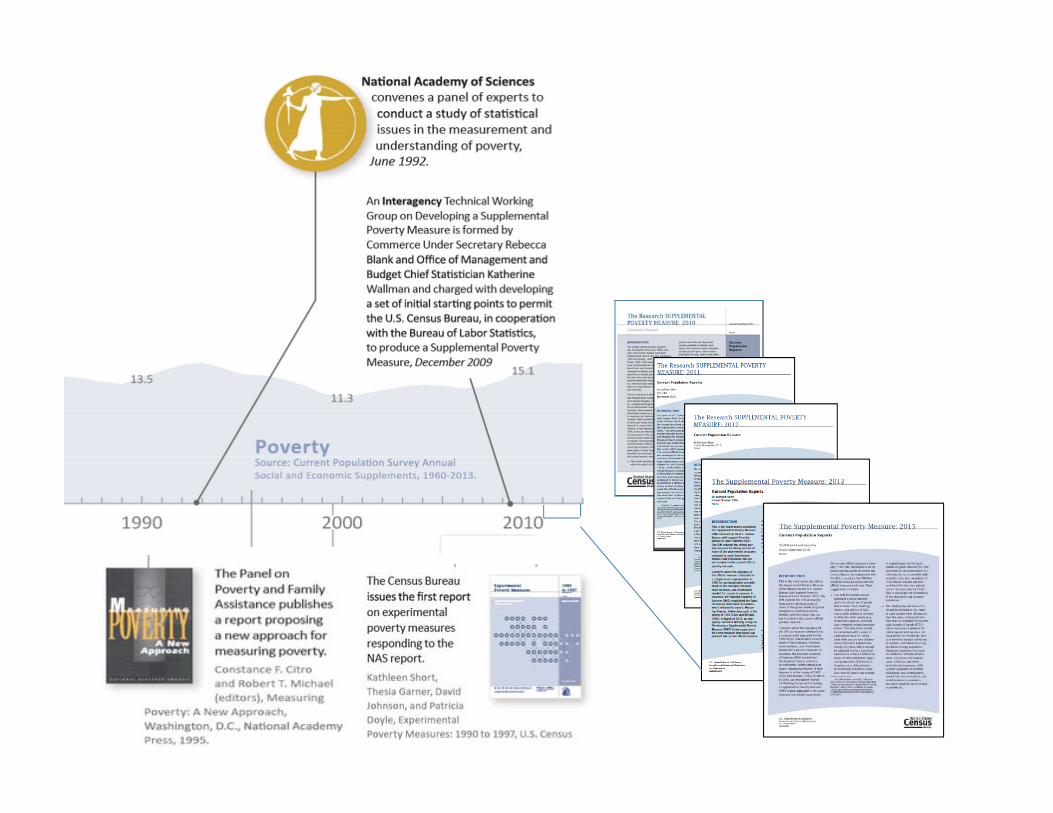
Based on National Academy of Sciences expert panel recommendations in Measuring Poverty: A New Approach (Citroand Michael,1995)
66

Criticisms of the Official Poverty Measure
The official measure does not account for:• Provision of in‐kind benefits• Necessary expenses (taxes, health care, work)• Changes in family or household structure• Higher standards and levels of living since 1965• Geographic price differences among regions

Poverty Measure Concepts: Official vs Supplemental Poverty Measure
Official SPM
Measurement units Family only OPM plus unmarried partners, unrelated
children and foster children
Poverty threshold
3 times minimally adequate food diet in 1960s
30th‐36th percentile of expenditures on food, clothing, shelter and utilities (+ 20%)
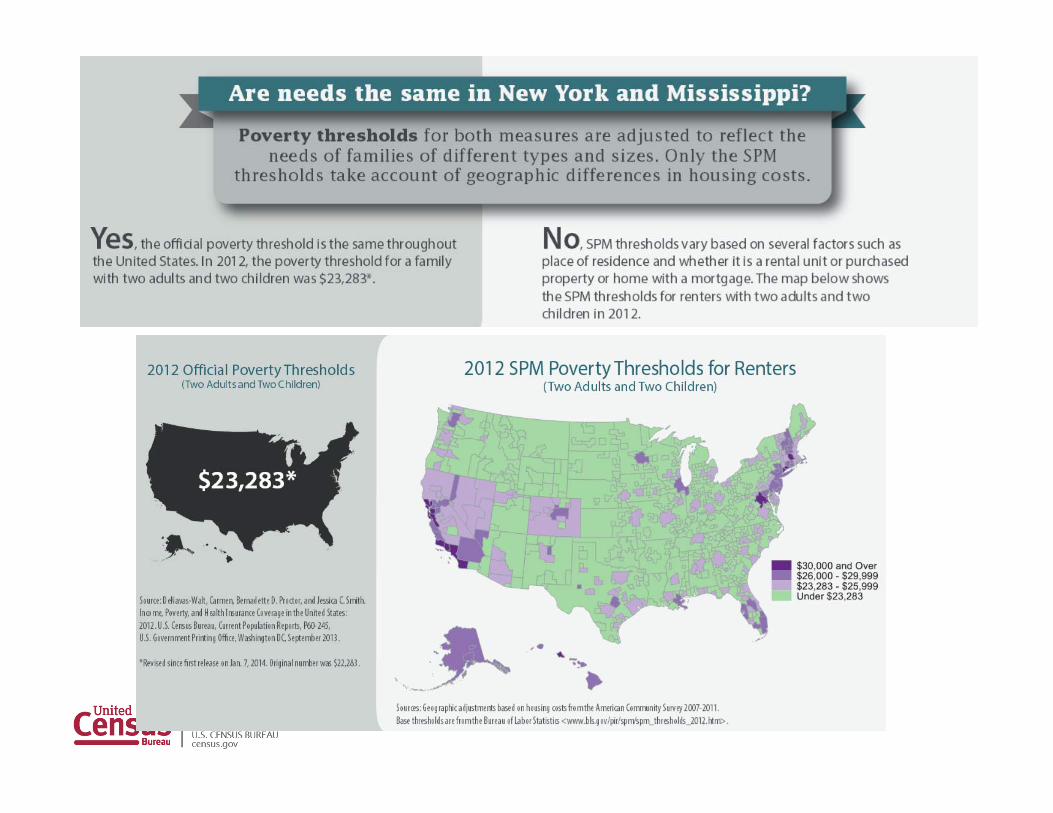
Threshold adjustments
Vary by family size, composition and age of
householder
Geographic adjustments for differences in housing costs and equivalence scale for family size and comp. Three separate
thresholds by housing status
Updating thresholds Consumer Price Index (CPI‐U) Five year moving avg. of expenditures
Resource measure Gross before‐tax cash income
Sum of cash income,PLUS: in‐kind benefits (SNAP, LIHEAP, WIC,
Housing subsidies)MINUS: Taxes, child support paid, work expenses (including child care), medical
out‐of‐pocket expenses
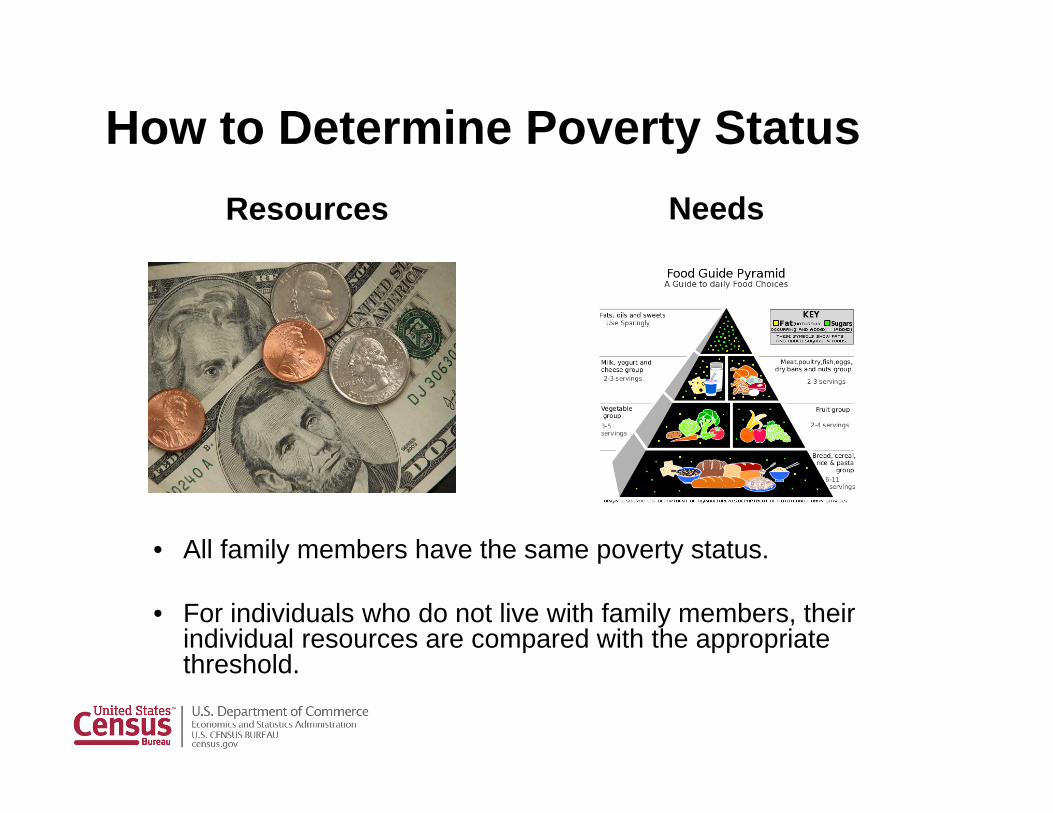
How to Determine Poverty Status
• All family members have the same poverty status.
• For individuals who do not live with family members, their individual resources are compared with the appropriate threshold.
Resources Needs


Example: Family of two adults, one child in metro Arizona.
Official Poverty MeasureOfficial threshold $19,078. Cash Income $20,000
Official: $20,000>$19,078 so family is considered “above poverty level”
SPMSPM Threshold $21,303Cash Income $20,000+ Tax credits +1,701+ WIC benefits +1,038 ‐ Work/Childcare ‐ 2,463SPM Resources $20,276SPM: $20,276<$21,303 so family is considered “in poverty”
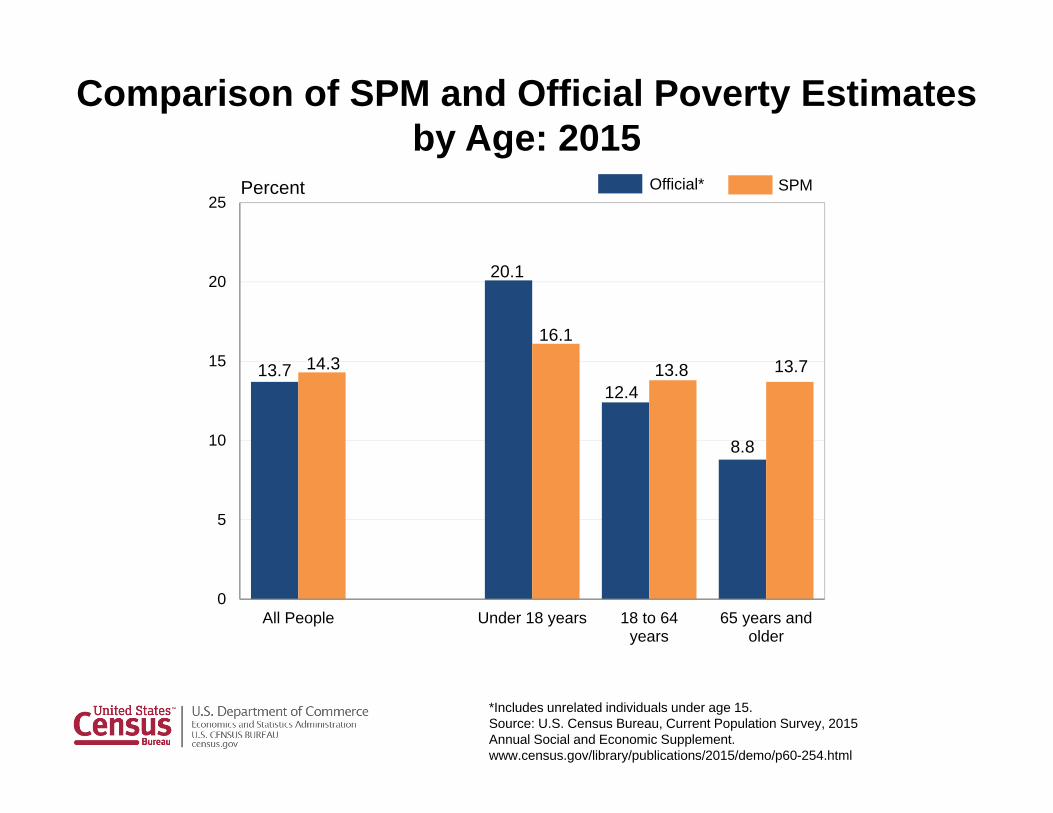
Comparison of SPM and Official Poverty Estimates by Age: 2015
*Includes unrelated individuals under age 15.Source: U.S. Census Bureau, Current Population Survey, 2015 Annual Social and Economic Supplement. www.census.gov/library/publications/2015/demo/p60-254.html
13.7
20.1
12.4
8.8
14.316.1
13.8 13.7
0
5
10
15
20
25
All People Under 18 years 18 to 64years
65 years andolder
Percent SPMOfficial*
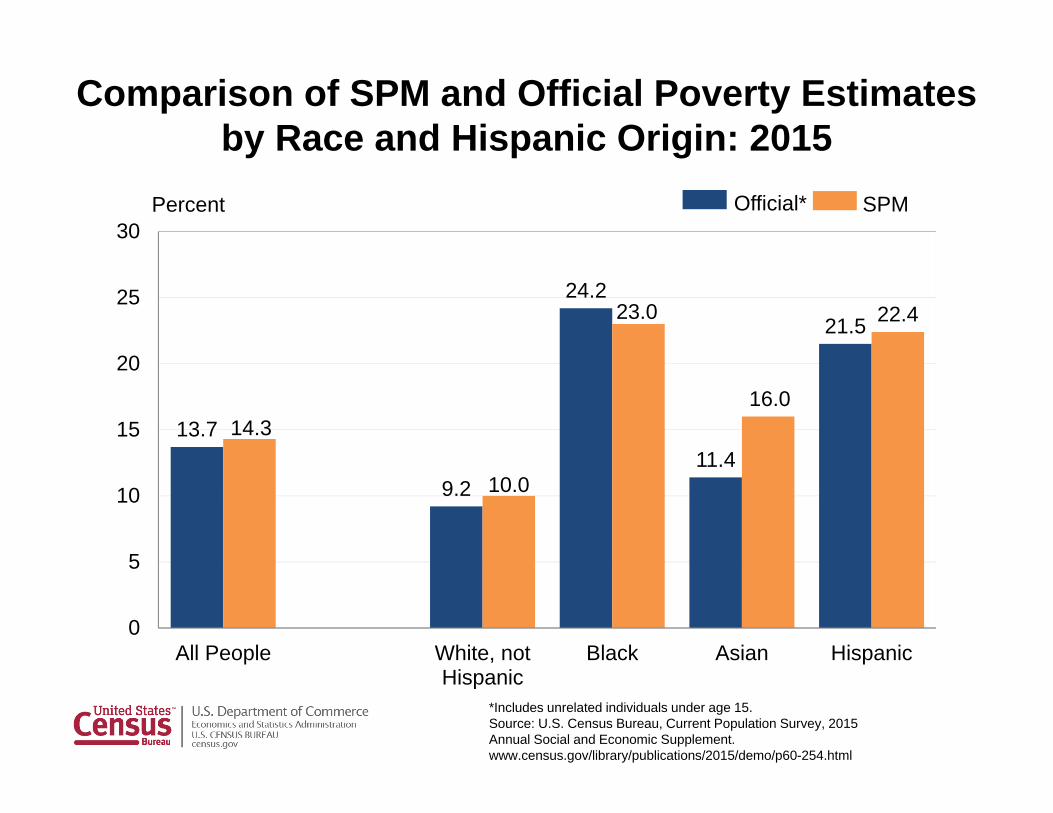
Comparison of SPM and Official Poverty Estimates by Race and Hispanic Origin: 2015
*Includes unrelated individuals under age 15.Source: U.S. Census Bureau, Current Population Survey, 2015 Annual Social and Economic Supplement. www.census.gov/library/publications/2015/demo/p60-254.html
13.7
9.2
24.2
11.4
21.5
14.3
10.0
23.0
16.0
22.4
0
5
10
15
20
25
30
All People White, notHispanic
Black Asian Hispanic
Percent SPMOfficial*
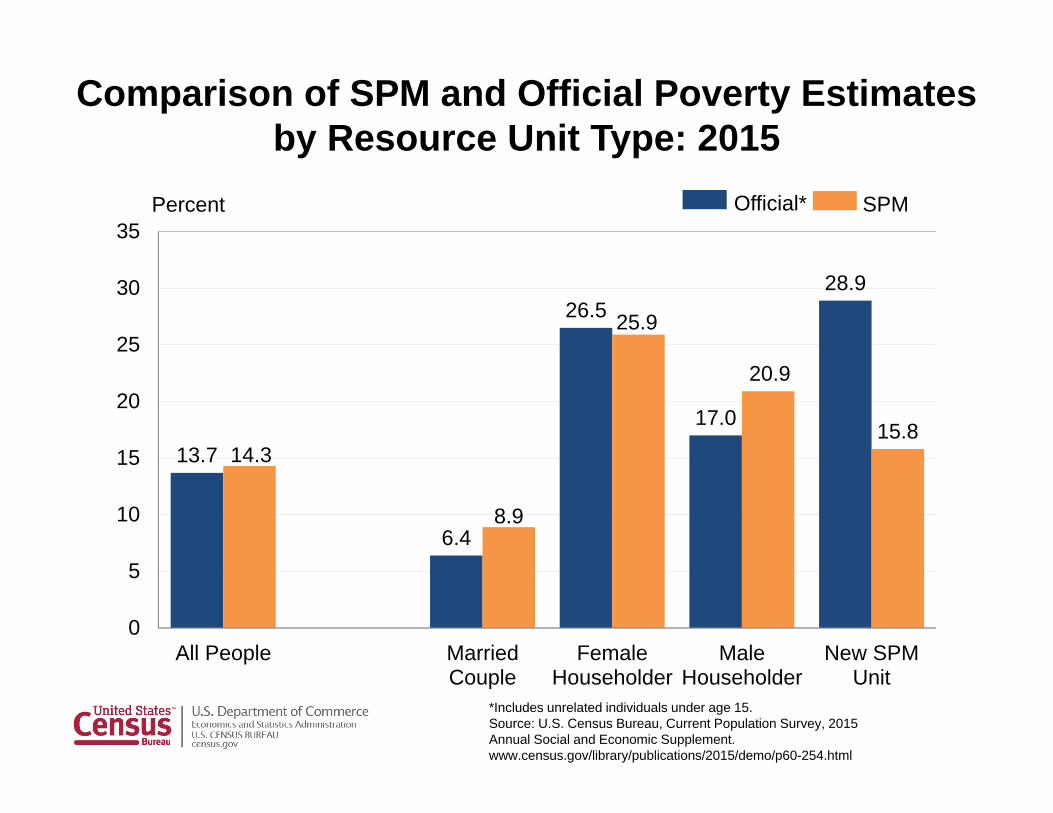
Comparison of SPM and Official Poverty Estimates by Resource Unit Type: 2015
*Includes unrelated individuals under age 15.Source: U.S. Census Bureau, Current Population Survey, 2015 Annual Social and Economic Supplement. www.census.gov/library/publications/2015/demo/p60-254.html
13.7
6.4
26.5
17.0
28.9
14.3
8.9
25.9
20.9
15.8
0
5
10
15
20
25
30
35
All People MarriedCouple
FemaleHouseholder
MaleHouseholder
New SPMUnit
Percent SPMOfficial*
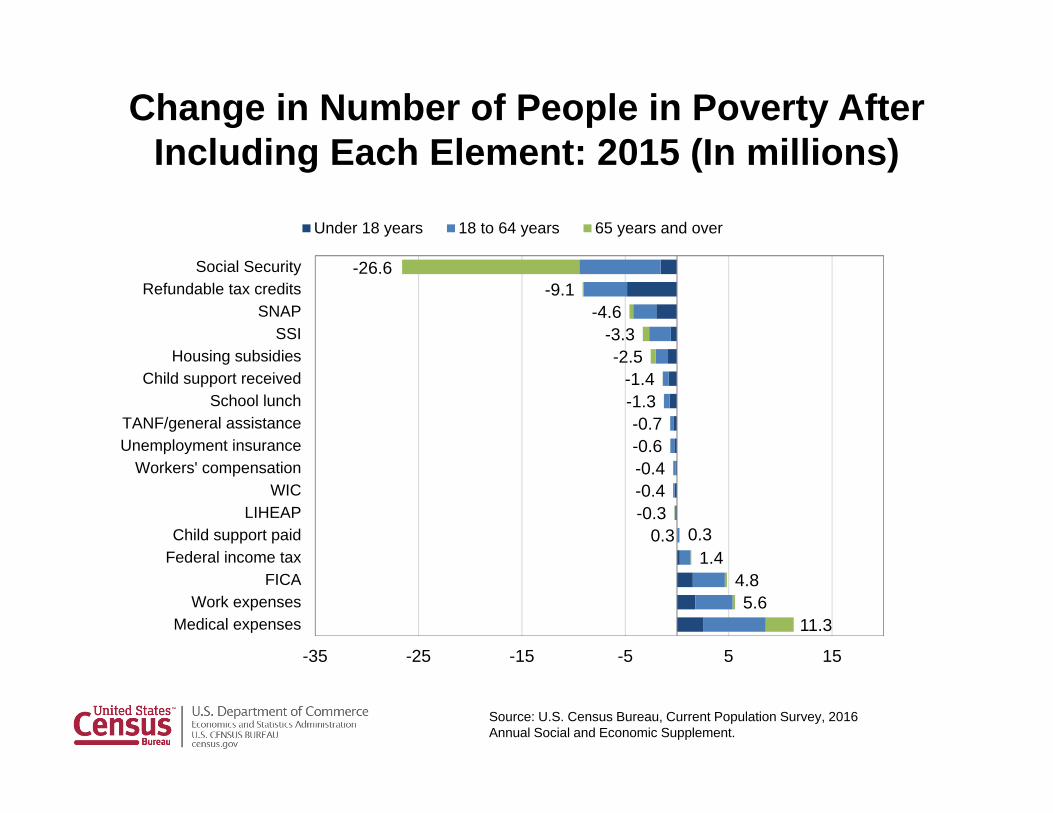
Change in Number of People in Poverty After Including Each Element: 2015 (In millions)
-9.1-4.6
-3.3-2.5
-1.4-1.3-0.7-0.6-0.4-0.4-0.3
0.31.4
4.85.6
-35 -25 -15 -5 5 15
Social SecurityRefundable tax credits
SNAPSSI
Housing subsidiesChild support received
School lunchTANF/general assistanceUnemployment insurance
Workers' compensationWIC
LIHEAPChild support paid
Federal income taxFICA
Work expensesMedical expenses
Under 18 years 18 to 64 years 65 years and over
-26.6
0.3
11.3
Source: U.S. Census Bureau, Current Population Survey, 2016 Annual Social and Economic Supplement.
Understanding the Supplemental Poverty Measure
Trudi Renwick [email protected] 301‐763‐5133
http://www.census.gov/hhes/povmeas/index.html

EXTRA SLIDES
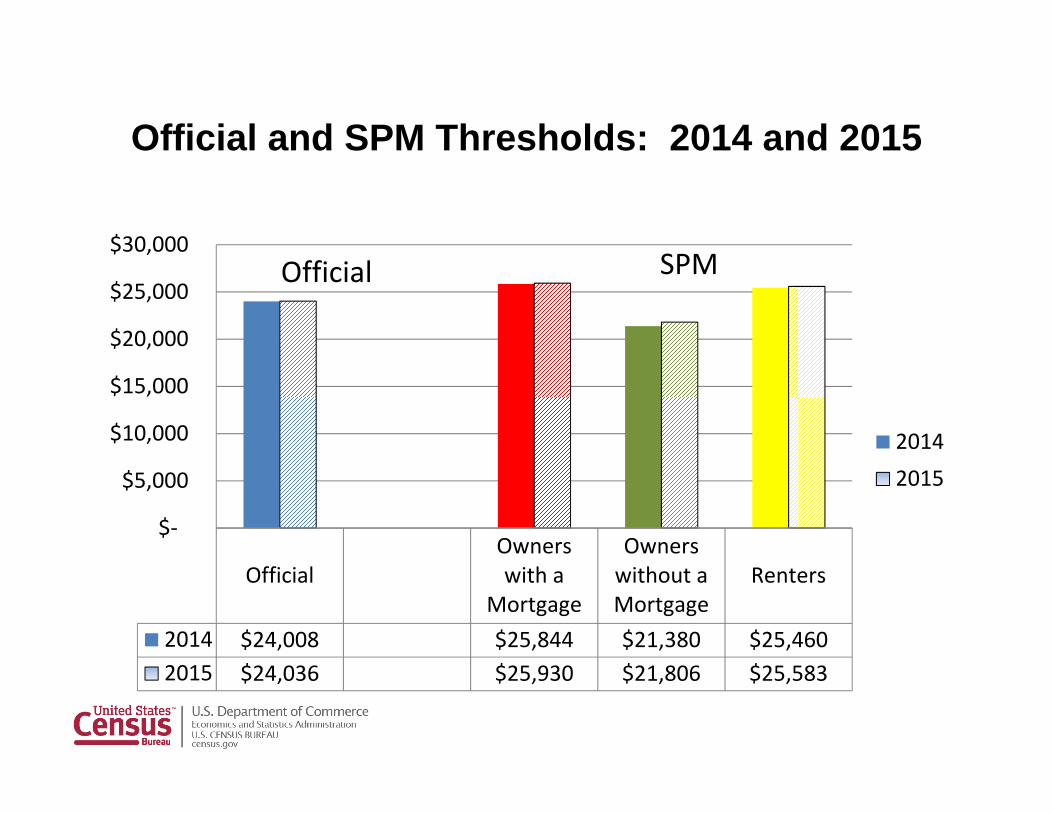
Official and SPM Thresholds: 2014 and 2015
OfficialOwnerswith a
Mortgage
Ownerswithout aMortgage
Renters
2014 $24,008 $25,844 $21,380 $25,4602015 $24,036 $25,930 $21,806 $25,583
$‐
$5,000
$10,000
$15,000
$20,000
$25,000
$30,000
20142015
Official SPM
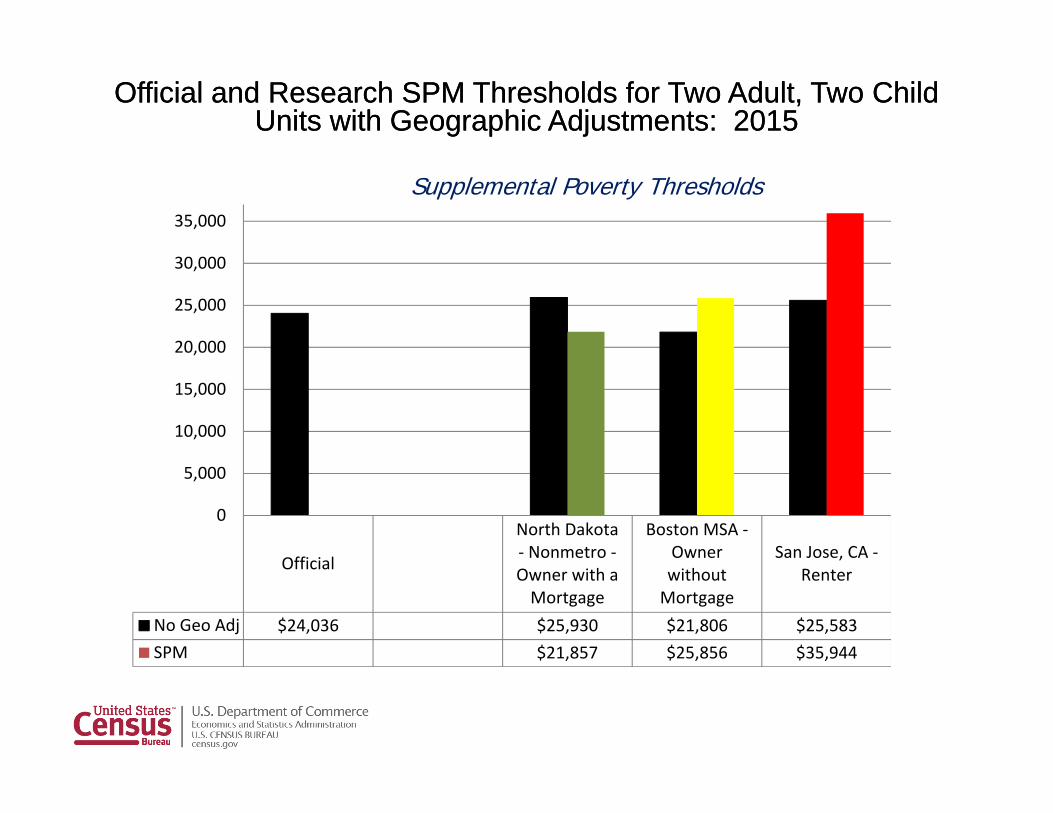
Official and Research SPM Thresholds for Two Adult, Two Child Units with Geographic Adjustments: 2015
Official and Research SPM Thresholds for Two Adult, Two Child Units with Geographic Adjustments: 2015
Official
North Dakota‐ Nonmetro ‐Owner with aMortgage
Boston MSA ‐OwnerwithoutMortgage
San Jose, CA ‐Renter
No Geo Adj $24,036 $25,930 $21,806 $25,583SPM $21,857 $25,856 $35,944
0
5,000
10,000
15,000
20,000
25,000
30,000
35,000
Supplemental Poverty Thresholds
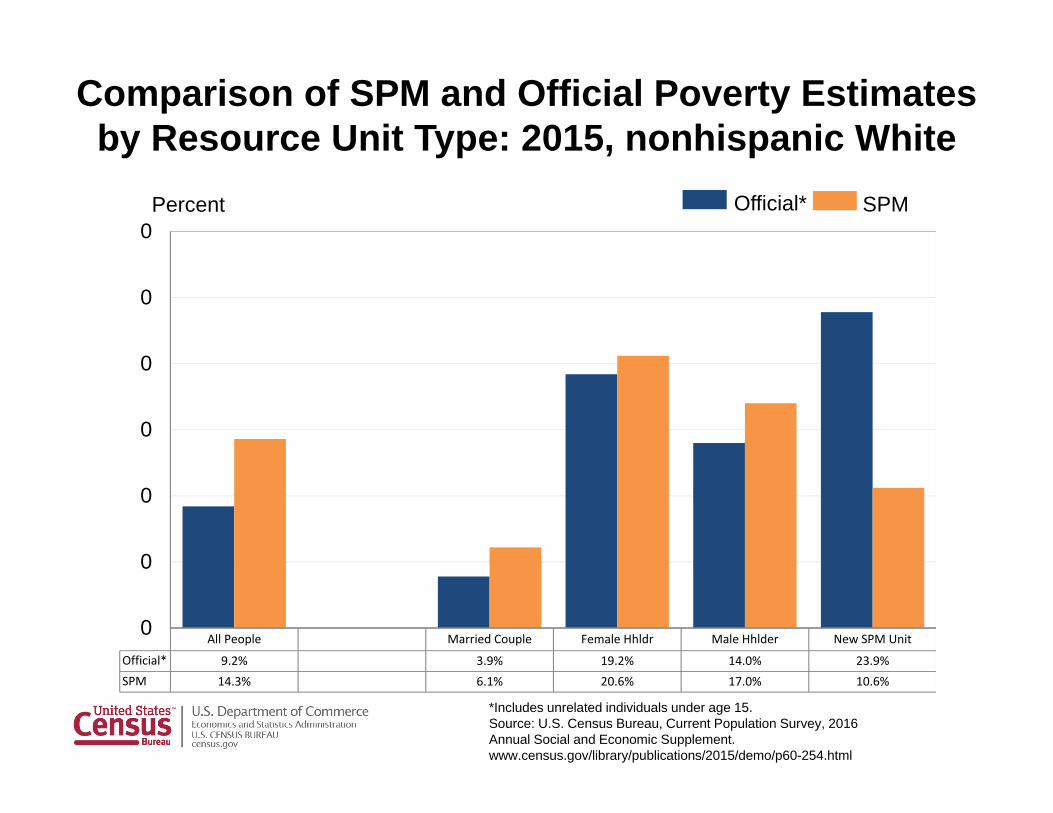
Comparison of SPM and Official Poverty Estimates by Resource Unit Type: 2015, nonhispanic White
*Includes unrelated individuals under age 15.Source: U.S. Census Bureau, Current Population Survey, 2016 Annual Social and Economic Supplement. www.census.gov/library/publications/2015/demo/p60-254.html
All People Married Couple Female Hhldr Male Hhlder New SPM Unit
Official* 9.2% 3.9% 19.2% 14.0% 23.9%SPM 14.3% 6.1% 20.6% 17.0% 10.6%
0
0
0
0
0
0
0Percent SPMOfficial*
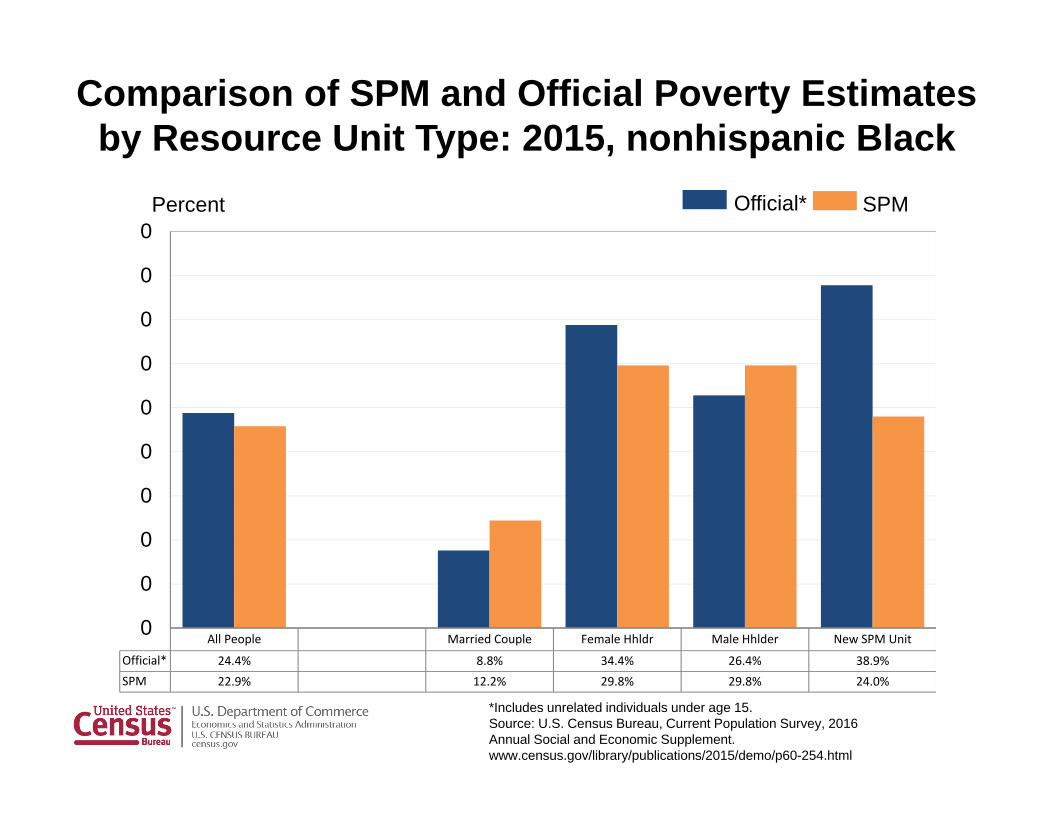
Comparison of SPM and Official Poverty Estimates by Resource Unit Type: 2015, nonhispanic Black
*Includes unrelated individuals under age 15.Source: U.S. Census Bureau, Current Population Survey, 2016 Annual Social and Economic Supplement. www.census.gov/library/publications/2015/demo/p60-254.html
All People Married Couple Female Hhldr Male Hhlder New SPM Unit
Official* 24.4% 8.8% 34.4% 26.4% 38.9%SPM 22.9% 12.2% 29.8% 29.8% 24.0%
0
0
0
0
0
0
0
0
0
0Percent SPMOfficial*

Comparison of SPM and Official Poverty Estimates by Resource Unit Type: 2015, Hispanic
*Includes unrelated individuals under age 15.Source: U.S. Census Bureau, Current Population Survey, 2016 Annual Social and Economic Supplement. www.census.gov/library/publications/2015/demo/p60-254.html
All People Married Couple Female Hhldr Male Hhlder New SPM Unit
Official* 21.5% 14.4% 35.1% 17.2% 35.4%SPM 22.4% 17.3% 34.3% 24.2% 24.1%
0
0
0
0
0
0
0
0
0 Difference Not Statistically Significant
Percent SPMOfficial*
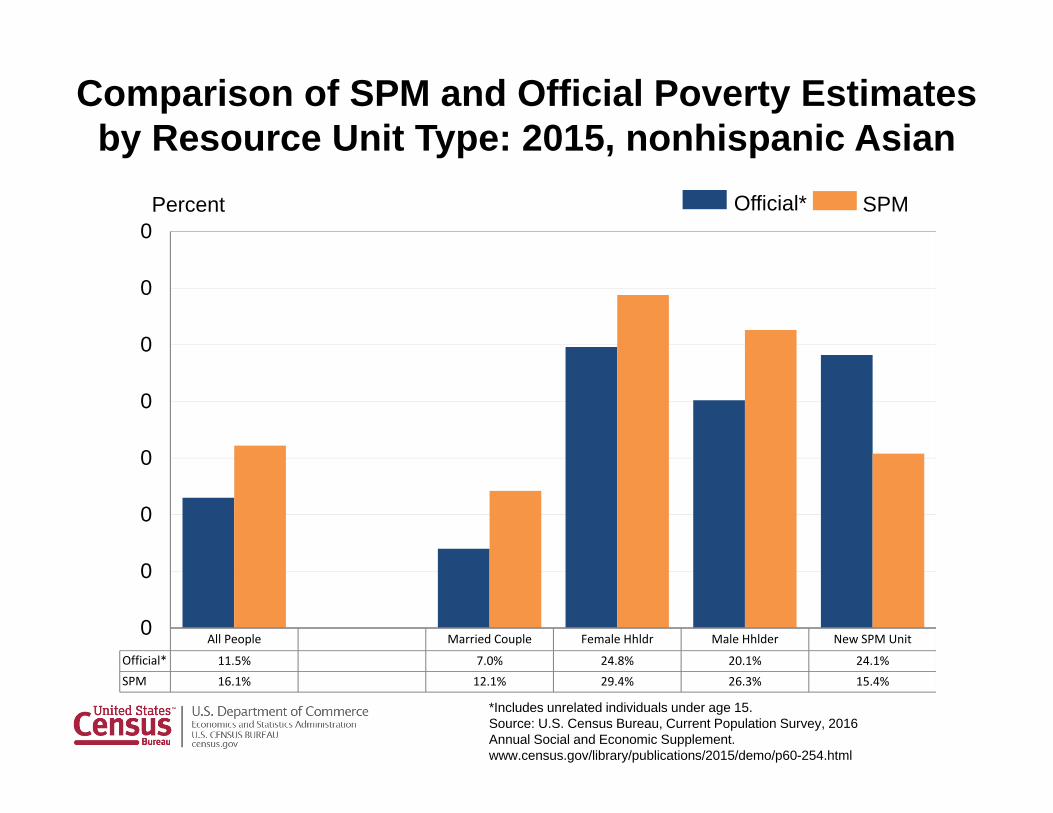
Comparison of SPM and Official Poverty Estimates by Resource Unit Type: 2015, nonhispanic Asian
*Includes unrelated individuals under age 15.Source: U.S. Census Bureau, Current Population Survey, 2016 Annual Social and Economic Supplement. www.census.gov/library/publications/2015/demo/p60-254.html
All People Married Couple Female Hhldr Male Hhlder New SPM Unit
Official* 11.5% 7.0% 24.8% 20.1% 24.1%SPM 16.1% 12.1% 29.4% 26.3% 15.4%
0
0
0
0
0
0
0
0Percent SPMOfficial*
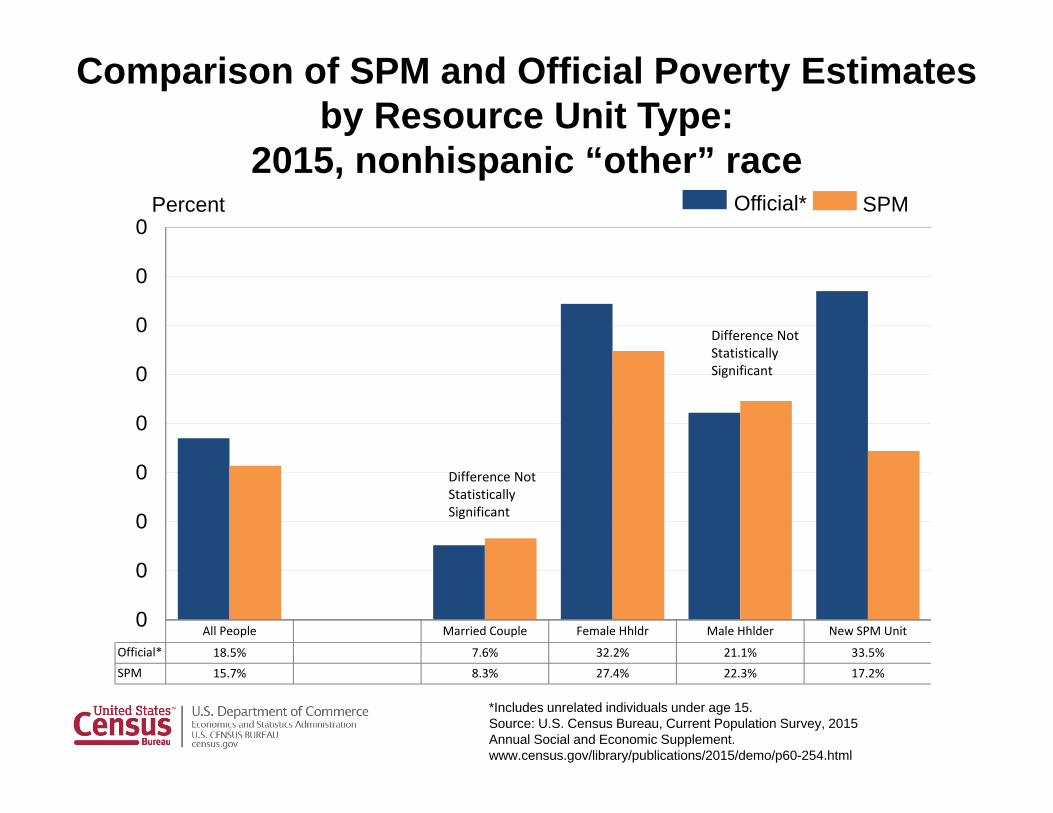
Comparison of SPM and Official Poverty Estimates by Resource Unit Type:
2015, nonhispanic “other” race
*Includes unrelated individuals under age 15.Source: U.S. Census Bureau, Current Population Survey, 2015 Annual Social and Economic Supplement. www.census.gov/library/publications/2015/demo/p60-254.html
All People Married Couple Female Hhldr Male Hhlder New SPM Unit
Official* 18.5% 7.6% 32.2% 21.1% 33.5%SPM 15.7% 8.3% 27.4% 22.3% 17.2%
0
0
0
0
0
0
0
0
0
Difference Not Statistically Significant
Percent SPMOfficial*
Difference Not Statistically Significant
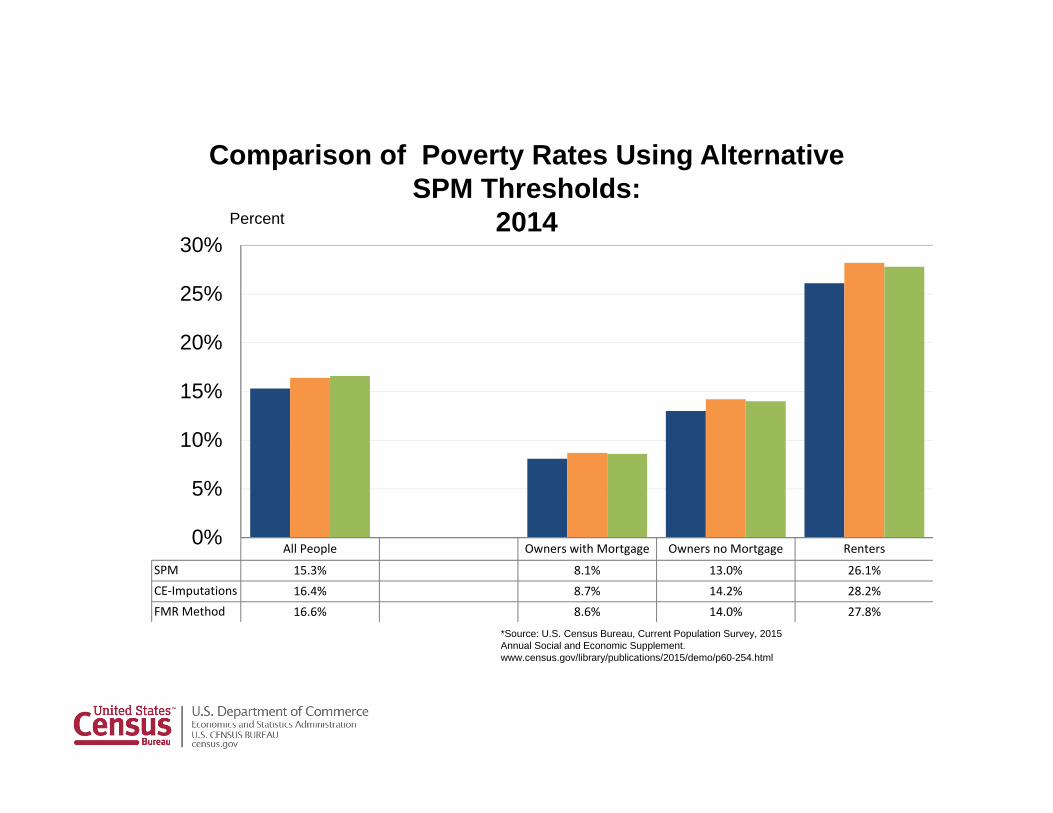
Comparison of Poverty Rates Using Alternative SPM Thresholds:
2014
*Source: U.S. Census Bureau, Current Population Survey, 2015 Annual Social and Economic Supplement. www.census.gov/library/publications/2015/demo/p60-254.html
All People Owners with Mortgage Owners no Mortgage Renters
SPM 15.3% 8.1% 13.0% 26.1%CE‐Imputations 16.4% 8.7% 14.2% 28.2%FMR Method 16.6% 8.6% 14.0% 27.8%
0%
5%
10%
15%
20%
25%
30%Percent