the physiology of the bold signal what do we measure … · the physiology of the bold signal what...
TRANSCRIPT

The physiology of the BOLD signal What do we measure with fMRI?
SPM Course 2016, Zurich
Jakob HeinzleTranslational Neuromodeling Unit (TNU) Institute for Biomedical Engineering (IBT)University and ETH Zürich
Many thanks toK. E. Stephan for material
Translational Neuromodeling Unit
1

Overview of SPM
fMRI – physics and physiology 2
Realignment Smoothing
Normalisation
General linear model
Statistical parametric map (SPM)Image time-series
Parameter estimates
Design matrix
Template
Kernel
Gaussian field theory
p <0.05
Statisticalinference
?
?

Indirect relationship between cognitive processes, neural processing and fMRI
fMRI – physics and physiology 3
Control and measure
Try to infer something about
?
Information processing in ensembles ofneurons, e.g. synaptic processes and neural
spiking
Measured MRI signal
Cognitive processes(Sensory, motor, etc.)
Adapted from Huettel et al, 2004, fMRI (Book)

Indirect relationship between cognitive processes, neural processing and fMRI
fMRI – physics and physiology 4
Control and measure
Try to infer something aboutInformation processing in ensembles ofneurons, e.g. synaptic processes and neural
spiking
Changes in blood flow, oxygenconcentration, blood volume
Changes in MRI contrasts due to changes in relative hemoglobin concentrations
Measured MRI signal
3. How is the BOLD signalrelated to neural processing?
2. What do we measurewith fMRI?
1. What do we measurewith MRI?
Cognitive processes(Sensory, motor, etc.)
Adapted from Huettel et al, 2004, fMRI (Book)

fMRI – physics and physiology 5
Images: www.fmri4newbies.com
Protons align with the magnetic field. We can measure the average magnetization.
Spin = rotation of a proton around some axis
→ magnetic moment
Material (hydrogen) in a magnetic field

Excitation and relaxation of spins
fMRI – physics and physiology 6
Movies: K. Prüssmann
Excite sample with RF pulse (radio wave: 42.6MHz/Tesla).
Measure the emitted radiowave.

Signal decay depends on tissue
fMRI – physics and physiology 7
T1 = How quickly do protons realign with magnetic field?
T2 = How quickly do protons emit energy (phase out) when recovering to equilibrium?
fat has high signal Æ bright
CSF has low signal Æ dark
fat has low signal Æ dark
CSF has high signal Æ bright

T2* magnetization decay
• Decay of transverse magnetization has two factors:
1) molecular interactions (tissue properties) (T2)2) local inhomogeneities of the magnetic field
¾ The combined time constant is called T2*.
fMRI – physics and physiology 8
The general principle of MRI:– excite spins in static field by RF pulses & detect the emitted RF– use an acquisition technique that is sensitive to local differences in
T1, T2 or T2*– construct a spatial image

Indirect relationship between cognitive processes, neural processing and fMRI
fMRI – physics and physiology 9
Control and measure
Try to infer something aboutInformation processing in ensembles ofneurons, e.g. synaptic processes and neural
spiking
Changes in blood flow, oxygenconcentration, blood volume
Changes in MRI contrasts due to changes in relative hemoglobin concentrations
Measured MRI signal
2. What do we measurewith fMRI?
Cognitive processes(Sensory, motor, etc.)
Adapted from Huettel et al, 2004, fMRI (Book)

fMRI uses T2* contrasts
• fMRI uses MRI sequences that measureT2* decay of protons.
• Depends on:– Molecular interaction– Local inhomogeneities of magnetic field
fMRI – physics and physiology 10
What makes T2* weighted images “functional”?

It’s the blood
fMRI – physics and physiology 11
Source: Ogawa et al, Magn. Res. Med., 1990
Saline
Blood
The signal comes from the susceptibility change due to deoxy-Hbvs. oxy-Hb.
OxyHb (diamagnetic) vs. DeoxyHb (paramagnetic) effects on spin of hydrogen atoms in surrounding tissue.
T2*T2

The BOLD effect
• BOLD (Blood Oxygenation Level Dependent) contrast measures inhomogeneities in the magnetic field due to changes in the level of O2 in the blood
fMRI – physics and physiology 12
Oxygenated hemoglobin:Diamagnetic (non-magnetic)→ no signal loss!
Deoxygenated hemoglobin:Paramagnetic (magnetic)→ signal loss!
100 % O2
Normal air
Source: Ogawa et al, Magn. Res. Med., 1990

Increased blood flow
fMRI – physics and physiology 13
Source: Huettel et al, 2004, fMRI (Book)
↑ neural activity Î ↑ blood flow Î ↑ oxyhemoglobin Î ↑ T2* Î ↑ MR signal
Res
t
Activ
ity
oxy-Hb
deoxy-Hb
Increased neural activity leads to an over-compensatory increase of regional CBF, which decreases the relative amount of deoxy-Hb
→ higher T2* signal intensity

The hemodynamic response function (HRF)
fMRI – physics and physiology 14
sometimes shows initial undershoot Æ initial dip
peaks after 4-6 secs
back to baseline after approx. 30 secs
can vary between regions and subjects
Brief
Stimulus Undershoot
Initial dip
Peak
Hemodynamic response function = BOLD response to a brief stimulus

Approximation of HRF with linear transform?
fMRI – physics and physiology 15
Linear transform: F(ax+by)=aF(x)+bF(y)
Source: Huettel et al, 2004, fMRI (Book)
Important for data analysis, e.g. GLM!
x F(x)

fMRI – physics and physiology 16
Source: Dale and Buckner, Hum Brain Mapp, 1997; Boynton et al, J Neurosci, 1996
Often linear transform is a good approximation to HRF
Evidence for linearity from early experiments
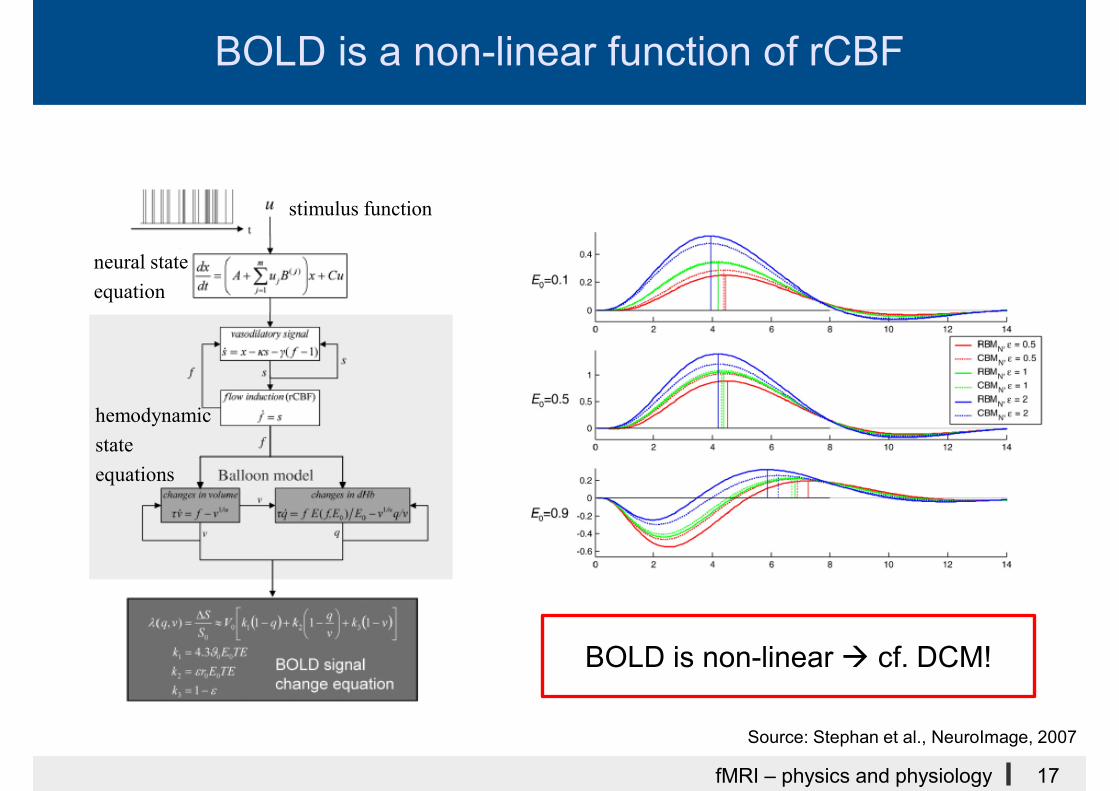
BOLD is a non-linear function of rCBF
fMRI – physics and physiology 17
stimulus function
neural state equation
hemodynamic state equations
Source: Stephan et al., NeuroImage, 2007
BOLD is non-linear Æ cf. DCM!

Indirect relationship between cognitive processes, neural processing and fMRI
fMRI – physics and physiology 18
Control and measure
Try to infer something aboutInformation processing in ensembles ofneurons, e.g. synaptic processes and neural
spiking
Changes in blood flow, oxygenconcentration, blood volume
Changes in MRI contrasts due to changes in relative hemoglobin concentrations
Measured MRI signal
3. How is the BOLD signalrelated to neural processing?
Cognitive processes(Sensory, motor, etc.)
Adapted from Huettel et al, 2004, fMRI (Book)

3. How is the BOLD signal related to neural activity?
Some important questions:– What is the electrophysiological measure with
the closest link to the BOLD signal?
– Does the BOLD signal reflect energy demands or synaptic activity?
– What does a negative BOLD signal mean?
fMRI – physics and physiology 19

fMRI – physics and physiology 20
What causes BOLD signal changes
CBF ÏÏ
deoxy-Hb/oxy-HbÐ
Neurovascular coupling?
synaptic activity Ïneural metabolism Ï
???

Where does the signal come from: Soma orsynapse?
fMRI – physics and physiology 21
Source: http://psychology.uwo.ca/fmri4newbies/Tutorials.html
Soma, neural firing
Synaptic processing

Comparing BOLD with electrophysiology – early experiments
fMRI – physics and physiology 22
Idea: Compare average firing rate ofcells in monkey MT to theBOLD activity measured in humans.
Conclusion:There is a good agreementbetween spiking (firing rate) and BOLD.
Source: Heeger et al, Nat Neurosci, 2000Rees et al, Nat Neurosci, 2000

fMRI – physics and physiology 23
Local Field Potentials (LFP)• reflect summation of post-synaptic
potentialsMulti-Unit Activity (MUA)• reflects action potentials/spiking
combined BOLD fMRI and electrophysiological recordings → found that BOLD activity is more
closely related to LFPs than MUA
Source: Logothetis et al, Nature, 2001
LFP correlates best with the BOLD-signal

But, also spikes can be better correlated with BOLD
fMRI – physics and physiology 24
Source: Lima et al, J Neurosci, 2014
• response to visual stimuli ofvarying contrast.
• used optical imaginginstead of fMRI.
• removed blank trial baseline
Æ Spikes predict imagingbetter than LFP.

• The BOLD signal is best correlated topostsynaptic activity (as measured by LFPs)
• In many cases action potentials and LFPs are themselves highlycorrelated.
• rCBF-increase can be independent from spiking activity, but so far no case has been found where it was completely independent of LFPs.
• Present conclusion: BOLD more strongly reflects the input to a neuronal population as well as its intrinsic (recurrent) processing, rather than only its spiking output to other regions.
fMRI – physics and physiology 25
The BOLD signal is correlated to postsynaptic activity

3. How is the BOLD signal related to neural activity?
Some important questions:1. Is the BOLD signal more strongly related to
neuronal action potentials or to local field potentials (LFP)?
2. Does the BOLD signal reflect energy demands or synaptic activity?
3. What does a negative BOLD signal mean?
fMRI – physics and physiology 26

Cortical Metabolism
fMRI – physics and physiology 27
http://student.biology.arizona.edu/honors99/group7/glycolysis.jpgBased on: Attwell and McLaughlin, J Cer Blood Flow Metab, 2001
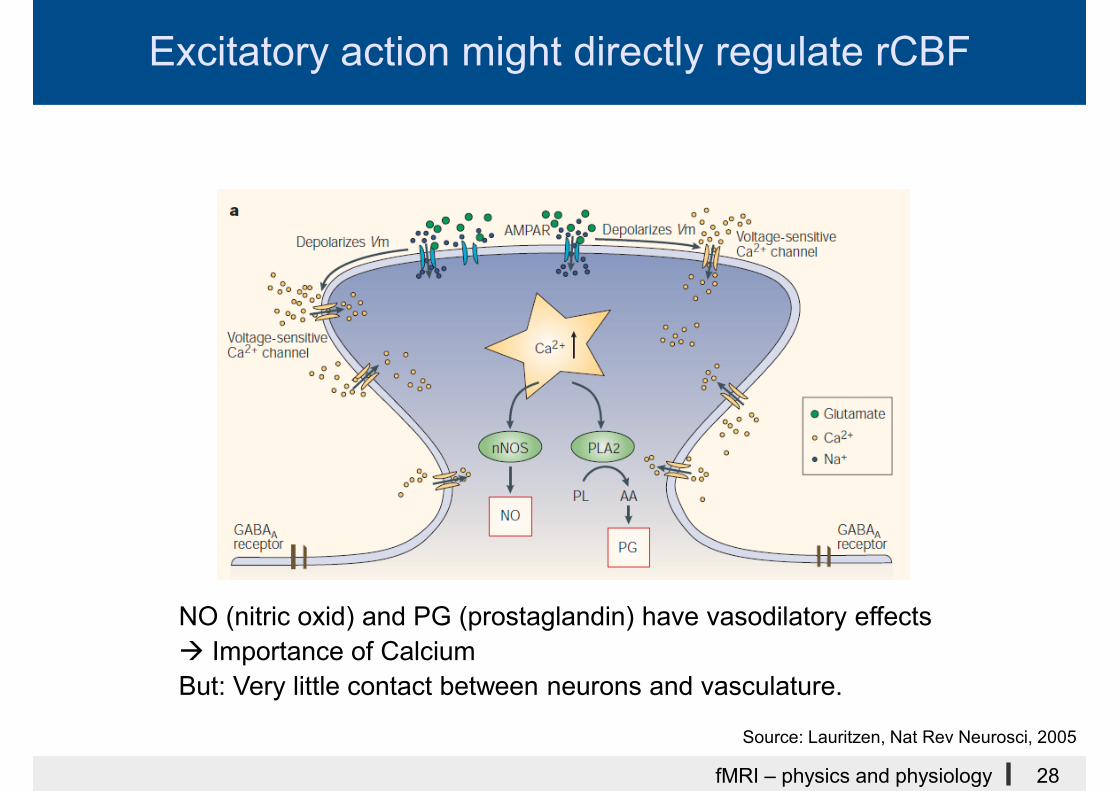
Excitatory action might directly regulate rCBF
fMRI – physics and physiology 28
Source: Lauritzen, Nat Rev Neurosci, 2005
NO (nitric oxid) and PG (prostaglandin) have vasodilatory effectsÆ Importance of CalciumBut: Very little contact between neurons and vasculature.

Glia cells and blood supply
Astrocytes have manycontacts with bloodvessels.
Glia limitans can regulateblood flow of larger vessels
Domains of astrocytes arein line with a potential function in regulatingblood flow.
fMRI – physics and physiology 29
Source: Iadecola and Nedergaard, Nat Rev Neurosci, 2007

Several pathways for blood flow regulation
fMRI – physics and physiology 30
Source: Iadecola and Nedergaard, Nat Rev Neurosci, 2007
Forward control of blood flow seems to occur via several mechanisms.
To date, two major pathways have been
associated with NO and PG.
Astrocytes could be important.

3. How is the BOLD signal related to neural activity?
Some important questions:1. Is the BOLD signal more strongly related to
neuronal action potentials or to local field potentials (LFP)?
2. Does the BOLD signal reflect energy demands or synaptic activity?
3. What does a negative BOLD signal mean?
fMRI – physics and physiology 31

Negative BOLD is correlated with decreases in LFPs
fMRI – physics and physiology 32
Shmuel et al., Nat Neurosci, 2006

Impact of inhibitory postsynaptic potentials (IPSPs) on blood flow
fMRI – physics and physiology 33
Source: Lauritzen, Nat Rev Neurosci, 2005

Excitatory-inhibitory networks and BOLD
fMRI – physics and physiology 34
Source: Logothetis, Nature, 2008

BOLD Summary
• The BOLD signal seems to be strongly related to both LFPs and spiking activity.
− The BOLD signal may primarily reflect the excitatory input to and recurrence of a neuronal population.
• Blood flow seems to be controlled in a forward fashion by postsynaptic processes at glutamatergic synapses leading to the release of vasodilators (e.g., NO and prostaglandines).
• Negative BOLD signals may result from IPSPs.
• We are far from completely understanding neurovascular coupling!
fMRI – physics and physiology 35

Summary - from a recent meeting
• Cellular neuroscientist say that cognitiveneuroscientist oversimplify, but clearly themechanisms are not fully understood.
fMRI – physics and physiology 36
Glutamatergic synapses are themain driver of vasodilation Æblood flow changesÆ BOLD
but, at least 80% of thesesynapses are recurrent, i.e. represent local firing.
Interpreting BOLD: a dialogue between cognitive and cellular neuroscience, Royal Society Meeting, 28.-29. Jan 2016

BOLD Summary
1. MRI measures the decay ofmagnetization of protons which dependson tissue properties.
2. fMRI measures changes in magneticproperties due to the ratio of oxy- vs. deoxy-hemoglobin in cerebral blood.
3. The BOLD signal is locally well correlatedto the local field potential, which is itselfhighly correlated to spiking.
fMRI – physics and physiology 37

Thank you!
fMRI – physics and physiology 38
Source: Duvernoy et al, Brain Res. Bull., 1981

References
• McRobbie et al, From Picture to Proton, Cambridge Univesrity Press, 2007
• Huettel et al, Functional Magnetic Resonance Imaging, Sinauer, 2004
• Logothetis and Wandell, Ann. Rev. Neurosci., 2004 (BOLD in general)
• Logothetis et al, Nature, 2001 (LFP vs. BOLD)
• Logothetis, Nature, 2008 (What can we do with BOLD? What not?)
• Lauritzen, Nat. Rev. Neurosci., 2005 (Calcium, Bold in Cerebellum)
• Iadecola and Needergard, Nat. Neurosci., 2007 (Glia cells)
• http://psychology.uwo.ca/fmri4newbies/Tutorials.html
fMRI – physics and physiology 39