the challenges of competitiveness
TRANSCRIPT


The Challenges of Competitiveness
José Sánchez Gutiérrez(Coordinator)
Juan Antonio Vargas BarrazaElsa Georgina González Uribe
Juan Mejía TrejoJuan Gaytán Cortés
(Sub-Coordinators)
UNIVERSIDAD DE GUADALAJARA
Centro Universitario de Ciencias Económico Administrativas

Primera edición, 2015
D.R. © 2015, Universidad de GuadalajaraCentro Universitario de Ciencias Económico AdministrativasAv. Periférico Norte 799, Edificio G-306Núcleo Los BelenesZapopan, Jalisco45100, MéxicoTel-fax: +52 (33) 3770 3343 ext. 25608.
ISBN: 978-607-9371-40-8
Impreso y hecho en MéxicoPrinted and made in Mexico

Contents
Introduction . . . . . . . . . . . . . . . . . . . . .9
Knowledge Management as a competitive tool for Contracted Electronic Manufacturers in Guadalajara, Mexico . . . . . . . . 11
Manuel Alfredo Ortiz-Barrera, José Sánchez-Gutiérrez,Juan Mejía-Trejo y Elsa Georgina González-Uribe
Effectiveness of branding strategies implemented in social networks.The case of the restaurant industry in Mexico . . . . . . . . . 27
Celestino Robles-Estrada, Jorge Pelayo-Maciely Alberto Suastegui-Ochoa
The Influence of Supply Chain Management and supplierIn Manufacturing SME for further Competitiveness . . . . . . . 45
Octavio Hernández-Castorena y Aguilera Luis-Enríquez
Michoacan state lemon’s innovation network . . . . . . . . . 63Joel Bonales, Eunice Gallegos, América Zamoray Odette Delfín
FEMSA. Expansion strategies . . . . . . . . . . . . . . 85Araceli Rendón-Trejo, Andrés Morales-Alquiciray Irene Juana Guillén-Mondragón
The Linking Process: Product Life Cycle, Diffusion Process,Competitive Market structures and Nature of the Market . . . . . 109
Vish-Iyer y Nancy-Church

The Future of Marketing: Staying Competitivein a Competitive World . . . . . . . . . . . . . . . . . 115
Nancy J. Church y Vish Iyer
Type of innovation and customer knowledge management, in Mexico . 137Juan Mejía-Trejo, José Sánchez-Gutiérrez,Elsa Georgina González-Uribe y Guillermo Vázquez-Ávila
Collaboration Impact on Financial Results and Cost Reductionin Mexican SMES . . . . . . . . . . . . . . . . . . 167
Gabriela Citlalli López-Torres, Gonzalo Maldonado-GuzmánSandra Yesenia Pinzón Castro y Ricardo García Ramírez
Creative industries innovation using Galois group theory . . . . . 181Víctor G. Alfaro-García, Anna M. Gil-Lafuentey Gerardo G. Alfaro-Calderón

9
Introduction
G uadalajara has become in recent years a city where several contract manufacturing companies have been established, competing with Asia for new projects. This book opens with
an analysis of how Knowledge Management may be used as a com-petitive tool for attracting those projects and to anchor this industry in Mexico.
As the second largest city in Mexico, Guadalajara is also becoming an attractive place for vacations and the service industry, specifically the restaurant industry becoming active in the use of Internet Social Net-works, this so a right branding strategy using communities may generate advantageous positioning for the restaurants placed in the city.
Supply Chain Management is also an important factor for the growing of Small and Medium Size Enterprises (SMEs), making them more competitive in a globalized world. An analysis of 288 SMEs in Aguascalientes, an industry oriented city in the center of Mexico lights which strategies have a greater impact in the relationship between suppliers and SMEs.
Mexico is also one of the top lemon producers in the world, Mi-choacán, a southwest state, is the leading producer in the country. This paper explains the innovative network of distribution from pro-ducers to exporters in order to maintain their competitive advantage.
FEMSA is one of the top international corporations in Mexico, comprising from bottling and distributing Coca-Cola and beer, and also being the largest convenience stores chain in Mexico, expanding also to Center and South America. The paper explains and reviews its expansion strategies, from mergers, alliances and acquisitions in order to grow and expand successfully.
The theoretical paper talks about the future of marketing, focus-ing in the dynamic and fast change of the world, so the importance of

10
José Sánchez Gutiérrez
skills and practices are reviewed of non-traditional and non-academic sources are recommended as a way to be close enough to these changes.
All these changes also require the understanding of customers and the innovation in order to satisfy them. Customer Knowledge Management is a tool used to be ahead of these requirements, and a proper model and indicators are important to be innovative. The software sector is one of the most innovation demanding, so finding these indicators would improve and create competitive advantages in Mexico.
A competitive market demands collaboration between clients and enterprises, so the study of the financial aspect of these will result in better financial numbers and cost reduction. Analyzing SMEs in Aguascalientes in order to quantify these economic consequences have important implications on judgment for future actions.
As we stated lines above, innovation is a key factor for keeping competitive advantages, especially for creative industries. Using a fuzzy logic procedure in a city and its tourism products shows how it is possible to avoid trial and error procedures, and with a solid method-ology, the possibilities to be successful are greater.
We hope that this book awake the interest of the readers about the competitiveness.
José Sánchez Gutiérrez

11
Knowledge Management as a competitive tool for Contracted
Electronic Manufacturers in Guadalajara, Mexico
Manuel Alfredo Ortiz-Barrera1
José Sánchez-Gutiérrez1
Juan Mejía-Trejo1
Elsa Georgina González-Uribe1
AbstractThe knowledge revolution completely changed the landscape of industries worldwide. For the Mexican electronics industry the challenge is to increase their competitive edge in order to enhance their participation and cope with the steady growth of its similar Asia. In the city of Guadalajara in Mexico cluster known as Silicon Valley, the opportunities for change are endless, so is required to implement a theoretical model that favors the creation of value for their products and services. Thus the importance of focusing on the marketing knowledge you have the courage to combine sufficient and secondly to position themselves in the minds of international consum-ers production.Keywords: Marketing Knowledge, Competitiveness, Electronics Industry.
1. Universidad de Guadalajara-Centro Universitario de Ciencias Económico Administrativas,-Departamento de Mercadotecnia y Negocios Internacionales

12
Ortiz-Barrera, Sánchez-Gutiérrez, Mejía-Trejo y González-Uribe
Introduction
W e are experiencing a change in corporate vision where com-petitive advantage has crossed the tangibility and begins to rely on the most valuable intangible resource that exists:
Knowledge (McIver, Lengnick-Hall, Lengnic-Hall and Ramachandran, 2013). The so-called knowledge society has become a skill prized by organizations to survive and make viable decisions to solve everyday problems (Austin, 2012), knowledge is a precious resource that allows the organization to collect and collective experiences suits the needs and changes that the market determines (Hsin-Mei, Peng-Jung, I-Fan and Yi-Tien, 2013).
Knowledge is an infinite resource that has the ability to adapt di-rectly to the organizational structure and culture of the company (Li-Su and Cheng-Po, 2014) so that companies have the ability to make direct application to increase the skills of highly specific activities that are important in the organization (Yang and Wu, 2008), that is why after the implementation of information technologies impact is much more interesting and profitable for the organization implement stra-tegic development driven structured and tailored to organizational needs (Dulipovici and Robey, 2013) knowledge.
For the electronics industry, the process of knowledge manage-ment must be to a new level, this due to the continuing evolution of innovation and development processes that give rise to superior tech-nology; however the proposed processing of products in the enclaved companies in the city of Guadalajara, Mexico, model focuses its ef-forts on manufacturing contracted, so that attracting new consumers need to strengthen the knowledge-focused marketing, mainly services, adapting to the needs and requirements of organizations that raise the growth of its production plants and exploiting its core competencies that can lead to innovation and new product development.
Justification
Electronic industry in Mexico is known in the business world as the Mexican Silicon Valley, is located in the city of Guadalajara, in the state of Jalisco; the city consists of a well suitable infrastructure for

13
Knowledge Management as a competitive tool for Contracted Electronic Manufacturers in Guadalajara, Mexico
this type of business, plus its proximity to the port of Manzanillo, Colima, the most important of the Pacific Coast, and rapid communi-cation with the City of Mexico and the United States, make this city a key to the development of international technological activity point.
The major changes in production patterns and further in search of higher returns for contracting companies manufacturing services, which are often clustered tapatío it offers make many projects migrate across the Pacific by consider cheaper labor, is when the national busi-ness and those with FDI seek a feasible way to retain customers and provide higher quality services, which although can be similar to those offered by the Asian industry, must demonstrate a stronger level of competitiveness and interest requirements of industrial customers.
The development of this research is aimed at reviewing the the-oretical models of Knowledge Management Marketing in order to formulate a workable proposal for increasing the competitive advan-tage in organizations of the electronics industry in Guadalajara Met-ropolitan Area, achieving repositioning the industrial cluster among international consumers through strategies that meet the needs and requirements of industrial customers anywhere in the world, making thus the knowledge to act as principal axis regulation and creation of consumer satisfaction corporate and end based on collection proce-dures and data ownership into tangible experiences that enrich the intangible capital of the organization.
Theoretical Framework
It is well known that the electronics industry is one of the most influ-ential internationally (Corporate Catalysis India, 2014), the fact is that produces a wide variety of items, ranging from industrial consump-tion, even in small consumer products scale (López, et Al, 2010..); this is how the emerging markets of Southeast Asia have been playing a predominant role in the way of doing business in the electronics indus-try (Li, Tan and Hidal, 2011), while the so-called developing countries, mainly in Latin America, are overwhelmed to regain lost market and offer innovative services to their customers (Cortés, 2004).

14
Ortiz-Barrera, Sánchez-Gutiérrez, Mejía-Trejo y González-Uribe
Chart 1Consumption Electronics Market Segmentation
Source: Self elaboration with Consumer Electronics Industry Profile: Global. (2010). Consumer Electronics Industry Profile: Global, 1.
Figure 1 shows that the Latin American market is a major con-sumer of general electronic products, however most consumer elec-tronics that are acquired in the new continent are undoubtedly from the Far East, mainly from China, Taiwan, Korea and Japan.
The challenge is increased when those data to the local context, where the cluster of Mexican Silicon Valley, located in the city of Gua-dalajara, Jalisco, requires a real transformation in which Mexico can reach production levels from similar Asian overlap focusing in high-er quality (Manterola, 2008), is thus to be retaken values Merchand (2005) found in this business cluster, through which it can constitute a real and competitive transformation, these values mentioned are:1. Use of trained personnel in the region.2. Search for government support of industrial growth.3. Increased industrial participation in activities intrinsic to the clus-
ter.4. Networking for minimizing production costs.5. Favouring national proveeduría for the production of basic goods.

15
Knowledge Management as a competitive tool for Contracted Electronic Manufacturers in Guadalajara, Mexico
Also is important to establish and manage a model focused on the cre-ation of competitive advantages based on theoretical models applied to business reality in Mexico, is therefore required to be put to work to intangible assets of organizations through the application of knowl-edge management and marketing orientation.
Undoubtedly this implementation is a natural step since more than any industry, it is completely embedded in the application of in-formation technologies for administrative purposes and knowledge (Mehrdad, Seyedeh and Sadati, 2013); is why many consultants and internal members of the organizations, agree that establishing knowl-edge management processes have the ability to increase productivity and improve the status of the company in monetary terms (McIver, Lengnick-Hall and Ramachandran, 2013), while knowledge has the ability to perform the increase in perceived value of the tangible ele-ments of the organization, including products sold (Evans and Ali, 2013), is in this way that management knowledge drift towards a much more mercadológico sense, thereby increasing the yield of knowledge in product planning.
The acquisition and use of persuasion knowledge in terms of mar-keting, requires the development and implementation of three skills (Freeman and Shapiro, 2014):• Persuasive messages: set focus to potential customers in the clus-
ter, linked to a corporate campaign of personal sales of internatio-nal services by the parent companies campaigns.
• Training Cluster Interests: Increase positioning through interna-tional exploitation of the advantages of the Mexican cluster on its Chinese like.
• Staff: Recognition of customer needs, information processing and transformation into useful knowledge for the organization in terms of continuous process improvement.
It is then that the essence of market knowledge is discovered and begins to act continuously, so that the generation of intangible assets has the ability to form strategic mixtures that can be used in other subsidiaries that operate internationally (Roth, Jayachandran, Dakhli and Colton, 2009) and can establish a collaborative process that con-tributes to the continuous improvement of the clusters and the growth of the individual operations of each of the organizations (Benett,

16
Ortiz-Barrera, Sánchez-Gutiérrez, Mejía-Trejo y González-Uribe
Mousley and Ali-Choudhury, 2008), taking this in mind it is important to mention that in creating stronger economies is a substantial com-petitive advantage for organizations that handle it smoothly (Panda, 2013).
But companies need to establish healthcare processes highly spe-cialized to launch first a model of this size and make sense of their ex-periences inter organizational and extra-organizational (Schlegemilch and Penz, 2002), that is why in his investigation Yuan Wang, Li-Hua and Xu (2009) mention that storage procedures and application of knowledge must be based on the accumulation of skills from experi-ences with clients as well as with the environment of the organization in terms of their participation market.
That is why the implementation capacities of knowledge must have as its main purpose to develop advantages in the production and marketing of goods and services (Akroush, Al-Mohammad, 2010), is when the company must create a business model that increases the value chain marketing and productivity thereof (Rust, Ambler, Car-penter, Kumar and Srivastava, 2004), so you have a clear market ori-entation and provide continuous improvement in goods and services can give (Cader, 2007).
Research methodology
To reinforce this research we decided to use first a method Docu-mentary Research, which as defined by George McCulloch (2013) is “a method comprising the analysis, appropriation and use of docu-ments and files whose information is of current interest for scientific research, particularly by strengthening the theoretical areas of the final document, “thus reinforcing in terms of theoretical research which argument the frontier of knowledge into the final document is granted is nevertheless an investigation argued only publications of authors with references or similar theme can lead to stagnation in applied knowledge, so that it requires a descriptive analysis, which categorize the quantitative elements that may be obtained in order to provide valid than research (Freeman, 2009).
Similarly, the challenge of formulating a reliable instrument to provide reliable information on the situation of companies in the

17
Knowledge Management as a competitive tool for Contracted Electronic Manufacturers in Guadalajara, Mexico
electronics industry, so it was decided to make some adjustments from biased questionnaires and questions isolated papers scientists faced Harvard Business Review, however in order to make the proper pro-cessing of responses was preferred adapt the instrument to the Likert scale, which has five degrees of agreements, each of the questions was ordered in such a way to form batteries with which he is interviewed provide a rapid response to the questionnaire, this way is to measure at-titudes very heteogeneos particular social contexts (Ávila Baray, 2006).
Theoretical And Methodological Construction
Source: Own calculations, based on observation of the instrument and its variables.
The formation of the theoretical construct - methodology is com-pletely based on the physical distribution of the applied questionnaire in this construct the dependent and independent variables used to correlate and get the results of verification or rejection of specific hy-potheses or the relevant general hypothesis is it is in this way it is pos-sible to start with quantitative analysis in SPSS 19 statistical software.
Hypothesis
H1. A better understanding of marketing, bulk Management Customer Relationship.
H2. A senior administration of the relationship with the customer, greater knowledge of marketing.

18
Ortiz-Barrera, Sánchez-Gutiérrez, Mejía-Trejo y González-Uribe
Results analysis
The application of the questionnaires was performed a total of 25 people who make up the segment management and marketing head-quarters electronics manufacturing firms hired; the decision to inter-view this staff is the middle management of the organization and to have the necessary information on the implementation of manage-ment models of marketing in the plant, as well as knowledge of the policies that the parent company was taken; Likewise the contact is much easier with them.
Chart 2 Gender and Age Distribution
Source: Self elaboration with questionnaire data
Shown in the graph management positions in the electronics in-dustry are dominated by men, as 23 managers are male, while only two women meet within that hierarchical level; well ages ranging between 30 and 44 years, which speaks of the responsibility.
After reviewing the descriptive data, we proceeded to perform validation of the results found in the questionnaire through statistical Cronbach’s alpha, which can be interpreted as an estimate of consis-tency and homogeneity of responses corresponding to a portion of the variance where the range is determined by the percentage of correla-tion and homogeneity of responses and whose principle dictates that

19
Knowledge Management as a competitive tool for Contracted Electronic Manufacturers in Guadalajara, Mexico
in no case be equated to 100% because consist of a single invariant response from the respondents (JALT, 2002 ).
Tabla 1Cronbach Alpha
Cronbach Alpha Tipifyed Alpha Elements.640 .690 18
Source: Self elaboration with questionnaire data.
Acceptance of alpha Cronbach is total, since both established ele-ments, ie those that are not strictly homogeneous, and alpha Cron-bach a ratio of 64% is shown, ie the variables showed a positive trend and application, but to some extent you can change the circumstances of the internal or external environment; likewise were considered in the statistical software only 18 items and the rest were obvious differ-ences in their responses.
However in order to increase the confidence of the data obtained through the questionnaire, application of the Test of Sphericity of Bartlett, which measures the strengths of relationships between vari-ables is performed, taking into account the null hypothesis for each segment matrix constructed by the independent and dependent vari-ables, in order to be meaningful test should have a maximum of 0.005 significance and chi square 500 to 3000 (Wilkinson, 2009); similarly in the test can be found the sample correlation coefficient Kaiser-Meyer-Olkin (KMO), where the variables equal expressed in processing, so that they have a mutual correlation allowing them to interact between themselves and more complex results in a multivariate analysis; the result is expressed as a percentage correlation variables, which should preferably be between 40% and 70%, since in this way is possible to go deeper into the results of particular interest.

20
Ortiz-Barrera, Sánchez-Gutiérrez, Mejía-Trejo y González-Uribe
Tabla 2KMO and Bartlett’s Test of Sphericity
KMO 0.579Bartlett’s Test of Sphericity Squared Chi 2340.74
DF 430Sig. .000
Source: Self elaboration with questionnaire data.
Shown in Table 2, the variables have a correlation of 57.9% that is more than half of the investigation can be explained with the results obtained from surveys, although industry conforms 12 companies and that 25 surveys were applied can be displayed that hypotheses are with the possibility to be made from multivariate studies using statistical software, moreover the significance level mentioned is highly signifi-cant given that the level of statistical error is minimal as it marks 000 so you can say that is 99% reliable research.
Hypothesis 1
For further research, it is necessary to start with the multivariate anal-ysis of the data obtained for this implementation Analysis of Variance (ANOVA) was performed, in order to know the relationship between the variables proposed in Hypothesis 1.
H1. A better understanding of marketing, bulk Management Customer Relationship.
The junction of the two variables, using the Administration Customer Relationship as a dependent variable, and knowledge of marketing as an independent variable, such that the following was obtained was performed:

21
Knowledge Management as a competitive tool for Contracted Electronic Manufacturers in Guadalajara, Mexico
Table 3 ANOVA Hypothesis 1
Suma de Cuadrados
GL Media Cuadrática
F Sig
Med_01 Integrupos .591 1 .591 .724 .000Intragrupos 18.769 23 .816Total 19.360 24
Source: Self elaboration with questionnaire data.
It is observed that the results of the survey in terms of the correla-tion of the two variables raised, promotes an increase in the value of customer relationships and showing both intergroup and intragroup consistent and consistent with that obtained in the quadratic mean behavior, so that we can say that has been established as a major axis for determining marketing strategies related to
However, there are issues that need improvement since the results show disparity in the statistical F, that for being above 70%, ie they are still making changes to achieve exploit more fully the knowledge from suppliers and product consumers, who are not the general public, to improve strategies to attract new businesses or keep those already hired the services regularly.
Analysis of Hypothesis 2
A senior administration of the relationship with the customer, greater knowledge of marketing, cites the number two hypotheses, here are required to take to managing the relationship with the client as an independent variable, while knowledge management marketing will be dependent, this scheme is formed by grouping the variables and the formation of homogeneous states average and quite useful.

22
Ortiz-Barrera, Sánchez-Gutiérrez, Mejía-Trejo y González-Uribe
Table 4ANOVA Hypothesis 2
Square Sum DF Cuadratic Mean F SigMed_01 Integrupos 4.800 4 1.200 .649 .000
Intragrupos 51.200 20 2.560Total 56.000 24
Source: Self elaboration with questionnaire data.
Managing the relationship with the customer, is shown formally as a tool for direct creation of market knowledge, which is why compa-nies are successful in retaining and attracting potential customers, it is shown that the levels of significance crossing variables are very close to zero ranges, moreover statistic Fisher although not entirely consis-tent manages to establish that companies are striving to give an excel-lent view of production to companies that hire them, which is why that international companies like Microsoft or Apple have decided to go for this type of production in Mexico, and thus companies have gen-erated a marketing strategy based on customer retention with CRM models that make them more competitive.
Conclusions and recommendations
The hypotheses to be tested starting work in a reliable and satisfac-tory manner based on the results obtained in studies of ANOVA were applied individually at various crossings variables; the importance of corroboration of these assumptions is that the electronics industry within each corporate entity is on a constant search for useful knowl-edge based on the experiences of its employees, the information obtained by its managers from knowledge of its Center knowledge as a real tool for international competitiveness enables companies to achieve the goals set for them and spread of these employees and man-agers who work there, that from obtaining relevant data to improve the procedures made, it is also important to note that knowledge allows decisions, develop strategies and promote changes from international competition, with all that the organization becomes intelligent.

23
Knowledge Management as a competitive tool for Contracted Electronic Manufacturers in Guadalajara, Mexico
Knowledge of marketing in companies engaged in the electronics industry of manufacturing Guadalajara Metropolitan Area has con-tributed directly to the development of this branch promoting preven-tion and troubleshooting, as well as finding solutions to the constantly changing demands market, adapting innovative new trends and a sys-tem of globalized market and extremely competitive products.
References
Akroush, M. y Al-Mohammad, S. (2010). The effect of marketing knowledge management on organizational performance: an empirical investigation of the telecommunications in Jordan. International Journal of Emerging Markets, 5(1), 38-77.
Austin, T. (2012). Viewpoint: Gartner on the changing nature of work.BBC News, http://www.bbc.co.uk/news/business-16968125
Ávila Baray, H. L. (2006). Biblioteca virtual eumed.ned. Recuperado de http://www.eumed.net/libros/2006c/203/2k.htm
Bennett, R., Mousley, W., & Ali-Choudhury, R. (2008). Transfer of Marketing Knowledge Within Business-Nonprofit Collaborations. Journal Of Nonprofit & Public Sector Marketing, 20(1), 37-70. doi:10.1080/10495140802165352
Cortes, R. (2004). Samsung Electronics Latin America focuses on Puerto Rico. Caribbean Business, 32(7), 55.
Consumer Electronics Industry Profile: Global. (2010). Consumer Electronics Industry Profile: Global, 1.
Corporate Catalysis India (2014). Electronics Industry in India. Small Business: New Delhi.
Dulipovici, A., & Robey, D. (2013). Strategic Alignment and Misalignment of Knowledge Management Systems: A Social Representation Perspective. Journal of Management Information Systems, 29(4), 103-126. doi:10.2753/MIS0742-1222290404
Evans, M., & Ali, N. (2013). Bridging Knowledge Management Life Cycle Theory and Practice. Proceedings of the International Conference On Intellectual Capital, Knowledge Management & Organizational Learning, 156-165.
Freeman, J.V., (2009). Collection of Statistical Papers. Polopoly, 1(3), 520-560.

24
Ortiz-Barrera, Sánchez-Gutiérrez, Mejía-Trejo y González-Uribe
Freeman, D., & Shapiro, S. (2014). Tweens’ Knowledge of Marketing Tactics: Skeptical Beyond Their Years. Journal of Advertising Research, 54(1), 44-55. doi:10.2501/JAR-54-1-044-055
Hsin-Mei, L., Peng-Jung, L., I-Fan, Y., & Yi-Tien, S. (2013). Knowledge transfer among mne’s subsidiaries: a conceptual framework for knowl-edge management. International journal of organizational innovation, 6(1), 6-14.
JALT (2002). Testing and Evaluation: Cronbach Alpha: 6(2).Li, H. K., Tan, K., & Hida, A. (2011). Sustaining growth in electronic man-
ufacturing sector: lessons from Japanese mid-size EMS providers. International Journal of Production Research, 49(18), 5415-5430. doi:10.1080/00207543.2011.563897
Li-Su, H., & Cheng-Po, L. (2014). Knowledge management adoption and diffusion using structural equation modeling. Global Journal of Business Research, 8(1), 39-56.
López, G., Tiznado, H., Soto, G, et.al. (2010). Corrosión de dispositivos elec-trónicos por contaminantes atmosféricos en interiores de plantas indus-triales de ambientes áridos y marinos. Nova Scientia, 3(5), 11-28.
Manterola, M.A. (2008). Jalisco: El milagroso “Silicon Valley” Mexicano. Recuperado de http://www.emb.cl/electroindustria/articulo.mvc?xid=878&tip=7
Mciver, D., Lengnick-Hall, C. A., Lengnick-Hall, M. L., & Ramachandran, I. (2013). Understanding Work and Knowledge Management From A Knowledge In- Practice Perspective. Academy Of Management Review, 38(4), 597-620. doi:10.5465/amr.2011.0266
Mciver, D., Lengnick-Hall, C. A., Lengnick-Hall, M. L., & Ramachandran, I. (2013). Understanding Work and Knowledge Management from a Knowledge In- Practice Perspective. Academy Of Management Review, 38(4), 597-620. doi:10.5465/amr.2011.0266
Mehrdad, H., & Seyedeh Faezeh Sadati Seyed, M. (2013). Effect of Knowledge Management on Success of Customer Relationship Management in Eghtesad Novin Bank of Tehran. International Journal Of Business Management & Economic Research, 4(6), 839-848.
Merchand, M. A. (2005). La política industrial jalisciense para promover la localización de empresas electrónicas estadounidenses en la Zona Metropolitana de Guadalajara. Espiral, 3(40), 67-106.
Panda, T. K. (2013). Search Engine Marketing: Does the Knowledge Discovery Process Help Online Retailers?. IUP Journal of Knowledge Management, 11(3), 56-66.

25
Knowledge Management as a competitive tool for Contracted Electronic Manufacturers in Guadalajara, Mexico
Roth, M., Jayachandran, S., Dakhli, M., & Colton, D. (2009). Subsidiary Use of Foreign Marketing Knowledge. Journal of International Marketing, 17(1), 1-29. doi:10.1509/jimk.17.1.1
Rust, R. T., Ambler, T., Carpenter, G. S., Kumar, V. V., & Srivastava, R. K. (2004). Measuring Marketing Productivity: Current Knowledge and Future Directions. Journal Of Marketing, 68(4), 76-89.
Schleglmilch, B. y Penz, E. (2002). Knowledge Management in Marketing, The Marketing Review, 3(5), 12.
Wilkinson, A. (2009). Multivariate Analysis: Managerial Application. Thompson: USA.
Yang, C.H. (2004). The Practical Operation of Knowledge Management on Life Insurance: Model Building and Case Study. Commerce & Management Quarterly, 5(1), p. 1-23.
Yuan Wang, K., Li-Hua, R. y Xu, E. (2009). Acquisition of tacit marketing knowledge. Emerald Group Publishing Limited, 1(2), 103-120.


27
Effectiveness of branding strategies implemented in
social networks. The case of the restaurant industry in Mexico
Celestino Robles-Estrada1
Jorge Pelayo-MacielAlberto Suastegui-Ochoa
AbstractBrand pages in social networks have become a new form of virtual brand community where consumers follow their favorite brands and communicate with them. Companies can take advantage from this fact to generate posi-tioning strategies on social networks in order to use this medium to rein-force their brand communication. The aim of this paper is to evaluate to what extent brand communities being developed in social networks develop successful strategies to strengthen corporate branding, to accomplish this a an empirical study was conducted to analyze the social network brand pages the four major restaurant chains in Mexico.Keywords: Social networks, digital marketing, branding
1. Universidad de Guadalajara-Centro Universitario de Ciencias Económico Administrativas

28
Robles-Estrada, Pelayo-Maciel y Suastegui-Ochoa
Introduction
S ocial networks have become a mainstay for the communica-tion strategy of many companies (Chu, 2011). Companies are leveraging the power of social networks like Facebook or Twitter
to establish a closer link with current and potential customers, as they have gained enormous popularity to meet basic needs of the individual and group membership or social interaction (Nadkarni and Hofmann, 2012). Many web sites are a reference to which consumers go to find relevant information or to share experiences with other brand. These web sites have become virtual brand communities and more dynamic now. Through brand web site on the social network, the goal of business is to get followers or ‘fans’ for their brand; hence all efforts so far have focused primarily on increasing the size of the community through vari-ous promotional strategies and communication (PuroMarketing, 2012).
Social media offers an affordable way for an organization to in-form and educate its audience. The real differentiator of social net-works of static Web presence is the ability to provide these individuals with common interests interact. Unlike the way information in most traditional forms of marketing such as newsletters, advertisements and websites, the successful use of social media involves a community committed (Schlinke and Crain, 2013).
The followers of a brand in social networks are a form of virtual brand community as it is a group of individuals with common interests in a brand and communicate with each other electronically (Sicily and Palazón, 2008). Weber (2010) has pointed out that market growth in these networks, businessmen have begun to use it as a means of adver-tising, customer relations, etc. Meanwhile Muñiz and O’Guinn (2001) consider the community as a triad consumer-company-consumers, while Palazón, Sicily and Delgado (2014) suggest that it is those indi-viduals who continue to mark those most in love and those who are more willing to speak positively of it.
The marketing in social networks has been a growing trend in recent years, thanks to offering large-scale economic benefits, often small entrepreneurs can not reach in other media (Weber, 2010). However, the fact that this type of marketing is beneficial to busi-nessman for some reasons, such as those just mentioned, does not guarantee that achieve its mission of positioning in its target market.

29
Effectiveness of branding strategies implemented in social networks. The case of the restaurant industry in Mexico
Therefore, this research seeks to measure such positioning strategies are effective for the goals set by major restaurant chains in Mexico.
To reach the measurement of branding in those companies, re-search consists of a theoretical framework and literature review, ob-jectives, methodology, results are presented and some conclusions.
Theoretical framework and literature review
According to Gbadeyan (2010) who cites Gross and Acquisti, 2005 Krasnova, Spiekermann, Koroleva and Hildebrand, 2009, A social network is definde as as “those web sites that offer the opportu-nity to interact, allowing visitors to post messages. - content of the emails, messages, web content and create or participate in the live chat (Gbadeyan, 2010) There are several social networking sites, but the most common are Facebook, Myspace, Bebo, Flickr, del.icio.us., Technorati, Wikipedia, hi 5, labroots and Picassa Facebook has over 200 million active users, while MySpace and Bebo are the other two most popular sites on the list (Facebook.com, 2009; Gbadeyan, 2010).
Among the benefits of social networking, fulfilment of social needs such as learning or locate former classmates, stay in touch with people, and to a lesser extent, the exchange of information about oneself, social improvement, and increase the popularity can be men-tioned (Foster, Francescucci and West, 2010).
Importance of social network marketing.
The marketing for social networking is increasingly important (Weber, 2010), small and medium enterprises, found in social networks commu-nication media, as achieved a massive range while the costs of imple-menting marketing strategies hereby are minimal (Pérez, 2010). Most companies are using today traditional push strategies to distribute their advertising messages to the users of social networks (Gil-Or, 2010).
Positioning is as mentioned Lamb, Hair, and McDaniel (2002) the creation of a specific marketing mix to influence the overall perception of potential consumers of a brand, product line or business. Position-ing refers to the place of that product or company in the consumer’s mind (Lamb, Hair, and McDaniel, 2002). To reach this place, Gwin

30
Robles-Estrada, Pelayo-Maciel y Suastegui-Ochoa
and Gwin (2003) established that by positioning a brand, a company tries to create a sustainable competitive advantage in an attribute or intangible--tangible product.
Marketing in the Digital Age
Wielki (2002) states that according Postema points characterize this new era of marketing: a) marketing management according to the information contained in marketing databases rather than acquired through market research and generic models. b) the use of the media instead of generic (thematic) advertising to stimulate trade, c) manag-ing personal relationships with clients and not managing groups more or less defined.
Internet marketing is a tool that requires knowledge and good strategy to achieve the desired goals, so Wang & Fesenmaier (2006) stressed at work five interrelated fatores stipulated by Parsons, Zeiss-er and Waitman (1998) among others (Gretzel, Yuan, and Fesenmaier 2000; Werthner and Klein 1999) as essential for successful digital mar-keting strategies: (1) appeal, (2) participation, (3) hold, (4) learning, and (5) relate. These factors summarize the activities that marketers must be made through the internet for the consumer to identify and participate with your brand. Wang and Fesenmaier (2006) also added three aspects that must be implemented and coordinated marketing strategies, which are: (1) the efficient use of the characteristics of web / site capabilities for the provision of information, (2) technical effec-tive website promotion, and (3) effective CRM programs online.
In addition, Koch and Steinhauser (1983) stipulated that the ef-fective implementation of a marketing strategy based on the Web requires the right combination of organizational structure and cul-ture, creative thinking, flexibility and the ability to change and adapt quickly deducting the company must be prepared for the changes that are constantly generated in the digital world, consumers are becom-ing more demanding and will provide communication between them-selves, which requires that companies are constantly evolving to keep attention client. On the other hand, Parsons, Zeisser and Waitman (1998) noted that the digital marketing offers three unique catego-ries of opportunities for marketers: 1) the timing of the delivery of information, 2) the opportunity to build a relationship whereby sellers

31
Effectiveness of branding strategies implemented in social networks. The case of the restaurant industry in Mexico
can take advantage of interactive communication media to identify an attractive selection of potential users / customers, improve customer loyalty by providing value-added services, and 3) use what they learn about their customers to customize their offerings.
So that successful marketing activities in the digital environment as Ariss, Kunnathar & Raghunathan (2000) states can be determined by many factors ranging from technology features the characteristics of the organization, in the form of tasks, market conditions and so on (Wang, Hwang & Fesenmaier, 2006).
On the other hand, Berthon, Pitt, Ewing, Branches Han and Jayaratne (2001) also highlighted the characteristics of the Web that form an important perspective of strategic marketing, which are: in-teractivity, availability 24, facilitation and flexibility, no interference from sellers, low cost, international reach, equality for both buyer and seller, lot of intermediaries.
Viral Merketing
The Internet offers many places for consumers to share their opin-ions, preferences, or experiences with others, as well as opportunities for businesses the advantage of word of mouth marketing (Trusov, Bucklin & Pauwels, 2009). Undoubtedly, consumers are increasingly open to express on any platform that allows them your preferences, likes and dislikes in every way, so that information is properly han-dled can be an excellent marketing tool, thus De Bruyn and Lilien established that viral marketing is used for communication between consumer to consumer (or peer-to-peer) to disseminate information about a product or service (Dăniasă, Tomita, Stuparu, and Stanciu, 2010), therefore we conclude that consumers interconnected, are also generating relevant information that will influence decisions of other consumers.
Branding
According to the American Marketing Association, a brand is a “name”, term, sign, symbol or design, or a combination of them intended to identify goods and services of one seller or group of sellers and dif-ferentiates the other competitors (Mohammed, Fisher, Jaworoski &

32
Robles-Estrada, Pelayo-Maciel y Suastegui-Ochoa
Paddison, 2004). Thus, a mark may be as Keller and Machado (2006) states, as a set of attributes such as personality, values, associations and quality, which influence the process of consumer purchasing.
According to Yan (2011), the objectives for brands in any strategy of social media should serve the organization both internally and ex-ternally. The organization must, first, (a) create a sense of belonging or citizenship with the organization, (b) encouraging communication and acceptance of the values of the brand, and (c) encourage the audi-ence to participate in the dialogue and promote the brand. Strategi-cally, dialogue can (d) help the company maintain a competitive edge; (e) standardize the vision of consumers towards the brand and build their differentiation towards other brands; and (f) act as a check on whether the mark is communicating and being understood by the pub-lic. The consequences are (g) build a positive brand association, (h) increase the perceived quality of the brand, and (i) raise awareness of the brand in a public that has reached yet.
Consumer behavior online
Online marketing requires a thorough understanding of how chang-ing customer behavior in the virtual world (Hanson, 2001), where users use other people’s lives to escape their own routine life (Lee, 2010), and it is for that reason, then the information presented and the behavior of the same, it changes quickly.
Zhou, Dai and Zhang (2007) have stipulated that the motivational factors play a key role in determining time spent searching for prod-ucts and online shopping. Stibel (2005) states that for consumers to make decisions over the Internet, need to be able to recover easily digest, manipulate and use relevant information, because in this way, we could infer that consumers look for convenience and speed, so that having the right information easily is an important factor in the time it takes your buying decision.
Objective
To determine the effectiveness strategies with branding on social net-works Facebook and Twitter, implemented by the four largest restau-

33
Effectiveness of branding strategies implemented in social networks. The case of the restaurant industry in Mexico
rant chains in Mexico, during the month of April 2013, for which the following objectives were developed: • Determine the major restaurant chains nationwide who use social
networks to apply research.• Analyze the main positioning strategies that are being used in so-
cial networks Facebook and Twitter.• Identify measurement models branding.
Research methodology
The research aims to determine whether branding strategies imple-mented by restaurant chains in Mexico through its pages on social networks Facebook and Twitter are being effective, ie are meeting the objectives desired positioning. As a comparison between the desired position and the actual position, so that discrepancies between them allowed recognizing whether or not there, effectiveness of strategies was conducted.
The type of method used was deductive-inductive, as part of a general phenomenon as is the use of social networks and be focusing on positioning strategies that appear in these as well as the implica-tions for businesses, and whether in sales or positioning. As for the type of research was cross because the data were collected at this spe-cific moment, where the rise of social networks is generated. In this case, the selected brands are Sanborns, Toks, Vips and Wings, part of the largest and best known restaurant chains in Mexico. These brands have pages on Facebook and Twitter.
The sample was determined following the methodology applied by Maehle, Otnes and Supphellen (2011) in their investigation con-cerning the perception of consumers in the dimensions of brand per-sonality, in which 66 college students were chosen with an average age of 23.5 years. Similarly, Visentin, Colucci and Luca Marzocchi (2013) used surveys to university students in Italy in his study on scales mea-suring brand and cognitive dimensions. Therefore, this study selected 66 college students who were “fans” and “followers” of the restaurant chains in the two social networks.
The application of the instrument of data collection was electroni-cally, and consisted at first stay for general questions about the use

34
Robles-Estrada, Pelayo-Maciel y Suastegui-Ochoa
and the reasons for it, social networks, using multiple choice questions which are asked to choose only one option (closed) questions. Subse-quently a list of statements is presented to meet the user’s attitude to the studied brands, which are asked to answer based on a Likert scale of 7 points, where 1 is “strongly disagree” and 7 “totally agreement. “The survey results were analyzed with the SPSS statistical program, performing a descriptive analysis of the variables of the scale, a prin-cipal components factor analysis, a correlation matrix and finally a correspondence analysis.
On the other hand, qualitative data were obtained through an eth-nographic method, based on the study of the behavior of groups of individuals, through passive observation. In the case of marketing this method it is called ethno marketing, in which, according to Zapata, and Fioravanti, (2009), attention should focus on the phenomenon of consumption, the role of objects, their meanings in life projects in the social fabric, discourses that govern society, business and the individual, allowing him to transcend and contribute to the practice of marketing.
Results
The survey used for this research was conducted with 40 women and 26 men with an average age of 22 years, of which 95.5% responded most frequently used social network Facebook; this does not mean it is the only one used, but the most important to them; also devotes 65.2% of 2-3 hours daily browsing these (Table 1).
Table 1 What social network you use most often?
Frequency Percentage Valid percent Cumulative percentage
Facebook 63 95.5 95.5 95.5Twitter 1 1.5 1.5 97.0Youtube 2 3.0 3.0 100.0Total 66 100.0 100.0
Source: Based on data from the survey.
35
Effectiveness of branding strategies implemented in social networks. The case of the restaurant industry in Mexico
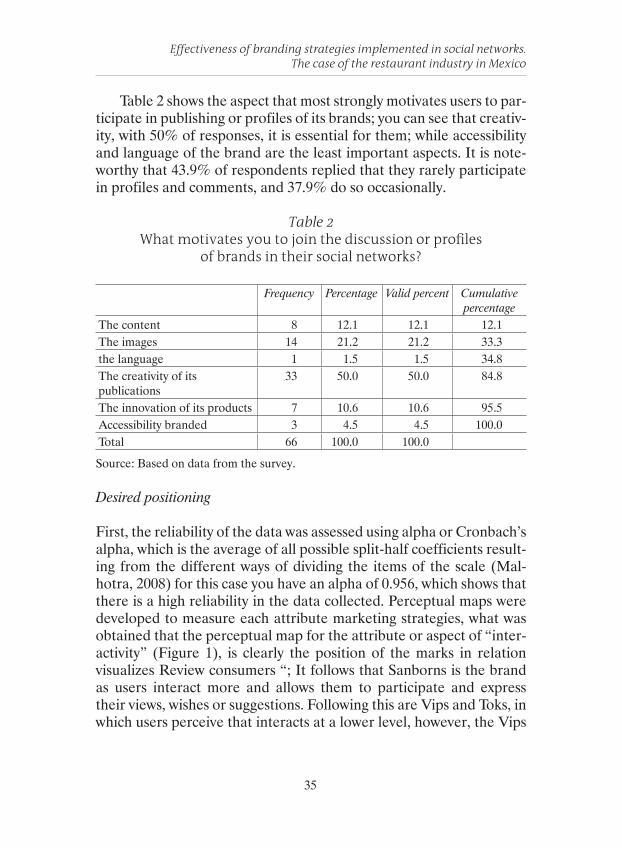
Table 2 shows the aspect that most strongly motivates users to par-ticipate in publishing or profiles of its brands; you can see that creativ-ity, with 50% of responses, it is essential for them; while accessibility and language of the brand are the least important aspects. It is note-worthy that 43.9% of respondents replied that they rarely participate in profiles and comments, and 37.9% do so occasionally.
Table 2 What motivates you to join the discussion or profiles
of brands in their social networks?
Frequency Percentage Valid percent Cumulative percentage
The content 8 12.1 12.1 12.1The images 14 21.2 21.2 33.3the language 1 1.5 1.5 34.8The creativity of its publications
33 50.0 50.0 84.8
The innovation of its products 7 10.6 10.6 95.5Accessibility branded 3 4.5 4.5 100.0Total 66 100.0 100.0
Source: Based on data from the survey.
Desired positioning
First, the reliability of the data was assessed using alpha or Cronbach’s alpha, which is the average of all possible split-half coefficients result-ing from the different ways of dividing the items of the scale (Mal-hotra, 2008) for this case you have an alpha of 0.956, which shows that there is a high reliability in the data collected. Perceptual maps were developed to measure each attribute marketing strategies, what was obtained that the perceptual map for the attribute or aspect of “inter-activity” (Figure 1), is clearly the position of the marks in relation visualizes Review consumers “; It follows that Sanborns is the brand as users interact more and allows them to participate and express their views, wishes or suggestions. Following this are Vips and Toks, in which users perceive that interacts at a lower level, however, the Vips

36
Robles-Estrada, Pelayo-Maciel y Suastegui-Ochoa
brand is also closer to “strongly agree”. Finally the company Wings presents a level of interaction that is perceived as bad.
Figure 1Interactivity perceptual map
In the corresponding “user-centered” map shows that the Vips brand is completely related to “strongly agree” Sanborns again closer to the “Agree”, while Toks mark is placed at 4 being “Indifferent” and Wings for his part in “somewhat agree”.
Regarding the attribute “based on human”, the Sanborns and Vips, brands are near grade 6, with the “Agree”, while Toks to “some-what agree” and Wings is well below standing expected to “strongly disagree”. So it is concluded that in this respect the Vips and Sanborns brands are those with higher ranks.

37
Effectiveness of branding strategies implemented in social networks. The case of the restaurant industry in Mexico
Figure 2perceptual map user-centered

38
Robles-Estrada, Pelayo-Maciel y Suastegui-Ochoa
Figure 3perceptual map based on the human
In the perceptual map “Share” are clearly observed levels of con-sumer preference in relation to trademarks, first with a value of 6, ie, a “Alright” is the Vips brand, followed by Sanborns with a ‘somewhat agree “with a rating of 4 (preference) is the Toks brand and finally the Wings brand with a” somewhat disagree”.
As shown in Map 4, it was found that Vips and Sanborns brands are well evaluated in reference to their performance on social net-works, getting closer to 9. However positioning, watching detail can also see a slight approach Vips to the highest score, 10. As is well below Wings with a rating of 5 and Toks get a “good” rating with 8.

39
Effectiveness of branding strategies implemented in social networks. The case of the restaurant industry in Mexico
Figure 4 Perceptual Map Share
Figure 5 Perceptual Map Rating Brand

40
Robles-Estrada, Pelayo-Maciel y Suastegui-Ochoa
Conclusions
It can be concluded that brands presenting this research have levels of interaction and efforts of different types of marketing, although four have decided to dedicate their strategies to the same attributes. It was also noted that the results of these vary depending on the interactiv-ity and content they generate. Many studies show that interactivity is a key factor because it allows consumers to contact the company or even contact other consumers (Cova & Pace, 2006).
Therefore, consumers value the attention, understanding and closeness that companies have towards them, and social networks al-low this to become a reality by providing platforms on which compa-nies without the stress level than other media, devote such attention the user by generating empathy and brand recognition, the interaction of consumers within the community can be stimulated by the company to propose different content or themes around which the relations between the parties be increasing (Sicily & Mariola, 2008).
According to the above, the theory behind social networks is ring-ing. Brands must be genuine. Those who are “superficial” or false soon discover (Yan, 2011). Consumers then feel greater ownership and commitment to those brands that demonstrate and generate them confidence. From the form of communication to the frequency and closeness will be decisive for users to participate, discuss and interact and the community feel brand factors. It is important to make them feel part of it and create empathy.
Proof of this are the brands studied, where it was found that un-der this brand personality scale, two of them (Sanborns and Vips) implement effective strategies being relative positioning they want to achieve; on the other hand, Toks and Wings, brands seem to be on the right track, however, clearly denotes a little or inefficiencies in their strategies.
Was observed in Toks and Wings, communication between com-pany and consumer is very low or even zero, ie, the company does not respond to user your questions, suggestions or comments, so make an effort to answer everyone of them will increase its involvement and will be more involved with the company. Also, as in the case of San-borns and Vips brands use contests and promotions online is a strat-egy that allows increased uptake and interest by the user.

41
Effectiveness of branding strategies implemented in social networks. The case of the restaurant industry in Mexico
Furthermore, the use of images that complement the information but also attract in the first seconds of observation, are also beneficial tools to increase user interest. It has been commented that images can be more valuable than words in the case of social networks, as it plays a key role in representing the content to be read (Vegas Ubil-lús, 2013). Therefore, make good use of them, not necessarily to show product or service, but also in reference to the lifestyle of the user, you can generate a feeling of empathy and thus closer to the target consumer.
Online social networks are configured as the tool of Web 2.0 best suited for those business strategies focusing on customer orientation, ie, concerned about customizing your message, interaction with the recipient and maintenance of two-way communication with the client in order to achieve their loyalty (Castelló Martínez, 2010).
References
Armstrong, S. (2002). La publicidad en Internet. España: Deusto.Berthon, P., Pitt, L., Ewing, M., Ramaseshan, B., & Jayaratna, N. (2001).
Positioning in Cyberspace: Evaluatuing telecom Web sites using corre-spondence. Information Resources Management Journal, 14(1), 13-21.
Chu, S.C. (2011) “Viral Advertising in Social Media: Participation in Facebook Groups and
Responses among College-Aged Users”, Journal of Interactive Advertising, 12(1), 30-43.
Cova, B., & Pace, S. (2006). Brand community of convenience products: new forms of customer empowerment – the case “My Nutella the Community”. European Journal of Marketing, 40(9/10), 1087-1105.
Dăniasă, C. I., Tomiţă, V., Stuparu, D., & Stanciu, M. (2010). The mecha-nisms of the influence of viral marketing in social media.. Economics, Management & Financial Markets, 5(3), 278-282.
Foster, M. K., Francescucci, A., & West, B. C. (2010). Why Users Participate in Online Social Networks. International Journal Of E-Business Management, 4(1), 3-19.
Fuetterer, S. (2010). Mi comunidad, ¿Me quiere o no me quiere? Best Relations S.A.
Gbadeyan, R. (2010). Direct Marketing to Online Social Network (OSN) Users in Nigeria. International Journal of Marketing Studies, 275-282.

42
Robles-Estrada, Pelayo-Maciel y Suastegui-Ochoa
Gil-Or, O. (2010). Building Consumer Demand by using Viral Marketing Tactics within an Online Social Network. Advances in Management, 3(7), 7-14.
Gwin, C. F., & Gwin, C. R. (2003). Product attributes model: a tool for evalu-ating brand positioning. Journal Of Marketing Theory & Practice, 11(2), 30.
Hair Jr, J. F., Anderson, R. E., Tatham, R. L., & Black, W. C. (1999). Análisis multivariante (Quinta edición ed.). Madrid, España: Prentice Hall.
Hanson, W. (2001). Principios de mercadotecnia en Internet. (M. C. Eychenbaum, Trad.) México: Thomson learning.
Lamb, C., Hair, J., & McDaniel, C. (2002). Marketing (6ta ed.). México: Thomson.
Lee, D. (2010). Growing Popularity of Social Media and Business Strategy. SERI Quarterly, 3(4), 112-117.
Malhotra, N. K. (2008). Investigación de mercados (Quinta edición). México: Pearson Educación.
Martínez Castelló, A. (2010). Estrategias empresariales en la Web 2.0. Alicante, España: Editorial Club Universitario.
Mohammed, R. A., Fisher, R. J., Jaworski, B. J., & Paddison, G. J. (2004). Internet Marketing (segunda edición). Singapore: Mc Graw Hill.
Nadakarni, A.; Hofmann, S.G. (2012). “Why do People Use Facebook?”, Personality and Individual Differences, 52, 243-249.
Palazón, M., Sicilia, M. Y Delgado, E., (2014). El papel de als redes socia-les como generadoras de “amor a la marca”, Universia Business Review, Primer Trimestre 2014, 18-40
Pérez, F. J. (2010). Las nuevas redes sociales ¿Moda o revolución? Nuestro tiempo, 52-61.
Schlinke, J., and Crain, S., (2013). Social Media from an Integrated Marketing and Compliance Perspective, Journal of Financial Service Professionals, March 2013, 85-94
Sicilia, M., & Palazón, M. (2008). Brand communities on the internet,A case study of Coca-Cola’s Spanish virtual. Corporate Communications: An International Journal, 13(3), 255-270.
Stibel, J. M. (2005). Mental models and inline consumer behaviour. Behaviour and Information Technology, 24(2), 147-150.
Trusov, M., Bucklin, R., & Pauwels, K. (2009). Effects of Word-of-Mouth Versus Traditional Marketing: Findings from an Internet Social Networking Site. Journal of Marketing, 73(5), 90-102.
Vegas Ubillús, E. (18 de Febrero de 2013). Puro Marketing. Obtenido de http://www.puromarketing.com/42/15279/poder-imagen-mitos-visual-social-media.html#

43
Effectiveness of branding strategies implemented in social networks. The case of the restaurant industry in Mexico
Visentin, M., Colucci, M., & Luca Marzocchi, G. (2013). Brand measure-ment scales and underlying cognitive dimensions. International Journal Of Market Research, 55(1), 43-57.
Wang, Y., & Fesenmaier, D. R. (2006). Identifying the Success Factors of Web-Based Marketing Strategy: An Investigation of Convention and Visitors Bureaus in the United States. Journal of Travel Research, 44(239), 238-249.
Wang, Y., Hwang, Y.H., & Fesenmaier, D. R. (2006). Futuring Internet Marketing Activities Using Change Propensity Analysis. Journal of Travel Research, 45(158), 157-166.
Weber, L. (2010). Marketing en las redes sociales. México: Mc Graw Hill.Yan, J., (2011). Social media in branding: Fulfilling a need. Journal of Brand
Management, 18, 9, 688–696Zapata, C. & Fioravanti.(2009). La etnografía como un acercamiento
interdisciplinario en el mercadeo: un nuevo intento. Cuadernos de Administración, 22(38), 101-119.
Zhou, L., Dai, L., & Zhang, D. (2007). Online Shopping acceptance model -a critical survey of consumer factors in online shopping. Journal of elec-tronic commerce research, 8(1), 41-62.


45
The InFluence of Supply Chain Management and supplier In
Manufacturing SME for further Competitiveness
Octavio Hernández-Castorena1
Aguilera Luis-Enríquez1
AbstractThis paper suggests a theoretical model and an evaluation instrument built by blocks Supply Chain Management (SCM) and Competitiveness, which through fieldwork, the participation of SMEs Manufacturing managers took into Aguascalientes with a sample of 288 companies. The collected data was analyzed with statistical analysis technique appropriate structural equations for the design of theoretical models support software EQS where the results show that the SCM have a significant influence on Competitiveness allow-ing highlight that employers must implement strategies that impact directly on the benefits of the excellent relationship with suppliers since their par-ticipation important influence not only on the issue of SCM but also in the competitiveness of manufacturing SMEs.Keywords: Supply Chains Management, Competitiveness, SME’s.
1. *Autonomous University of Aguascalientes.

46
Octavio Hernández-Castorena y Aguilera-Enríquez
Introduction
These days, the Small and Medium Enterprises (SMEs) in the man-ufacturing sector, the issue of supply is an activity that requires con-tinuous consideration both owners and managers, and it is important to consider the Supply Chain Management (SCM) as an activity that operates through a network of suppliers, producers and mediators of all network since the aim of their involvement in the supply network is to progress the dynamics of supply having as main support collaboration and agreements with suppliers (Hernandez, Aguilera and Colin, 2013; Christopher, 1998; New and Payne 1995; Simchi-Levi, Kaminsky and Simchi-Levi, 2000). Of course, this corporate vision is based on how important it is for the SCM, involvement by the supplier (Wisner, 2003).
On the other hand, it is important to note that manufacturing SMEs, stop not constantly have important challenges facing ever in-creasing in meeting the demands of either the market in general or any particular client (Ciborra, 1993) requirement, forcing these com-panies to react and to cover a critical point, is the fulfillment of supply in the required time and in this sense, to have a close relationship with suppliers, management of resources will more likely have good results and thus a SCM more efficient and to ensure supplies for the internal processes of the companies do not have delays or problems to meet its internal goals and of course, having no compliance issues with cus-tomers (Hernández, et al, 2013;. Tyan, Wang and Du, 2003).
Whereas it is true that the issue of the relationship with suppli-ers by manufacturing SMEs, has advanced significantly (Heide and George, 1990), it is important to mention that some of these improve-ments are due to the type of strategies that have been implemented, and have had a major influence on important aspects such as the col-laboration, improve confidence from that shared information and that previously have been integrated strategies to evaluate suppliers in ap-pearance than are related to the nature of the purchases and the type of companies which are required to establish a business relationship (Ernst and Bamford, 2005; Liker and Choi 2004). Importantly, the relationship with suppliers is elementary since the purpose is to have safer performance at any supply (Varma, Wadhwa and Deshmukh, 2006; Kumar, 2001; Wisner, 2003).

47
The Influence of Supply Chain Management and supplier in Manufacturing SME for further Competitiveness
In this regard, it is important to note that the objective of this study is to measure and analyze the influence of the SCM in the com-petitiveness of the SME manufacturing through the relationship that you have with the supplier considering the strategies being imple-mented with the suppliers and the type of collaboration and agree-ments that may arise. It is also important that managers are questions whether the implementation of strategies allow a better SCM and thus be more competitive company; and on the other hand, one must question whether the close cooperation and generating agreements with the supplier be key to manufacturing companies have greater competitiveness. The research conducted in this study is structured as follows: In the first part the introduction, theoretical framework, purpose and research questions, In the second part, the methodologi-cal design and integrates shown statistical analysis Finally, in a third of the findings, conclusions, limitations of the study and future research lines are shown.
Literature review
Supply Chain Management and its relation to the commissary
For businesses such as manufacturing SMEs, the relationship with your providers is key for supplies and control in the management of material resources do not have compliance problems (Hernandez et al, 2013; Wisner, 2003). And for this, managers require sizing the importance of knowing the route to be used for management of sup-plies and rely on the Supply Chain Management (SCM), same regard-less of its natural complexity, efficiency as well as its management is focused on the coordination of manufacturers, distributors, transport, external agents and retailers where information management plays an important role for the supplies have control and treatment of a benefit impact on commitments have with customers (Wisner, 2003; Morgan and Monczka, 1995).
In this sense, for the SCM is a key element in increasing competi-tiveness in manufacturing SMEs, it is important that the relationship with the proveeduría optimal and for that managers need to integrate strategies that allow them to have a successful choice provider for so

48
Octavio Hernández-Castorena y Aguilera-Enríquez
within the criteria to be considered in the selection process should be focused on supplier performance, to have transparent processes of purchase and have adequate systems sales service (Osorio, Her-rera and Vinasco, 2008). According to the contributions of Sarache, Castrillon and Ortiz (2009) show in their research that for a suitable choice of providers should consider the following:1) Analysis of the context and characteristics of the supply chain.2) The strategy implemented for the function of supply and decision
criteria.3) Identify a method that contains indicators to support decision ma-
king when evaluating suppliers.
For its Garcia Romero and part Channels (2010) show in their model focuses on the multi-objective optimization option that allows deci-sion making through the use of indicators such as cost, service, reli-ability, management, organization and technology. Importantly from within companies, managers need to devise a deployment designed so as to enable an assessment to safe and reliable suppliers for the SCM allows optimum supply (Hasan, Shankar and Sarkis, 2008; Ruiz, Ablanedo and Ayala, 2012; Tracey and Tan, 2001). On the other hand, Moynihan, Saxena and Fonseca (2006) show a system through inte-grating in its assessment providers, factors such as cost, delivery time, distance and Supplier own characteristics, facilitate management and control supply in the distribution of material resources management.
Companies such as manufacturing SMEs through SCM efficien-cy and optimization in relations with the procurement, aim to have greater business competitiveness (Morgan and Monczka 1995), and for this, as shown by McGitinis and Vallopra (1999), the integration of strategies and collaboration agreements with suppliers, will enable the development and competitiveness of manufacturing SMEs have a significant development. This means that if the connection with the procurement is reliable, the maximum SCM avoid delays and failures affecting the development of the internal process of such organiza-tions (Van der Vorst, Beulens and Adrie, 2002; Handfield and Nich-ols, 1999; Krause, 1997), also good relationship with your providers allow SCM efficiency is reflected in the quality in the management of material resources, timely delivery and proper management of infor-mation (Hernandez et al, 2013; Choi and Hartley, 1996).

49
The Influence of Supply Chain Management and supplier in Manufacturing SME for further Competitiveness
Supply Chain Management and its relation to the competitiveness
In the SME manufacturing companies like today, to have a proper SCM is important that all stakeholders have an optimum level of com-munication and for this, one of the main players is the provider as starting supply management in this phase requires effective coordina-tion to ensure that deliveries of supplies are on time, with required quantities and quality in the delivery process and the product itself (Wisner, 2003; Porter, 1980). Of course, having an efficient SCM, supply of material resources can be generated without delay problems and allow production processes meet the goals set within the manu-facturing SME thereby generating, trust with customers (Aguilera, Hernandez and Lopez, 2012; Vallopra and McGitinis, 1999; Burt and Soukup, 1985).
It is important to have a reliable SCM, in order to have a competi-tive business; managers need to integrate into their control strategies, processes to allow continued assessment of the effectiveness of SCM (Zangoueinezhed, Azar and Kazazi, 2011). To do this, managers need to focus on setting goals that will generate benefits that affect the development and competitiveness of manufacturing companies and SMEs since by their nature, require more attention in follow up to as-sess the performance of any strategy implemented in the performance of the SCM and certainly in the performance of each integrator hav-ing an important role in the provision of material resources (Richey, Chen, Upreti, Fawcett and Adams, 2009; Shepherd and Gunter, 2006; Chan and Qi, 2003; Gunasekaran, and Tirtiroglu Patel, 2001).
Although the SCM is an operational activity impact on manufac-turing companies, especially in SMEs, the interest from entrepreneurs to increase business competitiveness indices is to continuously im-prove supply management as a business having supply problems seri-ously jeopardize the commitments made to customers and this is det-rimental to the competitiveness of these businesses (Hill and Tones, 1998) in this regard and in accordance with input from the OECD (1992, cited in Solleiro and Castañón, 2005), the most important ele-ments that affect the competitiveness of companies and allow better SCM are:a) Having an efficient management of production flows, as well as
raw materials inventories.

50
Octavio Hernández-Castorena y Aguilera-Enríquez
b) Having an effective management of the mechanisms of interac-tion between planning, marketing, research and development, de-sign, engineering and industrial production.
c) Having the ability to combine research and development as well as innovation in cooperation with universities and other companies.
d) Having the ability to incorporate more precise definitions of de-mand characteristics and evolution of the market in design and generation strategies.
e) Having the ability to successfully organize inter-business relation-ships with suppliers and customers.
f) Having improving skills as well as skills of workers through in-vestment in specialized training and in generating high levels of responsibility for production workers.
Consequently, it is important to emphasize that it is important for the manufacturing SME mention that the efficiency of the SCM through a correct implementation of strategies, greater collaboration and generation of agreements with suppliers, will impact and influ-ence significantly for greater competitiveness in companies such as manufacturing SMEs (Wisner, 2003; Hernández et al, 2013;. Ruiz, Mendoza and Ablanedo, 2013; Aguilera et al, 2012.). In this sense, the present research and consistent with the theoretical findings, the following hypothesis is proposed:
H1: A major strategy with suppliers, greater competitiveness in manufac-turing SMEs.
H2: A greater collaboration and agreements with suppliers, greater compe-titiveness of manufacturing SMEs.
H3: The greater the Supply Chain Management, increased competitiveness in manufacturing SMEs.
Methodology
In this investigation, the influence Supply Chain Management through supplier collaboration in Manufacturing SMEs in Aguascalientes for greater competitiveness and it is analyzed through an empirical study under a correlational methodological context and descriptive, an

51
The Influence of Supply Chain Management and supplier in Manufacturing SME for further Competitiveness
assessment tool that was sent to managers of manufacturing SMEs was designed. The methodology of this study is shown in the data sheet in the table no.1 (INEGI, 2014):
Table 1 Data sheet
Indicator study DescriptionUniverse Small businesses and medium enterprises in the
manufacturing sector which are between 11 and 25 employees
Geographical scope NationalPopulation Size 442Sample size 288
Sampling procedureMuestreo estratificado proporcional al tamaño y sector de la empresa
sampling error +/- 8 Confidence level 95 %; Z = 1.96; p = q = 0.5Period of completion of fieldwork August-December 2013
Source: Own Elaboration
Development Measures
For the preparation of the measuring instrument which was applied to the Manufacturing SMEs in Aguascalientes it is contained by the following blocks: To block Supply Chain Management with 20 items measured 1-5 Likert scale were used which are operationalized from low to high importance (Wisner, 2003), which is shown in table no.2:
Table 2 Scale for measuring Supply Chain Management (SCM)
CS1 Determine future customer needsCS2 Reducing response times through the supply chainCS3 Improve the integration of activities across the supply chainCS4 The search for new ways to integrate the activities of supply chain systemCS5 Creating a higher level of confidence throughout the supply chainCS6 The increased capabilities of your company just in time

52
Octavio Hernández-Castorena y Aguilera-Enríquez
CS7 Using an external service provider in supply chain systemsCS8 Identify and participate in additional supply chainsCS9 Establish a more frequent contact with members of the supply chainCS10 Creating a communication supply chain support and information systemCS11 The creation of formal information exchange agreements with suppliers and
customersCS12 Existence of an informal way to share information with suppliers and
customersCS13 Contact users supply chains to achieve product and customer service
feedbackCS14 Involve all members of the supply chain in the marketing plans of your
company’s products / servicesCS15 Communicate strategic future needs of customers throughout the supply
chainCS16 The extent of supply chains beyond your enterprise customers and suppliersCS17 The communication of your company in the future strategic needs with
suppliersCS18 Participate in marketing efforts of customers of your companyCS19 Participation in decision-making supply business providersCS20 Teaming supply chain system, including members of the various companies
involved
And finally, for the second block, measuring the level of competi-tiveness take into account three basic factors: financial performance consisting of 6 items; reducing purchasing costs consists of 6 items; using technology and composed of 6 items, adapted to Buckley et al., (1988) and Chang, et al, (2005) ranging from complete agreement to disagree, same as shown in table no.3:
Table 3 Scale to measure Competitiveness
FP1 Our ROI has been good in the past three yearsFP2 Our sales have been very good in the past three yearsFP3 Our financial results have been very good in the past three years.FP4 Our profits have been good in the past three yearsFP5 Our debt has declined significantly over the past three yearsFP6 Loans contracted in the last three years have been at preferential rates.PC1 Coordination costs with our suppliers are low

53
The Influence of Supply Chain Management and supplier in Manufacturing SME for further Competitiveness
PC2 Costs orders with our suppliers are lowPC3 Transportation costs are low with our suppliersPC4 The costs of deliveries of products with our suppliers are low.PC5 The costs of raw materials and inputs with our suppliers are low.PC6 Production costs of our company are lowTE1 Developing technologiesTE2 Development of products and / or servicesTE3 Development of production processes and / or servicesTE4 Planning projectsTE5 Improvement of machinery and equipmentTE6 Development of information technology
Then in Figure no. 1 The theoretical model designed for this re-search and measuring the Influence of Supply Chain Management through supplier collaboration in Manufacturing SMEs in Aguascali-entes for greater competitiveness shown.
Figure 1Theoretical Model
Source: Hernández, 2014, from Wisner, 2003 and Maldonado (2008).
For the statistical analysis in this study, a confirmatory factor anal-ysis (CFA) in order to evaluate the reliability and validity of the scales of each integrated in the theoretical model blocks are performed. A

54
Octavio Hernández-Castorena y Aguilera-Enríquez
Model of Structural Equation (MEE), in order to check the efficiency of the structure of the model, using the statistical tool support EQS version 6.1 was used. Likewise, the reliability of the scales where the internal reliability between indicators by reference to the value of Cron-bach’s alpha and composite reliability index (IFC) (Bagozzi and Yi, 1988) indicated was analyzed. Table 1 shows that all values of the IFC exceeded the recommended level of 0.7 (Nunnally and Bernstein, 1994; Hair, Anderson, Tatham and Black, 1995) and determines that the model provides a good fit based on the following data obtained from confirmatory factor analysis: S-BX2 = 2863.5350; df = 556; p = 0.0000; NFI = 0.959; NNFI = 0.965; CFI = 0.967; and RMSEA = 0.079, all items related factors are significant (p <0.05), the size of all the factor loadings are greater than 0.6 (Bagozzi and Yi, 1988) and the index of the extracted variance (IVE) of each pair of constructs is greater than 0.5 according to the proposed Fornell and Larcker (1981).
Table 1Internal consistency and convergent validity
of the theoretical model
Variable
indi
cato
r
t rob
ust
CF
> 0
.6
fact
or lo
adin
g
aver
age
load
fa
ctor
alph
a cr
onba
ch >
a
0.7
IFC
> a
0.7
R
elia
bilit
y In
dex
IVE
> a
0.5
, In
dex
Varia
nce
extr
acte
dStrategies of Suppliers (F1)
CS01 1.000 0.783*** 0.753 0.954 0.946 0.908
CS02 19.969 0.789***
CS03 20.037 0.776***
CS04 18.598 0.790***
CS05 19.150 0.766***
CS06 15.052 0.746***
CS07 11.610 0.694***
CS08 15.125 0.729***
CS09 18.035 0.749***
CS10 18.695 0.760***
CS11 15.087 0.705***Σ 8.287

55
The Influence of Supply Chain Management and supplier in Manufacturing SME for further Competitiveness
Variable
indi
cato
r
t rob
ust
CF
> 0
.6
fact
or lo
adin
g
aver
age
load
fa
ctor
alph
a cr
onba
ch >
a
0.7
IFC
> a
0.7
R
elia
bilit
y In
dex
IVE
> a
0.5
, In
dex
Varia
nce
extr
acte
d
Collaboration and Agreements with Suppliers (F2)
CS13 1.000 0.723*** 0.790 0.948 0.963 0.942
CS14 4.596 0.791***
CS15 4.151 0.806***
CS16 4.532 0.789***
CS17 4.689 0.792***
CS18 4.508 0.807***
CS19 4.769 0.800***
CS20 4.603 0.815***Σ 6.323
Competitiveness (F3)
FP01 1.000 0.875*** 0.729 0.951 0.995 0.990FP02 40.804 0.805***FP03 41.890 0.814***FP04 40.260 0.797***FP05 24.816 0.762***FP06 26.727 0.757***PC02 14.265 0.651***PC04 16.710 0.666***PC05 15.485 0.631***PC06 15.827 0.651***TE01 26.119 0.726***TE02 27.054 0.721***TE03 27.169 0.712***TE04 22.824 0.697***TE05 22.824 0.668***TE06 15.848 0.724***Σ 11.657
S-BX2 (df = 556) = 2863.5350; p < 0.0000; NFI = 0.959; NNFI = 0.965; CFI = 0.967; RMSEA = 0.079
a = parameters that value in the identification process. *** = p < 0.001Source: Own Elaboration

56
Octavio Hernández-Castorena y Aguilera-Enríquez
Table 2 shows the results describing the discriminant validity through two test are presented. First, the range of 95% confidence, none of the individual elements of the factors contains the value 1.0 (Anderson and Gerbing, 1988). Second, the extracted variance be-tween each pair of constructs the model is higher than its correspond-ing IVE (Fornell and Larcker, 1981). Consequently, we can conclude that this research sample based on statistical analysis of their results sufficient reliability and convergent evidence besides discriminant va-lidity.
Table 2 Validity of the discriminant measure of the theoretical model
Variables Strategies of Suppliers
Collaboration and Agreements with
Suppliers
Supply chain management
Strategies of Suppliers
0.908 (0.515)2 (0.312)20.265 0.097
Collaboration and Agreements with Suppliers
0.515 0.049 0.942 (0.426)2
0.417 0.613 0.181
Supply chain management
0.312 0.039 0.426 0.056 0.9900.234 0.390 0.314 0.538
Source: Own Elaboration
The diagonal represents the index variance extracted (IVE), while above the diagonal part of variance (The correlation to the frame) is shown. Below the diagonal, the estimate of the correlation factor with a confidence interval of 95% is presented.
Results
One SEM (Equation Model Structural), was conducted to check the structure of the conceptual model and contrasting hypotheses, using blocks in the evaluation instrument which are described as follows: First block consisting of variables measuring Supply Chain Manage-ment and the second block with variables that measure the competi-

57
The Influence of Supply Chain Management and supplier in Manufacturing SME for further Competitiveness
tiveness of the company. The nomological validity of the model was tested by performing the test of square Chi, in which the theoretical model was compared with the measurement model (Anderson and Gerbing, 1988; Hatcher, 1994), the overall results of the analysis are shown in table no.3:
Table 3Results of SEM Conceptual Model Competition Production
Hipótesis Structural relationship Standardized coefficient
Robust t value
FIT Measure
H1: The more strategy with suppliers, greater competitiveness in manufacturing SMEs
Strategies of Suppliers
Compe-titiveness
0.477*** 20.901 S-BX2 = 3325.6028; df = 659; p = 0.0000; NFI = 0.957; NNFI = 0.963; CFI = 0.965; RMSEA =0.079
H2: A greater collaboration and agreements with suppliers, greater competitiveness in manufacturing SMEs
Collaboration and Agreements with Suppliers
Compe-titiveness
0.337*** 10.554
H3: A greater management of the supply chain, increased competitiveness in manufacturing SMEs
Supply chain management
Compe-titiveness
0.407*** 25.058
Hypotheses show results described below: With concern to the first hypothesis H1, the results presented in Table 3 (β = 0.477, p <0.001), indicating that the strategy with suppliers have a positive influence on the competitiveness of SMEs. For the second hypothesis H2 results (β = 0.337, p <0.001), indicating that collaboration and agreements with suppliers has a positive influence on the competitiveness of manufac-turing SMEs. And for the third hypothesis H3 results (β = 0.407, p

58
Octavio Hernández-Castorena y Aguilera-Enríquez
<0.000), indicating that the Supply Chain Management has a positive influence on the competitiveness of manufacturing SMEs.
Conclusions and discussion
In recent years, managers responsible for developing the SME manu-facturing have seen that compliance demands by customers and levels of competitiveness by competing firms have been required, and this has forced managers adopt strategies that allow them to stay in the middle and not be vulnerable at the end of its operational activities. In this sense, apart from other important factors that should be analyzed and monitored within enterprises, the core operating factor involved with the production part in any company is the efficiency of the man-agement of the supply chain and good management with providers where strategies, collaboration and agreements that are carried out with these major players, have an important influence on the develop-ment and competitiveness of these organizations.
To do this, and sizing the importance of having a close relation-ship with suppliers, managers should think about the benefits that the share from an ethical point of view, the handling of information that relates to the activity of supply which involves suppliers, manufactur-ers, brokers and even when it is needed in the supply chain to service Outsourcing. Importantly, for some managers and from a cultural point of view, information sharing them represents a risk that affects them in the business relationship or in the performance of their com-panies, so it is important to work hard on these issues to generate Se-belius and trust between providers, however, do not put aside the key to having a reliable supplier is to have made a good choice.
Among the factors affecting the competitiveness besides having a bad SCM and a bad relationship with suppliers is the cost manage-ment of production processes and transportation costs. And in this sense, this study aims to results obtained, have a significant impact in making decisions that have to carry out the managers of manufactur-ing SMEs and described below:a) To identify the latent risks throughout the supply chain.b) To analyze whether the current supplier management is ethical
and efficient.

59
The Influence of Supply Chain Management and supplier in Manufacturing SME for further Competitiveness
c) Establish a system supplier audits with indicators that are aligned with the goals of the company and of course the nature of business of the supplier.
d) Establish procedures for quantitative character to choose suppliers considering indicators that primarily benefit the business relation-ship and security in compliance with the supplies.
e) Establish mechanisms together with the supplier for the handling of information in the activity of supplies is ethical, reliable and productive.
Lastly it is important to note that the relationship with your provid-ers as described Wisner (2003) in his research, which highlights that the integration of strategies, coordination and agreements must be close on the basis of the good business relationships, management of ethical and reliable, have an effective SCM also coordinated with all stakeholders with supplies and have mechanisms that allow them to managers identify early risks that have a direct connection with the performance of supplies, so the risk of not being a competitive company will be minimal. Likewise, it is also important to note that managers should consider in their business strategies, counting on an evaluation system which considers indicators that enable manufactur-ing companies become more competitive.
In this sense, the present study has limitations having worked with one sector (SME manufacturing) in a single region is the state of Aguascalientes and engineering metrics managers of these busi-nesses survey. So as future lines of research is to deepen the opinion and perception of managers on the issue of SCM and its relation to the commissary by means of interviews with the same measurement scales used in this study, therefore, we speculate that the needs of the SME manufacturing may be more influential on the competitiveness of these businesses.
References
Aguilera, E. L., Hernández, C. O. y López, T. C. G. (2012). La gestión de las cadenas de suministro y los procesos de producción. Mercados y Negocios, 13(2), 43-66.

60
Octavio Hernández-Castorena y Aguilera-Enríquez
Anderson, J. & Gerbing, D. (1988). Structural equation modeling in practice: a review and recommended two-step approach. Psychological Bulletin, 13(1), 411-423.
Bagozzi, R. & Yi, Y. (1988). On the evaluation of structural equation mod-els. Journal of the Academy of Marketing Science, 16 (1), 74-94.
Buckley, J. P., Pass, L. C. & Prescott, K. (1988). Measures of international competitiveness: A critical survey. Journal of Marketing Management, 4(2), 175-200.
Burt, D. & Soukup, W. (1985). Purchasing’s Role in New Product Development. Harvard Business Review, 63(5), 90-97.
Chang, H. C. (2004). An Application of Fuzzy Sets Theory to the EQQ Model with Imperfect Quality Items. Computers and Operations Research, 31(12), 2079-2092.
Chan, F. T. S. & Qi, H. F. (2003). An innovative performance measurement methods for supply chain management. International Journal of Supply Chain Management, 8(3), 209–223.
Christopher, M. (1998). Logistics and Supply Chain Management, 2 Ed. New York; Financial Times/Prentice Hall.
Choi, Y. T. & Hartley, L. J. (1996). An Exploration of Supplier Selection Practices across the Supply chain. Journal of Operations Management, 14, 333–343.
Ciborra, C.U. (1993). Teams, markets and systems. Cambridge: Cambridge University Press.
Ernst, D. & Bamford, J. (2005). Your alliances are too stable. Harvard Business Review, 83,133–140.
Fornell, C. & Larcker, D. (1981). Evaluating structural equation models with unobservable variables and measurement error. Journal of Marketing Research, 18(1), 39-50.
García, A. J. L., Romero, G. J. y Canales, V. I. (2010). Selección de prov-eedores usando el método MOORA, CULCyT, 7(1), 40-41.
Gunasekaran, A., Patel, C. & Tirtiroglu, E. (2001). Performance measure-ment and metrics in a supply chain environment. International Journal of Operations and Production Management, 21(1–2), 71–87.
Hair, J. F., Anderson, R. E., Tatham, R. L. & Black, W. C. (1995). Multivariate Data Analysis with Readings. Prentice-Hall, New York, NY.
Handfield, R. & Nichols, E. L. (1999). Introduction to Supply Chain manage-ment. Upper Saddle River, NJ: Prentice-Hall.
Hasan, M. A., Shankar, R. & Sarkis, J. (2008). Supplier selection in an ag-ile manufacturing environment using data envelopment analysis and analytical network process. International Journal of Logistics Systems and Management, 4(5), 523 – 550.

61
The Influence of Supply Chain Management and supplier in Manufacturing SME for further Competitiveness
Hatcher, L. (1994). A Step by Step Approach to Using the SAS System for Factor Analysis and Structural Equation Modeling. Cary, NC, SAS Institute Inc.
Hernández, C. O., Aguilera, E. L. y Colín, Salgado, M. (2013). La Gestión de los Proveedores: Estrategia clave para una mejor Gestión de la Cadena de Suministro en la Pyme Manufacturera en Aguascalientes. Estudios de Ciencias Sociales y Administrativas de la Universidad de Celaya, 3(1), 9-20.
Heide, J. B. & George, J. (1990). Alliances in Industrial Purchasing: The Determinants of Joint Action in Buyer-Supplier Relationships. Journal of Marketing Research, 27, 24-36.
Hill, C. W. L. & Tones, G. R. (1998). Strategic Management. Houghton Mifflin Company. Boston, New York, 442–471.
Instituto Nacional de Geografía e Informática. (2014). Base de datos consul-tada en la ciudad de Aguascalientes, Ags. México.
Kumar, K. (2001). Technologies for supporting supply chain management. Communications of the ACM, 44 (6), 58–61.
Krause, D. R. (1997). Supplier development, current practices and out-comes. International Journal of Purchasing and Materials Management, 33(2), 12–19.
Liker, J. & Choi, T.Y. (2004). Building deep supplier relationships. Harvard Business Review, 82,104–112.
McGinnis, M. & Vallopra, R. (1999). Purchasing and Supplier Involvement in Process Improvement: A Source of Competitive Advantage. Journal of Supply Chain Management, 35(4), 42-50.
Morgan, J. & Monczka, R. (1995), Alliances for New Products. Journal of Production Procesess Management. 118(1), 103-109.
Moynihan, G. P., Saxena, P. & Fonseca, D.J. (2006). Development of a deci-sion support system for procurement operations. International Journal of Logistics Systems and Management, 2(1), 1–18
New, S. & Payne, P. (1995). Research Frameworks in Logistics: Three Models, Seven Dinners and a Survey. International Journal of Physical Distribution and Logistics Management, 25(10), 60-77
Nunnally, J. C. & Bernstein, I. H. (1994). Psychometric Theory. 3ª ed. New York: McGraw-Hill.
OECD. (1992). The Technology and the Economy. The Key Relationships. París: Organization for Economic Co-operation and Development.
Osorio, G. J. C., Herrera, U. M. F. y Vinasco, M. A. (2008). Modelo para la evaluación del desempeño de os proveedores utilizando AHP. Ingeniería y Desarrollo, 1(23), 43-58.
Porter, M. (1980). Competitive Strategy, New York: The Free Press.

62
Octavio Hernández-Castorena y Aguilera-Enríquez
Richey, R. G., Chen, H., Upreti, R., Fawcett, S. E. & Adams, F. G. (2009). The moderating role of barriers on the relationship between drivers to supply chain 108 A. Zangoueinezhad et al. integration and firm performance. International Journal of Physical Distribution and Logistics Management, 39(10), 826–840.
Ruiz, T. A. J., Ablanedo, R. J. H. y Ayala, C. J. (2012). Modelo de asignación de compras a proveedores considerando su flexibilidad y probabilidad de incumplimiento en la entrega. Estudios Gerenciales, 28(122), 29-48.
Ruiz, T. A. J., Mendoza, A. y Ablanedo, R. J. H. (2013). Modelo para la planificacion en la cadena de suministro: Selección y asignación a prov-eedores en el caso de lotes fijos. Ingeniería y Desarrollo, 31(1), 1-21.
Sarache, C. W. A., Castrillón, G. O. D. y Ortiz, F. L. F. (2009). Selección de proveedores: una aproximación al estado del arte. Cuadernos de Administración, 22(1), 145-167.
Shepherd, C. & Gunter, H. (2006). Measuring supply chain performance: Current research and future directions. International Journal of Productivity and Performance Management, 55(3–4), 242–258.
Simchi-Levi, D., Kaminsky, P. & Simchi-Levi, E. (2000). Designing and Managing the Supply Chain. 4ta. Ed. New York: Irwin McGraw-Hill.
Solleiro, J. L., y Castañón, R. (2005). Competitividad y sistemas de inno-vación: los retos para la inserción de México en el contexto global. Revista Globalización, Ciencia y Tecnología, 1, 165-197
Tracey, M. & Tan, C. L. (2001). Empirical analysis of supplier selection and Involvement, customer satisfaction and firm performance. Supply Chain Management: an International Journal, 6(4), 174–188.
Tyan, J., Wang, F.K., & Du, T., (2003). An evaluation of freight consolidation policies in global third party logistics. Omega, 31, 55–62.
Van der Vorst, J., Beulens, G. A. J. & Adrie, J. M. (2002). Identifying sources of uncertainty to generate supply chain redesign strategies. International Journal of Physical Distribution & Logistics Management, 32(6), 409.
Varma, S., Wadhwa, S. & Deshmukh, S. G. (2006). Implementing supply chain management in a firm: issues and remedies. Asia Pacific Journal of Marketing and Logistics, 18(3), 223–243
Wisner, J. D. (2003). A Structural Equation Model of Supply Chain man-agement Strategies and Firm Performance. Journal of Business Logistics, 24(1), 1-26.
Zangoueinezhad, A., Azar, A., y&Kazazi, A. (2011). Using SCOR model with fuzzy MCDM approach to assess competitiveness positioning of supply chains: focus on shipbuilding supply chains. Maritime Policy & Management, 38(1), 93-109.

63
Michoacan state lemon’s innovation network
Joel Bonales1
Eunice GallegosAmérica Zamora
Odette Delfín
AbstractThe aim of this paper is to describe the variables that drive the increase in export competitiveness of the lemon sector of the state of Michoacán. It is based in innovation networks and actors, in order to develop a solu-tion to drive exports in the international market, which would bring benefits for all members of the network that comprises the System-Product-Lemon. Research and theoretical fundamentals are presented, which cover from the definitions to theories that were used for the development of this re-search, from both, innovation networks and competitiveness. It also reflects the results that were obtained through fieldwork, which were analyzed and processed resulting in the Innovation Network of lemon sector from Micho-acan’s state.Keywords: Network, Innovation, Agriculture, Lemon.
1. Universidad Michoacana de San Nicolás de Hidalgo- Instituto de Investigaciones Económicas y Empresariales.

64
Bonales, Gallegos, Zamora y Delfín
Introduction
T he agricultural sector in Mexico has extraordinary potential due to its excellent environmental conditions and diverse agri-cultural production, being Michoacán a territory with benefits
that allow to have a diverse crop production, among which are mainly avocado, strawberry, guava, lemon and blackberry.
The product which will focus this research is the lemon, because despite the excellent quality and quantity produced in the state of Mi-choacan specifically Apatzingan Valley, it has not had sufficient mo-mentum in the marketing internationally due to the lack of organiza-tion and communication between actors, coupled with a low level of innovation that placed at a disadvantage Michoacan’s lemon.
Mexican Lemon System-Product in the state of Michoacan, is ex-tremely important, since the value of its production resulted in a con-tribution of 44.64% to the state’s economy in 2013 and thus was the fourth most important product on all crops in the state of Michoacán.
Lemon is considered a priority crop within the state, this due to the importance for having a great potential in economic activity.
According to the State Information Office for Sustainable Ru-ral Development (OEIDRUS, 2013) during 2013, Michoacan’s state ranked as the third largest producer of lemon in Mexico, providing a 21.08% of the national production. Municipalities that contribute to this production are thirty one: Aguililla, Apatzingan, Aquila, Ario, Buenavista, Churumuco, Coahuayana, Cojumatlan, Zamora, La Hua-cana, Huetamo, Jiquilpan, Lazaro Cardenas, Múgica, Nuevo Urecho, Pajacuarán, Paracuaro, Periban, Los Reyes, San Lucas, Tepalcatepec, Tinguindin, Tiquicheo, Tumbiscatio, Turicato, Tuzantla, Tzitzio, Uru-apan, Venustiano Carranza, Villamar, Zamora.
The municipalities that stand out are: Buenavista, Apatzingan, Aguililla, Paracuaro, Mugica, La Huacana, Tepalcatepec and Coa-huayana. Apatzingan Valley has a land area of 8,537 km; and has also played an important role in economic activity in the state of Micho-acan, and in 1993 contributed 917 million pesos and in 2012 increased its production to 1.276 billion pesos, showing a trend of steady growth (CECIC, 2012).
Statistical data from the Statistical Information Service Agrifood and Fisheries SAGARPA reveal that Apatzingan Valley Region is lo-

65
Michoacan state lemon’s innovation network
cated at an average altitude of 300 m; with over 166 000 hectares of which 45 percent are for the irrigation and 55 percent temporary. In those hectares over 15 different fruit species are cultivated; of which the cultivation of mexican lemon has a special place because it occu-pies 54% of the surface, 23.4% corresponds to the handle, 6% of the grapefruit and the rest is occupied with other fruit (Tovar, 2006).
A particular feature of the area corresponding to the municipal-ity of Apatzingan is that is a hot city that produce lemon throughout the year and not only seasonally, like other places in Mexico (Tovar, 2006).
In Michoacan, there are one hundred thirteen municipalities, and especially lemon production is now concentrated in thirty-one mu-nicipalities that are: Aguililla, Apatzingan, Aquila, Ario, Buenavista, Churumuco, Coahuayana, Cojumatlan of Regules, Gabriel Zamora, La Huacana, Huetamo, Jiquilpan, Lazaro Cardenas, Múgica, New Urecho, Pajacuaran, Paracuaro, Periban, Los Reyes, San Lucas, Te-palcatepec, Tingüindín, Tiquicheo, Tumbiscatío, Turicato, Tuzantla, Tzitzio, Uruapan, Venustiano Carranza, Villama and Zamora (OE-IDRUS, 2011).
So, the general research question is: What is the relationship be-tween the innovation network and the actors, and how this relation-ship impacts on the competitiveness of exports of lemon sector of the state of Michoacan?
The paper was developed with the goal of inferring the variables that drive the increase in export competitiveness of the lemon sector of the state of Michoacan on the basis of innovation networks and ac-tors in order to develop a solution to increase exports competitively in the international market, which undoubtedly bring benefits together for all network members forming the product system lemon.
To achieve the objectives of the paper, the fundamentals of re-search and theoretical foundations are presented, which range from the definitions to theories that will be used for the development of research; both innovation networks and competitiveness.
This paper reflects the results that were obtained through field-work, which in turn were analyzed and processed resulting in the level of integration by the actors that make up the lemon sector.

66
Bonales, Gallegos, Zamora y Delfín
Universe of study
In Apatzingan Valley is grown the 96% of Mexican lemon produced in Michoacan, with the municipalities of greater importance of Buenavista, Apatzingan, Aguililla and La Huacana, this due to good weather, geographical conditions and application of irrigation, which has resulted in the Apatzingan Valley, it is highly productive; this cou-pled with the absence of frost in the area allows lemon production takes place throughout the year; being the winter season when the fruit is at its best price, in the absence of production in the state of Colima, main competitor and producer of lemon in our country.
Once it has located the municipalities with lemon production in Michoacan State, note that are only ten municipalities where most concentrated lemon production within the state, which in turn make up what is known as the Apatzingan valley (Tovar, 2006).
The study group was divided into two populations, the first was conducted to observe how the actors involved in the production of lemon in Apatzingan Valley Region unfold and the second, it will be observed the actors involved in the marketing of Lemon Product Sys-tem in the state of Michoacan.
The research used as population study, the representatives of the Mexican Lemon Product- System of Michoacan (SIPROLIMEX), through which, it can study and analyze the structure in the marketing chain lemon, which will help in determining its competitiveness.
Theoretical foundations
Currently, trade develops in a highly dynamic world, which is charac-terized by intense competition between companies to position them-selves in the international market, it is precisely for this reason that companies constantly generated and incorporates innovations, or as Méndez (2002) calls, new answers to help us to have a greater ability to deal effectively with current challenges, and further consolidated as a strategic factor in understanding the various observable trajectories in recent years.
Innovation has been transformed several areas of study, and busi-ness industry is no exception, as the innovative processes have led

67
Michoacan state lemon’s innovation network
growing interest among researchers, because today it is considered that the construction of enterprise networks and social together with an adequate promotion of innovation and tailored to the specific needs and possibilities of each organization become essential strate-gies for achieving your goals.
In this section, the concepts, definitions and theoretical bases re-lated to innovation networks will be analyzed, which may have a view on the constitution, function, utility and importance of them in the competitiveness development
Network
Network is a phenomenon that has been present since the beginning of the authorities, because humans seek to live in a social environ-ment and therefore both are immersed in various social networks and personal.
It was during the 30s when the first formal approach to the study of networks emerged later during the 70 graph theory with which net-work analysis was improved as an interdisciplinary field was devel-oped (Cachia, 2010).
The networks perform many functions, but the important thing is acquire a time, in a perspective of a method and a horizon, which will allow to transform the way of doing things (Carballo, 2004).
It can be considered that networks are open structures, which are able to expand without limits thus integrating new nodes, while they can communicate with each other, always say that share the same com-munication codes; a social structure that is based on networks, can be considered a very dynamic and open system, which is susceptible to innovate without threatening its balance; whereby the morphology of networks is also a source of reorganization to power relations (Con-treras, 2010).
Because the networks are developed through exchange of experi-ences emphasizing the development of attitudes and behaviors help to create a closeness despite the distance, allowing easy movement of in-formation flows, raw materials, people and energy, hence the absence of network information just does not happen (Calame, 1994).

68
Bonales, Gallegos, Zamora y Delfín
Network word comes from the Latin rete, and it is a term used to define a structure which has the general power to have a characteristic pattern.
“A network develops the exchange of experiences, but above all, develops attitudes-behavior comprising, therefore, facilitate and positively evaluate the importance of being interconnected, to learn from others, to listen and respect others. The Internet is a tool to ex-pand the innovation, network has processes or mechanisms to create, share, disseminate and use knowledge that allow networked learning” (Gordó I Aubarell, 2010).
Innovation
One of the first researchers who introduced the concept of innovation within the economic sphere was Schumpeter, who during the first half of the twentieth century made great contributions for understanding of innovation, and to demonstrate its importance in the dynamics of economic growth, the innovation is “any way of doing things differ-ently in the realm of economic life” (Lopez, 2007).
According to Schumpeter an innovative entrepreneur is motivat-ed to take the risk of introducing a new idea in the market, driven by the extraordinary benefits that it expects to receive in the future; this approach is in his Theory of Economic Development (1934), where states that have innovation are the most important force for economic growth.
Undoubtedly the economic development of an institution, orga-nization or country depends on the ability to invent (create ideas), innovate (apply ideas) and then spread them, which is why we are part of the creative idea that develops inside a company with a need to cover; these business improvements can even become enhancements or changes that affect an entire society (López, 2007).
This section will show some proposed concepts to define innova-tion, Sánchez (2008) mentions that among the many existing defini-tions of innovation, two stand out, because they allow a better idea about the concept:1. “Innovation is seen as synonymous with production, assimilation
and successfully exploit a novelty in the economic and social sphe-res, so as to provide new solutions to problems and thus allow

69
Michoacan state lemon’s innovation network
meeting the needs of people and the society. “Therefore, innova-tion aims to benefit society (European Commission, 1996).
2. “An innovation is a product (good or service) new or significantly improved for introducing to the market, or a new or significantly improved process introduced in the company. The innovation is based on the results of new technology, new combinations of exis-ting technology or utilization of other knowledge acquired by the company developments” (INE, 2011).
3. The innovations are the result of a scientific discovery that allows substantially modified products that perform certain functions, or may be changes in a group of products or processes by others (Ruiz, 1990).
4. An innovation is the implementation of new ideas, concepts, pro-ducts, services and practices intended to be useful for increasing productivity. An essential element of innovation is its successful application commercially (Muñoz, 2007).
According to López (2007), there are several types of innovation:a) Product Innovation: offer society a new or improved product, sin-
ce it may refer to variations in materials, design or new product features; it can also constitute improve reliability or a change in customer perception. The aim is basically to improve the quality, brand and image of the manufacturer.
b) Process Innovation: is the improvement in the production process of the company, a new way of working. Process innovation occurs through the implementation of new technology (machinery) and new organization in the production process or a variation thereof; usually it seeks to reduce costs in the business, but also can achie-ve greater flexibility in production, higher product quality or im-proved conditions for workers.
c) Innovation Management: This classification fall innovations that can not be classified in the above may be considered a variant of the innovation process, because they are changes that facilitate access to knowledge and better utilization conditions of both ma-terial and financial resources.
d) Incremental Innovation: lies mainly in conducting small changes aimed at increasing the functionality and performance of the com-

70
Bonales, Gallegos, Zamora y Delfín
pany which in isolation but is insignificant, when performed on a continuous basis may constitute a permanent basis for progress.
e) Radical Innovation: consists of new products or processes can not be understood as a natural evolution of what already exists, be-cause although not uniformly distributed in time and incremental innovations if they arise frequently. Such innovations have greater impact and reflect greater benefits to the company.
f) Technological Innovation: activity that results in a technological breakthrough in the development of new products or production processes or substantial improvements of existing ones; includes the realization of new products or processes in a plan, arrange-ment or design, creating an unmarketable first prototype, initial demonstration projects or pilot projects.
After review all the definitions of innovation, the classification of it, and how act the social innovation is important to point out that this research will focus in a social innovation through business manage-ment because is included in the research the networking between companies, as well as agents that are directly or indirectly related to the company. The social innovation is taken into account concerning the activities of the international sector.
Innovation network
A network of innovation is the way it is possible to provide the aver-age experience of forms of organization and learning that will allow ordering the elements of the innovation process, ie fundamentally new creative capacities in research renewal know-how and creating new formations (Méndez, 2002).
Innovation networks are a relatively costless mechanism to pro-mote innovation, which also have the virtue of connecting actors for the better collection and use of resources (OECD 2009).
“Innovation networks are regulated collective organizations with cooperative relations between actors, durable in time, knowledge and mutual trust, conducted in order to learn and innovate within a given territory in which the next trade is not excluded the farthest “(Mella, 1998).

71
Michoacan state lemon’s innovation network
Networks are usually organized along three main axes: the scien-tist who produces knowledge; the technician who conceives, transform artifacts for specific purposes and the market. The formation of an in-novation network, is defined by the degree of convergence between the different actors; the greater this degree, the greater the ability of an actor to identify and mobilize other actors with different skills, to solve a problem or deal with solvency a new proposal (Palomino, 2010).
Theoretical Foundations of networks
The networks are composed of different groups, ranging from busi-ness and academia, to producing a good or service that are related by certain factors, economic sectors or activities.
Innovation networks are by nature an evolutionary character and occur as they are developed, is why the integration of an innovation network develops members capacity to accelerate learning new be-haviors also provides its members surplus value derived from the or-ganizational dynamics of the network (Méndez, 2002).
Based on the theoretical foundations described above, it is con-cluded that the dependent variable for this research is the competi-tiveness of exports. And those variables that generate any changes or modifications on another variable which are related in some way, are: the Innovation Network and Actors (Human Resources).
So the hypothesis of this research are:H1: There is a positive relationship between the innovation network
and the actors that comprise it, which is reflected in the behavior of the export competitiveness of the lemon sector of the state of Michoacán.
H2: The proper use of the connections between actors and the dimen-sions of the structure that forms the lemon sector of the state of Michoacán, lead to a positive impact manifested by a higher level of competitiveness in exports in this sector.
H3: Provide adequate training and put into practice by actors within the network of lemon sector of the state of Michoacan, has a positive impact on increasing the competitiveness of the sector’s exports.
H4: Implement dynamics of innovation as networks, positively im-pacts, since its use causes an increase in the competitiveness of exports of lemon sector of the state of Michoacán.

72
Bonales, Gallegos, Zamora y Delfín
Research design
To visually illustrate the design of this research, a methodology was developed showcase; which is basically a map where the methodologi-cal bases that were conducted in this research are shown, see Table 1.
Once submitted methodological continue showcase, we proceed to explain each of the steps in it.
The research was conducted based on the scientific method, also presented a quantitative approach which uses collection data analysis to answer the research questions and thus helps to the verification of the hypothesis made above.
Table 1 Methodological Showcase
Source: Authors, based on the theoretical framework.

73
Michoacan state lemon’s innovation network
The assumptions made in previous sections will be tested using designs appropriate research, for which a collection of numerical data will be conducted and through a series of statistical analyzes a pat-tern between the variables will be set to finally bring check out these hypotheses.
Methods for obtaining data
According to Hanneman (2005) in the study of social networks, it is essential to establish a series of links, which may consist of any number of actors and one or more kinds of relationships between elements walls.
Fundamentally, in the analysis of a network is considered the structure of relationships in which each actor is involved, these actors are described through their connections which are shown as relevant as themselves.
Within this network analysis, the interest is in determining the de-gree of connection between the actors later to make an evaluation of it, is due to the existence of a set of actors or nodes that can be found various methods by which can perform data collection, however not all methods are applicable to this investigation, for which only two methods that help us in gathering information were selected.
In order to exploit the advantages and benefits that come with each of them and then we will provide the information necessary to conduct a Social Network Analysis (SNA) on this research; methods to be used are: the “Questionnaire” and the “Method Complete Net-works”.
Method of complete networks
This approach requires that accumulate information about each actor’s ties with others to generate a picture of the relationship, you may do so either by carrying out a census of the bonds in a popula-tion of actors rather than sampling thereof; or collecting information through databases, which leads to full descriptions that lead to an analysis of social structures (Hanneman, 2005).
Most approaches and special methods of network analysis were designed for use with full network data, which are necessary to define

74
Bonales, Gallegos, Zamora y Delfín
properly and be able to measure many of the structural concepts of network analysis such as the degree of intermediation.
The information contained in complete networks lead us to very strong descriptions that lead to analysis of social structures; the infor-mation of each member of a population can be challenging, fortunate-ly the task becomes more manageable asking to the actors to identify a limited number of specific actors with which they have a connection, which are grouped lists and interconnect, see table 1.
Usually, the bulk of people, groups and organizations tend to have a limited number of loops or strong bonds which reduces the number of actors involved (Hanneman, 2005).
It is noteworthy that each section consists of a different number of questions depending on the indicator analyzed, which is performed in order to adequately value; a brief reference to the sections of the questionnaire is show below:
Actors: This section attempts to identify the core attributes of the actors involved within the network and observe if they have any train-ing; if they don’t have any kind of capacitation is necessary to identify if there is any interest by the actor for training and the resulted from such training if there are any, which will lead to a better development of actor and consequently the network. This section will settle for a total of five questions.
Network Innovation: this section try to identify and describe the interactions and connections between actors within the network, this in order to observe and understand the dynamics of innovation and network size. This section consists of a total of twenty questions, see Table 2.

75
Michoacan state lemon’s innovation network
Table 2 Operationalizing the Independent Variables
Variable Dimension Indicator QuestionActors Attributes Age
GenderRole within the networkAccess to informationParticipation in the network
12345
Capacitation EducationTraining SystemsEffective training
78-910
Innovation network
Conexions or interactions between actors
Number of relationships you have within the network
11-1416-18
Innovation Dynamics Sources of information that foster innovation
19-24
Network Dimension Centralization 25Diffusion 15, 27-28Structuration 26
Exports Exports levels Production Network Exports 29-31
Source. Own calculations, based on the theoretical framework.
Analysis
In order to obtain a suitable instrument collection for research, it was necessary to apply a pilot questionnaire, which in turn was modified and subsequently applied to producers; this questionnaire was struc-tured by 18 closed questions and one open question to get a better interpretation of the results.
It is noteworthy that due to the confidential treatment which was reached with the producers, not the names of those who supported us to answer the questionnaire will be reflected, and only refer to as Ac-tor 1, Actor 2, Actor 3, etcetera.

76
Bonales, Gallegos, Zamora y Delfín
Table 3Data matrix derived from questionnaires
P1 P2 P3 P4 P5 P6 P7 P8 P9 P10 P11 P12 P13 P14 P15 P16 P17 P18A1 3 5 1 3 5 5 5 5 5 5 5 5 4 5 5 5 3 2A2 4 5 1 2 4 3 4 4 5 4 5 3 4 5 5 4 1 2A3 4 5 1 2 3 3 3 4 5 3 4 3 4 5 5 3 1 2A4 4 5 1 2 4 5 4 4 5 4 5 3 5 5 5 3 1 3A5 3 5 1 3 5 5 5 5 5 5 5 4 5 5 5 5 1 1A6 4 5 1 3 4 3 4 5 5 4 5 4 4 5 5 3 1 2A7 4 5 1 2 3 3 3 4 5 3 4 3 3 5 5 5 1 1A8 4 5 1 2 4 5 4 5 5 4 5 4 4 5 5 4 1 1A9 2 5 1 3 5 5 5 5 5 5 5 4 5 5 5 5 3 3A10 4 5 1 2 4 5 4 4 5 4 5 4 5 5 5 3 1 1A11 5 5 1 2 5 5 5 5 5 3 5 4 5 5 5 4 1 4A12 2 5 1 3 5 5 5 5 5 4 4 4 4 5 5 4 3 2A13 4 5 1 3 4 3 4 3 5 3 5 2 4 5 5 3 2 3A14 4 5 1 2 4 3 3 3 5 5 4 3 3 4 5 2 3 2A15 3 5 1 2 5 5 5 5 5 5 5 3 4 5 5 3 2 1A16 5 5 1 2 3 3 3 4 5 4 5 4 3 4 5 2 1 3A17 4 5 1 2 5 5 5 5 5 3 4 3 4 5 5 3 3 2A18 2 5 1 3 5 5 5 4 5 4 4 4 5 5 5 4 3 3
Source: Authors, based on information provided by theRepresentatives of Organizations Producers SIPROLIMEX.
In order to clearly present the results these were divided into three sections: actors that corresponds to the first part of the questionnaire, innovation network derived from the second section of the question-naire and finally the section called actors and innovation networks in which you can observe the interaction of both variables of the inves-tigation.
Following analysis of the results showed Likert type questionnaire in each of its sections and questions that involved was examined joint-ly variables actors and innovation networks in order to observe the degree of impact each independent variable on the dependent vari-able competitiveness.
At first partial scores of the variables obtained in the question-naire are presented, then the scalograms derivatives of each variable

77
Michoacan state lemon’s innovation network
will be observed correlations between variables of research and finally take out the method of Cronbach’s Alpha Reliability.
Table 4Rating items per variable
Variable Actors (Humans Resourses)
Innovation Network Competitiveness
A1 32 44 76
A2 27 38 65
A3 25 35 60
A4 29 39 68
A5 32 41 73
A6 29 38 67
A7 25 35 60
A8 30 38 68
A9 31 45 76
A10 29 38 67
A11 33 41 74
A12 31 40 71
A13 27 37 64
A14 25 36 61
A15 31 38 69
A16 26 36 62
A17 32 37 69
A18 30 42 72
Source: Authors, based on information provided by the Representatives of Organizations Producers SIPROLIMEX.
Look globally applied the results of the questionnaire, it was nec-essary to construct Table 4 where the number of questions is observed corresponding to each of the variables; obtained scores of variables is necessary to remember that the scale used for the questionnaire is ad-ditive and that the variables that are being used are related.

78
Bonales, Gallegos, Zamora y Delfín
Regarding the variables related Kerlinger (1997) mentions that the dependent variable is one that is predicted, while the indepen-dent variable is the one from which it is predicted, and according to our theoretical framework was found that the independent variables drivers of competitiveness for the purposes of this research are Ac-tors (Human Resources) and innovation networks (communication, innovation).
For purposes of the above table, the concept of the dependent variable Competitiveness is required, which will be seen as a chance to triumph over other bidders when, confronted with substitute prod-ucts, we have high probability of being victorious, helped by the pur-chase consumer (Lerma, 2004).
Returning the Table 4, the same scores are obtained by summing the values obtained in each question contained in the questionnaire, we should not forget that the number of response categories is the same for all questions.
On a scale type Likert as that employed in the questionnaire, the maximum score is determined by multiplying the number of items for the highest score of each alternative response, while the minimum score is the result of the number of items multiplied by the lowest score of the response alternatives (Gallegos, 2009).
It is noteworthy that the same scale for both variables used in the development of research, because each consists of the same number of items; score for each of the variables the values obtained for each question were added, then the scalograms which were developed for each variable are presented.
The score most often repeat section of actors was what was within the range of 27.2-33.6, obtaining a 71.65% success rate in the variable. Stars Recall that the variable was used to observe the attributes of net-work members and to know if they have adequate training to perform their activities.
This indicates that it has good elements within the network SIP-ROLIMEX therefore need to work them properly for their attributes and qualities potentializing, and along with it the competitiveness of the entire network will increase.
In the scalogram corresponding to innovation networks scoring more repetition frequency was what stood in the range of 34-42, cor-responding to the response category “almost always”, indicating that

79
Michoacan state lemon’s innovation network
innovation networks are used by the actors and influence in 77.54%, in communications that are within the network; as well as the dynam-ics of innovation, since most of the participants adopt the proposed changes to the improvements of production; but much remains to be done and implemented in order to improve the communication has within the network.
Observed the scalograms corresponding to the independent vari-ables, it is pertinent to note the amount of the dependent variable export competitiveness, where the total survey questions included overall scalogram.
Score greater repetition frequency for global scalogram was lo-cated within the range of 61.2-75.6; yielding an average score of 67.44, which corresponds to 75% effective in competitiveness variable.
The variable export competitiveness is determined by a 42.50% variable actors and a variable 57.49% for innovation network; with which it can be inferred that the variable innovation networks have a greater impact on competitiveness that the variable of the actors, but it is not enough because it has only 75% in the level of competitive-ness, which reflects that there are bases and means needed to boost the lemon sector Michoacán, but is necessary to make a number of changes to increase their competitiveness.
However, another aspect to revise this section as mentioned at the beginning is the correlation between variables, for which the correla-tion coefficient of Pearson, which is a statistical index that measures the linear relationship between two variables was used quantitative; unlike the covariance, the Pearson correlation is independent of the measuring range of the variables.
The Pearson correlation coefficient (r) is measured on a scale of 0 to 1, both positive and negative direction. A value of “0” indicates no linear relationship between the variables, the value of “1” or “-1” indicates respectively a positive perfect or perfect negative correla-tion between two variables.; finally the value located between 0 and 1 indicates a positive correlation.
Table 5 presents the results to carry out the correlations between the independent variables and the independent variable, where you can see that there is a positive correlation of.926 between Actors and Competitiveness; and the correlation between innovation networks and Competitiveness is also positive with an.937; which indicates that

80
Bonales, Gallegos, Zamora y Delfín
the independent variables of actors and innovation networks have a direct impact on the dependent variable Competitiveness variables are related, and therefore by the correlation can be seen which of them is the one that has greater impact on the dependent variable.
Observing that innovation networks have a greater impact on competitiveness actors indicates that in order to strengthen and boost competitiveness, it is necessary to focus first on the connections of the actors that make up the network and work more accepting of innova-tions that are proposed to improve SIPROLIMEX.
Table 5 Matrix of Pearson Correlation Coefficient
I III. ActorsII. Network Pearson Correlation ,736**
Sig. (bilateral) ,001N 18
III. Competitivenees Pearson Correlation ,926** ,937**
Sig. (bilateral) ,000 ,000N 18 18
**Correlation is significant at the 0.01 level (bilateral).Source: Authors, based on information provided by theRepresentatives of Organizations Producers SIPROLIMEX
Conclusions
the state of Michoacán has an important role in the production of lemon at the national level and well accepted by both domestic and international consumers; unfortunately today the lemon sector has not had economic development and business momentum might be expected given its characteristics which is caused by disorganization, poor communication among its members, lack of discipline, lagging technology and deficits in the creation and use of innovations.
The Michoacan lemon has specific features that allow you to posi-tion the taste and preference of domestic and foreign consumers, un-fortunately is not reflected in the welfare of the producer population

81
Michoacan state lemon’s innovation network
of citrus, or the economic development of the state, due to difficulties to export and market the lemon as own state of Michoacan, as a result of a lack of knowledge on strategies and marketing process.
Once observed and analyzed the lemon sector Michoacán to de-termine its international competitiveness, it was determined that fea-tures important factors to deal with foreign markets, referring mainly to natural resources necessary for the production of lime, and these factors are not easy to obtain, reproduce or imitate, certainly have many faults within other elements; but by the nature of them is pos-sible to correct and improve them through effective organization, im-plementation and use of innovations as well as developing and imple-menting appropriate strategies for the proper development, organiza-tion and training sector.
Due to the lack of communication and coordination among ac-tors that make up the lemon sector can not carry out the strategies planned by industry representatives and organizers even if they have good grounds as a result of grabbing activities of representatives, which causes a failure in monitoring strategies, and therefore reflect-ed in a decline in marketing citrus.
In the agricultural sector, competitiveness requires partnerships and business strategies to achieve better economic benefits that are reflected in the economy of their producers, which is why the lemon sector Michoacán must be prepared to compete and thus adapt to new schemes openness, integration and trade rules, both local and international markets, facing the large number of actors competing for improving and maintaining its market position.
This research provided answers to the research question, what is the relationship between the innovation network and the actors that compose it, and how impact that relationship in the export competi-tiveness of the lemon sector of the state of Michoacán? Furthermore, the objective of this research was to infer the variables that drive the increase in export competitiveness of the lemon sector of the state of Michoacan on the basis of innovation networks and actors in order to develop a solution fulfilled allowing boost exports from this sector competitively in the international market.

82
Bonales, Gallegos, Zamora y Delfín
References
Banco de México. (2011). Índice de volumen de la producción manufacturera por división. Alimentos, bebidas y tabaco. Recuperado el 31 de mayo de 2011. http://www.banxico.org.mx/SieInternet/consultarDirectorioInter-netAction.do?accion=consultarCuadro&idCuadro=CR26&locale=es#
CECIC. (2008). Centro de Capital Intelectual y Competitividad. Región del Valle de Apatzingán. Recuperado el 3 de enero de 2013. http://www.adiat.org/es/documento/blog/95.pdf Carballo, R. (2004). En la espiral de la innovación. Ed. Díaz Santos, S.A. España.
Cataño, G. & Botero P. (2008). Redes de Conocimiento en Sistemas Regionales de Innovación. Un estudio comparado: El caso de las PYMES en Antioquia y el País Vasco. Instituto Tecnológico Metropolitano. Medellín, Colombia.
Contreras, F., Campos, J. y Gómez, A. (2010). Información, innovación y so-ciedad global. Ed. Unión editorial. Madrid, España.
Covarrubias, I. (2003). Situación del Sistema Agroindustrial del Limón Mexicano y Expectativas de los Pequeños Productores. CIESTAAM. Universidad Autónoma de Chapingo. México.
Dussel, E. (2020). Territorio y Competitividad en la Agroindustria en México. CEPAL. México.
FAO. (2011). Depósito de Documentos de la FAO. “El estado mundial de la agricultura y la alimentación”. Documento La Agroindustria y el Desarrollo Económico. Recuperado el 24 de Mayo de 2011. http://www.fao.org/docrep/w5800s/w5800s12.htm
FAO. (2011). Depósito de Documentos de la FAO. Top production Lemons and Limes-2008. Recuperado el 15 de junio de 2011. http://faostat.fao.org/site/339/default.aspx
González, R. (2006). Innovación, redes y territorio en Andalucía. Junta de Andalucía. Universidad de Sevilla.
Hanneman, R. (2005). Introducción a los métodos del análisis de Redes Sociales. Departamento de Sociología de la Universidad de California Riverside. California.
Kerlinger. F. (2002). Investigación del Comportamiento. Métodos de Investigación en Ciencias Sociales. Ed. McGraw-Hill. México
Mendez, G. R. (2002). Sistemas Locales de Empresas y Redes de innovación en Castilla-La Mancha y Castilla y León. Ed. Universidad Salamanca. España
Merchand, M. (2005). La dinámica transnacional de la agroindustria del limón y su hinterland agrícola en el Valle de Tecomán. Análisis Económico, XX (44). Universidad de Colima.

83
Michoacan state lemon’s innovation network
Molina, J. L. (2010). Elementos para el trabajo en red, Apuntes desde el análisis de redes sociales. REDES. Revista Hispana para el Análisis de Redes Sociales. Volumen especial.
Muñoz, M. (2004). Redes de innovación. Programa de Investigación y Transferencia de Tecnología Michoacán 2004. Fundación PRODUCE Michoacán.
Muñoz, M. (2007). Análisis de la dinámica de innovación en cadenas agroali-mentarias. Universidad Autónoma de Chapingo. México.
OEIDRUS. (2011). Oficina Estatal de Información para el Desarrollo Rural Sustentable. Anuario Estadístico por Estado de la Producción Agrícola. Producción Agrícola. Recolectado el 30 de diciembre de 2012. http://www.oeidrus-portal.gob.mx/oeidrus_mic/
Palleja, E. (2002). Universidades y desarrollo territorial en la sociedad del conocimiento. II. Universidad Politecnica de Catalunya. Barcelona. España.
Porter, M. (2003). Ventaja Competitiva.Creación y Sostenimiento de un Desempeño Superior. Ed. CECSA. México.
Rendón, M. (2007). Identificación de actores clave para le gestión de la in-novación: el uso de redes sociales. Universidad Autónoma de Chapingo-Ciestaam. México.
Ruiz, G. (1990). La innovación tecnológica y su gestión. Ed. Productica. Barcelona España.
SAGARPA. (2011). Plan Rector Sistema Producto Estatal Limón Mexicano 2011.


85
FEMSA Expansion strategies
Araceli Rendón-Trejo1
Andrés Morales-Alquicira1
Irene Juana Guillén-Mondragón2
ABSTRACTThe aim of this research is to identify FEMSA’s growth strategy that has been generated as a result of alliances and acquisitions made by the en-terprise in the last few years. Also, benefits and problems are analyzed as part of these actions. The research strategy involved a review of business literature and other sources of information related to FEMSA actions. The work is divided into four sections; the first part considers theoretical aspects such as competitiveness, alliances and mergers. The second part outlines the structure of the beer market in which FEMSA has been participating. In the third part, alliances and acquisitions are exposed, where it is possible to verify that these strategies have contributed to the growth of the enterprise, while partnerships have prompted FEMSA to achieve better sales in the local and foreign market and to enter into the dairy industry. Finally, some thoughts are formulated in order to explain how FEMSA has improved its growth recently. Keywords: economic groups, corporations, alliances and acquisitions
1. Universidad Autónoma Metropolitana-Xochimilco. México.2. Universidad Autónoma Metropolitana-Iztapalapa. México.

86
Rendón-Trejo, Morales-Alquicira y Guillén-Mondragón
Introduction
A long with economy becoming more open during the 1980s, and globalization, competition increased for all companies. Even the largest in the country had to examine their terms and
expansion strategies facing the presence and advance of even larger companies in the world that additionally had great experience, not only in their local market but also in other, more diverse countries.
The largest companies in the country, integrated into economic groups, have implemented several changes through time. During the last decades, they have sought to protect themselves from external competition, among other actions, by strengthening and increasing their presence in the local market and by reaching other geographical markets. They have done the latter by linking themselves to compa-nies with presence and knowledge in markets in which they wish to enter. They have also done this with large, world renowned compa-nies in order to reach other markets with their products and to count with a certain “protection” against other big competitors. Those links, which take the shape of partnerships or agreements, imply risk being the main one the takeover of the weakest company by that with more economical power and experience.
The aim of this work is to identify the partnerships formed and acquisitions made by FEMSA and to identify what the benefits and problems have been. FEMSA is an economic group of national pri-vate capital in Mexico and its core business is beverages. Its origins are in a beer manufacturing company at the end of the XIX century; in fact, beer manufacture was part of its identity. This work has several sub-sections, in the first one, a brief reflection is made on competi-tiveness, partnerships and mergers; in the second one, given the fact that FEMSA is located in the beverage sector and not so long ago it controlled the second largest beer manufacturing company in the country, the main beer manufacturing companies in the world are pre-sented. Subsequently, Fomento Económico, S.A. is located in order to address its beverages business afterwards. Partnerships and acquisi-tions are presented later. Finally, some conclusions are drawn.

87
FEMSA. Expansion strategies
Competitiveness and the company
According to Porter (1990), competitiveness is defined by five forces which interact to configure the attractiveness of an industrial sector. Thus, in order to be competitive it is required to know the demand and supply conditions in the sector, the structural configuration of the companies installed in it and their relationship with suppliers and customers.
According to the proposals by Dutrenit, Moreno and Orive (2013:14), competitiveness “is located at several (spatial) levels: na-tional, regional, municipal, sector and company”, and it can be un-derstood as a socio-economic phenomenon considering macro-eco-nomic, meso-economic and micro-economic levels of analysis. In the latter, competitiveness between companies is fundamental in order to contribute to a nation’s development. However, this responsibility is not an exclusive task of the organizations; evidence supports that competitive construction also requires the participation of other so-cial figures: universities, research centers and the government, among them. In a joint manner they can contribute to the economic and so-cial development of the country.
Ruiz (as cited by Moreno and Orive, 2013) considers that com-petitiveness is systematic because it gathers four levels, namely: mi-cro, meso, macro and meta. Likewise, as competitiveness is linked to productivity, the author points out that, at the micro level, companies continuously involved in R&D dynamics attain their productive pro-cesses more efficiently. Because of this, engineering and professional management, in addition to innovation networks, are fundamental at this level in order to be competitive.
At the meso level, the author points out that public policies are fundamental for those seeking to strengthen competitiveness in the industrial sector. Here, industrial structure analysis, productive infra-structure at a regional level, and contributions to a healthy trade scale are relevant, as well as measures related to preservation of the envi-ronment and technological development, and advances in education and labor conditions. At macro levels it is sought that macro-econom-ic factors have stability and a judicial framework that warrants the rights of both companies and the investors. Clarity is also required re-garding competitiveness, monetary, exchange, financial, commercial,

88
Rendón-Trejo, Morales-Alquicira y Guillén-Mondragón
fiscal, and commercial policies. Finally, at the meta level, guidance is directed towards society’s development and the search for a competi-tive pattern of economy organization in which learning attitudes and friendly trade are promoted. That is, an environment in which the entities have the ability to propose appropriate strategies and policies for the promotion of competitiveness.
Continuous action will depend on the construction of a collec-tive memory, of social cohesion, and a relationship of trust and will to cooperate in order to create and transfer knowledge and to achieve the required innovation index for competitiveness and social develop-ment. In the political field, the idea of competitiveness is disseminated in order to introduce it as an ideal in the social archetype. This notion, besides infiltrating all social strata, drives the idea of being competi-tive in all aspects. For this reason, all changes in regulations have oc-curred immediately, with the purpose of having an impact on public policies. In 2013, the constitutional articles 25 and 26 were modified in order to include the concept of competitiveness as the guiding ele-ment of the national economic development. In this regard, Mexico has descended from its competitive position in the country’s World-wide Competitiveness Ranking. It was positioned in 55th place during the 2013-2014 period, demonstrating a setback regarding the achieve-ments during the years 2012-2013 (World Economic Forum, 2013).
As far as organizations are concerned, competitiveness is an im-perative that is diligently sought, as it translates into continuity and expansion. In order to achieve it, several actions can be implemented. Among them are several association models and partnerships. These actions seek to tackle, in the best manner possible, globalization chal-lenges involving the presence and advance of economic units of great-er political, market, and economic power.
With globalization and the advance of information and com-munication technologies, the competitive paradigm has shifted. The competitive advantages of greatest relevance, to increase company competitiveness are, among others, the ability to generate innovation, information management, and especially the establishment of associa-tion models, in order to share infrastructure with competitors (Turner, 2001), both locally and globally. This is because an increasing amount of companies are entering global markets as exporters; multidomestic, multinational and transnational. Therefore, competitiveness requires

89
FEMSA. Expansion strategies
cooperation and trust between different entities and even between former market rivals.
According to Clarke and Clegg (1998:197), mergers, acquisitions and strategic partnerships have rapidly increased because of tech-nological and marketing factors. Although they also respond to the particular necessity of each one of the partner companies in order to enter new markets and to carry out several border activities involv-ing international investment, trade and marketing. Other reasons for world companies to associate themselves with other companies of dif-ferent size are: to assure supply sources, to search for new markets and to access low production costs. Similarly, because of the safety offered by the technological and organization advantages regarding local partners, this leads to an impact on national economies.
Large companies and global companies are the productive entities that make up the essential part of the new association models. These organizations, according to Clarke and Clegg (1998:277) are defined as “…the best in its class or better than its competitors around the world, at least in several strategically important areas”. Their control derives from their approach to the client, their continuous improve-ment, the creativity of their human resources, and the establishment of an environment that is favorable for innovation and technology. In the same manner, it assumes, based on the continuous organizational learning paradigm, that all workers are responsible, think like adults, and want the best for the company.
Some of the productive entities that are part of the new associa-tion models are: joint ventures, mergers and acquisitions, and stra-tegic partnerships, among others. Associations derive from the or-ganization’s requirement to face a constantly changing competitive environment and present a strategy to deal with the excess of ability through streamlining; at the same time these are a means to reach re-stricted markets. Partnerships or associations also imply the construc-tion of collaboration networks with other stakeholders (governments, competitors, consumers, suppliers and several institutions) in order to increase the value of their basic resources by combining them with other resources they do not possess. Partnerships require a leadership that involves, besides monetary resource mobilization, the generation of innovation processes that allow for an increase in competitiveness.

90
Rendón-Trejo, Morales-Alquicira y Guillén-Mondragón
On the other hand, the companies that attempt to enter rapidly evolving markets such as leading edge technology, for instance, often try to collaborate with others in order to compete. They can even part-ner up with their staunch market rivals which, in a term from Clarke and Clegg, (1998:105) means “sleeping with the enemy”. But that is not the only danger, as it exists a high probability that the companies will lose their identity as they globalize and, finally, the small compa-nies can even be acquired by the larger ones.
Mergers and acquisitions are the means employed by companies, especially the largest ones, to participate in other markets. Acquisition generally takes place when the large company (X) buys the smaller company (Y) to finally form company X of a larger size compared to its initial state. Acquisitions can be hostile “friendly”; the former oc-curs when the executive committee and/or the owners of the company oppose to a public acquisition bidding, whereas the latter occurs when the receipt company approves the acquisition or bidding mergers.
Kotabe and Helsen (2002) point out that these are strategies for entering the global market. Acquisitions give companies the ability to compete with less uncertainty in the global market; they allow a quick access to the market and to industries with a high entrance barrier, and quick access to distribution channels and technology. Addition-ally, they “immediately” have well positioned brands, and both the knowledge and experience that the acquired company built over time. It is a relatively less arduous strategy, when compared to building the company and brand prestige from scratch. Mergers and acquisitions can be horizontal, vertical or conglomerate3.
Acquisitions and mergers also involve risk. For those who look to make acquisitions or form mergers there are, for instance, the cul-tural differences regarding the chain of command, which can interfere with the company’s good performance, in the same manner, there are also assets that fail to meet the expectative or intellectual capital and are not properly trained or motivated in order to meet the objectives of the new organization. There are also risks regarding the acquired company or mergers receipt; among them the loss of control for deci-sion making. In addition, there are countries with several restrictions, such as on capital concentration, which results from an acquisition or merger. This implies that they must get rid of business or companies in order to carry it out.

91
FEMSA. Expansion strategies
The beer industry
Beer production is part of the food, beverages and tobacco subsector. The global beer market has tended to grow although not equally in the distinct world regions. The market in North America and Europe displays descending figures, whereas the market growth is strong in emergent economies, such as in Latin America, Africa, Asia, and within the latter, especially China.
The growth of the large companies with worldwide presence with-in this sector has been attained through acquisitions and mergers. The main beer producing companies at worldwide level have located and bought the market leaders in each country, occasionally first going through a partnership phase. The acquisition allows them to operate in accordance with their own rules. This strategy has worked well in economies in which there are one or two dominant beer manufactur-ers, but not in countries such as Germany or England, in which the industry is widely diversified (Winkelman, 2013).
For instance, in mature markets, such as the German one, the company’s strategy is to differentiate itself regarding flavor and to in-corporate itself with the current preference trend of traditional beer consumption. In addition, it has been observed that some companies within this industry have sought to enter the non-alcoholic beverage market, with low alcohol content, and beer-based mixed beverages, considering the change in preferences originating from some consum-er groups that seek healthier products.
The ten largest beer-producing companies in the world are locat-ed in different countries and continents; The Americas, Europe and Asia. Being part of them is the result of multiple strategies, among them, as already mentioned, establishing partnerships, acquisitions and mergers. Among the main companies the following are worth be-ing mentioned (available at http://www.ehowenespanol.com/cuales-son-10-principales-empresas-elaboracion-cerveza-lista_136116/, Con-sulted on November 27, 2013).1. Anheuser-Busch InBev. Beer-producing company in first position
worldwide since 2009. This company manufactures more than 300 beer brands. Budweiser, Michelob, Becks, Stella Artois, Bass and Brahma are the best selling at a global level.

92
Rendón-Trejo, Morales-Alquicira y Guillén-Mondragón
2. South African Breweries (SAB) Miller. The next one in order of relevance. With over 200 brands from all over the world, it sells more than 160 million barrels of bottled and canned beers per year that represent more than 11% of world consumption. Their main labels are Miller, Castle Lager, Grolsch, Bavaria and Cervecería Nacional. SAB Miller is also owner of more than 58% of the Molson Coors Brewing Company.
3. Heineken. Dutch company that includes Amstel, Murphy, Córdoba and Tigre. It has presence in more than 178 countries (FEMSA, 2013).
4. Carlsberg. It has a 4% participation in the world market. The Carlsberg Tuborg brand is famous in Norway. This company, based in Denmark, is property of the Carlsberg Foundation and offers important contributions to the arts and sciences.
5. Molson Coors Brewing Company. This company was started in 2005 as the merger of two of the main beer producers in the Unites States: Molson and Coors. The company is also partnered with SAB Miller, operating as Miller Coors.
6. Modelo. The main company in the Mexican beer industry, with more than 60% of the market fees. Their main brands are Corona, Estrella, Negra, León, Modelo Especial, Montejo, Pacífico, Negra Modelo and Victoria. This company is no longer Mexican as Anneheuser-Bush InBev owns around 50 percent of Modelo.
7. Tsingtao Brewery. This beer is produced in Quindao, in the Shandong province of China.
8. Beijing Yanjing Beer. The Chinese enterprise has more that 30 beer factories in 10 Chinese provinces. It is part of the Beijing Enterprises Holdings, matrix society and is an important producer of natural gas for houses and businesses in China. It is a conglo-merate enterprise.
9. FEMSA- Cerveza. This company is no longer Mexican as it has been owned by Heineken since 2010. In Mexico it produces many of the most important brands in Mexico and Brazil, such as Carta Blanca, Dos Equis, Tecate, Bohemia and Sol.
10. Kirin is the most important beer producer in Japan, it supplies se-veral foreign markets and is the number one exporter of Japanese beer to the United States. Japan uses the unicorn in order to asso-ciate Kirin with a beer that symbolizes good luck.

93
FEMSA. Expansion strategies
The first four companies constitute around 50% of global total beer production. The companies that used to be Mexican owned were among the most important worldwide; in Latin America they were only surpassed by Brazil. Internally, the production chain integrated by the sector represented 1.6% of the gross domestic product and con-tributed to 3.8% of total incomes. The trade generated more than 800 thousand direct and indirect employment positions, with exportation of more than 1800 million dollars every year. (CANICERM, 2009 a, b in Rojas and Rodríguez, 2010). In 2011, the Mexican beer industry was number one in exportations within the food and beverage sector with an amount of 2,022 million dollars, which represented a 1.7% growth in 2010. According to figures from the Mexican Secretary of Agricul-ture, Stockbreeding, Rural development, Fishing and Food (Sagarpa), beer sales abroad contributed 61.4% of total beverage exports, fol-lowed only by tequila, whose export value was 831.2 million dollars in 2011 (El Financiero, 2012).
Regarding beer consumption, Europe3, Asia and North America exceed Latin America, one of the world regions with least alcohol consumption4 (Cerveceros Latinoamericanos, 2009). Within the lat-ter, Mexico has the lowest consumption per capita, which has tended to slowly increase: in 2001 it was 51.2 annual liters among persons be-tween 18 to 45 years old; in 2005 it was 55 liters (FEMSA, 2002, 2006) and in 2012 it was 55.44 liters (El Economista, January 18, 2012)3. Levels of beer consumption are highly susceptible to price changes, because of that, economic changes affecting acquisitive capacity also affect the industry. “In general, the industry undergoes an elevated volume growth in periods of economic soundness and less growth, or volume contraction, during periods of economic contraction. National beer sales decreased in 1982, 1983 and 1995” and went down again in 2001 and 2002 (FEMSA, 2001, 2006).
The structure of the beer producing industry in Mexico is a duo-poly, previously controlled by FEMSA-Cerveza and Grupo Modelo. Nowadays Heineken and Anheuser-Busch InBev (ABI) constitute the most part of sales and production at a national level, the latter being the one with most prominent participation in the market. Mexico is
3. Other sources mention that consumption per capita in Mexico is 60.7% (Cerveceros Latinoamericanos, 2009).

94
Rendón-Trejo, Morales-Alquicira y Guillén-Mondragón
the only country with a high concentration in that market; two compa-nies compete in the beer business, whereas China, the United States, and Brazil, the three largest markets per volume in hectoliters, have at least four of the largest beer companies (El Financiero, February 2, 2014).
Grupo Fomento Economico Mexicano (FEMSA)
FEMSA is a leading group in the beverage market in Mexico and Latin America4. It is part of the Frequently Consumed Products sector; food, beverages and tobacco subsector; Beverages branch; diverse bever-ages sub-branch. In Mexico and other countries a number of compa-nies are organized into economic groups5 which generally control the large enterprises in one or several sectors.
FEMSA organization, in the form of a group with a holding, is the result of the expansion path that has been followed since its ori-gins in 1890 when it rose as an ice and beer factory named Cervecería Cuauhtémoc S.A.6 It was the first Mexican beer producing company7, from which other companies emerged8; such as Banco de Nuevo León (1892); Vidrios y Cristales de Monterrey (1899) –nowadays part of Vitro-; Banco Mercantil (1899); Compañía de Fierro y Acero (1900), that afterwards would become Fundidora Monterrey; Titán (1936) and Hojalata y lámina -Hylsa- (1942). All of them were part of Grupo Monterrey which was divided into two branches in 1974: 1) steel and other packaging operations such as ALFA and 2) beverage opera-tions and banking such as Valores Industrials SA (VISA). Between
4. FEMSA quotes in the Mexican Stock Market since 1978.5. Economic group is understood as a group of companies related to each other through
familiar or financial bonds and a community of leaders, and rely on a holding company. Among their features there are their remarkable adaptive capability and mobility towards environmental changes, anticipated or not. (Rendón A. and Morales A. 2013).
6. The company was founded on May 30, 1936.7. The beverage industry in Mexico has its origins at the end of the XIX century with La
Montañesa in 1886 and Topo Chico S.A. in 1895, the latter began to bottle mineral water (Food Technology Summit & Expo, 2012).
8. Vertical integration activities date back to 1936, when packaging operations were established in order to supply bottle tops to beer producing companies. The constituted companies would become part of the group.

95
FEMSA. Expansion strategies
1971 and 1981, FEMSA group (formerly known as VISA) diversified through acquisitions ewithin the soda and mineral water industries, OXXO convenience stores, investments in the hotel industry, car parts, food, and fishing.
FEMSA holding directly or indirectly controls most of the sub-holder companies share capital (each one, along with their consoli-dated subsidiaries, form a “Sub-holder company” (FEMSA, 2006). These, in turn, supervise the operations of the companies they con-trol. FEMSA has modified the organization according to the interests of the business groups and companies; of course, the conditions of the economic environment are influential. In 2005, it was divided in CIB-SA and Grupo Emprex, which in turn controlled other sub-holders. The following diagram shows their corporative structure in 2005.
Figure 1FEMSA. Corporative structure, 2005
*Compañía Internacional de Bebidas S.A.de C.V Source: FEMSA (2006).

96
Rendón-Trejo, Morales-Alquicira y Guillén-Mondragón
The structure of the group in the year 2012 was the following:
Figure 2FEMSA. Corporative structure, 2012
Source: FEMSA (2013).
As can be observed, in 2005 Emprex controlled FEMSA Trade and FEMSA-Beer. This has now changed, as the latter was acquired by Heineken in 2010. Nowadays, FEMSA has a participation of only 20% through CB Equity. The jurisdiction of each one of these groups is mainly Mexico, excepting CB Equity that is located in the United Kingdom.
One of the features of the economic groups is their capability to enter or exit from certain economic activities, which implies to create or to buy companies and sell some of them if it is convenient for the group. The sale of FEMSA-Beer was not planned, as the original idea was to have a partner who could strengthen its presence and protect it from other strong companies in the market. Beer producing activ-ity was well known and it had over one century of experience, besides that it was part of the group’s identity.
Nevertheless, FEMSA is still an important group, being classified within the first twenty-five places of the 500 most important compa-nies in 2013; it is the leader in the beverage industry with Coca-Cola FEMSA, the largest soft drink manufacturer of the brand worldwide;

97
FEMSA. Expansion strategies
in Trade it operates OXXO, a chain of small convenience stores with high expansion in Latin America9.
The group also has other activities such as horizontal and vertical fridge manufacture to be used in the soft drink, beer and food indus-tries. The corporative services unit is in charge of directing, control, supervising and evaluating sub-holder operations and even those of Cervecería Cuauhtémoc Moctezuma (FEMSA, 2013).
FEMSA. The Beverages Business
The group has focused on beverages, given its long experience and knowledge of the product. FEMSA’s main activity had been beer pro-duction up until 2010. FEMSA-Beer and Coca-Cola FEMSA were the basis of activities in the beverages sector. Nowadays, the group carries out several activities, the main one is the production of non-alcoholic beverages, both carbonated and non-carbonated. In addition FEMSA has a 20% stake in Heineken. Regarding non-carbonated beverages, FEMSA produces water, juices and dairy products. The group also participates in the convenience-store sector with the OXXO chain.
FEMSA’s beverages business has a long history, in which acquisi-tions and partnerships have been frequent; some of these are detailed below.
Partnerships
FEMSA has grown through partnerships and M&A. The partnerships established by the group have been placed into different sub-catego-ries. The following table shows some of them:
9. Up until December 2013, they operated 11721 OXXO convenience stores all through Mexico, with an important presence at the north of the country; 34 of them were located in Colombia. Up until 2014 it has an average of 1000 store openings per year, more units than its close competitor 7Eleven (BMV, FEMSA, 2013).

98
Rendón-Trejo, Morales-Alquicira y Guillén-Mondragón
Table 1FEMSA. Partnerships, 1994-2012
Operation Objectives1994 Association with Labatt
Brewing Company, a Canadian brewery subsidiary of Belgium’s Interbrew.
Introducing Mexican beer in the US. Having a partner to face the challenges of globalization.
1995 Association with AmocoOil Co.
Creating Amoxxo (50%-50%), in order to operate OXXO Express service centers
2000 Partnership Oracle-FEMSA Logistics
Creating an electronic market of logistics and wider transportation in Latin America, facilitating trade among the main entities of the transportation market in the region.
2004 Agreement with Heineken Marketing beer in America. Heineken is in charge of promoting, selling and distributing Tecate, XX, Sol, Carta Blanca and Bohemia starting January 1st, 2005.
2008 Commercial partnership with Compartamos Banco y Oxxo
Offering more servic es to customers (credit payments), facilitating the purchase of more products in stores (Sales increase).
2010 Agreement with the Brazilian branch of Coca-Cola co. to produce, sell and distribute products of the branch MatteLeao.
Increasing Coca-Cola FEMSA’s offer of non-carbonated products.
2011 The FEMSA foundation and Conagua ratify their partnership with regards to water sustainability.
Taking action regarding corporate social responsibility, placing the company in the group of ethical consumers.
Source: Rendón, 2008; FEMSA, 2013; Forum, 2008; Conagua, 2011.
The motivations that drive the company to create partnerships are several. Among them, establishing marketing agreements, reducing costs, sharing risks, consolidating economies of scale; and one of the most important: technological improvements. The specific objectives can be found in three categories, as shown in the following table.

99
FEMSA. Expansion strategies
Table 2General Objectives of Partnerships
Technological Objectives
CommercialObjectives
IndustrialObjectives
Common R&D projects.Technology transfer.
Increasing sales.Access to new markets, controlling distribution channels.
Economies of scale. Positive synergies. Expanding the market share.
Source: Elaborated based on the data by Bueno y Morcillo (1993).
As shown in table 1, increasing sales, speeding and optimizing products distribution, in addition to the arrival of new markets, were the key motivations for establishing partnerships – mainly in regards to commercial objectives. In order to increase sales, the offer of non-carbonated products also increased, by establishing agreements with a Brazilian company. As for the beer industry, it must be pointed out that agreements are made with companies that have a global pres-ence, which in turn have agreements with other companies. Other agreements are the ones related to the strategies of social corporate responsibility.
The partnership established with Heineken in 2004 stands out be-cause of the results obtained after some years, for this reason it is important to describe the process that resulted in the separation of FEMSA-Beer.
FEMSA Beer, the Disincorporation
In the 1980s, FEMSA started targeting foreign markets, given a decrease of the internal demand that resulted from the loss of Mexi-cans’ purchasing power. In 2008, Cuauhtémoc (part of FEMSA-beer) exported beer to more than 65 countries in North America, Latin America, Asia and Europe 10, the most important ones being the United States and Canada, which represented 90% of the exports, although most of it being from the US.
10. In 2001, exports to Asia, Europe and Latin America represented 4.0%, 3.7% and 1.9% respectively (FEMSA, 2001).

100
Rendón-Trejo, Morales-Alquicira y Guillén-Mondragón
In order to have a larger share of the international beer market, in 1994, FEMSA associated itself with Labatt Brewing Company, a Canadian brewery subsidiary of Belgium’s Interbrew. This company had 30% of FEMSA-Beer stakes, for this reason they had a say in conducting the business. This partnership took place as part of the Mexican company’s strategy to face the challenges of globalization. Labatt was the sole importer of Mexican beer in the United States. The relationship started deteriorating in 2001, when the foreign com-pany included brands of North America’s Beck’s in its portfolio, af-fecting the sales of the Mexican product11. This situation was further aggravated in 2004, when Labatt’s partner acquired Brazil’s Ambev, one of South America’s most important breweries. The problem for FEMSA-Beer was that, following this merger, the Brazilian company became responsible for the Belgian company’s assets in the Americas, including FEMSA12. FEMSA filed a lawsuit against Interbrew, to stop some of the merger’s consequences. The Mexican company bought a 30% stake, ending its participation in Labatt USA13, and through another subsidiary in the United States, FEMSA regained the right to distribute and sell its beer brands in that country14 (FEMSA, 2006; Rendón 2008).
In order to have a stronger presence abroad, the group signed several agreements: one of them in England and another one in Cana-da; one with Molson Coors to commercialize, promote and distribute its products in Great Britain- the second most important market for exports after the United States (October 2005). In September 2005, FEMSA reached an agreement with Sleeman Breweries- a leading premium brewer in the Canadian market, as a result, this company
11. The foreign partner’s objective was to integrate the distribution networks of Labatt USA with Becks’ in order to reduce costs.
12. This giant company limited the distribution of Mexican beer, since it preferred to use the distribution networks for its own products.
13. Starting September 2004, a four month transition period began, during which Labatt USA imported and sold FEMSA-Beer brands based on a commercial agreement designed for this purpose.
14. The funds for reacquiring the package of shares belonging to Interbrew were obtained from the following sources: 295 million dollars available in stock; 450 million dollars in long-term debt paid in Mexican pesos, and 500 million dollars in one-year bridge loans (50% in dollars and 50% in pesos), which were expected to be paid with funds from a FEMSA issue of shares.

101
FEMSA. Expansion strategies
became the sole importer, trader and distributor of the brands Sol and Dos Equis in the Canadian market (FEMSA, 2006; Rendón 2008).
In 2004, FEMSA set an agreement with Heineken to commercial-ize Mexican Beer. Starting January 1, 2005, Heineken USA became responsible for importing FEMSA-beer products. The established agreement with Heineken to commercialize FEMSA’s main brands, particularly those of the brewer Cuauhtémoc-Moctezuma15, came to an end after the Dutch company’s acquisition.
At the beginning of 2010, the group made public a deal with Heineken, in which FEMSA traded 100% of its beer division for a 20% stake in Heineken and two seats on the board of Dutch Heineken N.V and Heineken Holding, at that time the third largest producer of beverages. The deal included FEMSA’s activities in the United States and Brazil (83%). The transaction was 7.364 billion dollars, including 2.1 billion dollars of assumed debt and other liabilities such as labor obligations (FEMSA, 2010).
What were the reasons for this transaction? Regarding the acquir-er, it must be said that the Mexican market was very attractive because of its growth potential. In 2008, six in every ten Mexicans consumed beer and there was an annual growth of 1 million people. The market represented 63 million people. As for the Mexican company, in an in-terview following the acquisition announcement, FEMSA’s president16 pointed out that the beer company had lost control of the beer market since the nineties, when FEMSA had a 55% share of the market. By 2010, it only had 43% and they considered that the foreign company would handle the business more effectively. Other influential factor in this decision was the global market, all the mergers and acquisi-tions by the largest brewers, for example: Heineken’s acquisition of England’s Scottish Newcastle along with Carlsberg for 15 billion dol-lars, the mergers between Anheuser Busch and InBev, as well as the one between Molson Coors and SABMiller. FEMSA considered how convenient it was to remain as an isolated, regional, and successful company, but with high-risks that could lead to depreciation or the
15. This company produced traditional brands: Tecate, Sol, Carta Blanca, Superior, XX Lager, Indio y Bohemia, among others, emblematic of grupo cervecero de Monterrey
16. José Antonio Fernández Carbajal, FEMSA’s president and Eugenio Garza Lagüera’s son-in-law.

102
Rendón-Trejo, Morales-Alquicira y Guillén-Mondragón
adoption of defensive measures that could weaken it. It was decided to look for an acquirer (CNN Expansión, 2010). FEMSA executives said back then that it was not an acquisition, but rather a merger: “It is not an acquisition, because what we are doing is joining out assets with Heineken’s, which will now be in charge of operating the company.” It was put forward to replace the company’s assets with others; stronger and more global.
Despite the statement of FEMSA’s executives, Cuauhtémoc Brew-ery was in a good situation and it had a good market share. FEMSA-Beer was one of the last representative and emblematic of FEMSA’s companies in Mexico; it operated six production plants in Mexico and eight in Brazil, in addition to producing its own glass bottles, alumi-num cans and hermetic seals through Malta SA de CV, Monterrey branch, and through Sílices de Veracruz; in other terms, it was a ver-tically integrated company. In 2010, its net income had doubled to 1988 million pesos (MXN) during the first trimester, as a result of increased sales and lower financial costs (FEMSA, 2011).
Acquisitions
In regards to the companies acquired by FEMSA, the following table shows that most of the companies have been related to the industry of alcoholic and non-alcoholic beverages.
Table 3Acquisitions
1991 Stakeholders of Emprex and FEMSA provided partial funding for acquiring the majority of Bancomer.
1994 Acquisition of a 51% share of Coca-Cola in Buenos Aires, Argentina. 1996 Acquisition of Sirsa’s territory (Buenos Aires, Argentina)
Acquisition of the remaining 24% of KOFBA’s shares.2003 Panamerican Beverages, Inc. (100%) (Panama)2004 Agreement with Heineken to commercialize beer in the United States.
Heineken became responsible for promoting, selling and distributing: Tecate, XX, Sol, Carta Blanca and Bohemia starting January 1st, 2005.Reacquisition of the 30% of FEMSA beer from Labat, in order to take control of the import, marketing and distribution in the US.

103
FEMSA. Expansion strategies
2006 FEMSA Beer acquires Kaiser brewery by buying a 68% share (Brazil)
2007 Total acquisition of Jugos del Valle through S.A.P.I, company owned by Coca-Cola FEMSA and Coca-Cola Co. (Mexico)
2008 Acquisition of the franchise Refrigerantes Minas Gerais Ltda (REMIL) (Brazil).Acquisition of Empresa De Los Ángeles (Mexico).
2009 Coca-Cola FEMSA and Coca-Cola Co. acquired Brisa (bottled water company, owned by SABMiller) (Colombia)
2011 Acquisition of Grupo Industrias Lácteas Estrella Azul (Panama).Mergers in the beverages division with Grupo Tampico (one of the oldest private bottlers in Mexico), Grupo CIMSA (one of the largest private bottlers and distributors of Coca-Cola in the State of Mexico, Morelos, Michoacán and Guerrero) and Grupo Fomento Queretano in Mexico.
2012 Coca-Cola FEMSA signed an agreement to merge with Grupo Yoli S.A.de CV.
2013 The acquisition of 51% of CCBPI is completed, with options of a further 49% acquisition within the next seven years.
Source: Rendón, 2008, FEMSA, 2013
The acquisitions carried out during these years are related to the beverages industry. An interest to span the market of Coca-Cola bot-tling and distribution in several regions of the Americas can be ob-served, which explains the acquisitions in Buenos Aires and Panama and the mergers of several groups in the country that also bottled and distributed this product, such was the case of Grupo CIMSA, Tampico and Fomento Queretano. It was very important to have control over the majority of Mexico. The group also entered other sectors of the bever-ages industry like the production of juices, water and dairy products.
In 2006, the acquisition of Brazil’s Kaiser granted FEMSA access to one of the largest markets (4th in the world) and a larger growth potential. One of FEMSA’s greatest challenges would be competing with Andina (strong influence in Rio de Janeiro and part of the Minas Gerais State). Kaiser operated 8 breweries and 15 beer brands with 55 different formats in total (FEMSA, 2006). The acquisition of Brisa in 2009 intended to strengthen Coca-Cola FEMSA’s market position in the bottled water sector in Colombia.
The acquisition in March 2011 of Grupo Industrias Lácteas, a leading company with over 50 years in the diary sector and products

104
Rendón-Trejo, Morales-Alquicira y Guillén-Mondragón
made with juice. Its purpose was to participate in a dynamic sector in terms of growth and fair value. This M&A would enlarge the products portfolio, becoming more competitive in the local market (FEMSA, 2010). As the group pointed out: “this transaction gave us the oppor-tunity to develop skills to manage a cold chain distribution channel and expand our horizons to other sectors of the aggregated value” (FEMSA, 2011).
FEMSA intended to create synergies with Coca-Cola FEMSA’s distribution system in Panama and increase profits in the portfolio of the production chain by covering the cooling equipment at the point of sale. The acquisition of a company working in a field different from FEMSA’s, enabled the group to integrate faster, taking advantage of the knowledge and experience of the acquired company.
The mergers carried out in 2011 with Grupo Tampico and Gru-po CIMSA resulted in a higher trading volume in Mexico, as well as an increase in revenues and EBITDA by approximately 30%, thus achieving leadership in the Coca-Cola bottling system in Mexico. This aimed to boost Coca-Cola-FEMSA’s leadership in Mexico and Latin America (FEMSA, 2011).
In sum, this group has carried out strategies of M&A with various purposes, among them:• In the beer sector, the group aimed to strengthen and consoli-
date its position in the market, by merging with some of the lar-gest companies of experience in the global market, as a protective measure against competition.
• These measures also enabled the group to enter the foreign mar-ket. Those partnerships brought Mexican beers to new unknown markets, and given our partners’ experience in the international market, FEMSA beer products obtained an excellent position, to the extent that some of them (Dos Equis beer) were classified as premium, thus getting a higher price.
• Regarding acquisitions, these operations have enabled the com-pany to strengthen its influence in the country and reach other geographic markets in the Americas.

105
FEMSA. Expansion strategies
Conclusions
In the case of Mexico, large national private equity companies, gen-erally integrated in leading economic groups, have had control of economic activities related to glass, cement, steel and beverages pro-duction, among others. Most of these organizations were formed from companies that date back to the end of the 19th century. One of its features is to be highly dynamic when confronted with predictable and sudden market changes; they seek to adapt their activities, companies and businesses to the group’s durability.
These groups have sought durability and expansion by setting up various strategies, given the changing issues and circumstances of the economic environment. One of the strategies adopted by these groups is M&A. By merging with other partners, large national private equity companies in Mexico aimed to expand their markets by entering other geographic regions of the country and other countries. Those merg-ers were established with companies having knowledge of the market, high positions and long experience.
The acquisitions that were carried out resulted from the will to consolidate and having more participation in the market, while con-sidering the possibility of more expansion. These measures are usually adopted by companies with a larger economic capacity, presence and experience. For this reason, oftentimes the smaller and weaker com-pany is the one that gets acquired.
In regards to the beverages industry in Mexico, FEMSA has been an economic group that focuses on beverages, given its long experi-ence and extensive knowledge of this activity, since the group dates back to the end of the 20th century as a beer company. Until some years ago, beverages were considered to be the business with the high-est possibility of growth.
FEMSA holds an important position as the largest Coca-Cola bottling company, because of Coca-Cola FEMSA, the group has ex-panded not only within Mexico, but also abroad. In the case of beer, the brands of Cuauhtémoc brewery played a key role, being one of the companies that had a strong influence on the national market, after Grupo Modelo. The company’s influence increased even more during the eighties after the acquisition of Moctezuma Brewery.

106
Rendón-Trejo, Morales-Alquicira y Guillén-Mondragón
As a result of globalization and the elimination of borders, FEMSA looked for a wider market for its products on the international mar-ket, which would also provide it with protection from other competing companies, for which FEMSA established agreements and partner-ships with other important companies on an international level. The first was established in 1994 with Labatt Brewing Company, a Cana-dian brewery subsidiary of Belgium’s Interbrew, an agreement that came to an end in 2004 following the merger between Interbrew and Ambev. Subsequently, FEMSA agreed to sell Heineken 100% of its FEMSA-Beer units. A key factor of this acquisition was the interna-tional consolidation of the market which was taking place through im-portant acquisitions of some of the world’s largest breweries. Despite FEMSA-Beer and its brewery Cuauhtémoc Moctezuma, which practi-cally represented the group’s identity, it was decided that preserving FEMSA’s independence, a large group in the country, but small on an international level, would be a difficult task. It was decided that the best choice would be to continue in the sectors of non-alcoholic bev-erages, Coca-Cola bottling and Oxxo stores, which have high growth rates and sales.
References
Bolsa Mexicana de Valores. (2001). Informe Anual. México: BMV.______ (2002). Informe Anual. México: BMV.______ (2006). Informe Anual. México: BMV.______ (2010). Informe Anual. México: BMV.______ (2013). Informe Anual. México: BMV.CANICERM. (2009). La cerveza y su contribución fiscal. Obtenido de
CANICERM: http://www.canicerm.mx/desarrolloregional/contribu-ción%20
Cateora, P. (1995). Marketing internacional. (Octava ed.). España: IRWIN.Cerveceros Latinoamericanos. (2009). Información Estadística de la Industria
Cervecera, Índice 2009. Clarke, T. & Clegg, S. (1998). Organization. En T. Clarke, & S. Clegg,
Changing paradigms. Great Britain: Harper Collins Business.______ (1998a). Strategy. En T. Clarke, & S. Clegg, Changing paradigms (241-
294). Great Britain: Harper Collins Business.

107
FEMSA. Expansion strategies
CNN Expansión. (27 de 01 de 2010). mi-nuevo-femsa. Obtenido de www.cn-nexpansion.com: http://www.cnnexpansion.com/expansion/2010/01/27/mi-njuevo-femsa
CONAGUA. (10 de Junio de 2011). Ratifican Fundación FEMSA y CONAGUA su alianza estratégica en materia de sustentabilidad hídrica. Comunicado de prensa, 176-11. México, Distrito Federal, México.
Dutrenit Moreno & Orive. (2013). Foros y talleres 2013, talleres de competitivi-dad. Obtenido de Foroconsultivo.org: http://www.foroconsultivo.org.mx/libros_editados/talleres_de_competitividad.pdf
El Economista. 12 de enero de 2010, 15 de enero 2012, 18 de enero de 2012, 27 de junio de 2012, México.
El Financiero: 23 de mayo de 2012, México.FEMSA. (2011). Informe Anual. México.Food Technology Summit & Expo 2012. (2012). Presentaciones. Obtenido de
Food Technology Summit & Expo: www.enfasis.Com/Presentaciones/FTSMX/2012/forumm.wordpress.com. (Junio de 2008). Forum. Reflexión y Análisis. Obtenido de forumm.wordpress.com: http://forumm.word-press.com/2008/06/page/18/
Kotable, M. y Helsen, K. (2002). Marketing global. México: LIMUSA.Munson, C. (2014). Cuáles son las 10 principales empresas de elaboración de la
cerveza? Obtenido de ehow en español: http.//www.ehowenespañol.com/cuales-son-10-principales-empresas-elaboracion-cerveza-lista 136116
Porter, M. (1990). The Competitive Advantaje of Nations. New York: The Free Press.
Rendón, A. (2008). Las grandes empresas y los grupos en México. Sus estrate-gias en la industria alimentaria 1987-2005. Tesis de doctorado en econo-mía. Facultad de Economía, UNAM. Distrito Federal, México.
Rendón, A. y Morales, A. (2013). Estrategias competitivas de los grupos económicos en entorno de crisis (2007-2011). En J. Sánchez, J. Gaytán, & M. Vázquez, La Arquitectura Financiera y Desarrollo Tecnológico para promover la competitividad. (383-405). Zapopan, Jalisco: RIICO.
______ (2014). libros-gratis/2014/1399/#indic (Grupos Económicos en la in-dustria de Alimentos y Bebidas. Alianzas y adquisiciones como estrategias de competitividad). Obtenido de www.eumed.net: http://www.eumed.net/libros-gratis/2014/1399/#indic
Rojas, J. y Rodríguez, R. (2010). Venta de la cervecería Cuauhtemoc-Moctezuma, la hegemonía de la inversión extranjera directa. Economía Actual.
Sandhusen, R. (1997). El mercado internacional: Fuerzas y estrategias. En R. Sandhusen, Mercadotecnia internacional. (1-26). México: CECSA.

108
Rendón-Trejo, Morales-Alquicira y Guillén-Mondragón
Secretaría de Gobernación, DOF. (5 de Junio de 2013). dof/CPEUM_ref_207_05jun13.pdf. Obtenido de http://www.diputados.gob.mx/LeyesBiblio/ref/dof/: http://www.diputados.gob.mx/LeyesBiblio/ref/dof/CPEUM_ref_207_05jun13.pdf
Turner, C. (2001). La economía de la información y la ventaja competiti-va. En C. Turner, E-conomía de la información. Estrategias empresariales para competir en la era digital (27-58). Madrid, España: DEUSTO.
Winkelman, L. (2013). La cerveza en ascenso. Obtenido de sidel.es: http://www.sidel.es/sobre-nosotros/inline-magazine/la-cerveza-en-ascenso
World Economic Forum. (2013). The Global Competitivenes Report 2013-2014. Obtenido de Weforum.org: www.Weforum.org/gcr

109
The Linking Process: Product Life Cycle, Diffusion Process,
Competitive Market structures and Nature of the Market
Vish-Iyer1
Nancy-Church2
AbstractThe purpose of this conceptual pedagogical thought piece is to elicit re-sponses from the readers with regards to how the concepts of Product Life Cycle, the Diffusion Process and the various competitive market structures as they relate to formulating marketing strategies.
Introduction
T he concepts of Product Life Cycle, the New Product Diffusion Process, Competitive Market Structures and the nature of the market are often dealt with independently in the marketing
literature. These four concepts are very highly intertwined. It is the objective of this essay to link these concepts in a manner that gives the reader a means to convey the connections and relationships between these concepts to students in a pragmatic way.
1. University of Northern Colorado.2. SUNY-Plattsburgh

110
Vish-Iyer y Nancy-Churc
Product Life Cycle (PLC)
The Product Life Cycle (PLC) is a descriptive tool that allows mar-keters to comprehend the industry sales and profit histories over the life of a class of products. The two elements that help identify current positions of products in the PLC are the nature of the market and competitive structure in that market.
In the introductory stage of the PLC the target market can be described as the primary market, where in, the needs and desires of the consumers in that market are congruent with the features and benefits that are offered by the product.. An example of this might be, for the microwave oven industry, in the introductory stage of the PLC, the primary market for the product was the restaurant market. The growth stage of the PLC dealt with the secondary markets where satisfaction of the consumer needs and desires needed more augmen-tations to the basic product features and benefits and thus product modifications were necessary to appeal to this market.
The competitive structure in the introductory stages of the product life cycle is primarily monopolistic in nature. In this stage, the industry profits may be small, sometimes even negative, due to increased in-vestment costs. As the sales growth accelerates in the industry, more competitors enter the market and the now the competitive structure evolves into a monopolistically competitive mode. Many sellers enter the market and product differentiation becomes the norm. The in-dustry profits tend to increase during the early and middle part of the

111
The Linking Process: Product Life Cycle, Diffusion Process, Competitive Market structures and Nature of the Market
growth stage due to lower production cost realizations and increase in the market and sales potentials.
Market Configuration
Toward the latter part of the growth stage, due to the intensely com-petitive market structure, the industry profits tend to decline and mar-ginal competitors start to drop off thus indicating transition into the maturity stage. During the maturity stage, marketers are investigat-ing the possibilities of extending the PLC by reinvesting in further product modifications and establishing stronger brand identities. The competitive market structure resolves itself into more of an oligop-oly structure. Few producers dictate larger shares of the market by adhering to multi-branding strategies, thus garnering a greater share of sales and profits. Once again, the market reflects customers in the secondary market for the product where augmentations to the basic product characteristics are germane.

112
Vish-Iyer y Nancy-Churc
Product diffusion process
The Product diffusion process allows a marketer to understand the nature of the market place in terms of the needs and desires of the target market. This process classifies the target market as to its domi-nant market characteristics and allows a marketer to tailor the most effective strategy to fulfill the market needs and desires. The Product diffusion process combined with the PLC allows total control over the marketing mix and target market variables in designing a highly effec-tive marketing strategy.

113
The Linking Process: Product Life Cycle, Diffusion Process, Competitive Market structures and Nature of the Market
The interfacing of the Product Diffusion Process and the Product Life Cycle provides an excellent explanation of the adaptation of the competitive structures as they relate to the market characteristics, as the PLC matures in a particular class of products.
Basic marketing strategy options
Based on Ansoff’s Product/Market Expansion grid, the fundamental strategy options for a firm are four-fold. These options are Market Penetration, Product Development, Market Development and Diver-sification strategies. The nature of the competition in the environment dictates the selection and evolution of a firm’s marketing strategy evo-lution. A firm may select one or more of these strategies depending upon the competitive structure in the market place. For example, in the introductory stage of the PLC, a firm may opt to embrace product

114
Vish-Iyer y Nancy-Churc
and market development strategies, while in the maturity stage of the PLC, a firm may opt to engage in market penetration strategy.
It is important to realize that the PLC, the Diffusion Process and the nature of the market place truly dictate the competitive nature of the market. From an economic standpoint, the profitability in the industry is dictated by the nature and intensity of the competition in the market. Therefore, a thorough understanding of the evolution of competition is essential for planning a successful marketing strategy and plan. The PLC, albeit historical and the Diffusion Process being in real time, need to be viewed together to assess the nature of the competition in the marketplace, for better design and execution of pro-active and re-active marketing strategies and plans. The ultimate result of such scrutiny will be increased market shares and profits for firms.
References
Rogers, E. M. (2003). Diffusion of Innovations. 5th Ed.Ansoff, I. (1957). Strategies for Diversification. Harvard Business Review, 35
Issue 5, Sep-Oct 1957, 113-124.Kotler, P. Marketing Management: Analysis =, Planning, Implementation and
Control. 9th Ed. Upper Saddle River, NJ: Prentice-Hall.

115
The Future of Marketing: Staying Competitive in a Competitive World
Nancy J. Church1
Vish Iyer2
Introduction
M arketing is most definitely not a static discipline nor is it a slowly changing field. Rather, the wide-ranging field of marketing is dynamic and rapidly changing. In fact, some
publishers of marketing texts have focused on publishing e-textbooks because the hard copy versions of their textbooks were obsolete as soon as they were published. Given the quick rate of change in mar-keting, marketing professionals must constantly be learning new skills and practices, as well as staying abreast of a changing marketplace and changing consumer needs and trends.
To conduct a research investigation into the practice of marketing in the future, one must take a different research path and make use of different types of sources. Academic researchers typically use aca-demic journals and academic conference proceedings to look back-ward to construct literature reviews, to gain a deeper understanding of concepts, theories, and phenomena, and to find gaps in the litera-ture. However, to peer forward into the future, one cannot use inves-tigations into past behaviors that are reported in journals (unless one
1. State University of New York.2. University of Northern Colorado.

116
Nancy J. Church y Vish-Iyer
is conducting a time series analysis). Instead, one must seek out non-traditional non-academic sources, such as newspapers, magazines, on-line articles, websites and blogs, to construct a view toward the future.
Purpose
The purpose of this investigation is to provide marketing profession-als and marketing educators with a view into the future of marketing practice and the marketing profession. Marketing educators will be able to better prepare their students for the marketing environment they will be entering upon graduation from college or university. Mar-keting professionals will be better able to continuously update their knowledge and build their marketing skill sets when they are forward looking.
The future of marketing: what the experts are predicting
This investigation reviewed dozens of articles in order to develop a list of anticipated changes in how marketing is/will be practiced or shifts in the emphasis of various marketing variables. Most of the predic-tions are simply variations of current practices today. Some are signifi-cantly more different, and a smaller number of predictions are ‘far-out tech innovations.” These predictions offer much food for thought with respect to how marketing is changing and evolving.
Prediction #1: The “Internet of Things” “Complete Integration of Internet Access into Everything”
As early as 1999, the concept of the “Internet of Things” was coined by Kevin Ashton. Qualcomm, which has played a significant role in providing chips for most smart phone companies, is working to bring wireless connections to billions of other types of electronic devices and appliances through its open-source software platform for Inter-net-connected devices—AllJoyn. (Lev-Ram, 2014). Gerd Leonhard, CEO of The Futures Agency, predicts that Internet access will be integrated into everything, not just using Google Glass, but perhaps

117
The Future of Marketing: Staying Competitive in a Competitive World
directly into your eyes’ irises and controlling the devices with brain waves (Soat, January 2014). Leonhard also believes that all televisions will be connected to the Internet. This changes the dynamic between marketers and target customers because there would no longer be a third party (broadcasters) between them, and marketers would have direct access to customers. On the HBR Blog Network, Scott Berinato (August 28, 2014) stated that smart watches will afford watch wearers the ability to “control the space around them and choose what data is captured and distributed.” At the same time, marketers will use “geo-fencing and iBeacons” with the smart watch just as they have done with smart phones to reach users in close proximity to promote their businesses, products, and services (Cristo, September 15, 2014). Ian McKenna (2014) foresees in the very near term that wearable tech of all types will encourage a flurry of apps related to healthcare, finance, etc. and that he thinks that Watch 2.0 could “do to the (health) insur-ance industry what the iPod did to music.” He further stated that “wearables, along with digital wallets which allow people to pay via their device, will become part of everyday life in the next few years,” thereby allowing marketers to forge a different relationship with con-sumers as a result of this connection. These applications will lead to other, more flexible pieces of wearable computing equipment are cer-tain to follow the iPhone.
Prediction #2: Utilization of More Futurists to Guide New Product Development and ‘Experiences Innovation’
Most companies today develop new products based on their ability to design and produce the products. Once they determine they are capa-ble of producing the product, then they typically conduct research to see if consumers will actually buy the product. According to Molly Soat (November 2013), some leading edge technology companies, such as Intel, actually hire “futurists” to “provide a vision of how humans all over the world will use technology 10 or 20 years down the line.”
Intel’s futurists work “with a team of anthropologists, ethnogra-phers, engineers, market researchers, and science fiction writers” to find out how people will live in a decade, what people will need and want out of their devices, and how they will use technology.” The im-

118
Nancy J. Church y Vish-Iyer
portance of future casting cannot be overstated, particularly in the tech-nology sector because of the lag time between design and production.
One futurist, John Brandon, a contributing editor at Inc. maga-zine, has made predictions of ‘far-out innovations to watch.” His pre-dictions include the use of different pricing models and currencies (bitcoins, etc.) instead of the U.S. dollar; clones to whom we will be able to delegate some of our work; the ability to hire trans-humans, that is, humans merged with technology; no longer using computers or phones directly, but rather using consumers’ mobile device sen-sors wherever they happen to be; everyone working remotely; and autonomous, self-driving cars. Bianca Bosker (December 22, 2010) and George Dvorsky (February 20, 2014) wrote that the following list of things have already become obsolete or are on the way out: book-stores, watches, maps, classified ads, dial-up Internet, encyclopedias,, CDs/DVDs/Videotapes, landline phones, film/film cameras, Yellow Pages & address books, catalogs, fax machines, wine, handwritten letters, calling by phone, pages, typewriters, public pay phones, dedi-cated mp-3 players, answering machines, print media. Marketers must examine these phenomena, determine how their jobs are impacted and predict what will take their place or perform their function.
Prediction # 3: Distribution Channels tilting toward SoLoMo (Social, Local, Mobile)
It is common knowledge that most advertisers have shifted some of their attention, creative efforts and budgets to reach consumers through social media and smart phones & other mobile devices as their use has exploded around the world and the devices have become irreplaceable. In addition, knowing the customer’s location provides opportunities to target promotions to consumers that are contextual. The new iPhone 6, which can be used in place of the user’s credit cards, introduces a new twist on secure mobile device payment solu-tions. Marketers are realizing the importance of mobile ad spending (on smartphones and tablets), with mobile spending doubling from 2012 to 2013 and predicted to increase more than 50% in 2014 (Taube, March 14, 2014).
The Internet has been an important distribution channel for many products and services through companies’ websites, but the increas-

119
The Future of Marketing: Staying Competitive in a Competitive World
ing use of social media as a marketing medium (instead of simply a social communication medium) and the escalating use mobile devices to make purchases has led to the increased use of social media and mobile as distribution channels in the omnichannel experience (Social and Mobile – The Future Distribution Channels, 2014). The travel industry has been at the forefront of this effort although it has and will become true for almost every imaginable product or service on the market. Mobile phones are becoming more important in marketing research, too, as will be discussed below.
Prediction #4: Marketers as Storytellers
Marketers know how to reach their target markets, but then they must seduce and engage the members of their target audience, espe-cially when “people can choose whether to see our ads or not,” states Bill Millar (September 9, 2014), contributing author at Forbes. To cut through all the clutter, telling stories that are more “emotion-ally engaging,” that allow interaction with content, and which can be shared with friends, will be more effective. By creating different sto-ries for different target audiences, the message will be more relevant to each audience. Dave Dickson, Senior Product Marketing Man-ager at Adobe Digital Publishing Suite, states that “Successful brands are adopting a storytelling mind-set regarding content, thinking like media companies to produce branded content that engages customers and employees on these (tables and smartphones) devices (Hot Mar-keting Trends for 2014, January 2014).”
Videos are one of the best, most versatile vehicles that a marketer can use to tell a story, whether they are shown on television, on You-Tube, on Facebook, at a meeting, in an e-newsletter or on the com-pany’s website. With their agency, Evian water created different video messages for different sub groups: pediatricians and parents, for envi-ronmentalists, and for the adult bottled water market. Evian’s Roller Babies video for general consumers, which featured babies roller skat-ing and hip hopping in a video, went viral and was one of the most watched video ads on the Internet with millions of views. They also created a video, encouraging viewers to interact with the content, by “adding their own faces to the video or turning their friends into ba-bies.”

120
Nancy J. Church y Vish-Iyer
Prediction #5: Social Media has Made Us More Visual “Videos are the new Photos”
Apu Gupta (2014), CEO of Curalate, a marketing and analytics plat-form for the visual Web, states that “we are witnessing a mass migra-tion from written communication to visual communication on social media platforms. Pictures and videos are no longer sidekicks to tweets and posts.” In fact, he reported that “over a billion images are shared daily, and when people communicate with pictures, they don’t use many words…75% of posts to Tumblr are image posts, and 90% of those posts contain no text or hashtags.” Online video ads have grown more than 40% in each of the years 2012 and 2013, and the expecta-tion is that they will grow more than 40% in 2014 as well, according to digital forecaster, eMarketer. Projected to grow nearly 300% from 2013 to 2018, the growth in digital video is being fueled by faster video streaming and the ability to grab the viewer’s attention more than static ads (Taube, March 14, 2014). The growing use of infographics in the presentation of facts and figures also supports the visual approach to communication.
In her article on “Six trends driving the future of social,” Nicola Kemp (September 22, 2014) reported the #1 trend in social media to be “the new visual economy.” She posited that “when an Instagram image has become a unit of speech in its own right,” that market-ers must better understand how consumers interact with them. Kemp quoted Jan Rezab (CEO of Socialbalkers) as saying “videos are the new photos,” as demonstrated by “short-form micro-content videos on Vine to longer videos on Facebook, therefore, the aggregation of video and content is a huge opportunity” for marketers.
The implications of this shift to visual social communication for online marketers is significant because online search and SEO are based on the written word. Gupta advises marketers to change their SEO practices in the following ways. First, Gupta advises marketers to move from “describing the physical characteristics of a product to describing how it is used.” By describing how the product is used, you are providing the context, which will provide better keywords and vi-suals. Second, Gupta recommends that marketers must discover and examine how consumers describe images of their products, which will provide a rich list of keywords for SEO. Finally, Gupta suggests that

121
The Future of Marketing: Staying Competitive in a Competitive World
marketers feed these consumer insights and keywords into the visual content that they create for the Internet.
Prediction #6: Marketing Departments Morph into Social Departments
Futurist Gerd Leonhard predicts that what we call a “marketing department” today may become a “social department” by the year 2020 (Johnston, September 25, 2014). Part of the reason for this is that he believes that “all advertising will have turned into “content” (blog posts, videos, podcasts, e-books, etc.).”
Prediction #7: More Industry Concentration, more Specialization, Leaner
There has been greater specialization in both the advertising agency and marketing research industries, with the largest firms accounting for a huge share of the market. Avi Dan, wrote in Forbes.com (March 31, 2014) that “in 1985 no agency on Madison Avenue accounted for more than 2% of global ad spending….Today, just 3 of these conglom-erates control two-thirds of global advertising investment.” However, some experts are suggesting that the large ad agencies with offices around the world, in particular, have been forced to operate leaner and fewer offices due to declining agency fees, duplication of efforts, and inefficiencies. A regional hub approach, says Avi Dan, is replac-ing the current multi-local model. Dominic Tyer (September 18, 2014) interviewed Sam Welch, Publicis Healthcare Communications’ global group president, and reported that Publicis has gone with the global hubs in major cities while at the same time maintaining an agency presence in local markets.
David Siteman Garland (N.D.) predicts that agencies will go in the opposite direction and become lean ‘specialized experts’ as opposed to larger agencies that offer all services in their field. He argues that large, bloated agencies charge higher fees, are slower moving, and of-ten are not ‘cutting edge.’ Simon Hathaway (2014), chairman of the Marketing Agencies Association—an organization of future-thinking marketing communications firms in the UK, stated that “disruptive digital technology has driven profound transformational change in how consumers interact with brands and shop, which is challenging

122
Nancy J. Church y Vish-Iyer
traditional approaches to media and disciplines.” Danielle Sacks (2010, November 17)., writer at Fast Company magazine, reports that many chief marketing officers are actually “shunning ‘agencies of re-cord’ relationships,” because they that tend to require long-term rela-tionships, and they are opting for shorter relationships.
Prediction #8: Programmatic Marketing and Programmatic Buying is like Speed Dating on Steroids
According to John Nardone, CEO of [x+1] (Ebbert, November 19, 2012), “Programmatic marketing uses real-time systems, rules and algorithms to automate the delivery of data driven, targeted, and rel-evant experiences to consumers as they interact with a brand’s many touch points. The experiences include targeted offers, messages, con-tent, or ads across paid, owned, and earned channels. The best pro-grammatic marketing recognizes the consumer as he moves between channels and touch points, so that each interaction informs the next.” Scott Strawn of International Data Corporation was quoted as saying that “predictive advertising algorithms will become even more common as the Internet grows.” (Tom Risen, July 3, 2014).
Programmatic buying of online advertising offers a speedy meth-od that is based on real-time bidding using complex formulas to auto-mate the process (Taube, March 14, 2014). An eMarketer projection has 29% of U.S. online buyers spending their digital display budgets programmatically by 2017. Programmatic ad-buying has been com-pared to programmatic stock trading by John George, CEO of Rocket Fuel (Ebbert, November 19, 2012),. He describes programmatic buy-ing as “the application of artificial intelligence and big data to bidding on an advertising inventory source…through an advertising exchange in real time for the opportunity to show one specific ad to one anony-mous consumer in one context on one device.”
The beauty of programmatic buying is the ability to target messag-es more precisely in real time. Ben Plomion (May 21, 2012) describes the possibilities:
“Take a simple example of a practice know as site retargeting: If you look at an H &M oxford shirt and then surf around to other sites, you might well encounter a display ad for the very shirt you just looked at. Search retargeting is another

123
The Future of Marketing: Staying Competitive in a Competitive World
increasingly popular technique. Whereas site retargeting is designed to increa-se revenue from someone who has already visited your site, search retargeting makes it possible to find new customers based on their search history. Someone who searches for “oxford shirts” on Google might then surf to another site and discover display ads for H&M oxfords – despite never having visited H&M’s site….Consider that H&M oxford that you keep seeing across the Internet as you browse. After seeing those display ads on ESPN, you might check Facebook, where an ad reveals that dozens of your friends are H&M fans. Then you might head over to The New York Times where you encounter yet another ad for the oxford, this time with an offer of a 10 percent discount. Your confidence in the purchase is strengthened at each step. This cycle, repeated over and over, deli-vers a better ROI for the marketer and a higher CPM for the publisher.”
Digital/online advertising media buying is becoming a very different process as a result of ‘programmatic buying.’
Prediction #9: Shift from “Campaign to Commitment”
Consultant Stan Phelps (March 5, 2014) suggests that companies should consider shifting from using a top-down approach in which they create marketing campaigns to attract customers to using a bottom-up approach that focuses on better serving and supporting their current customers. By shifting to a “customer-first, prospect-second mindset,” the rationale is that when your current customers are well cared for, they will bring other customers to you. Phelps gave two examples. The first example is CVS, a large pharmacy chain that has shifted its “focus away from awareness and acquisition towards the customer experi-ence and retention.” The second example is Steinway, manufacturer of pianos. Once someone purchases a Steinway, the company helps the buyer stage a private concert in their home, complete with invi-tations, wine and hors d’oeuvres, valet parking, and a professionally trained concert pianist. This experience cements the relationship with the buyer and often results in additional sales to guests attending the private concert.
Prediction #10: “Chatvertising:” Really Smart Chat Apps and Chat Bots
Wall Street Journal reporter, Christopher Mims (2014), predicts that we will soon be able to hold conversations with companies via very

124
Nancy J. Church y Vish-Iyer
well-programmed, intelligent bots. Chat apps, which are more popu-lar outside of North America, are becoming more sophisticated and are now able to learn from their conversations and are becoming more natural, autonomous, and human-like. They may be valuable in providing customer service, information, and entertainment to cus-tomers/prospects.
Prediction #11: Advertisers Have Gone Native!
With so much content being developed for print, online, and social media, the use of native advertising has gained interest by some adver-tisers. The term, “native advertising,” refers to advertising content that looks like a news article that typically runs in news media near news or editorial content. The use of native advertising has expanded from long-form sponsored content and advertorials to short-form content on Twitter. Tyler Loechner (July 29, 2014) reported on a survey con-ducted by OneSpot (marketing platform) and digital media consul-tant 614 Group that “22% of marketers believe native is where all online advertising is headed,” while a smaller percentage believe that native advertising is simply a fad.
Prediction #12: Viewable Ads by Humans, not Netbots
Many advertisers today are concerned by two phenomena occurring in online advertising that is affecting their advertising costs (CPM) and inflating their audience reach. The first issue is whether their ads are ‘viewable.’ Peterson (June 29, 2014) explains that the ad must be seen by a human being. That is, is the ad so far down on the page that the user will not scroll down to see it. The Interactive Adver-tising Bureau has developed a definition of a “viewable ad impres-sion” as “a minimum of 50 percent of pixels in view for a minimum of 1 second.” The second issue has to do with “fraudster robots” that are being utilized to increase the traffic to a digital ad page. Peter-son (2014) reported that more robots than humans actually viewed an online ad for Mercedes. As a result, Peterson reports that Google has undertaken two impactful initiatives to combat these problems: (1) they have purchased an anti-click-fraud startup, Spider.io, to root out

125
The Future of Marketing: Staying Competitive in a Competitive World
botnets and (2) they have begun “offering ad buyers the opportunity to buy ads only in places on a page users can see them.
Prediction #13: Marketing Research has Gone Online
According to the GreenBook Research Industry Trends Report (2014), the growth in marketing research has been and will continue to be related to the Internet. Over the years, the door-to-door personal inter-view and the mail survey were replaced by phone surveys, but the Inter-net has most definitely taken over and become the venue of choice in the marketing research industry today. In 2014, online surveys were far and away the most popular type of quantitative research used in the industry, and traditional, in-person focus groups are still, by far, the most popular method of qualitative marketing research utilized.
The biggest changes over the past year were a 30% net growth in use of “online communities” (defined by Greenbook as “a target-ed group of people who are recruited into a private online venue to participate in research-related activities over an extended period of time.”) and 24% net growth in the use of social media analytics (GRIT Report, p. 8). Data mining and Big Data analytics have been growing in use for the past few years. In fact, one marketing expert, SY Lau (September 5, 2014), Senior Executive VP at Tencent, believes that the Chief Marketing Technologist (CMT) will become more impor-tant than the CMO or even the CEO in the near future. He stated that “In the Mega Web era, we will be faced with man-machine symbiosis and the fusion of traditional marketing, technology, and big data.” The Chief Marketing Technologist will be more skillful in digging into big data to find information to better understand the consumer.
However, the marketing research industry will continue to evolve with the times. Wale Omiyale, SVP of Confirmit, believes that mo-bile research is the way to “converse with respondents in the way that they prefer to communicate, or in some cases, the only way they can be reached” (GRIT Report, p. 31). However, researchers are encour-aged to use technology that formats the survey properly, no matter what type of device the respondent opens it on. The growing use of micro-surveys seems consistent with where marketing research is headed in the future.

126
Nancy J. Church y Vish-Iyer
Privacy is a concern in marketing research, and new research ap-proaches such as “biometrics, neuromarketing, facial analysis, and vitual environments are not gaining in adoption.” The 2014 GRIT Study revealed that a high percentage of respondents felt “inhibited” by these types of research methodologies.
A decision intelligence company, Gongos, has made a startling prediction regarding the five marketing research ‘sacred cows’ that may become obsolete by the year 2020 or beyond. First, they state that “the traditional in-person focus group is on life support and ripe for creative destruction,” and it will be replaced by the “non-traditional focus group environments to make focus groups feel like friends chat-ting at a bar” as well as more “explosive growth in online virtual fo-cus groups conducted primarily from mobile devices.” Second, they predict that the use of PowerPoint reports to deliver research results will “fall victim to a disruptive technology that will drive users to ac-tively explore, imagine, and intuitively grasp the meaning of multiple streams of research simultaneously. Third, they predict that the pop-ular on-line PC-based survey that may run as long as 30+ minutes will morph into” micro-surveys, modular data-infusion techniques, geofence-driven-in-the-moment mobile feedback, indirect measure-ment, facial sentiment recognition, mobile neurofeedback.” Fourth, they predict that the two major types of research—quantitative and qualitative—will no longer be “two methodological spheres,” but will rather evolve and they will be interwoven and occur simultaneously. Their fifth prediction is that the “rational frame,” the belief that hu-mans react in purely rational ways” does not explain or predict con-sumer behavior accurately and cries out for the application of behav-ioral economics, a developing new field.
Prediction #14: Gamification Strategy and “The Engagement Economy”
Palmer, Lunceford, and Patton (2012) coined the term “The Engage-ment Economy” in their article about using gamification to engage customers and employees. They stated that “Gamification can provide a reason for a customer to visit a website or a store more often…It could connect customers in a way that makes them feel rewarded and respected for their opinions and support of your business or product.”

127
The Future of Marketing: Staying Competitive in a Competitive World
What is gamification? It is the application of videogame technol-ogy to marketing challenges. Palmer et al explain it as “Gamification is about taking the essence of games—fun, play, transparency, design and challenge—and applying it to real-world objectives rather than pure entertainment. In a business setting, that means designing solu-tions for everything from office tasks and training to marketing or direct customer interaction by combining the thinking of a business manager with the creativity and tools of a game designer.” Many busi-ness loyalty programs have used an early form of gamification by en-couraging customers to come back again and again and by rewarding customer loyalty.
Palmer et al (2012) present the four components of successful gamification:
(1) Progress paths: the use of challenges and evolving narratives to increase task completion…
(2) Feedback and reward: the use of rapid indications of success through virtual and monetary rewards… The authors state that designing the right reward is the second part of the design challenge.
(3) Social connection: leveraging social networks to create competition and provide support…This enhances the ability to have conversations and dialogs with other users that increase the level of interaction and engagement.
(4) Interface and user experience: aesthetic design and cross-platform integra-tion considerations to enhance fun.
Engaging customers increases involvement and rewards retention and loyalty (Serpa, August 12, 2014). Furthermore, gamification is a natural for use on mobile devices as many videogames have traditionally been designed for handheld devices. To make the consumer’s access faster and more convenient, social logins, (that is, logins using your social media account rather than a user name and password) can reduce the “barrier to site entry to just two clicks,” while at the same time provid-ing the marketer with “access to rich, permission-based identity data needed to create more relevant user experiences. (Serpa, 2014).
Prediction #15: Content is Key!
To be successful, marketers will not simply get along by creating media ads and preparing news releases. Kemp (September 22, 2014) tells us

128
Nancy J. Church y Vish-Iyer
that “social media has transformed the context of our digital lives into a rapid (news) feed.” In order to gain a share of the constant “news” that is feeding into consumers’ online space or into traditional news media, marketers absolutely must be creators of content for various advertising, news, and social media to gain a share of the consumer’s attention. The Red Bull Stratos campaign was one spectacular exam-ple of content creation at its finest. Red Bull staged a free fall jump by Felix Baumgartner, wearing the Red Bull logo, that reached 833 miles an hour from 128,000 above the earth that was live streamed on You-Tube (Skene, March 14, 2014). Red Bull planned the event for 7 years, which was a marketing and public relations coup, garnering them TV and news coverage around the world as well as tremendous activity on its social media pages.
Not every company can create content that is as spectacular as the Red Bull Stratos content that breaks through the clutter and be-comes a worldwide trending topic, but everyone can create content that is relevant to the consumers being targeted. Furthermore, Kemp (2014) suggested that marketers should embrace “the power of an-ticipated content,” which is content created for various conceivable outcomes to an event. Kemp gave the example of an Adidas World Cup campaign in which they created content based on “almost every conceivable outcome” of the tournament. As soon as one of the soc-cer matches ended, the anticipated content that was created to cor-respond to the outcome of the match was placed. Newsrooms have been doing this for years, for example, when they research a story about an athlete who is about to compete in a sport or a story about a Hollywood legend who is expected to pass away. The difficult part is how to create content that is both newsworthy and related to a com-pany’s product in some way, but the rewards of gaining publicity, get-ting “Likes” and comments, and having your content shared are well worth it. Although anticipated content requires significant research and content creation by a staff of writers, it is an important endeavor for companies that are involved in events that involve multiple pos-sible outcomes.
Along the same lines, creating content often leads to “inbound marketing” as opposed to “outbound marketing” through the use of white papers, ebooks, podcasts, blogs/vlogs, and infographics (Gard-ner, June 21, 2012). Marketers are able to draw consumers in when

129
The Future of Marketing: Staying Competitive in a Competitive World
they offer information that is sought by consumers and is considered to be of value to them. When the company puts its information con-tent out, it can be spread by social media networks like Facebook and Twitter, which is picked up by news aggregators (i.e., Reddit.com) and bookmarking sites (i.e., Delicious.com). Then it can provide links back to the company’s webpages or blog, which increases the com-pany’s visibility in search engines rankings.
Prediction #16: The Customer is King! No, the Customer is Emperor!
Today, it is crystal clear to marketers that consumers have gained significant power in the buyer-seller relationship. Consumers evalu-ate: products on company websites, companies on surveys, products/ companies on third-party websites; they give feedback on blogs and forums; they discuss their consumer experiences on social media. Many companies do all they can to satisfy disgruntled customers and to keep satisfied customers coming back.
At the same time, consumers are seriously concerned about their privacy and protecting their identities. Gigya (2013) concurs with this trend and states that one of the top five ways that marketing will change in the next few years is that permission marketing will become the norm. Specifically, consumers are concerned about their privacy and want to know how their data will be used. Chris Nurko, Global Chairman of FutureBrand, suggests that the customer acquisition process will be turned on its head. Instead of companies acquiring customers, Nurko states that:
“Customers will give permission not only to be acquired, but, more importantly, to be acquired in a way that is putting the power in the hands of the consumers. Companies will be competing for you. They will be paying and incentivizing you for access to, and use of, your data…..The could be a whole new concept in 2024, which is some really unique way of finding who you are, and you managing that in a gatekeeper sense. Let’s call it ‘Userbox’: chris@userbox. It may be a univer-sal protocol that’s been created and ‘Userbox’ will allow you to filter everything from e-mails to messages to pictures to Skype to redirecting a physical post. There will be a new generation or paradigm, a new inter-activity portal that will help you control, and help marketers get access to, you as a distribution channel (Soat, January 2014, p. 42).”

130
Nancy J. Church y Vish-Iyer
Jonthan Becher, CMO of SAP AG, believes that today’s practice of consumers handing over our personal data for free will be replaced by the sentiment that if data is the “natural resource of the next gen-eration and it is the thing that we should all be competing over, then my data should belong to me.. therefore, I should be compensated in some way for allowing brands to get access to my data (Soat, January 2014).
Prediction #17: Ultra Personalization Will All Marketing Become Direct Marketing?
Matthew Walls, VP of Marketing for Hotels.com, predicts that the trend towards one-to-one marketing will accelerate (Davidi, Septem-ber 17, 2014). In order to accomplish this, marketers must become experts at organizing and using all of that ‘big data’ that is available. Andrew Markowitz, Director of Global Digital Strategy at GE, states the “the whole promise of digital is: being able to create micro-rele-vance in a way that is way beyond anything that we’ve been able to do (Soat, January 2014). Ann Mack, Director of Trendspotting at JWT New York, identified the trend she labeled as ‘predictive personaliza-tion’ based on consumer data that is used to target customers one at a time (Hot Marketing Trends for 2014, January 2014). Targeting the right consumers with a highly relevant message is the key to com-municating with consumers, and Walls sees consumers taking “more control over the marketing they will allow and filter out the broadcast, interruptive marketing that has no relevance to them.”
Prediction #18: Omni-channel Retail on the Move
Point-of-sale software marketer, Vend, presented some predictions for the changes in retailing that include: (1) connecting with con-sumers “on multiple channels and touch points simultaneously or interchangeably,” (2) the rising use of a “mobile wallet,” (3) “more personalized in-store experiences, (3) an increase in the number of mobile businesses (for example, food trucks, flower trucks, hair salon trucks, and pop-up apparel stores) thanks to mobile POS systems and cloud applications, (4) the employment of “likeable experts –store associates who aren’t there to sell, but rather to dish out advice, solve

131
The Future of Marketing: Staying Competitive in a Competitive World
problems, and build relationships….the role of the associate will change from an information provider to a facilitator of engagement,” and (5) increased investment in Big Data solutions to predict shop-per behavior and provide personalized experiences (Retail Trends and Predictions 2014). Nordstrom has also entered into a growing online retailing niche through its acquisition of the Trunk Club, which pro-vides a personalized men’s clothing service with merchandise hand selected by stylists who ship directly to customers. At the same time, Forbes retail expert, Walter Loeb, predicts that some “full line stores of major companies will be threatened and some shopping centers are heading for closings” (Loeb, August 19, 2014).
Limitations
This investigation includes predictions from a wide variety of marketing professionals, consultants, and companies. Since the articles referenced in this investigation are not likely to be the result of empirical studies, one should assume that they are based on the experience and opinion of the authors. Furthermore, some articles may have been written with the goal of promoting a consultant’s or a company’s services.
Conclusion
It is clear from the trends and predictions that the “Internet of things,” including social media, wireless and geo-location capabilities, and mobile devices (both wearable and portable) has changed the prac-tice of marketing and consumer lifestyles in revolutionary ways. The structure of both the marketing research and advertising industries is changing, becoming more concentrated with regional hubs while at the same time seeing the growth of more firms in new, specialized areas. Marketing research is evolving and using more observation research and more online research, which are contributing to the warehouses of Big Data and leading to better predictive analytics. How compa-nies approach media buying is becoming more analytical, producing higher ROIs, and possessing the ability to micro-target consumers in real time on a one-on-one basis.

132
Nancy J. Church y Vish-Iyer
The creation of personalized and anticipated content (including the growing use of storytelling, visuals, video, interactive technolo-gy, gamification, chat bots, and native ads that blur the line between advertising and editorial) will elevate communications with target markets to a more satisfying and effective level. At the same time, consumer privacy issues will continue to be of great concern. At the same time, the balance of power between marketers and consumers will continue to shift in favor of the consumer, especially given the consumer’s ability to go public with criticisms of companies/products that may subsequently go viral. The marketer’s commitment to a focus on consumer needs and customer satisfaction will always be the criti-cal to the success of a company.
The future marketing professional will require a different mix of skills than in the past, including the ability to conduct/understand how to new marketing research methodologies and how to statistically ana-lyze the huge amounts of data being collected online and from optical scanners; how to personalize communications to consumers and cre-ate content for multiple media channels; and how to use the changing technologies to stay ahead of the competition. Colleges and universi-ties must identify the skills that their graduates will need when they enter the job market and then offer courses that teach these skills and/or internships in which students can gain the necessary skills.
References
Berinato, S. (2014, August 28). Smart watches: Ravishing, and creepier than Google Glass. HBT Blog Network. Retrieved from http://blgs.hbr.org/2014/08/smart-watches-ravishing-and-creepier-than-google-glass
Bosker, B. (2010, December 22). You’re out: 20 things that became obsolete this decade. Huffington Post.
Chan, J. (2014, September 5). The future belongs to the ‘chief marketing tech-nologist’: Tencent Mind Conference. Campaign Asia-Pacific. Retrieved from http://www.campaignasia.com/Tools/Print.aspx?CIID=390066
Cristo, D. (2014, September 15). 5 ways the Apple watch changes market-ing. Marketing Land. Retrieved from http://marketingland.com/5-ways-apple-watch-changes-marketing-99544

133
The Future of Marketing: Staying Competitive in a Competitive World
Dan, A. (2014, March 31). The future of advertising: lean, nimble, agile. Forbes.com. Retrieved from http://www.forbes.com/sites/avidan/2014/03/31/the-future-of-advertising-lean-nimble-agile/
Davidi, A. (2014, September 17). Matthew Walls: technology will change consumers’ experience of marketing. The Guardian. Retrieved from http://www.theguardian.com/media-network/media-network-blog/2014/sep/17/hotelscom-matthew-walls-marketing-technology-consumers/
Dvorsky, G. (2014, February 20). 22 obsolete technologies that people thought would last forever. Retrieved from http://io9.com/25-obsolete-technologies-that-future-generations-will-n-1526922030
Ebbert, J. (2012, November 19). Define it – What is programmatic buying?. AdExchanger.com. Retrieved from http://www.adexchanger.com/online-advertising/define-programmatic-buying/
Gardner, O. (2012, June 21). Marketing you won’t hate – Inbound vs. Outbound [Infographic]. Unbounce. Retrieved from http://unbounce.com/content-marketing/marketing-you-wont-hate-inbound-vs-out-bound-marketing-infographic/
Gigya. (2013). 5 ways marketing will change in the next 5 years. White paper by Gigya. www.gigya.com
Gongos Research. (2013, June 5). 5 Things That Will Become Obsolete in MR Sooner Than You Think. GreenBook website. Retrieved from http://www.greenbook.org/marketing-research/5-things-that-will-become-ob-solete-in-mr-04157
GreenBook Research Industry Trends Report + What it all means (GRIT Report) (2014, Winter). Retrieved from http://www.greenbook.org/grit/
Gupta, A. (2014, September 18). What’s the future of SEO in a visual world?. MarketingProfs. Retrieved from http://www.marketingprofs.com/opin-ions/2014/26047/whats-the-future-of-seo-in-a-visual-world
Hathaway, S. (2014). Why marketing agencies must do different. The Guardian. Retrieved from http://www.theguardian.com/media-network/marketing-agencies-association-partner-zone/2014/sep/17/marketing-agencies-do-better-maa
Hot Marketing Trends for 2014. (2014, January). Direct Marketing News. 21.Johnston, T. S. (2014, September 25). Does the future of marketing mean the
death of marketing departments?. Business2Community.com. Retrieved from http://www.business2community.com/ marketing/future-market-ing-mean-death-marketing-departments-01018606
Kemp, N. (2014, September 22). Six trends driving the future of social. Marketing Magazine. Retrieved from http://www.marketingmagazine.co.uk/article/1313294/six-trends-driving-future-social
Lev-Ram, M. (2014, January 13). Everything is connected. Fortune, 70-75.

134
Nancy J. Church y Vish-Iyer
Loeb, W. (2014, August 19). Want to see the future of retailing? Check out Nordstrom. Forbes.com. Retrieved from http://www.forbes.com/sites/walterloeb/2014/08/19/nordstroms-unfolding-strategy-reflects-the-fu-ture-of
Loechner, T. (2014, July 29). Future of advertising: Report finds 22% of mar-keters believe all online ads will be native. MediaDailyNews. Retrieved from http://www.mediapost.com/publications/article/231016/future-of-advertising-report-finds-22-of-markete
McKenna, I. (2014, Septemer 19). Ian McKenna: Wearable tech will change protection forever. Money Marketing. Retrieved from http://www.money-marketing.co.uk/opinion/ian-mckenna/ian-mckenna-wearable-tech-will-change-protection-forever/2014145.article
Mims, C. (2014, July 27). Advertising’s new frontier: Talk to the bot. WSJ Online. Retrieved from http://online.wsj.com/articles/advertisings-new-frontier-talk-to-the-bot-1406493740.
Palmer, D., Luncefore, S. & Patton, A. J. (2012). The engagement economy: How gamification is shaping business. Deloitte Review, Issue 11, 52-69. Retrieved from http://d2mtr37y39tpbu.cloudfront.net/wp-content/up-loads/2012/07/US_deloittereview_The_Engagement_Economy_Jul12.pdf
Peterson, J. (2014, June 29). What does viewability mean and what is a view-able ad impression?. Dianomi. Retrieved from http://www.dianomi.com/cms/what-does-viewability-mean-and-what-is-a-viewable-ad-impression/
Phelps, S. (2014, March 5). The future of marketing: A little less campaign and a little more action. Retrieved from http://onforb.es/1cvmCSB
Plomion, B. (May 21, 2012). Why programmatic marketing is the future. Chango. Retrieved from https://www.chango.com/resources/articles/why-programmatic-marketing-is-the-future
Risen, T. (2014, July 3). Facebook study highlights the future of advertis-ing. U.S. News & World Report. Retrieved from http://www.usnews.com//news/articles/2014/
Sacks, D. (2010, November 17). The future of advertising. Fast Company. Retrieve from: (http://www.abc15.com/news/local-news/water-cooler/9-items-that-may-soon-disappear-as-technology-advances)
Siteman Garland, D. (N. D.). 5 predictions on the future of marketing, PR, and advertising agencies. David Siteman Garland Agency Blog. Retrieved from http://www.therisetothetop.com/davids-blog/5-predictions-future-marketing-pr-advertising-agencies/
Soat, M. (2013, November). The man who sees the future. Marketing News. I.Soat, M. (January 2014). Marketing in 2024. Marketing News. 48(1), 41.

135
The Future of Marketing: Staying Competitive in a Competitive World
Skene, K. (2014, March 14). A PR case study: Red Bull Stratos. News Generation. Retrieved from http://www.newsgeneration.com/2014/03/14/pr-case-study-red-bull-stratos/
Social and mobile – The future distribution channels. (2014, March 28). Digital Tourism Think Tank. Retrieved from http://thinkdigital.travel/knowledgestream/social-and-mobile-the-future-distribution-channels/
Taube, A. (2014, March 14). The 8 digital trends that will change the future of advertising. BusinessInsider.com. Retrieved from http://businessinsider.com/digital-trends-to-watch-for-in-advertising-2014-3?op=1
Tyer, D. (2014, September 18). Where is the future for pharma marketing?. PM Live. Retrieved from http://www.pmlive.com/pharma_thought_lead-ership/where_is_the_future_for_pharma_marketing_599490
Retail Trends and Predictions 2014. Vend website. Retrieved from http://www.vendhq.com/retail-trends-and-predictions


137
Type of innovation and customer knowledge management, in Mexico
Juan Mejía-Trejo1
José Sánchez-GutiérrezElsa Georgina González-Uribe
Guillermo Vázquez-Ávila
AbstractThe Type of Innovation as an Innovation Process component, increases the competitive advantage of the firms. The Customer Knowledge Man-agement, influences the Firm’s Process Innovation, based on the sense of information: for, from and about the customers, that increase the market opportunities. Hence, the aim of this paper is to determine the model and the most significant indicators from the Type of Innovation related with Customer Knowledge Management. We questioned 200 CEOs from the Software Developer Sector in Guadalajara City, México and by Using of the Inferential Statistics, we found only 2 relevant indicators from 7, situation that might be improved to rise new competitive advantages.Keywords: Innovation, Type of Innovation, Customer Knowledge Management.
Introduction
I n nowadays, an important key factors to develop competitive-ness, considered by several authors are: Innovation (Hill & Jones, 2011, Loudon & Loudon, 2012; Chesbrough, 2006; McKinsey,
1. Universidad de Guadalajara. Centro Universitario de Ciencias Económicas Administrativas.

138
Mejía-Trejo, Sánchez-Gutiérrez, González-Uribe y Vázquez-Ávila
2008) with its stages and types (INNOVS) (Rothwell, 1994, Rogers, 1984, OCDE, 2005) and the Customer Knowledge Management (CKM) (Garcia-Murillo & Annabi, 2002; Nambisan (2002); Desouza, K., Awazu, Y., Jha, S., Dombrowski, C., Papagari, S., Baloh, P., 2007; Gibbert & Probst,2002; Gebert, H., Geib, M., Kolbe, L., & Riempp, G.,2013). Innovation is conceived and divided in different stages (Rothwell, 1994). Here, I use the Mejía-Trejo, J., Sánchez-Gutiérrez, J.& Ortiz-Barrera, M. 2013b, model, implemented and proved in the Software Developer Sector in Guadalajara, México; in this paper, this model is improved and complemented with the concepts around the Customer Knowledge Management (CKM).
Therefore, this study is aimed to identify the Type of Innovation (TOINN) and indicators, inside of Innovation Process (INPROC) vari-able belonging to the Innovation Stages (INNOVS) from Mejía-Trejo (et. al, 2013b) Model and their relation with Customer Knowledge Management (CKM). So, I questioned 200 CEO’s from the Software Developer Sector in Guadalajara City, México; they are considered as one of the most successful industrial sectors in the creation of in-novation.
The study is considered pretty important by the sector, due that the findings are able to describe the strengths and the weakness of the policies and actions, around the innovation and the customer knowl-edge to planning new and better competitive advantages. (Porter, 2005; Hill & Jones, 2011)
This work is divided in: 1) contextual reference, problem, research questions, hypotheses and rationale for the study; 2) the literature re-view, which is a collection of concepts about Innovation with its differ-ent stages (INNOVS) and Customer Knowledge Management (CKM) concepts, concluding with the design of the questionnaire; 3) method-ology; 4) analysis of results; 5) discussion and 6) conclusions.
Contextual reference
One sector, that is considered successful, fast-growing and highly dependent on value creation and innovation generation is the Soft-ware Developer Sector. According to INEGI (2014), in Guadalajara City located in Jalisco state, México there are around 200 firms that

139
Type of innovation and customer knowledge management, in Mexico
are directly or indirectly related with SDS, which have opportunities to develop them into the Digital Creative City program. The proj-ect, was officially announced on January 30, 2012 by President Felipe Calderon, to enable 1000 acres, with an investment close to 1000 mil-lion USD looking for create 20,000 jobs in 10 years. Disney, Pixar Stu-dios and Dreamworks already have shown their interest in joining to the Jaliwood concept of Mexico.
The Global Innovation Index Report (INSEAD, 2013) places México on site 63/142 that is reflected in its level competitiveness level, which is located on site 55/144 according to The Global Com-petitiveness Report 2013-2014 (WEF, 2014). Hence the importance of identifying and promoting in a systematic way, the major factors such as the relation between Value Added as a component of Innovation and Customer Knowledge Management to get more and new com-petitive advantages.
Problem, research questions, hypotheses and rationale of the study
So, our problem is described in a general question as GQ: ¿Which is the conceptual model that relates variables, dimensions and indicators from Type of Innovation (TOINN) into Innovation Stages (INNOVS) that influence the Customer Knowledge Management (CKM)? By other hand, the specific questions (as SQ), are:
SQ1: What is the scheme of the model?;SQ2: Which are the variables, dimensions and indicators?;SQ3: Which are variables and indicators of Type of Innovation (TOINN) more significant into the model?The general hypothesis proposed (GH) is:GH: The most important indicators of Type of Innovation (TOINN) produce, more than the 40% of the Customer Knowledge Management (CKM) variability in the Software Development Sector firms in Gua-dalajara, México.
The rationale of the study is the importance by the Software Devel-oper Sector, in México, to find out the strengths and the weakness

140
Mejía-Trejo, Sánchez-Gutiérrez, González-Uribe y Vázquez-Ávila
of the policies and actions, around the innovation and the customer knowledge, to planning new and better competitive advantages.
Literature review
Innovation and its Stages (INNOVS)
The competitiveness recognizes the potential of the Innovation (OCDE, 2005; Hill & Jones, 2011, Loudon & Loudon, 2012; Ches-brough, 2006; McKinsey, 2008) and its different stages (Rothwell, 1994; Rogers, 1984). According to DRAE (2014), the word innovation comes from the latin innovatio,-ōnis and means: 1. f. Action and effect to innovate, and 2. f. Creating or modifying a product. For the Oslo Manual (OECD, 2005, p.56) innovation is: the introduction of a new or significantly improved product (good / service), process, a new mar-keting method, or a new organizational method in the internal business practices, the workplace organization or external relations, so it is not just limited to the field of technology, product or services.
Also, OECD (2005, p.37) recognize the process of creative de-struction, enunciated by Schumpeter, which raises two types of inno-vations: the radicals that contribute to major changes in the world and, the incrementals, happening on an ongoing change process. In this sense, I quote The Rogers Innovation Bell (1962), that divides the innovation market in: a.the innovators (they are very careful to use the latest in technology, and very important to communicate and spread); b. early adopters (people considered as opinion leaders and influence their environment but are very careful to suggest and / or use the lat-est innovations); c.early majority (conservative people, but open to technological change with some level of careful to adopt it); d.late ma-jority (consumers particularly skeptical to the use of innovations until a large number of his acquaintances, has adopted it); 5.the laggards (very traditional people maintaining the old forms; they hardly ac-cept any changes and adapt to them until they become a habit even.). Other attempt to stablish different innovation stages, is the proposal of Rothwell (1994), determining different Innovation Models, such as: a) First Generation: Technology-Push; b) Second Generation: Mar-ket-Pull; c) Third Generation: Coupling Model; d) Fourth Generation:

141
Type of innovation and customer knowledge management, in Mexico
Integrated Innovation Process; e) Fifth Generation: System Integration and Networking.
The Innovation Model
The other one additional attempt to explain and predict how the industrial sectors, such as the Software Development Sector in Gua-dalajara, México is the model of Innovation Stages (INNOVS), is pro-posed by Mejía-Trejo, J., Sánchez-Gutiérrez, J.& Ortiz-Barrera, M. (2013b); briefly the conceptual model involves 6 variables: A. Innovation Value Added (IVADD), or the real proposal of inten-
tion, where several agents, beside the customer are in interaction, such as: the shareholder, the Firm, the sector, the society, cost & risk of decisions (Bonel, J. I., Bonel, F. J., & Fontaneda; 2003). An attempt to get the relation value-price, I consider the model created by Gale & Chapman, (1994), which is a proper model to relate, the customer emotions and desires to identify the attribu-tes of products and services (Chaudhuri,.2006; Mejía-Trejo, J. & Sánchez-Gutiérrez, J., 2013a ).
One of the latest model, that involves clearly the value added aimed to the client, is the Business Model Generation created by Osterwalder & Pygneur (2010), with 9 stages to identify: customer segment; value proposition; channels; customer relationships; re-venue streams; key resources; key activities; key partnerships and cost structure.
B. Innovation Income Items (IIIT), or the igniting process, where is considered the early innovation, describing: opportunities, analy-sis, idea generation, idea selection and the concept definition (Kausch, C., Gassmanna, O., & Enkel, E. 2012. By the hand of the facilities for innovation Shipp (2008) and McKinsey (2008) define the scope of Research & Development (R&D) staff and tangibles to support the innovation. As an intangible assets to the process of innovation I take the efforts to use and generate patents, crea-te and improve databases, to improve the organizational proces-ses by meaning of the knowledge and skills and the decisions to increase its availability to the risk (Canibano, 1999; Shipp, 2008; Lev, 2001; Howells, 2000). The efforts to discover new market knowledge (Popadiuk & Wei-Choo, 2006), is considered too.

142
Mejía-Trejo, Sánchez-Gutiérrez, González-Uribe y Vázquez-Ávila
C. Innovation Process (INPROC), or motor of the model. Take in ac-count the concepts around actions to improve the existing pro-cesses of Research & Development + Innovation (Shipp, 2008; McKinsey, 2008; OECD, 2005), studies about product lifecycle (Gale & Chapman, 1994). The design is an special issue, and in-cludes actions to improve the existing design (OECD, 2005) and the employee influence based on its own autonomy to make opin-ions and decisions (Nicolai; Keld & Pedersen, 2011). The open in-novation concepts, as a last trend are considered Chesbrough (et. al 2006) due to the chances to discover at the same time of R&D, new markets. The results of innovation are around on prototypes and conceptual models that tend to improve the actual production process (OECD, 2005; Chesbrough, 2006; McKinsey, 2008).
The diffusion of innovation (and very related with lifecycle products) is important for marketing because the prevision of ob-solete products, the changes in the market, the early adopters, the early majority, the late majority, the laggards described all abo-ve by mean of Rogers’s Diffusion Innovation Model (1983). The onset and end of a technology is included as a market study that influences the innovation (Afuah, 1997; Dussauge & Ramantsoa, 1992).
D. Innovation Outcome Items (IOIT), or qualification of innovation stage, which makes a revision of products and services obtained. Detects the projected level of revenues generated by innovation (Shipp, 2008), the projected customer satisfaction level generated by innovation (McKinsey, 2008), the projected sales percentages levels generated by innovation (Lev, 2001), the level of the num-ber of launches of new products/services in a period and the net present value of its portfolio of products / services in the market generated by the innovation (McKinsey, 2008).
E. Innovation Performance (IPERF), or the quantification of innova-tion stage, makes different ponderations about the results to deter-mine different levels, such as Bermúdez-García, (2010), proposes: • Cost-Benefit of Innovation = Innovation income / Investment
in Innovation;• Opportunities Index for Collaborative Innovation =
Innovation Identified Opportunities / Total Contributors on the Process;

143
Type of innovation and customer knowledge management, in Mexico
• Generation Ideas Rate= Generated Ideas / Market Knowledge Opportunities x Total Contributors on Process;
• Effectiveness of Idea Generation = Number of Approved Ideas / Number of Generated Ideas;
• Implementing Effective Prototyping = Number of Correct and Timely Prototype Terminated / Total Prototyping Approved;
• Innovation Generation Rate= Number of Generated Innovations / Identified Innovation Opportunities;
• Index not Successful Innovations = Number of unsuccessful innovations implemented / Total Innovation, or other similar to quantify the final results.
And,• Triple Helix Politics = The relationship among university- go-
vernment- industry Smith & Leydesdorff, (2010), to develop the innovation as a policy of innovation, is considered too.
F. Innovation Feedback Items (IFEED), or alarm set of innovation sta-ge, makes different analyses aimed to improve the subject versus the marginal profits. It involves: the intellectual capital dedica-ted to innovation (Lev, 2001; Shipp, 2008; Nicolai, et al., 2011); the processes, the product/service/, marketing, technology, or-ganization: structure and functions, type of innovation (radical, incremental), (OECD, 2005), value added (Bonel, et al. 2003; Osterwalder & Pygneur, 2010; Gale & Chapman, 1994), and type of leadership (Gloet & Samson, 2013 Mejía-Trejo, et al., 2013b)
The Customer Knowledge Management (CKM)
To complement our proposed model of Innovation Stages (INNOVS), I did a revision and analysis of literature review about authors and their works about Customer Knowledge Management (CKM). Briefly, the results are described in 4 variables:G. CKM as a Driver of Innovation (CKMADI), or boost of Customer
Knowledge Management (CKM) where is considered the sense of information: from, about customer (Nambisan, 2002; Desouza, et al., 2007; Gibbert & Probst,2002; Garcia-Murillo & Annabi, 2002) and customer as a co-creator (Nicolai et al., 2011; Desouza, et al., 2007; Gibbert & Probst, 2002) making prosumerism to get more interaction with the customer knowledge.

144
Mejía-Trejo, Sánchez-Gutiérrez, González-Uribe y Vázquez-Ávila
Even more, the Negative side effects of Customer Integration such as the warning of the firm, respect of: customer’s personality, experi-ence, points of view, the likelihood to choose a wrong customer, and the risk to incorporate him into the relationship to the Firm (Kausch, et al., 2014) takes it at all, account into the model.H. CKM Support (CKMS), or basis of knowledge consists in knowled-
ge incentives, respect of: the salary associated with the ability and willingness to share knowledge (Nicolai et al., 2011; OECD 2003);It includes the salary determined by willingness to improve skills and upgrade knowledge; the tolerance to failure and rewards and recognition ( Gloet & Samson, 2013).
By other hand, I considered the fact of how the knowled-ge flows, through exchange the knowledge between employees across departments, communication among employees and ma-nagement.
I. CKM other Sources of Knowledge (CKMOSK) or different sou-rces of knowledge is a strategic tool, in the Information and Communication Technologies (ICT) as an infrastructure to support Customer Knowledge Management (CKM) (Laudon & Laudon, 2012; Mejía-Trejo & Sánchez-Gutierrez, 2013a), that is a powerful driver to boost the internal sources of knowledge from the environment, such as: technical services, engineering, R&D, production, marketing and sales and purchasing and supply, be-longing to the firm’s departaments (Baker & Hart, 2007; Garcia-Murillo & Annabi, 2002) and other employees into the same Firm (Murillo & Annabi,2002). As a complement, I decided the introduction of the external sources of knowledge, that involves: suppliers, scientists, Universities, Patents, Technology Exhibitions, distributor agents, and Consultant (Baker & Hart, 2007; Garcia-Murillo & Annabi, 2002) evenly the competitors.
J. CKM, Satisfaction, Experience And Performance (CKMSEP), or satisfaction with knowledge; one important issue that I considered essential to be determined, is the type of paradigm practiced by the Firm for Customer Knowledge Management (CKM)(Garcia-Murillo & Annabi,(2002). Due this, exist different paradigms that involve the performance on three levels to determine Customer Retention, Satisfaction, Experience-Creativity and Performance: Knowledge Management (KM);

145
Type of innovation and customer knowledge management, in Mexico
Customer Relationship Management (CRM) and Customer Knowledge Management (CKM). Such paradigms, are: If Only We Know What We Knew (KM) as a Customer Retention,Retention is Cheaper than Acquisition (CRM) as a Customer Sat-
isfaction,If We Only Knew What Our Customer Know (CKM) as a Customer
Experience and Creativity. Finally to these variables, is proposed the performance against
financial budget with three levels: Customer retention rate (KM). Per-formance in terms of customer satisfaction and loyalty (CRM) and per-formance against competitors in innovation and growth; contribution to customer success. (CKM) (Garcia-Murillo & Annabi, 2002)
As a result of the documentary analysis and making several groups of concepts answering SQ1, I obtained the Figure 1.
Figure 1General Conceptual Model
Source: Own
Methodology
This is a descriptive and transversal study; it is based on documental research, to design a conceptual model and questionnaire to obtain several groups of variables, and indicators that involves a relationship

146
Mejía-Trejo, Sánchez-Gutiérrez, González-Uribe y Vázquez-Ávila
between Type of Innovation (TOINN) and Customer Knowledge Man-agement (CKM). The subjects of the study were 200 CEOs belonging to the Software Developer Sector in Guadalajara City, México.
It was designed a questionnaire with 10 variables, 45 dimensions and 110 indicators based on Likert scale and more than 30 authors about Innovation Stages (INNOVS) and Customer Knowledge Man-agement (CKM); to prove the reliability questionnaire, it was used a Cronbach’s Alpha test launched in a pilot questionnaire.
After that, the results were analyzed through statistical inference tools, such as the Multiple Regression Analysis with Stepwise Method, contained in the SPSS 20 program; this process is based on inclusion/exclusion of elements and finally, are obtained the most representa-tives variables and indicators of the conceptual model.
Results
To answer SQ2, I present the Tables: 1, 2 and 3 with the description of 10 variables, 45 dimensions and 110 indicators.
Table 1Final Questionnaire showing Innovation Stages and Customer
Knowledge Management. Questions: 1-40
Innovation Stages (Innovs)V Dimension Indicator Q Author(A) 1) Emotions
& Desires of Customer (VAEDC)
The innovation actions are aimed to increase the Emotions & Desire of the Customer
1 Chaudhuri (2006); Mejía-Trejo,J & Sánchez-Gutiérrez, J.(2013a)
2) Cost & Risk(VACR)
The Cost is the main constraint to increase the value (VACR1)
2 Osterwalder, A & Pygneur, Y. (2010)Bonel (et al.,2003)
The Risk is the main constraint to increase the value (VACR2)
3
3) Customer (VACUS)
The innovation actions are aimed to increase the Customer value
4

147
Type of innovation and customer knowledge management, in Mexico
Innovation Stages (Innovs)V Dimension Indicator Q Author(A) 4) Relation
& Segments (VAR&S)
The Innovation actions consider the customer relationship & segments
5
5) Channels & Cost Revenues (VACH&C)
The innovation actions identify channels & cost revenues
6
6) Activities & Resources (VAA&R)
The innovation actions consider the key activities & resources
7
7) Partners & Cost Structure (VAP&C)
The innovation actions consider partnership & cost structure
8
8) Price Value Relation (VAPVR)
The innovation is introduced to the market considering the relation price-value added
9 Gale & Chapman (1994)
(B) 9) Early Innovation Phase (EIPH)
Opportunity Identification (EIPH1)
10 Kausch (et al. 2014)
Opportunity Analysis (EIPH2) 11Idea Generation (EIPH3) 12Idea Selection (EIPH4) 13Concept Definition (EIPH5) 14
10) Facilities for Innovation (Tangibles, FFI)
Provides the most sophisticated equipment to support innovation (FFI1)
15 Shipp (2008); McKinsey (2008)
Invests in R&D+I (FFI2) 16Assigns staff to R& D+I (FFI3) 17
11) Efforts for Innovation (Intangible assets, EFFI)
Makes efforts to use and / or generate Patents (EFFI1)
18 Canibano (1999); Shipp (2008); Lev (2001); Howells (2000)
Makes efforts to create and / or improve Databases (EFFI2)
19
Makes efforts to improve the organizational processes (EFFI3)
20
Makes efforts to use the most of knowledge and skills of staff (EFFI4)
21
Makes planned decisions to increase its availability to the risk (EFFI5)
22

148
Mejía-Trejo, Sánchez-Gutiérrez, González-Uribe y Vázquez-Ávila
Innovation Stages (Innovs)V Dimension Indicator Q Author(B) Makes efforts to discover New
Market Knowledge (EFFI6)23 Popadiuk & Wei-
Choo (2006)Makes efforts to study the Existing Market Knowledge (EFFI7)
24
(C) 12) Research & Development + Innovation (RDI)
Makes actions to improve existing processes of Research & Development + Innovation (RDI1)
25 Shipp (2008); McKinsey (2008); OECD (2005)
Makes studies about Product Lifecycle (RDI2)
26 Gale & Chapman (1994)
13) Design (DSGN)
Makes actions to improve the existing design (DSGN1)
27 OECD (2005)
Employees have influence on their job (DSGN2)
28 Nicolai (et al., 2011)
Employees engaged in teams with high degree of autonomy (DSGN3)
29
The strategy is based on Open Innovation concepts (DSGN4)
30 Chesbrough (et. al 2006)
(C) 14) Prototypes (IPPFI)
Makes actions to develop prototypes for improvement
31 OECD (2005); Chesbrough (2006); McKinsey (2008)
15) Pre-Production (IPPPIP)
Makes improvement actions to pre-production
32
16) Market Research (MR)
Makes to investigate market needs of obsolete products (MR1)
33 Rogers (1984); Afuah (1997)
Makes to investigate the needs actions and / or market changes for innovators (MR2)
34
Makes to investigate needs and / or market changes for early adopters (MR3)
35
Makes to investigate needs and / or market changes for early majority (MR4)
36
Makes to investigate needs and / or market changes for late majority (MR5)
37

149
Type of innovation and customer knowledge management, in Mexico
Innovation Stages (Innovs)V Dimension Indicator Q Author(C) 16) Market
Research (MR)Makes to investigate needs and / or market changes for laggards (MR6)
38 Rogers (1984); Afuah (1997)
Makes to investigate the onset of a new technology (MR7)
39 Afuah (1997); (Dussauge & Ramantsoa, (1992)
Makes to investigate the term of a technology (MR8)
40
Source: Authors by own adaptationNotes: For lacking space, see abbreviations at final of Table 3
Table 2 Final Questionnaire showing Innovation Stages and Customer
Knowledge Management. Questions: 41-77
Innovation Stages (Innovs)V Dimension Indicator Q Author(C) 17) Novelty
(NOVY)Decides actions to improve or introduce new forms of marketing (NOVY1)
41 Lev (2001)
Seeks to be new or improved in the World (Radical Innovation) (NOVY2)
42 OECD (2005); Afuah (1997)
Seeks to be new or improved to the Firm (Incremental Innovation) (NOVY3)
43
Seeks to be new or improved in the region (Incremental Innovation) (NOVY4)
44
Seeks to be new or improved in the industry (Incremental Innovation) (NOVY5)
45
18) Training (TRAI)
Makes actions to train the staff continuously (Incremental Innovation)
46
19) Type of Innovation (TOINN)
Makes actions to innovate in technology (TOINN1)
47
Makes actions for innovation in production processes (TOINN2)
48

150
Mejía-Trejo, Sánchez-Gutiérrez, González-Uribe y Vázquez-Ávila
Innovation Stages (Innovs)V Dimension Indicator Q Author(C) 19) Type of
Innovation (TOINN)
Makes actions to improve or introduce new products forms (TOINN3)
49 OECD (2005); Afuah (1997
Makes actions to improve or introduce new forms of service (TOINN4)
50
Makes actions to improve or introduce new organizational structures and functions (TOINN5)
51
Innovation activities tend to be rather radical (TOINN6)
52
Innovation activities tend to be incremental (TOINN7)
53
(D) 20) New products/ and/or services (NPSD)
Detects the projected level of revenues generated by innovation (NPSD1)
54 Shipp (2008);
Detects the projected customer satisfaction level generated by innovation (NPSD2)
55 McKinsey (2008)
Detects the projected sales percentages levels generated by innovation (NPSD3)
56 Lev (2001)
Detects the level of the number of launches of new products/services in a period (NPSD4)
57 McKinsey (2008)
Detects the net present value of its portfolio of products / services in the market generated by the innovation (NPSD5)
58
(E) 21) Cost-Benefit of Innovation (PCBOI)
Do you use an indicator like: Innovation income / (Investment in Innovation) ?
59 Bermúdez-García (2010)
22) Opportunities Index for Collaborative Innovation (POIFCI)
Do you use an indicator like: Innovation Identified Opportunities / (Total Contributors on the Process)?
60

151
Type of innovation and customer knowledge management, in Mexico
Innovation Stages (Innovs)V Dimension Indicator Q Author(E) 23) Generation
Ideas Rate (PGIR)Do you use an indicator like: Generated Ideas / (Market Knowledge Opportunities x Total Contributors on Process)?
61 Bermúdez-García (2010)
24) Effectiveness of Idea Generation (PEOIG)
Do you use an indicator like: Number of Approved Ideas / (Number of Generated Ideas)?
62
25) ImplementingEffective Prototyping (PIEP)
Do you use an indicator like:Number of Correct and Timely Prototype Terminated / (Total Prototyping Approved)?
63
26) Innovation Generation Rate (PIGR)
Do you use an indicator like: Number of Generated Innovations / (Identified Innovation Opportunities)?
64
27) Index not Successful Innovations (PINSI)
Do you use an indicator like: Number of unsuccessful innovations implemented / (Total Innovation)?
65
28) Triple Helix Politics (PTHP)
Does exist any relationship among : university- government- industry, to develop the innovation?
66 Smith & Leydesdorff, (2010)
(F) 29) Capital (IFCAP)
Based on the results identifies intellectual capital dedicated to innovation for its improvement versus the marginal profits
67 Lev(2001); Shipp (2008); Nicolai (et al., 2011)
30) Product & Process (IFPP)
Based on the results identifies the stages of new or improved process for upgrading versus the marginal profits (IFPP1)
68 OECD (2005); Chesbrough (2006)
Based on the results identifies attributes of new or improved product / service for its improvement versus the marginal profits (IFPP2)
69
31) Innovation (IFINN)
Based on the results identifies the stages of new or improved form of marketing for its improvement versus the marginal profits (IFINN1)
70

152
Mejía-Trejo, Sánchez-Gutiérrez, González-Uribe y Vázquez-Ávila
Innovation Stages (Innovs)V Dimension Indicator Q Author(F) 31) Innovation
(IFINN)Based on the results identifies the stages of new or improved technology for its improvement versus the marginal profits (IFINN2)
71 OECD (2005); Chesbrough (2006)
Identifies the stages of the new or improved structure and functions of the organization for its improvement versus the marginal profits (IFINN3)
72
Identifies the type of innovation (radical or incremental) that has given best results versus the marginal profits (IFINN4)
73
32) Value Aded (IFV)
Based on the results identifies the new or improved value proposition (benefits / costs) for its completion; relation value-price versus the marginal profits
74 Bonel (et al.,2003); Osterwalder & Pygneur, 2010; Gale & Chapman, 1994)
33) Leadership and Innovation (FLINNO)
The type of leadership that drives innovation is Transactional (FLINNO1)
75 Mejía-Trejo (et al., 2013b), Gloet & Samson (2013)The type of leadership that drives
innovation is Transformational (FLINNO2)
76
The type of leadership that drives innovation is Passive (FLINNO3)
77
Source: Authors by own adaptationNotes: For lacking space, see abbreviations at final of Table 3

153
Type of innovation and customer knowledge management, in Mexico
Table 3 Final Questionnaire showing Innovation Stages and Customer
Knowledge Management. Questions: 78-110
Customer knowledge management (CKM)V Dimension Indicator Q Author(G) 34) Information
from Costumer (IFMC)
Customer is a Resource of NPD ideation; Customer Driven-Innovation (Innovation from Customers) Mutual Innovation.
78 Nambisan (2002); Desouza (et al., 2007); Gibbert & Probst,2002
35) Information about the Customer (IABC)
Strategy of close collaboration with customers. Communities of creation.
79 Nambisan (2002); Gibbert & Probst,2002)
36) Information for Customer (IFRC)
Customer as a User collaborates intensively in the product testing and support. Customer Focused Innovation (Innovation for Customers)
80 Nambisan (2002); Desouza (et al., 2007)
37) Information as a Customer Co-creator (with) (IWIC)
Customer as a Co-creator helps over NPD design and development; Customer Centered Innovation (Innovation with Customers); Prosumerism; Team-Based-CoLearning. Joint Intellectual Property
81 Nicolai (et al., 2011); Desouza (et al., 2007); Gibbert & Probst,2002
38) Negative side effects of Customer Integration (NSEC)
The firm is warned about the dependence on customer’s personality (NSEC1)
82 Kausch (et al. 2014)
The firm is warned about the dependence on customer’s experience (NSEC2)
83
The firm is warned about the dependence on customer’s point of view (NSEC3)
84
The firm is warned about to choose the wrong customer (NSEC4)
85
The firm is warned about the risk to integrate the customer to the company’s side (NSEC5)
86

154
Mejía-Trejo, Sánchez-Gutiérrez, González-Uribe y Vázquez-Ávila
Customer knowledge management (CKM)V Dimension Indicator Q Author(H) 39) Knowledge
Incentives (KI)Salary associated with the ability and willingness to share knowledge (KI1)
87 Nicolai (et al., 2011); OECD (2003)
Salary determined by willingness to improve skills andupgrade knowledge (KI2)
88
Tolerance of Failure (KI3) 89 Gloet & Samson (2013)
Rewards and Recognition (KI4) 9040) Knowledge Fluence (KF)
Exchange the knowledge between employees across departments (KF1)
91 Nicolai (et al., 2011); OECD (2003)
Communication among employees and management (KF2)
92
41) Knowledge and ICT (KICT)
ICT to support and control the Customer Knowledge Management
93 Laudon & Laudon (2012); Mejía-Trejo & Sánchez-Gutierrez (2013a)
(I) 42) Internal Sources of Knowledge (ISOK)
Technical Services (IOSK1) 94 Baker & Hart (2007); Garcia-Murillo & Annabi (2002)
Engineering Department (IOSK2) 95Research and Design Development (IOSK3)
96
Production (IOSK4) 97Marketing and Sales (IOSK5) 98Purchasing and Supply (IOSK6) 99Other Employees (IOSK7) 100 Murillo &
Annabi (2002)43) External Sources of Knowledge (ESOK)
Supplier (ESOK1) 1 Baker & Hart (2007); Garcia-Murillo & Annabi (2002)
Scientist, Universities, Patents, Exhibitions TechnologicalConsultant (ESOK2)
2
Distributor Agents (ESOK3) 3Competitor (ESOK4) 4
(J) 44) Paradigm (PAR)
If Only We Know What We Knew (KM) as a Customer Retention (PAR1)
5 Garcia-Murillo & Annabi (2002)

155
Type of innovation and customer knowledge management, in Mexico
Customer knowledge management (CKM)V Dimension Indicator Q Author(J) 44) Paradigm
(PAR)Retention is Cheaper than Acquisition (CRM) as a Customer Satisfaction (PAR2)
6 Garcia-Murillo & Annabi (2002)
If We Only Knew What Our Customer (CKM) Know as a Customer Experience and Creativity (PAR3)
7
45) Performance (PER)
Performance against budget; Customer retention rate.(KM) (PER1)
8
Performance in terms of customer satisfaction and Loyalty (PER2)
9
Performance against competitors in innovation and growth; Contribution to customer success. (CKM) (PER3)
10
Notes: Variables (V); (A).Innovation Value Added (IVADD); (B).Innovation Income Items (IIIT); (C). Innovation Process (INPROC); (D) Innovation Outcome Items; (E). Innovation Performance (IPERF); (F). Innovation Feedback Items (IFEED); (G). CKM as a Driver of Innovation (CKMADI) ; (H). CKM Support (CKMS); (I). CKM other Sources of Knowledge (CKMOSK); (J). CKM, Satisfaction, Experience And Performance (CKMSEP)Source: Authors by own adaptation
Applying the statistical inference tools from SPSS 20 program, I obtained:
0. Normality Test Results about Customer Knowledge Management (CKM) are com-
pared with Type of Innovation (TOINN) to determine the normali-ty of the samples, as is shown in Table 4

156
Mejía-Trejo, Sánchez-Gutiérrez, González-Uribe y Vázquez-Ávila
Table 4 Kolmogorv-Smirnov Normality Test
Normality TestKolmogorov–Smirnov(a) Test
TOINN Value Df Sig.CKM Primary .407 14 .000
Secondary .415 37 .000Middle .413 80 .000Superior .460 69 .000
Includes the Lilliefors significance correctionSource: SPSS 20 as a result of the research and adapted by the author.
I. The pilot questionnaire, to get the reliability on a sample of 20 CEOs of Software Developer Sector in Guadalajara City by Cronbach’s Alpha test =.947 and is showed in Table 5.Table 5.Cronbach’s Alpha Test
Cronbach’s Alpha Standardized Alpha N of Cases N of Variables.947 .948 20 110
Source: SPSS 20 as a result of the research and adapted by the author.
II. Multiple Regression Analysis by Stepwise Method was practiced with the next results:II.1. Table 6 shows the Correlations amongst the variables.
Table 6 Pearson’s Correlation
CKM TOINN1 TOINN2 TOINN3 TOINN4 TOINN5 TOINN6 TOINN7CKM 1.000 .501 .560 .508 .674 .634 .654 .484TOINN1 .501 1.000 .693 .583 .710 .615 .548 .500TOINN2 .560 .693 1.000 .489 .717 .757 .682 .527TOINN3 .508 .583 .489 1.000 .663 .605 .503 .631TOINN4 .674 .710 .717 .663 1.000 .832 .802 .665TOINN5 .634 .615 .757 .605 .832 1.000 .788 .594TOINN6 .654 .548 .682 .503 .802 .788 1.000 .609TOINN7 .484 .500 .527 .631 .665 .594 .609 1.000
Source: SPSS 20 as a result of the research and adapted by the author.

157
Type of innovation and customer knowledge management, in Mexico
II.2. Table 7 shows the set of variables entered/removed (a).
Table 7Variables Entered/Removed
Model Variables Entered
Variables Removed
Method Stepwise
1 TOINN4 Criteria: Probability of- F-to-enter<=.050, Probability of- F-to-remove >=.1002 TOINN6
Dependent Variable: CKMSource: SPSS 20 as a result of the research and adapted by author.
II.3. Table 8 shows the Model Summary
Table 8Model Summary
Model R R Square Adjusted R Square Std. Error for estimate1 .674 (a) .454 .451 .4752 .700 (b) .490 .485 .460
Predictors: (Constant), TOINN4; Predictors: (Constant), TOINN4, TOINN6Source: SPSS 20 as a result of the research.
III. Using the Stepwise method SPSS produces an ANOVA for each modelIII.1. Table 9 shows the Analysis of Variance (ANOVA).
Table 9ANOVA (a)
Model Value Sum of Squares Df Mean Square F Sig.1 Regression
ResidualTotal
37.10944.64681.755
1198199
37.109.225
164.572 .000(b)
2 RegressionResidualTotal
40.09041.66581.755
2197199
20.045.211
94.777 .000(c)
(a) Dependent Variable: CKM(b) Predictors: (Constant), TOINN4(c) Predictors: (Constant), TOINN4, TOINN6Source: SPSS 20 as a result of the research.

158
Mejía-Trejo, Sánchez-Gutiérrez, González-Uribe y Vázquez-Ávila
III.2. Table 10 shows the results of Coefficients.
Table 10Coefficients by Stepwise Method (a)
Model Factor Unstandardized Coefficients
Standardized Coefficients
t. Sig.
B Std. Error Beta1 (Constant)
TOINN42.073.430
.138
.033 .67415.05712.829
.000
.0002 (Constant)
TOINN4TOINN6
1.930.266.201
.139
.054
.053.417.320
13.9254.8973.755
.000
.000
.000
Dependent Variable: CKMSource: SPSS 20 as a result of the research and adapted by author.
IV. Table 11 shows the Excluded Variables.
Table 11Excluded Variables (a)
Model Variable Beta in T Sig. Partial Correlation
CollineartityTolerance
1 TOINN1TOINN2TOINN3TOINN5TOINN6TOINN7
.045(b)
.159(b)
.109(b)
.237(b)
.320(b)
.064(b)
.5962.1241.5642.5313.755.917
.552
.035
.119
.012
.000
.360
.042
.150
.111
.177
.258
.065
.495
.485
.560
.307
.356
.5582 TOINN1
TOINN2TOINN3TOINN5TOINN7
.059(c)
.095(c)
.126(c)
.128(c)
.022(c)
.8091.2561.8641.302.315
.420
.211
.064
.194
.753
.058
.089
.132
.093
.023
.494
.454
.558
.266
.542
(a) Dependent Variable: CKM(b) Predictors: (Constant),TOINN4(c) Predictors: (Constant), TOINN4, TOINN6Source: SPSS 20 as a result of the research.

159
Type of innovation and customer knowledge management, in Mexico
Discussion
Table 4. Many statistical procedures are based on two basic assump-tions: 1) normality: samples I work with, come from normally dis-tributed populations, and 2) homoscedasticity or homogeneity of variances: all these normal populations have the same variance. Kol-mogorv-Smirnov test ponts out that I will reject the hypothesis of nor-mality when the critical level (Sig) is less than the significance level set (usually 0.05). In our case, all items fulfilled the condition. (Hinton, et. al, 2004).
About Table 5 and according by Hinton (et al. 2004), Cronbach’s alpha corresponds : • 0.90 and above shows excellent reliability; • 0.70 to 0.90 shows high reliability; • 0.50 to 0.70 shows moderate reli-ability; • 0.50 and below shows low reliability.
Table 6, as a general rule, predictor variables can be correlated with each other as much as 0.8 before there is cause for concern about multicollinearity (Hinton, et al. 2004; Hair et al., 2010).
Table 7, shows the Variables Entered/Removed table shows that the Stepwise method of regression has been used. Notice that SPSS has entered into the regression equation, two variables: TOINN4 and TOINN6, those are significantly correlated with Customer Knowledge Management.
Table 8 shows the Models: 1 and 2, where the independent vari-ables TOINN4 and TOINN6 account for 45.4% % and 49% respec-tively, of the variance in the scores of Customer Knowledge Manage-ment dependent variable. The R value (0.674) in Model 1 is the mul-tiple correlation coefficient between the predictor variables and the dependent variable. As TOINN4 is the only independent variable in this model I can see that the R value is the same value as the Pearson’s correlation coefficient in our pairwise correlation matrix. In Model 2, the independent variable TOINN6 is entered, generating a multiple correlation coefficient, R =.700. The Adjusted R Square adjusts for a bias in R square and is usually used. The Std. Error of the Estimate is a measure of the variability of the multiple correlation.
Table 9, indicates Model 1: F (1,198)= 164.572, p<0.01; Model 2: F (2,197)= 94.777, p<0.01; Dividing the Sums of Squares by the degrees of freedom (df) gives us the Mean Square or variance. I cal-culate R square by dividing the Regression Sum of Squares by the

160
Mejía-Trejo, Sánchez-Gutiérrez, González-Uribe y Vázquez-Ávila
Total Sum of Squares. The values for Model 1 have been used as an example: 37.109/81.755= 0.454 (see Table 8).
Table 10 shows the Unstandardized Coefficients B column gives us the coefficients of the independent variables in the regression equa-tion for each model trying to predict different scenarios.
Model 1: CKMS = 2.073 +.430 TOINN4 and Model 2: CKMS = 1.930+.266 TOINN4+.201 TOINN6The Standardized Beta Coefficient column informs us of the con-
tribution that an individual variable makes to the model. The beta weight is the average amount the dependent variable increases when the independent variable increases by one standard deviation (all oth-er independent variables are held constant), as these are standardized I can compare them.
t tests are performed to test the two-tailed hypothesis that the beta value is significantly higher or lower than zero. This also enables us to see which predictors are significant. By observing the Sig. values in our research I can see that for Model 1 the TOINN4 scores are sig-nificant (p < 0.05), and so on with TOINN4 and TOINN6 in Model 2. Hence, I suggest to use Model 2 because it accounts for more of the variance. The Unstandardized Coefficients Std. Error column pro-vides an estimate of the variability of the coefficient.
Table 11 The Beta In value gives an estimate of the beta weight if it was included in the model at this time. The results of t tests for each independent variable are detailed with their probability values. From Model 1 I can see that the t value for TOINN4 is significant (p < 0.05). However as I have used the Stepwise method, this variable has been excluded from the model. As TOINN6 has been included in Model 2 it has been removed from this table. The Partial Correlation value indicates the contribution that the excluded predictor would make if I decided to include it in our model. Collinearity Statistics Tolerance values, check for any collinearity in our data. As a general rule, a tol-erance value below 0.1 indicates a serious problem (Hinton, et. al, 2004).
So far, here I answered SQ3 since Table 7 where is shown the most significant variable: Innovation Process (INPROC) had the dimen-sion: Type of Innovation (TOINN) with the most significant indicators: Makes actions to improve or introduce new forms of service (TOINN4), Innovation activities tend to be rather radical (TOINN6). Therefore,

161
Type of innovation and customer knowledge management, in Mexico
GH is explained because using Table 9, Model 2, involving TOINN4 and TOINN5 produces 49% variability on the dependent variable Cus-tomer Knowledge Management (CKM).
With all above mentioned, I can see that the Software Developer Sector in Guadalajara México does not take advantage about the Type of Innovation (TOINN) dimension offers to improve the Customer Knowledge Management (CKM). If you see Table 6, the other indica-tors are very closely amongst them, but they don’t have enough cor-relation. So, exists a great chance to the sector for planning and doing direct actions to raise the level of response to Customer Knowledge Management (CKM). For example, the rest of indicators: Makes ac-tions to innovate in technology (TOINN1); Makes actions for innova-tion in production processes (TOINN2); Makes actions to improve or introduce new products forms (TOINN3); Makes actions to improve or introduce new forms of service (TOINN4); Makes actions to improve or introduce new organizational structures and functions (TOINN5); Inno-vation activities tend to be incremental (TOINN7) can be supported by Oslo Manual (OECD, 2005) recommendations integrating the dyna-mism of the innovation organization (Afuah, 1994).
For future studies and trying to get both: more information about how to improve the Software Development Sector in Guadalajara, México, and a generalized model to implement in other sectors I con-sider the following works:
An integral study that involves the: 6 variables (A.Innovation Value Added (IVADD);B. Innovation Income Items (IIIT);C.Innovation Pro-cess (INPROC); D.Innovation Outcome Items (IOIT); E.Innovation Performance (IPERF); F.Innovation Feedback Items (IFEED)) 33 di-mensions and 77 indicators from to the Innovation Stages (INNOVS)) vs. each one of the 4 variables (G.CKM as a Driver of Innovation (CK-MADI); H.CKM Support (CKMS); I.CKM other Sources of Knowledge (CKMOSK); J.CKM, Satisfaction, Experience And Performance (CK-MSEP)) and their 12 dimensions and 34 indicators belonging to the Customer Knowledge Management (CKM). This study might be aimed to discover the underlying or latent indicators, for propose several re-lationships and hence, actions to raise the level of innovation. The sta-tistical inference method suggested: Structural Equations Modelling that propose a several linear equations and the internal relationships that might be explained by Multiple Regression Analysis.

162
Mejía-Trejo, Sánchez-Gutiérrez, González-Uribe y Vázquez-Ávila
Conclusions
I answered general question, (GQ):GQ: ¿Which is the conceptual model that relates variables, dimen-
sions and indicators from Type of Innovation (TOINN) into Innovation Stages (INNOVS) that influence the Customer Knowledge Management (CKM)? is solved when I answered, the following questions:
1. About the specific questions (SQs):SQ1: What is the scheme of the model?, solved by mean of the
relationships that are shown in Figure 1.SQ2: Which are the variables, dimensions and indicators?, solved
by mean of the authors analysis and their works that are shown by the Tables: 1, 2 and 3.
In summary:- Innovation Stages (INNOVS) model, described with 6 variables:
A. Innovation Value Added (IVADD)B. Innovation Income Items (IIIT);C. Innovation Process (INPROC); D. Innovation Outcome Items (IOIT); E. Innovation Performance (IPERF); F. Innovation Feedback Items (IFEED);
With 33 dimensions and 77 indicators. Type of Innovation (TOINN) is a dimension (19) with 7 Indica-
tors (47-53) inside the variable Innovation Process (B) (INPROC). See Table 2.
- Customer Knowledge Management (CKM), described with 4 varia-bles:G. CKM as a Driver of Innovation (CKMADI); H. CKM Support (CKMS); I. CKM other Sources of Knowledge (CKMOSK); J. CKM, Satisfaction, Experience And Performance (CKMSEP);With 12 dimensions and 34 indicators.
SQ3: Which are variables and indicators of Type of Innovation (TOINN) more significant into the model?, solved applying Multiple Regres-

163
Type of innovation and customer knowledge management, in Mexico
sion Analysis between the dependent variable Customer Knowledge Customer (CKM), and the independent variable Type of Innovation (TOINN), discovering their indicators: Makes actions to improve or introduce new forms of service (TOINN4) and Innovation activities tend to be rather radical (TOINN6) as the most relevant indicators into Type of Innovation (TOINN) over Customer Knowledge Customer (CKM).
2. Two models that might be explain and predict the behavior of Cus-tomer Knowledge Customer (CKM), by mean of the indicators: Makes actions to improve or introduce new forms of service (TOINN4) and Innovation activities tend to be rather radical (TOINN6):
Model 1: CKMS = 2.073 +.430 TOINN4 and Model 2: CKMS = 1.930+.266 TOINN4+.201 TOINN6
3. About the general hypothesis proposed (GH):GH: The most important indicators of Type of Innovation (TOINN) produce, more than the 40% of the Customer Knowledge Management (CKM) variability in the Software Development Sector firms in Gua-dalajara, México. I found that Makes actions to improve or introduce new forms of service (TOINN4), Innovation activities tend to be rather radical (TOINN6) produce 49% (see Table 4) of the Customer Knowl-edge Management (CKM). Therefore, the GH is accepted.
Trying to get both: more useful information from the Software Developer Sector in Guadalajara México and a generalized model able to predict and explain the relationship between Innovation Stages (INNOVS) and Customer Knowledge Management (CKM), I proposed an integral study, where are related all the 110 indicators, from both: Innovation Stages (INNOVS) and Customer Knowledge Management (CKM), through the use of Structural Equations Modelling. The aim, is to discover additionally, the underlying or latent indicators that points out to raise the level of innovation and customer knowledge and achieve new competitive advantages to the sector.

164
Mejía-Trejo, Sánchez-Gutiérrez, González-Uribe y Vázquez-Ávila
References
Afuah, A. (1997). La Dinámica de la Innovación Organizacional. El Nuevo Concepto para Lograr Ventajas Competitivas y Rentabilidad. México: Oxford University Press.
Baker, M. & Hart, S. (2007). Product Strategy and Management. USA: Pearson.Bermúdez-García, J. (2010). Cómo Medir la Innovación en las Organizaciones.
España:Escuela de Postgrado de la UPC. Cuadernos de Investigación EPG.
Bonel, J. I., Bonel, F. J. y Fontaneda, I. (2003). Aplicación del nuevo modelo estratégico de Creación de valor al análisis del éxito Empresarial del e-business. Proceedings V Congreso de Ingeniería de Organización. España. 11.
Canibano, L., García-Ayuso, L., Sánchez, P. & Olea, M. (9-11, Jun,1999). Measuring Intangibles to Undersatand and Improve Innovation Management.Preliminary Results. Paper presentado en la OECD International Symposium. Measuring and Reporting Intellectual Capital: Experience, Issues, and Prospects. 9-11 June, 1999. Amsterdam: OECD.
Chaudhuri, A. (2006). Emotion and Reason in Consumer Behavior. Burlington, MA. USA: Butterworth-Heinemann (is an imprint of Elsevier).
Chesbrough, H. W., Vanhaverbeke, W. & West, J. (2006). Open Innovation. Researching a New Paradigm. Oxford: Oxford University Press.
Desouza, K., Awazu, Y., Jha, S., Dombrowski, C., Papagari, S. & Baloh, P. (3-Mar- 2007). Customer-Driven Innovation, de http://faculty.mu.edu.sa/public/uploads/1357394142.956332024697.pdf Accesado el 3 Mar 2014
DRAE 2014. Diccionario de la Real Academia del a Lengua Española de http://www.rae.es/. Accesado el 2- Feb-2014.
Dussauge, P. H. & Ramantsoa, B. (1992). Strategíc Technology Management. Chichester: John Wiley.
Gale, B. & Wood, C. R. (1994). Managing Customer Value.Creating Quality and Service That Customer can see. New York: Free Press.
Garcia-Murillo, M. & Annabi, H. (2002). Customer Knowledge Management. Journal of the Operational Research Society, 53(8), 875-884.
Gebert, H., Geib, M., Kolbe, L. & Riempp, G. (2013). Towards Customer Knowledge Management: Integrating Customer Relationship Management and Knowledge Management Concepts. Institute of Information Management. University of St. Gallen.St. Gallen, Switzerland, de: file:///C:/Users/jmt/Desktop/Towards_customer_knowl-edge_management.pdf Accesado el 3-Mar-2014

165
Type of innovation and customer knowledge management, in Mexico
Gibbert, M. L. & Probst, G. (2002). Five Styles of Customer Knowledge Management, and How Smart Companies Use Them To Create Value. European Management Journal, 20(5): 459 - 469.
Gloet, M. & Samson, D. (2013). Knowledge Management to Support Systematic Innovation Capability. Proceedings 46th Hawaii International Conference on System Sciences 2013. International Conference on System Sciences.Hawaii, USA: 3685-3694
Hill, C. W. y Jones, G. R. (2011). Administración Estratégica un Enfoque Integral. (9a. ed.). México: CENGAGE Learning.
Hinton, P., Brownlow, C., McMurray, I. & Cozens, B. (2004). SPSS Explained. New,Tork, USA: Routledge Taylor & Francis Group.
Howells, J. (2000). The Nature of Innovation in Services. October, 2013, OCDE Innovation and productivity in Services Workshop, Australia.
INEGI. (2014). Portal Web INEGI de Subportal Ciencia y Tecnología;Innovación, Investigación y uso de TICs (Sector Privado). Establecimientos Grandes, de http://www.inegi.org.mx/Sistemas/temasV2/Default.aspx?s=est&c=190. Accesado el 6- Ene-2014.
INSEAD. (2013). The Global Innovation Index 2013.The Local Dynamics of Innovation. Geneve: INSEAD.
Kausch, C., Gassmanna, O. & Enkel, E. (2012). Integrating Customer Knowledge in the Early Innovation Phase, de http://citeseerx.ist.psu.edu/viewdoc/download?doi=10.1.1.380.2564&rep=rep1&type=pdf Accesado 4-Jul-2014.
Laudon, K. & Laudon, J. (2012). Management Information Systems. Managing the Digital Firm. USA: Prentice Hall.
Lev, B. (2001). Intangibles: Management, Measurments and Reports. Washington, D.C.: Brookings Institution Press.
McKinsey. (2008). McKinsey Global Survey Results: Assessing Innovation Metrics, de http://innovbfa.viabloga.com/files/McKinseyQuaterly___as-sessing_innovation_metrics___oct_2088.pdf. Accesado 3-Ene-2014.
Mejía-Trejo, J. & Sánchez-Gutiérrez, J. (2013a). Patente nº MX/a/2013/011807. México.
Mejía-Trejo, J., Sánchez-Gutiérrez, J. & Ortiz-Barrera, M. (2013b). Leadership and Value Creation on Innovation: The Case of Software Developer Sector in Guadalajara, de http://papers.ssrn.com/sol3/papers.cfm?abstract_id=2390787. Accesado 3-Mar-2014.
Mejía-Trejo, J. (2014). Mercadotecnia e Innovación en el Desarrollo de Nuevos Productos y Servicios, de http://www.amazon.com.mx/MERCADOTECNIA-INNOVACI%C3%93N-DESARROLLO-P R O D U C T O S - S E RV I C I O S - e b o o k / d p / B 0 0 I N E 3 R M I /

166
Mejía-Trejo, Sánchez-Gutiérrez, González-Uribe y Vázquez-Ávila
ref=sr_1_2?s=digital-text&ie=UTF8&qid=1405055350&sr=1-2&keywords=MEJIA+TREJO. Accesado 30-Ene-2014.
Nambisan, S. (2002). Designing Virtual Customer Environments for New Product Development: Toward a Theory. Academy of Management Review, 27(3): 392-413.
Nicolai, J., Keld, L. & Pedersen, T. (2011). Linking Customer Interaction and Innovation:The Mediating Role of New Organizational Practices. Organization Science, 22(4): 980-999.
OECD. (2003). Knowlegde Management. Measuring Knowledge Management in the Business Sector. Paris: Organisation for Economic Co-operation and Development. (OECD).
OECD. (2005). Guidelines for Collecting and Interpreting Innovation Data. París: Organisation for Economic Co-operation and Development. (OECD).
Osterwalder, A. & Pygneur, Y. (2010). Business Model Generation. Hoboken, New Jersey, USA: John Wiley & Sons, Inc.
Porter, M. E. (2005). Ventaja Competitiva. Creación y Sostenimiento de un Desempeño Superior. México: Compañía Editorial Continental, S. A.
Popadiuk, S. & Wei-Choo, C. (2006). Innovation and knowledge creation:How are these concepts related?. International Journal of Information Management, (26), 302-312.
Rogers, E. (1983). Diffusion of Innovations, de http://www.valuebased-management.net/methods_rogers_innovation_adoption_curve.html. Accesado 20-Ene-2014.
Rothwell, R. (1994). Towards the fifth generation innovation pocess. International Marketing Review, 11(1), 7-31.
Shipp, S. S. (2008). Measuring Innovation and Intangibles: A Business Perspective. IDA Document D-3704. USA: Institute for Defense Analyses Science & Technology Policy Institute.
Smith, L. & Leydesdorff, L. (2010). The Triple Helix in the context of global change: dynamics and challenges, de http://www.leydesdorff.net/th11/th11.pdf. Accesado 20-Feb-2014.
White, M., & Bruton, G. (2011). The Management of Technology and Innovation. Mason,OH: Outh-Western CENGAGE Learning.
WEF. (2014). The Global Competitiveness Report 2013-2014. Geneve: World Economic Forum.(WEF).

167
Collaboration Impact on Financial Results and Cost
Reduction in Mexican SMES
Gabriela Citlalli López-Torres1
Gonzalo Maldonado-GuzmánSandra Yesenia Pinzón Castro
Ricardo García Ramírez
AbstractIn the current competitive market with highly demanding clients, collabora-tion is considered a fundamental strategy in business in order to achieve the necessary competitiveness and growth. However, existing research and academics have not focused on a cohesive relationship among collabora-tion, financial results and costs reduction. The objective of this research is to measure the impact of such collaboration onto financial results and costs reduction in SMEs, specifically in enterprises operating in Aguascalientes, México. The results obtained demonstrated a positive and significant rela-tionship between collaboration and financial results and costs reductions in organizations, which have important implications on decision-making in business.Keywords: Collaboration, financial results, costs reduction, SMEs
1. Universidad Autónoma de Aguascalientes, Centro de Ciencias Económicas y Administrativas

168
López-Torres, Maldonado-Guzmán, Pinzón-Castro y García-Ramírez
Introduction
Recent studies have shown collaboration as key element to busi-ness success, essentially in Small and Medium Enterprises (SMEs), because, among other reasons, it boosts the organization learning process (Nonaka, Toyama & Byosiere, 2003) and reduces barriers for growth (Mesquita & Lazzarini, 2008). Additionally, it has been demonstrated that collaboration allows complex coordination among the various actors in organizations, such as, IT engineers, designers, CEOs and external actors. Besides, collaboration is a crucial indicator in Research and Development (R&D) activities that foster business competitiveness (Carayannis & Grigoroudis, 2014; Ulengin, Onsel, Aktas, Kabak, & Ozaydin, 2014).
At the same time, few studies have focused on the impact for col-laboration on financial results and costs reduction in SMEs, which are fundamental indicators in business, especially for SMEs growth. For instance, the majority of collaboration activities, such as, organi-zations alliances are recognized by its only focus on production pro-cesses, R&D and serves (Soda, 2011) but not on its financial results and costs reductions. In fact, such is its lack of attention on these el-ements, that there are evidence of an imbalance between costs and benefits from such collaborative projects (Austin, Smart, Yearley, Ir-vine & White, 2010), which impedes effective collaboration practices; this along with evidence about costly impacts from such business mal-practices (Zhao, 2011).
As consequence, there is a need to carry out an empirical study on the collaboration impact on financial results and costs reductions in businesses. Therefore, the next section presents the principal con-tributions from this research. Firstly, a measurement of the collab-oration impact on financial results, especially in SMEs operating in Aguascalientes, México. Secondly, a measurement of the collabora-tion impact on costs reduction, in the same organizations.
Literature review
In the current literature regarding collaboration in business, it has been defined that costs reduction can be achieved through suppliers

169
Collaboration Impact on Financial Results and Cost Reduction in Mexican SMES
integration (Suntichai, Eldridge & Freeman, 2012) and through col-laboration expanding (Proenca, Rosko & Dismuke, 2005). Besides that, business performance is improved by internal collaborations (Stank, Keller & Daughtery, 2001). Moreover, according to Kahn, Maltz and Mentzer (2006) collaboration practices supports costs reduction. Whereas, Mesquita and Lazzarini (2008) have described the collective use of resources and innovation in products as key factors to reduce costs. In fact, in companies (co-entities) that perform collaboration activities its resources investments are dependant on its collaboration and response capacity (Fang, Palmatier, Scheer & Li, 2008).
According to Marquez, Bianchi and Gupta (2004), based on a collaboration perspective, operations integration and decision-making are fundamental elements in organizations. Therefore, better benefits to business as better collaborative decisions, for example, forecasts. On the other hand, Kim and Netessine (2013) have defined a practice named ‘expected marginal compromise’ (EMC) that integrates collab-orative practices directed to costs reduction. Therefore, in order to a collaborative work be effective it has to provide major benefits than its costs (Hembürger & Dietrich, 2012). Kim and Lee (2010) identify an important impact from the use of collaboration systems, which promote a response capacity in supply chains, to international market sales.
In this sense, the collaboration impact on the financial perfor-mance and costs can achieved through internal and external collabo-ration in the company. In regards to internal collaboration, generally this is through teamwork developed by workers and employers in or-ganizations in different function and activities carried out internally in organizations. In a way that daily activities are more effective and efficient (Piriyakul & Kerdpitak, 2011). In consequence, employees and workers from the different departments or functional areas in the business have to carry out activities in conjunction with other areas; independent of the disciplines they have, thriving to find solutions to the business problems (Wang, 2002).
Likewise, diverse researchers, academics and professionals from the economical sciences, have considered that organizations, especial-ly SMEs, with collaboration initiatives among their departments not only have major positive effects on its financial results and costs but also have an important contribution to their overall business success (Piriyakul & Kerdpitak, 2011). Similarly, in the literature on supply

170
López-Torres, Maldonado-Guzmán, Pinzón-Castro y García-Ramírez
chain management, the conclusion is that both internal and external collaboration are both essential activities to make efficient business processes and to achieve high competitiveness.
This way, an effective collaboration is that which tightly relate ac-tivities among manufacturers, suppliers, distributors and clients hav-ing the same common goal of adding value not only to products and services but to all supply chain participants, especially to satisfy poten-tial customers’ needs (Piriyakul & Kerdpitak, 2011). Consequently, internal collaboration is crucial to produce better goods and services adapted to preferences and needs of final consumers; which allow not only better financial results in business but also to generate new goods and services through external collaboration with other organizations (Lambert et al., 1998; Gimenez & Ventura, 2005).
In relation to external collaboration, a great deal of organiza-tions are implementing this type of activities trying to use all avail-able information in market and common domain, in a way that with this information business can perform collaboration activities with other organizations. So they can share risks, access to new markets and technologies, significantly improve directors and workers’ skills, share knowledge, improve research and development of new products and services, reduce production time of new products and services and increase financial performance for all entities participating in the collaboration process (Lassen, Laugen & Middel, 2008).
Besides, financial and economical results in organizations highly depend on external collaboration, overall when it is tightly related to suppliers (Quinn, 1998; Handfield & Nicholls, 1999; Gimenez & Ventura, 2005), because actually suppliers help to solve internal prob-lems in organizations; in consequence, a more effective and efficient business. Therefore, all external collaboration initiatives that are im-plemented in organizations can generate formal and informal work teams, share information about market and competitors that every organization has, significantly improve logistic process and mutually support problem solving. This is because external collaboration not only generates better financial results but also increase competitive-ness levels from companies participating such external collaboration (Piriyakul & Kerdpitak, 2011).
At the same time, several researchers, academics and profession-als in management sciences have consider that collaboration activi-

171
Collaboration Impact on Financial Results and Cost Reduction in Mexican SMES
ties carried out by organizations (external collaboration), generate more benefits than conflicts because organizations focus on building long-term relationships and mutual support for problem solving ob-tain a more efficient business (Piriyakul & Kerdpitak, 2011). Thus, organizations that implement in a constant fashion external collabo-ration activities generally achieve better raw materials’ management for production, mainly because suppliers constantly support the selec-tion of best raw materials to better meet customer’s needs in products (Fisher, 1997).
An example of external collaboration can be seen in foods in-dustry in United States, where Organizations constantly follow col-laboration practices with suppliers and other organizations produc-ing similar products. External collaboration allows them to achieve better financial results and reduce costs in logistics and distribution processes. Also, to significantly improve raw materials quality, and to achieve short delivery times, and to establish long-term relationships, and their suppliers and customers help them to solve problems in in-novation in products and services, and to generate various competi-tive advantages in relation to competitors (Kim, Cavasgil & Calan-tone, 2006).
In this sense, one of the major advantages from external collabo-ration in businesses participating in this type of activities, is mainly a more efficient and effective planning that makes easier production planning and work team among CEOs, employers and workers, which as a result promotes better financial and economical performance in the organization (Paulraj & Chen, 2007). Similarly, in recent research related to management sciences, external collaboration is considered a strong factor influencing competitiveness levels in participants col-laborating, and its levels of performance in marketing and logistic ar-eas (Fawcet et al., 2005; Gimenez & Ventura, 2005; Green, Whitten & Inmas, 2008).
For these reasons, and considering the literature review present-ed, it is possible to postulate a relationship between collaboration, costs reduction and financial results in organizations.H1: The better implementation of collaboration activities, the better
financial results H2: The better application of collaboration activities, the better costs
reduction

172
López-Torres, Maldonado-Guzmán, Pinzón-Castro y García-Ramírez
Figure 1 Theoretical Model
Research methodology
An empirical research was carried out in SMEs, operating in Aguas-calientes, México, to corroborate the established hypotheses. For this, the Mexican Enterprises System (SIEM from its acronym in Spanish) was accessed as a theoretical framework. The variables used in this research are collaboration, financial results and costs reduction and these are defined by one-dimensional scales. Variables were measure by a 5 points Likert scale, where 1 = completely disagree and 5 = completely agree. The collaboration variable was measure by fifteen items scale and it was adapted from Heide and John (1990), Zaheer et al. (1998) and Corsten and Felde (2005). The financial result variable was measured by a six-items scale adapted from Dröge and Germain (2000), and Gilley and Rasheed (2000). Finally, the costs reduction variable was measured by a six items scale, adapted from Cannon y Homburg (2001).
To evaluate scale’s reliability and validity a Confirmatory Factor Analysis (CFA) was carried out by using the Maximum Likelihood Method in the EQS 6.1 software (Bentler, 2005; Brown, 2006; Byrne, 2006). Additionally, the three scales used were evaluated by the Cron-bach’s Alpha coefficient and the Composite Reliability Index (CRI) (Bagozzi & Yi, 1988). Each of the values from the scale fit the rec-ommended levels, Cronbach’s Alpha greater than 0.7, and the CRI provided evidence of sufficient reliability and justifies internal reli-ability of the three scales used (Nunnally & Bernstein, 1994; Hair et al., 1995).

173
Collaboration Impact on Financial Results and Cost Reduction in Mexican SMES
Table 1 shows that all values from Cronbach’s Alpha and Com-posed Reliability Index (CRI) are higher than recommended 0.7, which provide evidence of reliability from used scales (Nunnally & Bernstein, 1994; Hair et al., 1995). In addition, it suggests that the theoretical model of collaboration offers well-adjusted data (S-BX2 = 431.631; df = 149; p = 0.000; NFI = 0.891; NNFI = 0.914; CFI = 0.925; RMSEA = 0.075). Besides, all items from the variables are sig-nificant (p < 0.01), and the factor loads are greater than 0.6 (Bagozzi & Yi, 1988) and the Extracted Variance Index (EVI) for each pair of constructs related are greater than 0.5 (Fornell & Larcker, 1981).
Table 1 Theoretical Model’s Internal Consistency and Convergent Validity
Variable Indicator Factor Load
Robust T- Value
Cronbach’sAlpha
CFI EVI
Collaboration CO4 0.713*** 1.000a 0.927 0.926 0.583CO6 0.723*** 15.288CO7 0.796*** 16.494CO8 0.801*** 15.255CO9 0.818*** 15.767CO11 0.806*** 14.120CO12 0.799*** 14.950CO13 0.649*** 11.690CO14 0.769*** 14.646
Financial Results
FP1 0.743*** 1.000a 0.930 0.930 0.727FP3 0.887*** 20.845FP4 0.892*** 20.411FP5 0.877*** 18.664FP6 0.854*** 18.145
Costs Reduction
CR2 0.694*** 1.000a 0.906 0.900 0.646CR3 0.869*** 11.832CR4 0.874*** 11.563CR5 0.824*** 11.618CR6 0.741*** 10.616
S-BX2 (df = 149) = 431.631 p < 0.000; NFI = 0.891; NNFI = 0.914; CFI = 0.925; RMSEA = 0.075
a = Parameters constrained to that value in the identification process*** = p < 0.01

174
López-Torres, Maldonado-Guzmán, Pinzón-Castro y García-Ramírez
Discriminant validity is shown in table 2 by two tests. First, with an interval of confidence, 95%, none of the individual elements from factors posses vale 1.0 (Anderson & Gerbing, 1988). Secondly, the extracted variance index between each pair of constructs from the theoretical model is greater than their corresponding EVI (Fornell & Larcker, 1981). Hence, it is possible to define from this research that there is sufficient evidence of reliability and convergent and discrimi-nant validity.
Table 2Discriminant Validity from the Theoretical Model
Variables Collaboration Financial Results Costs ReductionCollaboration 0.583 0.024 0.016Financial Results 0.060 – 0.248 0.727 0.046Costs Reduction 0.040 – 0.216 0.126 – 0.302 0.646
The diagonal represents the Extracted Variance Index (EVI) whereas above diagonal the variance. Below diagonal, the estimation of factors’ correlation with a confidence interval of 95%
Results
In this research a Structural Equations Model (SEM) was employed in the EQS 6.1 software (Bentler, 2005; Brown, 2006; Byrne, 2006) using the Maximum Likelihood Method, in order to test the research hypotheses and the structure of the theoretical model that includes collaboration, financial results and costs reduction in SMES, in Aguas-calientes, México. Nomo logical validity of the theoretical model was analysed through the Chi squared test, in which the theoretical model was compared with the model measurement, no significant statistical differences were found among models (Anderson & Gerbing, 1988; Hatcher, 1994).

175
Collaboration Impact on Financial Results and Cost Reduction in Mexican SMES
Table 3 Results from the Structural Equations Model
Hypothesis Structural Equation Standardized Coefficient
Robust T-Value
H1: The better application of collaboration activities, the better financial results
Collaboration → Financial Results
0.222*** 3.628
H2: The better application of collaboration, the better costs reduction
Collaboration → Costs Reduction
0.218*** 3.000
S-BX2 (df = 149) = 431.634; p < 0.000; NFI = 0.891; NNFI = 0.914; CFI = 0.925; RMSEA = 0.075
*** = P < 0.01
The results obtained from this research are shown in Table 3. In relation to the first hypothesis, H1, the results obtained (β = 0.222, p < 0.01) indicate that collaboration activities have positive effects to financial results. In terms of second hypothesis, H2, the results (β = 0.218, p < 0.01), indicate that collaboration activities have significant positive impacts on costs reduction. In summary, the results demon-strate that collaboration activities have positive effects on financial results and costs reduction in SMEs, operating in Aguascalientes, México. This allows concluding that collaboration activities are ben-eficial to reduce costs and improve financial results.
Conclusions
Considering the achieved results, it is possible to provide two main conclusions. First, collaboration activities both internal and external allow companies to participate to obtain better financial results and a significant costs reduction; which can generate not only a major level of competitiveness. In consequence, organizations that adopt and implement collaboration activities can produce better performance results and success than those that work alone. Second, collabora-tion activities generate greater benefits than disadvantages for those organizations that apply them, because it is through collaboration can align its objectives with those of its suppliers, distributors and clients.

176
López-Torres, Maldonado-Guzmán, Pinzón-Castro y García-Ramírez
This allows increasing, making efficient use of economic, and human resources to develop new products and services. Moreover, collabo-ration practices enhance adding value and better financial results to all organizations that participate in the supply chain. This is because every organization in the supply chain can share market and custom-ers information in relation to products and services offered to specific customers and by suppliers.
At the same time, the results obtained have a number of implica-tions for both SMEs managers and whole organization. Firstly, manag-ers have to create an internal working environment for employers and workers in the organization. This is because in order implement inter-nal collaboration activities it is required all personnel in the company perform under a same common objective, look for the same goals, where team work, interchange of experiences and skills, are possible with co-workers and among other functional areas of the company.
Second, organizations that aim greater levels of financial perfor-mance and costs reduction should carry out collaboration activities with other organizations from the same sector, or their suppliers, dis-tributor and clients (external collaboration). On the contrary, it would be difficult that organization alone can achieve higher levels of finan-cial performance and costs reduction. Thus, organizations should at-tend the several support programs such as enterprises chambers and the various governmental institutions in order to enhance collabora-tion activities among other companies, private and public. This way it is possible to share risks, information, human and financial resources, useful to adapt their products and services that meet customers needs.
The main limitations of this research are the following. First, in regard to the scales used to measure collaboration, financial results and costs reduction, because they were measured by uni-dimension, which perhaps in future would be necessary to incorporate scales with factors and dimensions that allow to corroborate the obtained results in this empirical studies. The second limitation is data collection, be-cause only were used qualitative variables that measure collabora-tion, financial results and costs reduction. Therefore, future research would be to use quantitative variables to corroborate if same results are obtained.
A third limitation of this research is that surveys were applied to managers or owners only, from SMEs in Aguascalientes, México. In

177
Collaboration Impact on Financial Results and Cost Reduction in Mexican SMES
consequence, the present results can be different if a different sam-ple is used. It would be necessary to apply this survey with suppliers; distributors and customers in order to test the same results can be achieved. A fourth limitation is the size of the organizations surveyed; it was only from five to 250 workers. Thus, in future research orga-nization with less than five workers would be considered, in order to corroborate the presented results. Finally, another limitation is that the majority of SMEs considered that the information requested was confidential, so data here provided might not express full reality from organizations.
References
Anderson, J. & Gerbing, D. (1988). Structural equation modelling in prac-tice: A review and recommended two-step approach. Psychological Bulletin, 13, 411-423.
Austin, Z., Smart, J. C. R., Yearley, S., Irvine, R. J. & White, P. C. L. (2010). Identifying conflicts and opportunities for collaboration in the man-agement of a wildlife resource: a mixed-methods approach. Wildlife Research, 37(8), 647-657.
Bagozzi, R. P. & Yi, Y. (1988). On the evaluation of structural equation mod-els. Journal of the Academy of Marketing Science, 16(1), 74-94.
Bentler, P. M. (2005). EQS 6 structural equations program manual. Encino, CA: Multivariate Software.
Brown, T. (2006). Confirmatory factor analysis for applied research. New York, NY: The Guilford Press.
Byrne, B. (2006). Structural equation modelling with EQS, basic concepts, ap-plications, and programming. 2th ed., London: LEA Publishers.
Cannon, J. P. & Homburg, C. (2001). Buyer-supplier relationships and cus-tomer firm costs. Journal of Marketing, 65(January), 29-43.
Carayannis, E. & Grigoroudis, E. (2014). Linking innovation, productivity, and competitiveness: implications for policy and practice. Journal of Technology Transfer, 39(2), 199-218.
Corsten, D. & Felde, J. (2005). Exploring the performance effects of key-supplier collaboration. International Journal of Physical Distribution & Logistics Management, 35(6), 445-461.
Dröge, C. & Germain, R. (2000). The relationship of electronic data inter-change with inventory and financial performance. Journal of Business Logistics, 21(2), 209-230.

178
López-Torres, Maldonado-Guzmán, Pinzón-Castro y García-Ramírez
Fang, E. E., Palmatier, R. W., Scheer, L. K. & Li, N. (2008). Trust at different organizational levels. Journal of Marketing, 72(80-98).
Fawcett, S. E., Osterhaus, P., Magnan, G. M., Brau, J. C. & McCarter, M. W. (2005). Information sharing and supply chain performance: The role of connectivity and willingness. Supply Chain Management: An International Journal, 12(5), 358-368.
Fisher, L. M. (1997). What is the right supply chain for your product. Harvard Business Review, March-April, 11-18.
Fornell, C. & Larcker, D. (1981). Evaluating structural equation models with unobservable variables and measurement error. Journal of Marketing Research, 18, 39-50.
Gilley, K. M. & Rasheed, A. (2000). Making more by doing less: An analysis of outsourcing and its effects on firm performance. Journal of Management, 26(4), 763-790.
Gimenez, C. & Ventura, E. (2005). Logistics-production, logistics-marketing and external integration. International Journal of Operation & Production Management, 25(1), 20-38.
Green, K. W., Whitten, D. W. & Inman, R. A. (2008). The impact of logis-tics performance on organizational performance in supply chain context. Supply Chain Management: An International Journal, 13(4), 317-327.
Hair, J. F., Anderson, R. E., Tatham, R. L. & Black, W. C. (1995). Multivariate data analysis with readings. New York, NY: Prentice-Hall.
Handfield, R. B. & Nichols, E. L. (1999). Introduction to Supply Chain Management. New York, NY: Prentice-Hall.
Hatcher, L. (1994). A step-by-step approach to using the SAS system for factor analysis and structural equation modelling. Cary, NC: SAS Institute Inc.
Heide, J. B. & John, G. (1990). Alliances in industrial purchasing: The de-terminants of joint action in buyer-supplier relationships. Journal of Marketing Research, 27(1), 24-36.
Hembürger, M. & Dietrich, P. (2012). Identifying the basis of collaboration performance in facility service business. Emerald Publishing, 30(11/12), 504-516.
Kahn, K. B., Maltz, E. N. & Mentzer, J. T. (2006). Demand Collaboration: Effects on Knowledge Creation, Relationships, and Supply Chain Performance. Journal of Business Logistics, 27(2), 573-580.
Kim, D. & Lee, R. P. (2010). Systems Collaboration and Strategic Collaboration: Their Impacts on Supply Chain Responsiveness and Market Performance. Decision Sciences, 41(4), 955-981.
Kim, D., Cavasgil, S. T. & Calantone, R. J. (2006). Information system in-novation and supply chain management: Channel relationship and firm

179
Collaboration Impact on Financial Results and Cost Reduction in Mexican SMES
performance. Journal of the Economy of Marketing Science, 34(1), 409-454.
Kim, S. H. & Netessine, S. (2013). Collaborative cost reduction and compo-nent procurement under information asymmetry. Management Science, 59(1), 189-206.
Lambert, D. M., Cooper, M. C. & Pagh, J. D. (1998). Supply chain manage-ment: Implementation issues and research opportunities. International Journal of Logistics Management, 9(2), 1-19.
Lassen, A. H., Laugen, B. & Middel, R. (2008). Collaborative Entrepreneurship: On the Influence of Internal and External Collaboration on Corporate Entrepreneurial Innovation. Denmark: Aalborg University.
Marquez, A. C., Bianchi, C. & Gupta, J. N. D. (2004). Operational and fi-nancial effectiveness of e-collaboration tools in supply chain integration. European Journal of Operational Research, 159(2 Special Issue), 348-363.
Mesquita, L. F. & Lazzarini, S. G. (2008). Horizontal and vertical relation-ships in developing economies: Implications for SMEs access to global markets. Academy of Management, 51(2), 359-380.
Nonaka, I., Toyama, R. & Byosiere, P. (2003). A Theory of Organizational Knowledge Creation: Understanding the Dynamic Process of Creating Knowledge Handbook of Organizational Learning and Knowledge. New York: Oxford University Press.
Nunnally, J. C. & Bernstein, I. H. (1994). Psychometric Theory. 3ª ed. New York: McGraw-Hill.
Paulraj, A. & Chen, I. J. (2007). Strategic buyer-supplier relationship, in-formation technology and external logistics integration. The Journal of Supply Chain Management, 43(2), 2-14.
Piriyakul, M. & Kerdpitak, C. (2011). Mediation effects of logistics perfor-mance on collaboration and firm performance: PLS path modelling. Journal of Management and Sustainability, 1(1), 90-98.
Proenca, E. J., Rosko, M. D. & Dismuke, C. E. (2005). Service collaboration and hospital cost performance - direct and moderating effects. Medical Care, 43(12), 1250-1258.
Quinn, F. J. (1998). Building a world-class supply chain, logistics on-line. (Online) Available: http//www.manufacturing.net/magazine/ar-chives/1998/scmr/05brave.html
Soda, G. (2011). The management of firms’ alliance network positioning: Implications for innovation. European Management Journal, 29(5), 377-388.
Stank, T. P., Keller, S. B. & Daughtery, P. J. (2001). Supply chain collabo-ration and logistical service performance. Journal of Business Logistics, 22(1), 29-47.

180
López-Torres, Maldonado-Guzmán, Pinzón-Castro y García-Ramírez
Suntichai, K., Eldridge, S. & Freeman, J. (2012). The relationship between internal and supplier integration: Effects on product quality, cost effi-ciency and market performance. 21st Annual IPSERA Conference 01 - 04 April 2012. Naples, Italy.
Ulengin, F., Onsel, S., Aktas, E., Kabak, O. & Ozaydin, O. (2014). A deci-sion support methodology to enhance the competitiveness of the Turkish automotive industry. European Journal of Operational Research, 234(3), 789-801.
Wang, E. A. (2002). RX for pharmaceutical company: Internal collaboration is the key to improve innovation. Internal Collaboration. IBM Institute for Business Value.
Zaheer, A., McEvily, B. & Perrone, V. (1998). Does trust matter? Exploring the effects of interorganizational and interpersonal trust on perfor-mance. Organization Science, 9(2), 141-159.
Zhao, B. (2011). Learning from errors: The role of context, emotion, and personality. Organizational Behavior, 32, 435–463.

181
Creative industries innovation using Galois group theory
Víctor G. Alfaro-García1
Anna M. Gil-Lafuente1
Gerardo G. Alfaro-Calderón2
AbstractTo address creative industries’ challenges with an innovative Fuzzy Logic approach. A robust methodological structure using Galois Group Theory and an intuitive application for decision making under uncertain condi-tions is proposed. Results conclude that products with different character-istics, properties and peculiarities can be grouped with a high confidence level through an intuitive fuzzy methodological approach. The present study pretends to shed light in grouping methodologies, attending challenges in which traditional grouping methods, which are mainly driven by trial and error efforts have not succeed before. The methodology is applied in order to group a specific city’s tourism products; the attempt is to achieve an ef-fective decision making process. The originality of the study relies on the capacity and flexibility of the model to analyze different characteristics of diverse products under subjective and uncertain conditions and the imple-mentation of solid theories from a fuzzy logic standpoint.Keywords: Uncertainty, Fuzzy logic, Group, Fuzzy Sets.
1. *University of Barcelona. Department of Business Administration.2. Universidad Michoacana de San Nicolás de Hidalgo. Faculty of Accounting and
Management Sciences.

182
Alfaro-García, Gil-Lafuente y Alfaro-Calderón
Introduction
Creative Cities Supporting Creative Industries
The concept of the Creative Cities was initially introduced in the earli-est 1990’s, by the author Charles Landry. His initial concept appeared from the need of an urban, economic, social and cultural transfor-mation, which had to direct the roll that the cities could play around the dramatic changes that appeared in the new global environment. The cities therefore had to be transformed in wealth creation hubs (Landry, 2000) under the new global dynamics that were developing.
Florida (2012) describes the concept of a new social class defined as the “Creative Class”, individuals whose talent and potential trans-formed the way goods and services were produced, employments and enterprises were created, and in general terms; wealth is created. The original idea resulted from the analysis of elements that detonated regional development; a key aspect is the retention and attraction of enterprises which main actions include the input of human talent to their companies. In practical terms the creative class detonates the appearance of enterprises, which by their activities generate wealth in the region.
The origin of the “creative city” can be approached and under-stood by these two key concepts and their authors. Although in words of Landry we find an intrinsically more strategic approach to be ap-plied by the city planners, and in words of Florida we find a more economic and social component in which the triggering factor for re-gional success is the human talent (Florida 2012), in the association and combination of their concepts we can establish common variables that in terms of this study, will be considered to develop the thesis and value added proposals.
A wide range of definitions of “creative industries” have been de-veloped in recent years; it appears to be evolving as our understand-ing on the positive impacts that these kinds of industries bring to the economy. As a first approach to the evolution of the definition Hall (2000) points out, all the transitions starting from the manufacturing economy, to the information economy up to the new cultural economy (where the concept of cultural industry is born) led the path to an economic restructure and regeneration. In the present paper we will

183
Creative industries innovation using Galois group theory
follow the definition of the UNCTAD (2010), which establishes: “any economic activity producing symbolic products with a heavy reliance on intellectual property and for as wide a market as possible”. The same institution catalogued the creative industries in 4 major catego-ries: Heritage: identified as the origin of all forms of arts and the soul of cultural and creative industries. It brings together cultural aspects from the historical, anthropological, ethnic, aesthetic and societal viewpoints, influences creativity and is the origin of a number of heri-tage goods and services as well as cultural activities. Arts: This group includes creative industries based purely on art and culture. Artwork is inspired by heritage, identity values and symbolic meaning. Media: This group covers two subgroups of media that produce creative con-tent with the purpose of communicating with large audiences (“new media” is classified separately). Functional creations: This group com-prises more demand-driven and services-oriented industries creating goods and services with functional purposes.
Creative cities must open opportunities in diverse areas for the creation and development of creative industries. Creative Metropo-les (2010) propose one key study in the development of strategies to-wards the enhancement of creative industries. This study is financed by the European Union and it establishes the relations and results that different cities in the EU have had applying processes of creativ-ity. The main objective of this study is to communicate the different experiences and real examples of the cities towards in-vestment in cre-ative industries and creative cities theories. The examples found in the study demonstrate how cities like: Barcelona, Oslo, Birmingham, Riga, Stockholm, Tallinn, Amsterdam, Helsinki, Berlin y Warsaw had experienced through the impulse that inputs of creative cities theories have had.
Innovation Towards Creative Industries
In our days there is no manager or decision maker that could affirm that innovation does not carry competitiveness, it is in some way a given fact. Porter (1990) stated, “A nation’s competitiveness depends on the capacity of its industry to innovate and upgrade. Companies gain advantage against the world’s best competitors because of gener-ating innovations”.

184
Alfaro-García, Gil-Lafuente y Alfaro-Calderón
The Oslo Manual (2005) indicates that innovation can be charac-terized into four kinds: product innovation, process innovation, orga-nizational innovations and marketing innovation: Product innovation implies significant changes of the characteristics in products or ser-vices. They can include completely new products or services and the significant improvement of existing ones. Process innovation refers to significant changes in production and distribution methods. Orga-nizational innovations refer to the establishment of new methods of organization. These can be changes in the practices of the enterprises, in the organization of the workplace or in the external relations of the firm. Marketing innovation implies the establishment of new com-mercialization methods. These can include changes in the design and envelope of products, in the promotion and colocation of goods and in the methods of pricing in products or services.
In the present work we propose a methodology to aid decision makers in marketing innovation process, by offering a specific group-ing technique of products which has showed relevant results in prac-tice. In recent years more attention has been attracted to this concept due to the fact that “the development of new marketing tools and methods plays an important role in the evolution of industries.” Chen (2004).
Both innovation and creativity present highly uncertain bases, as for the endogenous and exogenous elements that surround them; therefore the adoption of decisions under a fuzzy approach has gained special relevance. Studies with a fuzzy-oriented standpoint have been increasing since the last century and have proven efficacy while deal-ing with complex phenomena.
Fuzzy Logic
It is widely accepted that decision-making process involves uncertainty, imprecision and imperfect or vague information. As stated by Bell-man & Zadeh (1970) “much of the decision making in the real world takes place in an environment in which the goals, the constraints and the consequences of possible actions are not known precisely”. The theory of decision under uncertainty initializes with the appearance of the article Fuzzy sets. Information and Control, Zadeh (1965), and has proven efficiency handling incomplete and uncertain knowledge

185
Creative industries innovation using Galois group theory
information see Ribeiro (1996). The theory of Fuzzy Sets has been applied in the field of the formal sciences; nonetheless in the past 44 years researchers from all over the world have been publishing diverse research studies with applications in varied fields of knowledge.
The relation that is established between the products to evaluate and the variables that characterize them as criteria for aggrupation and creation of synergies starts from the proposal of Kaufmann & Gil-Aluja (1998). The purpose of this work is to classify and group, different products that could by creation of synergies, increase their attraction as a whole. The method to classify and group these prod-ucts will have as a foundation Galois’ group theory; see Keropyan & Gil-Lafuente (2013) and the theory of fuzzy sets, see (Gil-Aluja, et al., 2011). These approximations admit us to construct a generalized model adapted to the conditions of expectancy and uncertainty.
Preliminaries
The origins of this study rely on the importance and relevance that emerging economies thus, emergent cities are exhibiting. Moreover the positive impact in which innovation management under a fuzzy approach could generate, finding in an efficient way existing connec-tions, relations, and similarities between products; creating synergies and raising the level of attraction and competitiveness of cities. These efforts in organization and synergy should exert benefits in the eco-nomic, social and environmental realm by producing greater effects than the sum of the individual labors.
The model
The model that we build aims to modernize the methods used before in the field of municipality’s touristic management. The model is a dif-ferent and structurally improved way of establishing groups to create synergies. The optimal grouping can lead to join the most affine prod-ucts in order to share capacity resources and in general terms help decision makers to create better strategies in order to increase the allurement, appeal and attraction of a city.

186
Alfaro-García, Gil-Lafuente y Alfaro-Calderón
In our model, we make a transition from verbal semantics to the corresponding numerical semantics in order to be able to group the most affine city’s highlights, matching them by the valuation of their inherent characteristics, qualities and peculiarities. The model allows flexible procurement of information by empowering city experts and decision makers in the valuation of the touristic place’s characteristics and their desired similarity level.
The adequacy of the model is very important in terms of measur-ing well the characteristics of the city’s highlights and determining if these characteristics can be match with other highlights characteristics to build strong synergies. The characteristics are not always objective. The model we propose lets us introduce subjective information for certain special cases where measurement is possible. Although there may exist some objective characteristics we have to accept the fact that the transition from verbal semantics to numerical semantics is subjective for those special cases that could have been measured, Gil-Lafuente (2002).
In general, the adoption and further application of Galois group theory has multiple significances: i) At first, it allows to establish different levels of synergies that
could be created as of the inherent characteristics of the tourist attractions analyzed.
ii) Secondary, once the level of synergies has been established, the model allows knowing precisely, which are the specific characte-ristics that foster the optimization of the groups.
iii) Thirdly, the model permits the selection on which of the characte-ristics the decision maker wants to prioritize in a specific environ-ment and strategic requirements.
Galois group theory has been proven efficient in different fields since the “order- or structure-preserving passage between two worlds of our imagination - and thus are inherent in human thinking wherever logi-cal or mathematical reasoning about certain hierarchical structures is involved” Denecke et al., (2004).
Other applications that have conducted with success the applica-tion of Galois Lattices can be found in the aggrupation of stakehold-ers for a better administration of enterprises, see Gil-Lafuente & Pau-

187
Creative industries innovation using Galois group theory
la (2013), and in human resources areas, with a personnel selection model Keropyan & Gil-Lafuente (2013).
Studied City
In order to understand the application of the method, we will briefly describe the profile of the city that has been chosen to develop the new touristic grouping model. As the reader will notice some of the main reasons of choosing this specific metropolis are because of the great importance that tourism has on its economy, the strategic loca-tion of the municipality and the need of fostering new management methods in order to maintain the attraction and appeal of visitors.
Morelia is a city located in the center of the Mexican Republic; it is the capital of the state of Michoacán de Ocampo. It is immersed in the Mega – region called “Greater Mexico City”, where approxi-mately 45 million people live and generates $290,000 million in LRP, more than half of the whole nation, Florida (2008).
Geographically Morelia finds itself 303 km from the capital of México City. Approximately 295 km to the north we find the city of Guadalajara, Jalisco, city known because of the culture, industry and the attractiveness to diverse businesses. About 196 km from Morelia, we find the city of Querétaro, recognized because of all the industrial activities that are held out. One of the most important ports of the country, Lázaro Cárdenas port, finds itself around 387 km from the capital of the State. The city also connects to different metropolises of México by its wide railroad infrastructure and the international Air-port “General Francisco Mújica”.
In economic aspects, the city has an overall gross domestic prod-uct of 7,774.5 dollars per capita, when the mean in the republic is 9,980 dollars. The city raised its gross domestic product from the 2003 to 2008 by 15%. The main economic activities of the city are tourism, education and commerce. The city reaches 1,606,399 economically ac-tive citizens which 1,554,720 are employed.
In terms of tourism, the city of Morelia is one of the first touris-tic destinations in the country due to its architectonical, cultural and historic legacy. The city also connects with a series of natural destina-tions, which increase the affluence of tourists. The city has over 110

188
Alfaro-García, Gil-Lafuente y Alfaro-Calderón
lodging establishments and only in 2010 Morelia attracted 2,449,805 national tourists and 269,179 international tourists.
Referring to amenities, the city has a wide variety of theaters, mu-seums, cinemas, bars and entertaining establishments, which nurture the popular culture and generate great attractiveness for the creation of micro and small enterprises.
In terms of education, the city of Morelia offers 882 educational facilities, 7,744 classrooms, 81 libraries, 103 workshops and 165 labo-ratories. Is in this city where one of the most important Universities of Mexico is established, the “Universidad Michoacana de San Nico-las de Hidalgo” where diverse ambits of science are studied such as health, administration and accountancy, legal, exact sciences, humani-ties, engineering and architecture. There is also a vast offer of post-graduate studies. In this university around 32,000 students are active. An Institute of Technology resides in the city; around 4,650 students specialize in technological fields of the knowledge. In general terms there are 9 public institutes of advance studies and 15 private ones.
In terms of culture, the city of Morelia is a national exponent hav-ing some of the most important artistic, musical and cinema events, as well as diverse expositions. Morelia has a total population of 729,279 inhabitants, 94.2% of them are alphabets and the standards of hu-man development are in the top ranked of the country. In the city we can find the “Conservatorio Musical” musical school founded in 1743, which provides the city of culture and artists in different specializa-tions. In other cultural aspects, Morelia is named human heritage in 1991 by the UNESCO, association that also gave the city the title of “Sanctuary of the Monarch Butterfly”, and sponsor of the “Day of the Dead National Celebration City”, “La Pirekua Musical Heritage of the Humanity”, and “Traditional Mexican cuisine - ancestral, ongoing community culture, the Michoacán paradigm”.
If in general terms the city has a great cultural reservoir, great af-fluence of tourism, and attractive popular amenities, the development of the industrial tissue is incipient, this affects in terms of providing re-warding employments to the citizens of the city. In terms of industry, the city has over 16 mining economical units, where around 100 peo-ple work, 3143 manufacturing enterprises where 14,606 people work. In 2008 only 16 licenses for industrial land use were petitioned. The city has an industrial park where 180 enterprises offer around 9,000

189
Creative industries innovation using Galois group theory
employments, most of the enterprises established have only distribut-ing activity and the manufacturing enterprises are small or medium size companies. All the data was retrieved from the National Institute of Statistics and Geography (INEGI).
Application
When conducting traditional grouping of elements, trial and error methods are employed, therefore the confidence level in which the inherent characteristics of the studied products relate to each other tends to be scarce. In order to optimize the process of product group-ing, we propose the use of the Affinities Theory and Galois Group Theory, which allows us to know exactly which products are stout at determined characteristics with a significant level of confidence.
In the application of the methodology, decision makers of the mu-nicipality of Morelia – México, need to group different products, in this case highlights of the city to optimize the visit of a specific profile of tourist. By grouping the most affine places of interest of the city, decision makers can choose from different strategies to maximize the experience a visitor may have.
In order to assess the specific challenge that the municipality of Morelia – México faces we need to establish in one hand the products that will be offered to the visitor and in the other the variables that will be held to evaluate the affinity in which the products relate to each other. We now follow the steps specified in (Gil Lafuente, 2002).
Establishing the Products
The municipality of Morelia – México has a list of 13 highlights, which are considered the prime touristic attractions of the city. We proceed to name them in the following table.

190
Alfaro-García, Gil-Lafuente y Alfaro-Calderón
Table 1 Touristic Products
a Planetariob Palacio Clavijeroc Catedrald Museo de Sitio Casa de Morelose Jardín Villalongínf Monumento a José María Morelosg Callejón del Romanceh Zoológicoi Estadio Morelosj Teatro Melchor Ocampok Centro Comercial Espacio las Américasl Museo Regional Michoacanom Bosque Cuauhtémoc
Source: Elaborated from municipal touristic records.
Formulating the Variables
A list of characteristics of the places of interest was asked to be given. Each characteristic, singularity and peculiarity will serve as a basis for the creation of affinities for the whole group of products. The list was made by 10 assessors of the tourism office in the city. Their opin-ions were focused on the main characteristics that a visitor of the city seeks. Once the head of the department approved the list, we proceed to name it. a) Historic: the level in which the highlight represents historical facts
or events that occurred in the city.b) Representative: the level in which the highlight remains on the
memory of a visitor and serves for elucidating the city. c) Commercial: the level in which that specific highlight allows a vi-
sitor to generate economic spillover. d) Environmental: the level in which that specific highlight has green
areas, and in general is green friendly. e) Location: the distance a specific highlight has from the city’s’ geo-
graphical center.

191
Creative industries innovation using Galois group theory
f) Amenities: the level in which that specific highlight entertains the visitor, expositions, performances and cultural activities are some of the amenities included.
It is important to mention that the variables / characteristics included in the model are not exhaustive and have been treated with the same level of importance; we are currently working on further investiga-tion, in which the nature of the variables and the importance of them affect, and apply certain weights in the model.
Grouping by Affinities
The first step to conduct the process of grouping is to generate fuzzy subsets, valuating the different products due to their characteristics, singularities and peculiarities in the next way:
Each product due to its inherent characteristics will be evaluated thru a linguistic tag between 0 and 1 in which:
Table 2Evaluation of Variables
1 Excellent performance0.9 Great performance0.8 Really good performance0.7 Good performance0.6 Rather a better tan a poor performance0.5 Nor a good or poor performance0.4 Rather a poor tan a good performance0.3 Poor performance0.2 Really poor performance0.1 Worst performance0 Disastrous performance
Source: Self elaborated.

192
Alfaro-García, Gil-Lafuente y Alfaro-Calderón
In our case we have:
With this information we generate a fuzzymatrix comprehended by:

193
Creative industries innovation using Galois group theory
In our case:
A B C D E F
a .3 .7 .4 .6 .4 .8
b .7 .8 .2 .3 .9 .8
c .8 1 .3 .7 1 .6
d 1 1 .2 .5 .8 .9
e .5 .8 .3 .8 .7 .3
f .8 .9 .1 .7 .7 .2
g .6 .6 .6 .8 .7 .7
h .2 .7 .5 1 .5 .9
i .1 .8 .4 .5 .3 .8
j .7 .6 .2 .3 .9 .8
k 0 .5 1 .2 .4 .7
l 1 .6 .5 .4 .9 .9
m .5 .5 .4 .9 .8 .7
Once this information has been established and accepted, the decision maker must make a choice concerning the desired level of homogene-ity that the groups of highlights may have as for their specific charac-teristics, qualities and peculiarities. So for each characteristic we will establish:
In our case the decision maker defined q as:
Once the values of qj have been established, the valuations of each column of characteristics will be compared. If the valuation given to the specific characteristic is equal or superior to the desired level of homogeneity then the valuation is substituted with a 1, in the contrary 0. Specifically:

194
Alfaro-García, Gil-Lafuente y Alfaro-Calderón
By performing this action we will get a new matrix, in which the slots will only have 0 or 1. In our case
[B]
A B C D E F
a 1 1
b 1 1 1 1
c 1 1 1 1 1
d 1 1 1 1 1
e 1 1
f 1 1 1
g 1 1 1
h 1 1 1
i 1 1 1
j 1 1 1
k 1 1
l 1 1 1 1 1
m 1 1 1
Maximum inverse correspondence algorithm
In order to find the most affine elements of the highlights of the city, we will follow the theory of affinities, specifically the maximum inverse correspondence algorithm (Gil Aluja, 1999). Studies and applications

195
Creative industries innovation using Galois group theory
of this algorithm in economic and business sectors have led to excel-lent results while dealing with uncertain conditions.1) From the conjunct of highlights and characteristics choose the one
conjunct that presents the fewer elements. In our case:
{A,B,C,D,E,F}
2) Create the “power set”, which represents all the possible combi-nations of the conjunct with the fewer elements. In our case:
{∅,A,B,C,D,E,F,AB,AC,AD,AE,AF,BC,BD,BE,BF,CD,CE,CF,DE,DF,EF, ABC,ABD,ABE,ABF,ACD,ACE,ACF,ADE,ADF,AEF,BCD,BCE,BCF, BDE,BDF,BEF,CDE,CDF,CEF,DEF, ABCD,ABCE,ABCF,ABDE,ABDF,ABEF,ACDE,ACDF,ACEF,ADEF,BCDE,BCDF,BCEF,BDEF,CDEF, ABCDE,ABCDF,ABCEF,ABDEF,ACDEF,BCDEF,ABCDEF}
3) For each element of the “power set” include the corresponding elements of the conjunct that hasn’t been chosen for having a greater number of elements. The so called “connection to the right”. In our case:
∅ acbdefghijklm BCD ∅A cdfl BCE ∅B bcdefi BCF ∅C ghkl BDE bcdD abcdefghijlm BDF bcdiE bcdjlm BEF bcdF abcdghijklm CDE lAB cdf CDF ghlAC l CEF lAD cdfl DEF bcdjlmAE cdl ABCD ∅AF cdl ABCE ∅BC ∅ ABCF ∅BD bcdefi ABDE cdBE bcd ABDF cdBF bcdi ABEF cdCD ghl ACDE l

196
Alfaro-García, Gil-Lafuente y Alfaro-Calderón
CE l ACDF lCF ghkl ACEF lDE bcdjlm ADEF cdlDF abcdghijlm BCDE ∅EF bcdjlm BCDF ∅ABC ∅ BCEF ∅ABD cdf BDEF bcdABE cd CDEF lABF cd ABCDE ∅ACD l ABCDF ∅ACE l ABCEF ∅ACF l ABDEF cdADE cdl ACDEF lADF cdl BCDEF ∅AEF cdl ABCDEF ∅
4) We choose, from every non-void conjunct of the “connection to the right” the corresponding conjunct of the “power set”, which possess the greater number of elements. In our case:
∅ ABCDEFcd ABDEFl ACDEFcdl ADEFbcd BDEFcdf ABDbcdi BDFghl CDFbcdjlm DEFcdfl ADbcdefi BDghkl CFabcdghijlm DFabcdefghijlm Dabcdghijklm Fabcdefghijklm ∅

197
Creative industries innovation using Galois group theory
5) At this point we have found the maximum number of relations, named affinities. The algorithm applied allowed in an unambi-guous method to create the biggest amount of groups, due to the desired homogeneity level. In our case the highlights of the city can be grouped in any of the specified conjuncts due to the cha-racteristics, qualities and peculiarities they present.
The relations found between both conjuncts create themselves a Galois Lattice, which allows demonstrating in an ordered way the homogeneous groups as well as the perfect structuration of the ele-ments.
Galois group theory and Galois lattices
Galois Theory is a connection between the field theory and the group theory. Certain problems in field theory can be reduced to group theory using Galois Theory. This allows us understanding the prob-lems easier and solving them in a simpler way. In the beginning, Galois used permutation groups to explain how the various roots of a given polynomial equation were related to each other, Edwards (1984).
Galois Theory is based on a remarkable correspondence between subgroups of the Galois group of an extension E/F and intermediate fields between E and F.
If G = Gal (E/F) is supposed to be the Galois group of the extension E/F. If H is a subgroup of G, the fixed field of H is the set of elements fixed by every auto-morphism in H, that is:
F(H)={x∈E: σ(x)=x for every σ ∈H}
If K is an intermediate field, that is, F ≤ K ≤ E define:
G(K)=Gal(E/K)= {σ ∈G: σ(x)= x for every x ∈K}
In other words fixing group of K for G (K), since G (K) is the group of auto-morphisms of E that leave K fixed. Galois Theory is about the relation between fixed fields and fixing groups, see Edwards (1984); Artin (1998).

198
Alfaro-García, Gil-Lafuente y Alfaro-Calderón
Definitions of the theory
Following the definition of Keropyan & Gil-Lafuente (2013):
Definition 1. A lattice is a partially ordered set in which two any ele-ments have a least upper bound (LUB) and a greatest lower bound (GLB). A complete lattice is a lattice where any set has a LUB and a GLB.
Definition 2. A context K is a triple (O, F, ζ ) where O is a set of objects; F is a set of attributes and ζ is a mapping from O×F into {0,1}.
Definition 3. Given a context K=(O, F, ζ ) let us define two mappings from P(O) into P(F) and from P(F) into P(O) using the same notation 0 by the formula:
A’ Is called the dual of A, similarly B’ is is called the dual of B.
Definition 4. Given a context K=(O, F, ζ ), the pair C=(A, B) is called a concept of K if and only if A’=B and B’=A.
Definition 5. A is called the extent of the concept C and B is called its intent.
This is denoted by A = extent (C) and B = intent (C).
Considering an order relationship defined through inclusion of intents, one may define a Galois lattice or concept lattice.
Definition 6. The complete lattice L(K) of concepts of the context K is called (general) Galois lattice or concept lattice.
In our case we represent the Galois Lattice as follows:

199
Creative industries innovation using Galois group theory
Figure 1 Galois Lattice for the City’s Highlights Case
Source: self elaborated.
Results and discussion
The algorithm finishes when we obtain Galois Lattice, the figure rep-resents in an ordered and systematic way, not only the total number of affinities that exist between the highlights of the city and the variables that comprise them, but it interconnects them in a coherent structure.
The decision maker can now opt for diverse combinations that could enhance the current schemes of touristic plans. In a first in-stance we can see that if we wanted to group all the tourist attractions it would be impossible because each highlight has different valuation on their specific characteristics, qualities and singularities. As the lev-els advance we can visualize how the groups establish, in a first level highlights a, b, c, d, e, f, g, h, I, j, l and m all share the characteristic D or Environmental, in a similar way a, b, c, d, g, h, I, j, k, l and m all share characteristic F or Amenities. Perhaps the following levels could be more useful to the decision maker, since the amount of characteris-tics grow but the quantity of places of interest decrease. For example

200
Alfaro-García, Gil-Lafuente y Alfaro-Calderón
highlights c, d, f and i possess characteristics A and D, Historic and Environmental. The maximum number of characteristics possessed by a group of highlights is found in the top of Galois Lattice representa-tion, where c and d present singularities A, B, D, E and F.
The maximum number of groups have been presented in an or-dered and structured way, the decision maker has now the possibility to generate structured plans following the levels of the Lattice, if the plan requires groups of highlights which present A, D, E and F char-acteristics, then c, l, and d places are the most affine and could create better synergies. Following the same idea, if the plans require D, E, and F characteristics then b, c, d, j, l and m are the most affine high-lights to generate common strategies.
This result is highly interconnected with the level of homogeneity chosen by the experts; in this case that level was the result of a specific profile of tourist. The decision maker could generate different scenar-ios, applying diverse combinations in order to get a full map of groups, depending on the various profiles of visitors that the city receives.
Conclusions
We propose an original group-based model methodology that relies on the comparison between determined variables collected by the inherent characteristics of different products in order to create posi-tive synergies between them. The proposed model is originated on the basic principles of Galois group theory, this process allows grouping different products with a certain level of significance, detect the level in which those groups could create synergies, and select which of the inherent characteristics of the products could be enhanced due to the specific needs and requirements of the decision maker.
The present work tries to shed a light in the academic world by offering a robust group based model in which subjective and relative factors are intrinsic for the decision making process. Also this analysis tries to aid decision makers so they can create common policies due to the results of the grouping processes.
Further research needs to be conducted, at a first instance, study the nature of the variables stated to know whether they need to be weighted, conduct tests to know if this weight plays a significant role

201
Creative industries innovation using Galois group theory
on the results obtained and also apply the model in specific conditions. The model we present can be applied to different circumstances; we would like to encourage research on similar areas since it may allow optimizing the process of grouping of products under subjective and uncertain conditions.
References
Artin, E. (1998). Galois theory, second éd. Dover, New York, NY.Bellman, R. E. & Zadeh, L. A. (1970). Decision-making in a fuzzy environ-
ment.Management science, 17(4), B-141.Chen, Y. (2006). Marketing innovation. Journal of Economics & Management
Strategy, 15(1), 101-123.Denecke, K. & Wismath, S. L. (Eds.). (2004). Galois connections and applica-
tions 565. Springer.Edwards, S. A. & Tardieu, O. (1984). Galois theory.Florida, R. (2008). Who’s Your City?, Basic Books, USA.Florida, R. (2012). The rise of the creative class: revisited. Basic books. USA.Gil-Aluja, J. (1999). Elements for a theory of decision in uncertainty, Kluwer
Academic Publishers, London.Gil-Laufente, J. (2002), Algoritmos Para La Excelencia: Claves para el éxito en
la gestión deportiva, Milladoiro, Spain.Gil-Aluja, J., Gil-Lafuente, A. M. & Merigó, J. M. (2011). Using homo-
geneous groupings in portfolio management. Expert Systems with Applications, 38(9), 10950-10958.
Gil-Lafuente, A. M. & Paula, L. B. (2013). Algorithm applied in the identifi-cation of stakeholders. Kybernetes, 42(5), 674-685.
Hall, P. (2000), Creative Cities and Economic Development, Urban Studies, 37(4), 639–649.
Kaufmann, A. y Jaime, G. A. (1988). Modelos para la investigación de los efec-tos olvidados. Milladoiro. Vigo (Spain).
Keropyan, A. y Gil-Lafuente, A. M. (2013). A personal selection model using Galois group theory. Kybernetes, 42(5), 711-719.
Charles, L. (2000). The creative city: a toolkit for urban innovators. London, Sterling. VA: Comedia.
Metropoles, C. (2010). How to support creative industries, Available at: http://www.creativemetropoles.eu/
OECD. (2005). Guidelines for collecting and interpreting innovation data. France: OECD.

202
Alfaro-García, Gil-Lafuente y Alfaro-Calderón
Porter, M. E. (1990). The Competitive Advantage of Nations. Harvard busi-ness review.
Ribeiro, R. A. (1996). Fuzzy multiple attribute decision making: a review and new preference elicitation techniques. Fuzzy sets and systems, 78(2), 155-181.
UNCTAD. (2010). Information Economy Report, Available at:http://search.ebscohost.com/login.aspx?direct=true&db=plh&AN=650521
21&site=bsi-liveZadeh, L. A. (1965). Fuzzy sets. Information and control, 8(3), 338-353.


The Challenges of Competitivenessse terminó de imprimir en febrero de 2015
en los talleres de Ediciones de la NocheMadero #687, col. Centro
Guadalajara, JaliscoEl tiraje fue de 500 ejemplares
www.edicionesdelanoche.com