the chemistry and formation of water-in-oil …
TRANSCRIPT
_—. —.— — .——. —- —.. ..— —
THE CHEMISTRY AND FORMATION OF WATER-IN-OIL
EMULSIONS AND TAR BALLS FROM THE
RELEASE OF PETROLEUM IN THE MARINE ENVIRONMENT
James R. Payne
DivisiorI of Environmental Chemistry and Geochemistry
Science Applications, Inc.
La Jolla, California 92038
——— . _____ .— .. —- —— ——-— —-
PREFACE
This manuscript is based on a review n~epared as a contribution to
the NAS Petroleum in the Marine Environment/Update Workshop held November
9-13, 1981, and it may or may not reflect the concensus of the workshop par-
ticipants or the National Academy of Sciences. A summary publication of those
proceedings is anticipated in 1983; however, there are currently no plans to
publish” the background papers per se. Thus, this text is the direct result of
the author’s desire to make its contents available to a wider audience of
interested parties in the scientific and industrial community. I am gratefulto a number of my col?egues and peers who have encouraged me over the several
months which have elapsed since the NAS review to publish this material in its
present form.
The original draft of the manuscript was reviewed by Dr. James N.
Butler of Harvard University and Mr. Gerard P. Canevari of Exxon Research andEngineering Company. Their comments and suggestions have been incorporated
throughout the text where appropriate; however, this author must assume respon-sibility for any omissions or errors :ntroduced in reviewing the rather
extensive amount of literature published on the subject.
I am deeply indebted to G. Daniel McNabb, James Lambach, Robert
Redding, and William Paplawsky for the analyses of the samples from Kasitsna
Bay, Alaska, discussed in the book. I would also like to thank Cheryl Fish,
Suzanne Goldman, Mabel O’Byrne, Randee Luedecke and Nancy Burnett for their
able assistance in the preparation of this manuscript, its tables and figures.
James Lambach and Randolph E. Jordan were also instrumental in obtaining much
of the liter~’ture cited and in compiling the various references for the Bibli-
ography.
Oil weathering research programs related to the subject of this re-
view have been funded (wholly or in part} by NOAA/Office of Marine Pollution
Assessment, Contract No. NA80RAC 00013, Cooperative Research in Investigating. .
..— —— —. .—
the IXTOC I Blowout; NWL4/Outer Continental Shelf Environmental Assessment
Program, Contract No. 03-7-002-35213, Preparation of a Literature Review on
the Fate and Weathering of Petroleum Spills in the Marine Environment; and by
the Bureau of Land Management through interagency agreement with the National
Oceanic and Atmospheric Administration, as part of the Outer Continental Shelf
Environmental Assessment Program, Contract No. NA80RAC 00(318, Mliltivariate
Analysis of Oil Weathering in the Marine Environment - Sub Arctic.
James R. Payne, Ph.D.
April 9, 1982
La Jolla, California
ii
.-—
TABLE OF CONTENTS
TITLE
INTRODUCTION . . . . . . . . . . . .
LABORATORY STUDIES OF FORM4TION ANDSTABILITY OF WATER-IN-OIL EMULSIONS.
Background. . . . . . . . . . .
Specific Studies. . . . . . . .
.
.
.
.
.
.
.
.
.
.
.
.
Identification of Emulsifying AgentsResponsible for Mousse Formation. . .
Physical and Behavioral Properti-esof Mater-in-oil Enwlsions . . . . . .
Breaking and Integration ofLaboratory Mousse with Dispersants. .
Bacterial Utilization ofLaboratory Generated Mousse . . . . .
.
.
.
.
.
●
✎
✎
.
.
.
.
.
.
.
.
.
.
.
.
.
.
.
.
.
.
.
.
.
.
.
.
.
.
.
.
.
.
.
.
.
.
.
.
.
.
.
SELECTED CASE HISTORIES OF THE KIRE DETAILED CHEMISTRYSTUDIES OF MOUSSE BEHAVIOR AND LONG TERM FATE IN NEAR-COASTAL AND OPEN OCEAN OIL SPILLS/BLOMOUTS. . .
TorreyCanyon. . . . . . . . . . . . . .
Tanker Arrow. . . . . . . . . . . . . . .
Metula. . . . . . . . . . . . . . . . . .
Ekofisk Bravo Blowout . . . . . . . . . .
US/NS Potomac in Melville Bay, Greenland.
TAR
Amoco Cadiz ..,..... . . .
IXTOC I Blowout, Bay of Campeche,Gulf of Mexico....,.. . . .
Background . . . . . . . . .
Observations at the !dellhead
. . . .
. . . .
. . . .
. . . .
Subsurface Transport and Weatheringof IXTOCOil . . . . . . . . . . . .
Observations of Micro-ScaleMousse Formation . . . . . . . . . .
Fate of Stranded IXTOC MousseAlong the Southeast Texas Coastline.
Burmah Agate. . . . . . . . . . . . .
Open Ocean Field Testsof Spilled Petroleums . . . . . . . .
Conclusions. . . . . . . . . . . . .
BALL FORF!ATION ANO DISTRIBUTION . . . .
Chemical Composition of Tar Balls . .
. .
. .
. .
. .
. .
.
.
.
.
.
.
●
●
✎
✎
✎
✎
✎
✎
✎
✎
✎
.
.
.
.
●
✎
✎
✎
✎
✎
✎
✎
✎
✎
✎
✎
✎
✎
.
.
.
.
.
.
.
.
.
.
.
.
.
.
.
.
.
.
.
●
✎
✎
✎
✎
✎
✎
✎
✎
✎
✎
✌
✎
✎
✎
✎
.
.
.
.
.
.
.
.
.
.
.
.
.
.
.
.
.
.
.
.
.
●
✎
✎
✎
.
.
.
.
.
.
.
.
.
.
.
.
.
.
.
.
.
.
.
.
.
.
.
.
.
.
PAGE
.
.
.
.
.
.
.
.
.
.
.
.
.
.
.
.
.
.
.
.
.
.
.
.
.
1
4~
6
20
24
34
40
41
41
42
46
47
51
53
59
59
65
69
72
80
82
83
87
89
“91
. . .111
.— ————— .— . ——-
TABLE OF CONTENTS (CONTINUED)
TITLE
Sources of Pelagic Tar . . . . . . .Fate of Beached or Stranded Tar Balls
. . . .
. . . .DEVELOPMENT OF ALGORITHMS AND COMPUTER PROGRAMS TOSIMULATE THE FORMATION OF WATER-IN-OIL EMULSIONS .
SUMMARY . . . . . . . . . . . . . . . . . . . . .
Laboratory Studies . . . . . . , , . . . . . .
.
.
.
.
.
Physical Properties of Water-in-Oil Emulsions
Treatment of Mousse with I)ispersants . . , . .
Case Histories of Real Spill Events . . . . .
Tar Ball Distributions and Chemistry . . . . .
.
.
.
.
.
.
.
●
✎
.
.
.
.
.
●
✎
✎
✎
.
.
.
.
●
✎
✎
✎
✎
.
.
.
.
.
.
.
.
.
Mathematical and Ccmputer Modeling of Mousse Behavior.
ACKNOWLEDGEMENTS . . . . . . . . . . . . . . . . . . . . . .
31 BLIOGRAPHY . . . ..0...... . . . . . . . . . . . .
PAGE
96
101
104
120
120
121
122
123
125
127
128
729
<.,d
iv

. ..— .— - — -—
LIST 0FTABLE5
TABLE TITLE PAGE
1
2
3
4
5
6
7
8
Mousse Fornntion Experinients using a Variety of Freshand Artificially Weathered (Topped) Crude Oils inLaboratory, Outdoor Test Tank, and FieldExperiinental Spills. . . . . . . . . . . . . . . . . . . . . . 7
Other 01s Which Have Demonstrated Water-in-OilEmulsion Tendency, . . . . . . . . . . . . . . . . . . . . . . . 10
Time-series water column concentrations (YQ1 of dissolveddispersed hydrocarbons from fresh Prudhoe Bay crude oiland mousse weathering on flow-through seawater enclosures(turbu? en~ regi,me) at Kasitsna Bay, Alaska. (Water temp-erature 6 C, air temperature 6 - 13°C), Concentrationsdetermined by capillary temperature-programmed FID gaschromatography. . . . . . . . . . . . . . . . . . . , . . . . 32
Inhibition of Stable Mousse Formation by the Addition ofChemical Dispersants. . . . . . . . . . . . . . . . . . . . . 35
Chemical Studies of Oil/Mousse Behavior inMajor Oceanic Spills and Blowouts. . . . . . . . . . . . . . . 41a
Selected Component Ratios for the Dissected Mousse SampleBeached at Laguna Madre (Station RIX 23) . . . . . . . . . . . 79
Summary of 1971-1980 Citations of Tar Ball Distributionsand Concentrations on the World Oceans . . . , . . . . . . . . 90
Summry of 1971-1976 Stranded Tar Ball Distributions andConcentrations on Beach Surfaces . . . . . . . . . . . . . . . 102

. . . . . ———
. . FIGURE
1
2
3
4
!5
6
7. . .
8
9
LIST OF FIGURES
TITLE
*
PAGE
Flame Ionization Detector - Temperature Programmed Gas Chroma-tograpiiic Analysis of Tenax-Trapped Volatile Compounds LostFrom Fresh Prudhoe 8ay Crude Oil After I hour of Weathering(I!ith Turbulence) on Seawater. . . . . . . . . . . . . . . . . 25
Flame Ionization Detector - Temperature Programmed Gas Chroma-tographic Analysis of Tenax-Trapped Volatile Compounds LostFrom Fresh Prudhoe Bay Mousse (80% Water) After 1.5 hours of!Jeathering (With Turbulence) on Seawater . . . . . . . . . . . 26
Tenax Trap/FID GC Data on Sub-Arctic Volatile Component LossFrom Prudhoe Bay Crude Oil and Mousse on Flow-Through SeawaterEnclosures in Kasitsna Bay, Alaska . . . . . . . . . , . . . . 28
Computer Generated Plots of Capillary FID-GC Data on Inter-mediate Molecular Weight Components Remaining in Prudhoe BayCrude Oil and Mousse Weathering Under Sub-Artic Conditionson Flow-Through Seawater Enclosures at Kasitsna Bay, Alaska. . 29
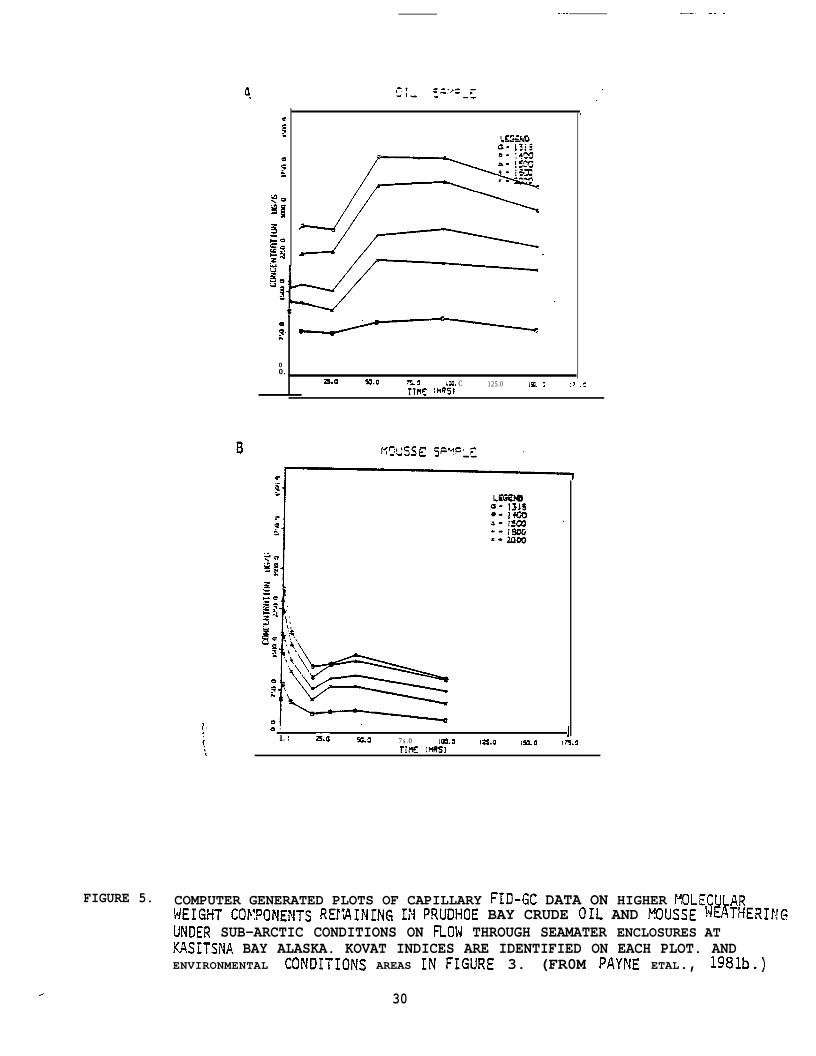
Computer Generated Plots of Capillary FID-GC Data on HigherMolecular Weight Components Remaining in Prudhoe Bay CrudeOil and Mousse Weathering Under Sub-Arctic Conditions on FlowThrough Seawater Enclosures at Kasitsna Bay Alaska . . . . . . 30
Relative Abundance of Alkyl-Substituted Polynuclear AromaticHydrocarbons in IXTOC Crude Oil Collected 1/2 Mile from theWell Head. . . . . . . . . . . . . . . . . . . . . . . . . . . 76
Abundance of N-Alkanes (Relative to nC-20) in Beached Moussefrom Laguna Madre (RIX-23), Mousse Flakes Collected 16-18Miles from the WfeJl Head (P-23) during the GW Pierce Down-Plume Transect, and IXTOC Crude Collected 1]2 Mile from theWell Head. . . . . . . . . . . . . . . . . . . . . . . . . . , 77
Mousse/Oil (u/Po) Relative Viscosity Ratio of Six Test CrudeOils as a Function of !iater Content. . . . . . . . . . . . . . 106
Computer Model - Predicted and Observed Time-Dependent Uptakeof Water into Ekofisk oil as a Function of Wind Speed andSea-State . . . . . . . . . . . . . . . . . . ,. . . . . . ,109
ui
——..—.
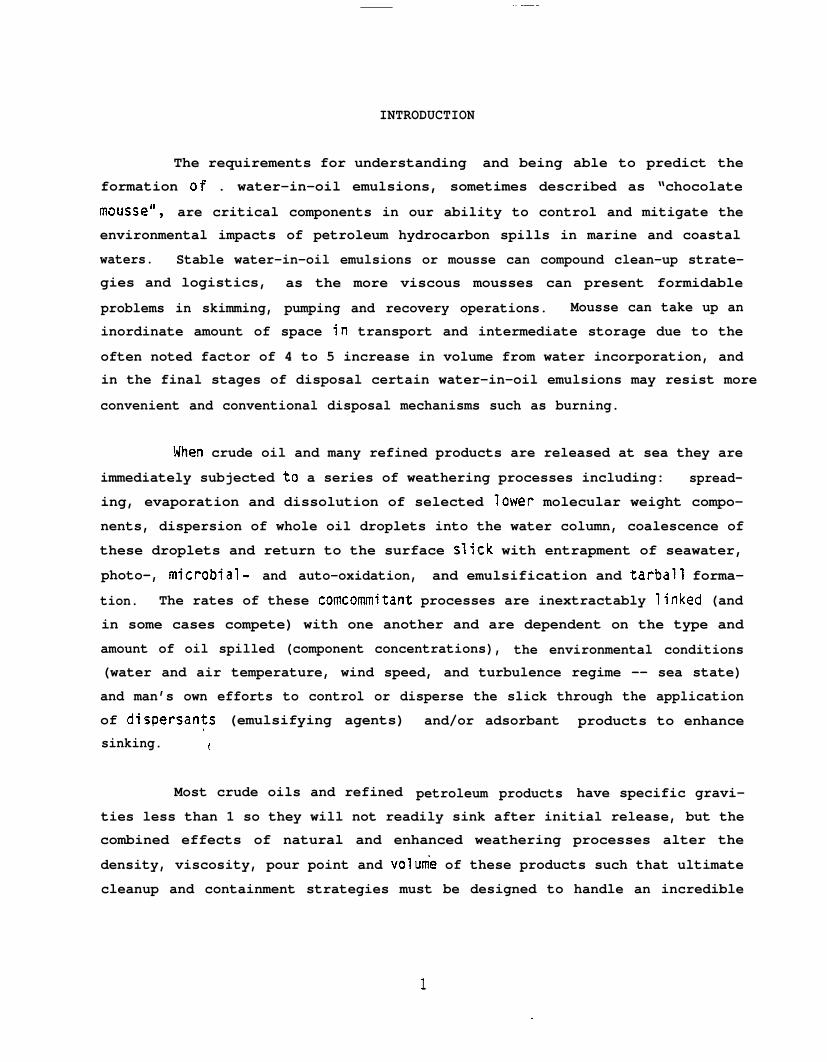
INTRODUCTION
The requirements for understanding and being able to predict the
formation of . water-in-oil emulsions, sometimes described as “chocolate
mausse”, are critical components in our ability to control and mitigate the
environmental impacts of petroleum hydrocarbon spills in marine and coastal
waters. Stable water-in-oil emulsions or mousse can compound clean-up strate-
gies and logistics, as the more viscous mousses can present formidable
problems in skimming, pumping and recovery operations. Mousse can take up an
inordinate amount of space fn transport and intermediate storage due to the
often noted factor of 4 to 5 increase in volume from water incorporation, and
in the final stages of disposal certain water-in-oil emulsions may resist more ‘
convenient and conventional disposal mechanisms such as burning.
When crude oil and many refined products are released at sea they are
immediately subjected to a series of weathering processes including: spread-
ing, evaporation and dissolution of selected lower molecular weight compo-
nents, dispersion of whole oil droplets into the water column, coalescence of
these droplets and return to the surface slick with entrapment of seawater,
photo-, microbial- and auto-oxidation, and emulsification and tarball forma-
tion. The rates of these comcommitant processes are inextractably linked (and
in some cases compete) with one another and are dependent on the type and
amount of oil spilled (component concentrations), the environmental conditions
(water and air temperature, wind speed, and turbulence regime -- sea state)
and man’s own efforts to control or disperse the slick through the application
of dispersants (emulsifying agents)
sinking. (
Most crude oils and refined
and/or adsorbant
petroleum products
products to enhance
have specific gravi-
ties less than 1 so they will not readily sink after initial release, but the
combined effects of natural and enhanced weathering processes alter the
density, viscosity, pour point and volume of these products such that ultimate
cleanup and containment strategies must be designed to handle an incredible

—- —..
variety of situations. During the formation of water-in-oil
ucts of higher density and viscosity containing up to 70-80%
as sub-micron to 50 micrometer droplets) in the continuous
emulsions, prod-
water (dispersed
oil phase can be
generated, and as such, burning may become much more difficult due to the high
water content, and chemical dispersion may prove to be impossible. Because of
their greater density however, oil-in-water emulsions and tar balls generated
from such mousse may be more susceptible to submersion, ultimately enhancing
the dispersement of crude slicks. Numerous investigators have suggested that
mousse formation and stability is influenced by the presence of surfactant
materials such as asphaltenes, waxes, organometallics, and nitrogen, sulfur
and oxygen (NSO) compounds which are important in preventing water-water
coalescence within the emulsion. Turbulence has also been demonstrated to be
critical in mousse formation; however, at this time no single explanation
completely explains all of the observable, and not all of the mechanisms of
mousse formation and stability are understood. It has been found that more
viscious oils tend to form more stable emulsions and that water-in-oil emul-
sions are more rapidly formed under lower temperature (higher viscosity)
conditions.
In this r&iew, attempts have been made to provide a broad view of
the subject. Topics range from discussions of detailed laboratory and field”
test-tank (wave and mixing chamber) experiments used to examine the specifics
of mousse formation from the standpoint of oil composition and turbulenceregimes, to studies of mousse formation and behavoir in real spill situations.
Several major spill incidents are considered with regard to observed and docu-
mented mousse and tarball formation, stability and fate; and when possible,
correlations :,between real spill situations and laboratory simulations are
made. The occurrence, distribution and chemistry of tarballs from other
sources are then briefly considered; however, not as much emphasis has been
placed on this subject due to the highly variable levels of tarballs in the
world’s oceans and their somewhat limited long-term environmental impact.
2

—— ..———
Finally, a brief review of recent attempts to simulate mousse forma-
tion and behavior through mathematical and computer modeling is presented. In
general, these models are coupled to or based upon laboratory wave tank and
mixing chamber experiments, although several attempts to model field observa-
tions with computer predictions {hind casting) are discussed.
3
—

_—-. ———
LABORATORY STUDIES OF FORMATION AND STABILITY
OF WATER-IN-OIL EMULSIONS
Background
Before undertaking a discussion of water-in-oil emulsion formation
and stability, it is first necessary to review several general aspects of
emulsions and emulsification. A more comprehensive treatment of the subject
is presented by Twardus (1980). In general, an emulsion is defined as two
immiscible liquids wherein droplets of one phase (the dispersed or internal
phase) are encapsulated within sheets of another phase (the continuous or
external phase). Mhen crude oil or petroleum products are spilled at sea, two
basic forms of emulsions are possible. The first is an oil-in-water (0/!4)
emulsion in which oil droplets are dispersed and encapsulated within sheets of
water. The second is a water-in-oil (hI/O) emulsion in which droplets of water
are dispersed and encapsulated within sheets of oil , and this is the mixture
which is generally referred to in the literature as mousse. For either typeof stable emulsion to form between two liquids, three basic conditions must be
met. First, the two liquids must be immiscible or mutally insoluble in each
other, second sufficient agitation must be applied to disperse one liquid into
the other and third, an emulsifying agent or combination of emulsifiers must
be present.
Following emulsification the interracial area between two liquids is
increased. Because liquids tend to keep the surfaces to a minimum, however,an emulsifying agent and work (or energy) are required to allow emulsification
to occur. In theory the amount of energy required to increase the surface
area can be calculated (Becher, 1955) if the interracial tension between the
two liquids is known. In general, in open ocean and coastal oil spills, suf-
ficient energy is provided by wind, waves and currents to satisfy this require-
ment, and stable water-in-oil emulsions have been observed to form even on
very calm seas. The emulsifying agent may be any surface active substance
which can form a thin interracial film between the two liquids and maintain
.

—. .—— .
the emul sion by mi nimi zing the contact, coalescence and aggregation of the
internal dispersed phase. For emulsions to be prepared in the absence of
external agitation, the interracial tension between the two liquids should be
reduced to approximately 0.5 dynes/cm, whereas this value need only be approxi-
mately 5 dynes/cm for emulsions prepared with agitation. The surfactants
should be able to surround the dispersed droplet as a non-adhering film and
should have a molecular structure in which the polar end is attracted to the
water and the non-polar end is attracted to the oil. Surfactants should be
relatively more soluble in the external phase so that it is readily available
for adsorption around the internal phase. These surfactants also may impart
an electro-kinetic potential, and influence the viscosity of the emuls”
formed. Finally, the surfactant material must stabilize the emulsificat
process while being present in relatively small quantities.
Depending on the chemical composition of the surfactant, emuls
on
on
on
stability can either be increased or decreased. For example, materials con-
taining mono-valent ions have been shown to stabilize oil-in-water emulsions
while surfactants containing poly-valent ions can stabilize water-in-oil
emulsions. A number of materials are present in crude oils to stabilize water-
in-oil mixtures, and these will be discussed later in greater detail. In
general, however, unrefined oils have relatively higher portions of water-in-
oil emulsifying agents than oil-in-water emulsifying agents. Thus, while both
types of emulsions can be formed in petroleum spill, the majority of the emul-
sion would be in the water-in-oil type. Furthermore, oil-in-water emulsions
are inherently unstable, and they have been shown to invert to water-in-oil
mixtures. The effects of shear rate, temperature and oil concentration on the
formation of ~oil-in-water emulsions was studied using California crude {Mao
and Marsden, ‘1977), and they noted that increases in temperature and/or oil
concentration also enhanced the inversion of oil-in-water emulsions to water-
in-oil emulsions.
In water-in-oil emulsions,
and waxes have been shown to act as
asphaltene substances, porphyrin complexes
natural emulsifying agents stabilizing W/O

—.__ ——.. — .— .-
mixtures (Berridge et al. , 1968a, Berridge et al. , 1968b, Cairns et al. , 1974,
Canevari , 1969 and Frankenfeld 1973). These agents presumably provide the
required film around the water droplets which resists rupture preventing Wdter-
water coalescence. The size distribution of water droplets in W/O emulsions
is also significant, and this will be discussed in greater detail later.
The stability of water-in-oil emulsions is dependent on a variety of
factors, including: the presence or absence of the emulsifying agent, vis-
cosity, specific gravity, water content, and the age of the emulsion. Essen-
tially the.stability of a W/O emulsion could be defined as the resistance that
the dispersed water droplets have against coalescing. Such a definition is
based upon the phenomenon of Brownian movement such that the emulsions having
a high specific gravity and viscosity would tend to be more stable since move-
ment of the water droplets would be theoretically reduced. As noted above,
increases in temperature resulting in reduction of viscosity or increases in
the water droplet concentration in the continuous petroleum phase would in-
crease probability of collision and coalescence thus destabilizing water-in-oil emulsions.
Specific Studies
A number of laboratory studies have been undertaken to study the
formation and behavior of mousse in mixing chambers and wave tanks, and in
most cases evaporation and dissolution were allowed to occur to further simu-
late ambient environmental conditions. In almost all instances, hydrocarbons
with molecular weights less than nC-11 to nC-12 (distillation range 200-225°C)
were lost du~~ng the initial stages of weathering, just as has been noted in
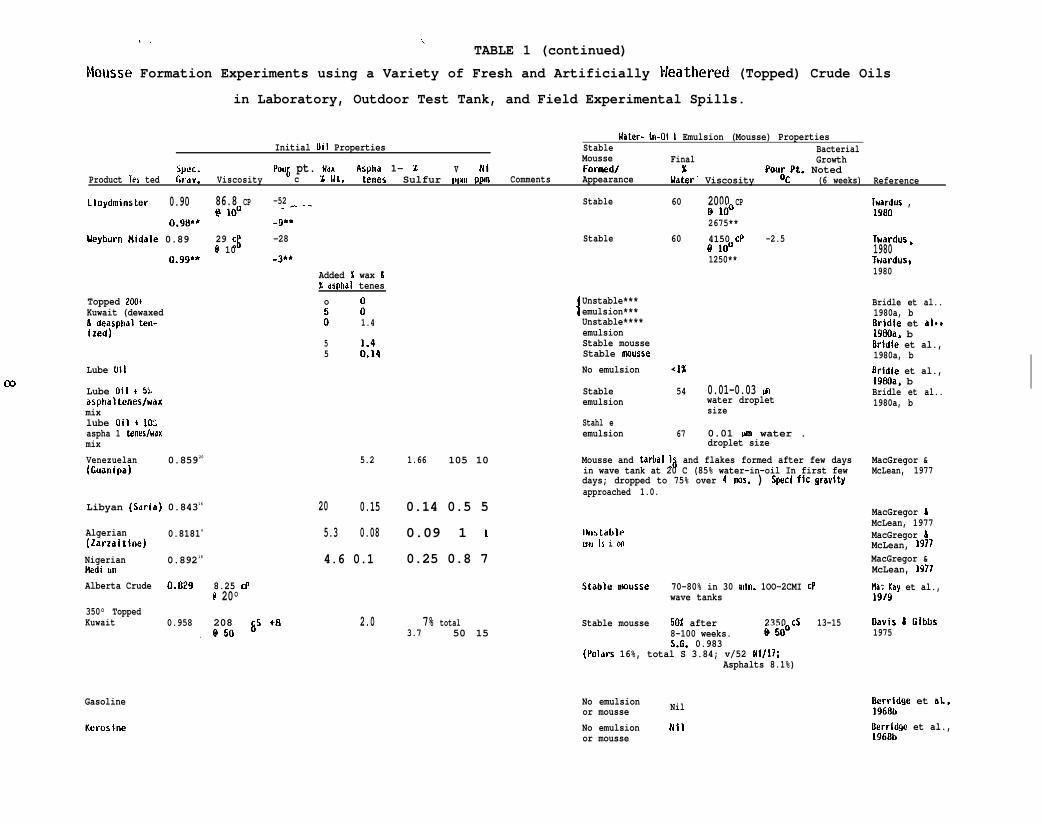
studies of open ocean and near-coastal spills. The results of these studies,
the physical properties of the crude oils, and selected chemical character-
istics of the crude oils and resultant water-in-oil emulsions are summarized
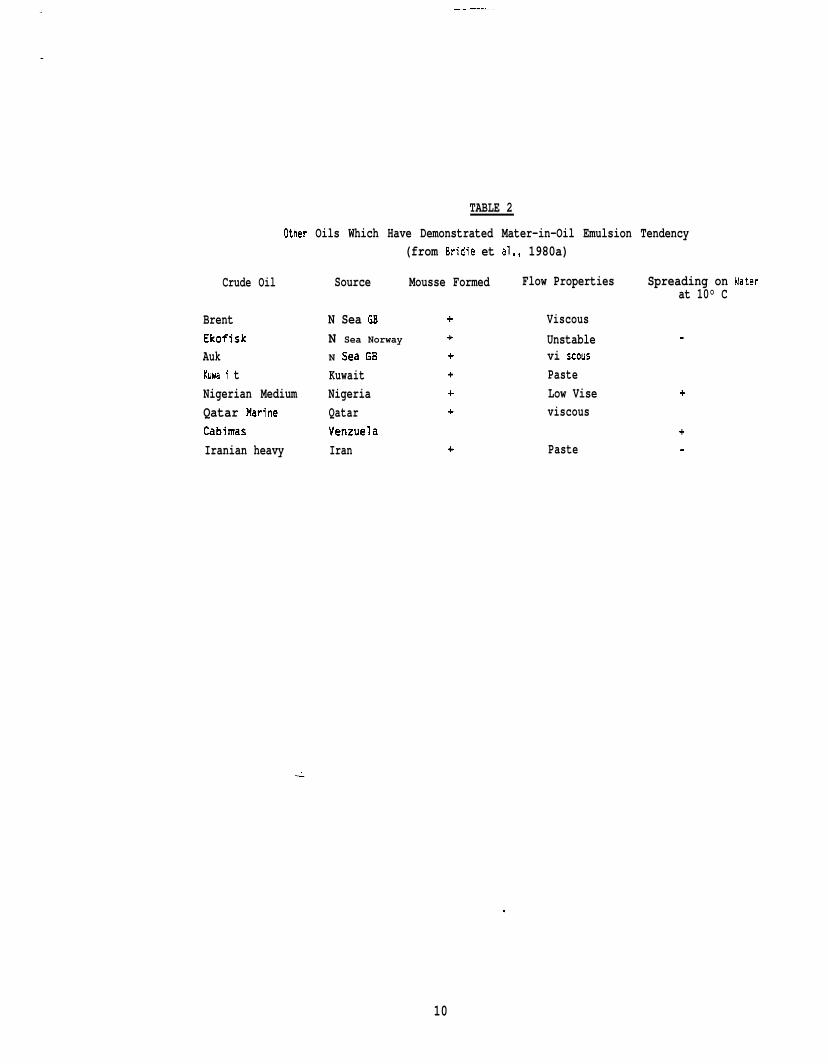
in Table 1. Table 2 lists several additional oils which have demonstrated
water-in-oil emu’lsion tendencies, but for which only limited data are avail-
able.
6

TABLE 1
Mousse Formation Experiments using a Variety of Fresh and Artificially Weathered (Topped) Crude Oils
in Laboratory, Outdoor Test Tank, and Field Experimental Spills.,. I
Water-in-Oi 1 Emulsion (Mousse) PropertiesInltiil Oil Properties Stable Bacterial
% Moussespec .
Final GrowthPou~cPt. Uax Asphal - Z v Nt Formed/ x
Product Ies ted Iirav. Viscosity % Mt. tenes SIII fur pfmpOu$CPt. Noted
Pm Conments Appearance Mater Vlscositv (6 weeks) Reference
Libyan (Brega) 0.829 4.13* 1.2
5. 16* -15.0
11.4 0.13 0.21 5
0.5 0.05 0.19
1.0 0.7 1.33 36
6.) 1.9 1.58 107
6.5 1.3 1.88 25
5.5 1.4 2.5 21
4.8 3.05 1.54 170
kfighly Borderl inel Fatrly fterrldge et al.,parafftnic Dark brown-waxy 78.3 heavy 1968a. b
Nigerian Light 0.061 Ftorderl ine/Yel low 77.3 Heavy Berrldge et al.,Brown-granular t nfesta- 1968a, b
Rigid/foamy
Rigid/mId-brown
Rlgld/dark brown
tlonFairlyheavyVery faw
Very few
somepresent
Very fw
Iran Ian Light 0.854(AI@ Jari)1 ranlan Neavy 0.869(Gach Sdran)
Iraq (Kirkuk) tk.845
5.6* -20.6 79.1
Z7.3
Berrtdge et al.,196fta, bBerridge et al.,1960a, blterrldge et al.,1960a, b
::~g: et ● l.,.
1
8.83* -A2.2
4. 75* -34.4
37
9 Less paraf-flnlc highSulfur
78.3
Kuwait 0.s369 9.6* -31.7 Rigid/mid-brown 79.1
Uenzuela (Tia tt.896Ju.ina Hediun)Mker C 0.990
0.99**Light ArabianCrude
25.0’ -34.4
2.8N10] *7CP @ Iooc
73.8 OQdg: et al. ●
●
Berrldge et al.,1968a, b tTwardus 1900Solsburg et al.,1976; Iwardus19FkoTwardus, 1900Additionaldata on otherw/o ratios m-epresented inthe orfglnalreference.Twardus, 1900
67 2.9x10 7Rtgld & Sticky
Unstable
500-BOOCs k) 20’JC
Norman Mel 1s 0.83
0.93**
8.68 CP -85@ 1o’-’
-8**
.40II
Sweet Blend 0.83 14.2 CP -35@ 100
Unstable 60 458 CP II -4810520**O-94** - ‘- .~2**
Sour Blend o.ft3 -500.94** ● lB** 3000** Twardus, 1900
Twardus, 19G0BOW River 0.90 -2J0.99** (-p 2150**
1, ,.
TABLE 1 (continued)
Mousse Formation Experiments using a Variety of Fresh and Artificially Ueathered (Topped) Crude Oils
in Laboratory, Outdoor Test Tank, and Field Experimental Spills.
t4ater- in-Oi 1 Emulsion (Mousse) PropertiesInitial Oil Properties Stable Bacterial
Mousse Final$ptic. pOU& pt. kix
GrowthAspha 1- Z v Ni Forntid/ % POuJCPt. Noted
Product Ie> ted tirdv. Viscosity c % lit. tenes Sulfur PIXII ppm Comments Appearance Uater” Viscosity (6 weeks) Reference
Lloydminster 0.90 86.8 CP -52@lo” ‘---
o.91t** -9**Stable 60 2000 CP
@ 1002675**
Stable 60 4150 CP -2.5@ 1001250**
Twardus ,198n
Weyburn !iidale 0.89 29 C! -28@ 10
0.99** -3**
Twardus,1980Twardus,1980Added % wax h
% asphal teneso
;i 1.4
Topped 200tKuwait (dewaxed& deasphal ten-lzed)
{Unstable***emulsion***Unstable****emulsionStable mousseStable mausse
Bridle et al..1980a, bBridie et al.,19t30a, bBridie et al.,1980a, bBrldie et al.,19BOa, bBridle et al..1980a, b
55 ;:;4
Lube Oil No emulsion <1%0-3
Lube Oil + 52asphaltenes/waxmixlube Oil + 10Laspha 1 tenes/waxmix
Stable 54 0.01-0.03 memulsion water droplet
sizeStahl eemulsion 67 0.01 urn water .
droplet size
Venezuelan 0.85920
(Guanipa)5.2 1.66 105 10 Mousse and tarbal la and flakes formed after few days
in wave tank at 20 C (85% water-in-oil In first fewdays; dropped to 75% over 4 MOS. ) sped fic gravityapproached 1.0.
MacGregor &McLean, 1977
Libyan (Saria) 0.84316 20 0.15 0.14 0.5 5
5.3 0.08 0.09 1 1
4.6 0.1 0.25 0.8 7
MacGregor 6McLean, 1977MacGregor &McLean, 1977MacGregor &McLean, 1977
Algerian 0.8181 6
(Zarzaitine)
Nigerian 0.89216
Hedi um
Ilnstableemu 1s i on
Alberta Crude 0.B29 8.25 CP@ 20°
Stable nwusse 70-80% in 30 ItIin. 1OO-2CMI CPwave tanks
Ma; Kay et al.,1919
350° ToppedKuwait 0.958 208 fiS +8
,@502.0 7% total
3.7 50 15Stable mousse 50% after 2350 CS 13-15
8-100 weeks. 950°S.G. 0.983
(Polars 16%, total S 3.84; v/52 Ni/17;Asphalts 8.1%)
Oavis 6 Gibbs1975
Gasoline
Kerosine
No emulsion Nilor mousseNo emulsion Nilor mousse
Berridge et al.,1968bBerrldge et al.,196Llb
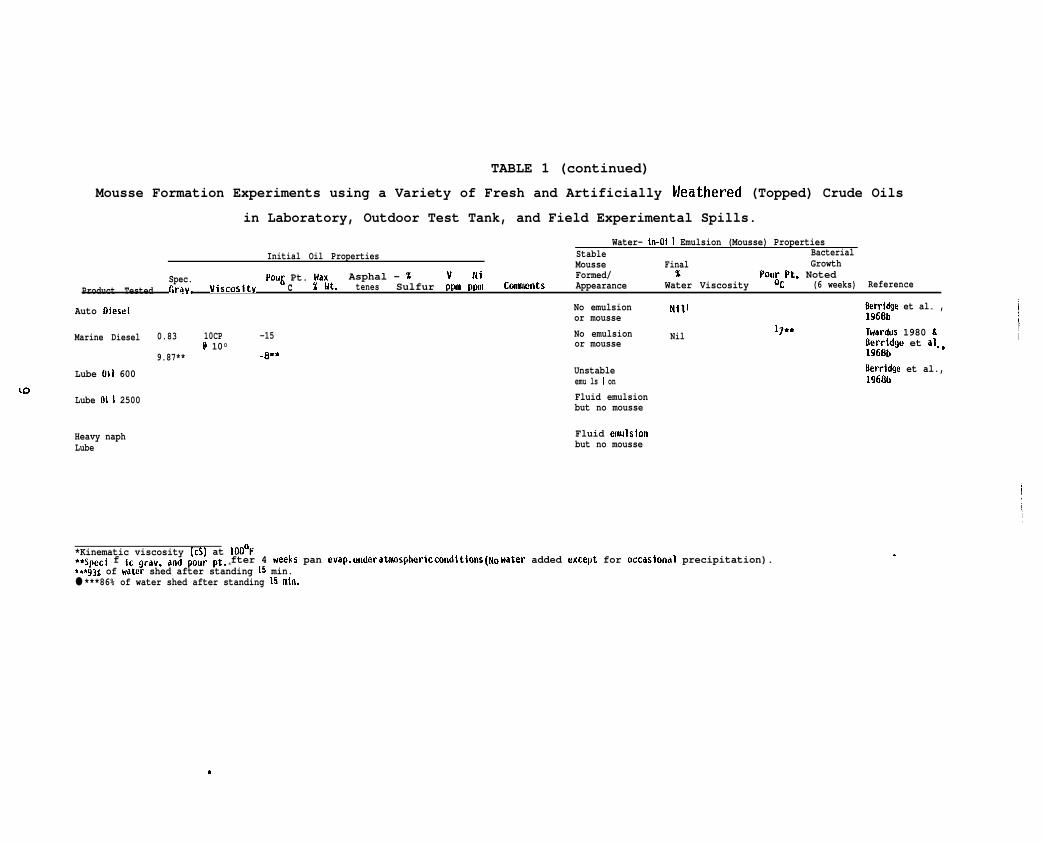
TABLE 1 (continued)
Mousse Formation Experiments using a Variety of Fresh and Artificially Meathered (Topped) Crude Oils
in Laboratory, Outdoor Test Tank, and Field Experimental Spills.
Water- in-Oi 1 Emulsion (Mousse) PropertiesInitial Oil Properties Stable Bacterial
Mousse FinalSpec. Poll& Pt. wax
GrowthAsphal - % v Ni Formed/ x POu[Cpt. Noted
Product Tested Grav. Viscositv c % Mt. tenes Sulfur ppm ppm Conssmts Appearance Water Viscosity (6 weeks) Reference
Auto Oiesel
Marine Diesel
Lube Oil 600
Lube Oi 1 2500
Heavy naphLube
No emulsionor mousse
0.83 10CP -15 No emulsion@ 10° or mousse
9.87** -fI**Unstableemu ls t onFluid emulsionbut no mousse
Fluid emulslonbut no mousse
Nill Berridge et al. ,196Bb
Nil1 J** Twardus 1980 &
Berridge et al.,196fSbBerridge et al.,1968b
*Kinematic viscosity (cS) at 100°F**.jPeci f ic ~rdv. and pour pt. after 4 weeks pan evapa under atmospheric conditions (No water added except for OccaSiOna] precipitation).***93x of water shed after standing 15 min.● ***86% of water shed after standing 15 min.
.
b
—.
TABLE 2
Other Oils Which Have Demonstrated Mater-in-Oil Emulsion Tendency(from Bridie et al., 1980a)
Crude Oil Source Mousse Formed Flow Properties Spreading on Waterat 10° C
BrentEkofisl(AukKuwa f tNigerian MediumQatar hlarineCabirnasIranian heavy
N Sea GBN Sea NorwayN Sea G8
KuwaitNigeriaQatarVenzuelaIran
++++++
+
ViscousUnstablevi ScousPasteLow Viseviscous
Paste
.
+
+.
-
9
10

-.
To study the effects of chemical composition of the starting crude,
Berridge el al. (1968a, b) evaluated mousse formation potential and stability.
for seven crudes which were sleeted co give a representative sampling of oils
likely to cause marine pollution. Specific gravities of the crudes ranged
from 0.829 for Libyan (8rega) crude to 0.896 for the Venezuelan (Tai Juana
medium crude). Sulfur contents for the crudes range from 0.2 to 2.5%, and
kinematic viscosities at 100”F ranged from 4.13 to 25 centistokes. Pour
points for the selected oils ranged from -34 to +7°C, and wax contents were
found to vary inversely with the specific gravity ranging from a high of 11%
by weight for the Libyan crude to 4.8% by weight for the Tia Juana crude.
Additional characterization data are presented in Table 1. Asphaltenes were
found to increase in weight percent from 0.13 to 3.5 and were roughly in-
versely proportional to the wax content. Vanadium content increased with the
increase in specific gravity and percent asphaltenes. Residues with compo-
nents having boiling points greater than 370°C ranged on a weight percent
basis from 35-57% for the crudes studied, and interestingly, the residue pour
points decreased from 100” to 50° going from the light to heavier crudes.
Thus, when spilled at sea, crudes such as the Libyan Zelten (8rega) and the
Nigerian light which have fairly low percentage ranges of residues greater
than 700° will be removed relatively rapidly by evaporation. This effect is
particularly significant for Zelten crude which contains 31% by weight of
components which boil below 200”C. Heavier crudes such as the Tia Juana
medium (78% residue boiling greater than 370°C) contain only a small fraction
which distills at low temperature and thus, it will evaporate very slowly and
would not be expected to weather significantly at all by evaporative processes.
The weathered residues which result from the evaporative processes
acting on all the oils studied had higher specific gravities, viscosities,
sulfur, metal and wax content than the original crudes. For example, Kuwait
crude has a residue with boiling point above 1000”C which constitutes about
27% of the original material, and this residue has a specific gravity of
1.023. Similarly, Iranian heavy crude residue has a specific gravity of
1.027, and as such, these residues have densities greater than seawater
(1.025) and would be expected to sink relatively easily.

_... _—. .—. .
Rigid stable emulsions were formed with most of the oils tested with
the exception of Brega and Nigerian light crude which were classfied as border-
line. Colors ranged from mid-brown to dark oiley-brown to a yellow brown
granular substance with the Nigerian light curde. No mousse could be gener-
ated using distillants such as gasoline, kerosene and diesel oils. Lubricat-
ing fluids did not form stable “mousse” but emulsions which were either
unstable or fluid could be generated. Residual fuel oil (Bunker C) did form a
stable mousse. In general, variation in the size of water droplets appeared
to correlate with stability, and the Brega and Nigerian crudes which contained
the relatively largest water droplets “showed the least stability and thegreatest potential of the water to return to separate phases. The more stable
mousses had water droplets with diameters not greater than 1 micrometer.
The effect of salinity was also investigated, and mousse type emul-
sions were obtained with Kuwait crude and Tia Juana crude with water contents
ranging from 74 to 80% regardless of salinity. A stable emulsion was formed
in all cases, but the appearance of the mousse ranged from a mid-brown for
Kuwait crude with seawater to a mid-gray-brown using tap or distilled water.
Tia Juana crude with seawater formed a very dark brown mousse whereas the
mousse formed with tap water and distilled water was nearly black. To evalu-
ate other factors affecting this formation, oil and water were filtered
through Iihatman #l filter paper to remove particulate above 100 microns and
in several instances the water was sterilized by the addition of 500 ppm
dichlorophen. In general, these perturbations did not affect the water con-
tent or mousse appearance.
Mous~e stability was measured by placing 425 ml of mousse from the
different crudes on glass plates and allowing them to weather naturally under
environmental conditions. Identical samples were also placed in 2 gallon
buckets and were then agitated with bubbles from below. Stable mousse on the
glass produced an oil fringe while maintaining a rigidity overall, while less
stable mousses deformed or slumped and flowed off the glass under the influ-
ence of wind, gravity and rain. Estimated losses due to weathering of so-
12

— _.— —. .— —. . ._ —___. ..—.—
called beached mousse ranged from 10% for Kuwait crude to 80% for the 8rega
crude which was a much softer waxey mousse. Nigerian crude oil mousse was
very granular on the plate and formed a waxey or oiley and foamy mousse.
Microbial populations were observed to grow with Kuwait mousse with only very
few bacteria present for Tia Juana crude, Iraq, Kirkuk and Gatch Seran. Heavy
bacterial infestation was observed with the Nigerian light, the Brega crude,
and the Iranian (Aja Jari) crudes. Bacterial infestation on samples of mousse
floating on aeriated seawater was observed, but the most stable mousses again
appeared to have the least bacterial growth. During experimental periods
ranging up to 6 weeks there was little evidence to suggest that bacterial
growth was sufficient to remove the mousse. In fact, with the stranded mousse
there was slight evidence which suggested that the presence of bacteria
marginally increased the stability, but the presence of particulate material
had no effect. With regard to water loss on stranded mousse the two lighter
crudes (Brega and Nigerian) showed the greatest percent water loss, ahd they
also had the highest infestation of bacteria.
Of all the parameters studied, specific gravity and kinematic vis-
cosity showed the most positive correlation with mousse stability. Inter-
estingly, pour point showed no correlation with mousse stability. With regard
to chemical composition, the percentage residue boiling above 370”C, the
asphaltene content and the vanadium content all showed a definite correlation
while acidity, sulfur content and wax content showed little or no significant
correlation with mousse stability.
The lack of bacterial activity noted with several of the mousse
samples on the aerated seawater was attributed to the lack of phosphate and
other nutrients or possibly due to toxic materials inherent to several of the
crudes.
Oavis and Gibbs (1975) used a 350”C topped Kuwait crude (to eliminate
viscosity and density changes due to evaporation losses) to study long-term
oil and mousse behavior over a two year period in closed and flow-through
—.—-— ——.
,
exposure tanks in Portsmouth, England. The tanks were filled with seawater
and 23 liters of oil was added. The authors stated that in retrospect, how-
ever, it would have been better to add less oil and leave some of the water
surface uncovered because the oil proved to be a barrier to oxygen transfer
leading to oxygen depletion in the closed tanks. The initial oil thickness
was about 0.7 cm, but after taking up water the “mousse” reached an ultimate
thickness of about 1.4 cm. The most significant effects occurred during the
first nine weeks with water content in the mousse approaching 50%. Vanadium
and nickel were not lost over the 2 year period of the experiment, however,oxygen content increased in the oil from 0.2% in the crude to 3.9% and 2.8% in
the mousse in the flow-through and closed tank systems, respectively. The
pour point of the oil increased from 8 to 11° during the first day with the
water content going from O to 0.8%. After one month the water content had
increased to 10% and the pour point of the oil was 15°C. The final 50% water-
in-oil mixture was obtained after 2 months and remained relatively stable for
the 2 year period. Viscosity increases from 216 to 2350 centistokes at 50”C
were noted, and the specific gravity of the residue changed from 0.9525 to
0.9825. The percent asphaltenes increased by a factor of four from 2-8%.
Polar constituents also increased from 7 to 16%, presumably due to the incor-
poration of oxygenated products. N-alkane components decreased more rapidly
in the open tank presumably due to microbial degradation, and time series
graphs of water content, pour point, percent asphaltenes, specific gravity arid
viscosity were presented for the water-in-oil emulsion over the 2 year period.
with regard to mass balance, it was observed that no net loss of the mousse
occurred over this time, and the very slow rate of degradation of the water-in-
oil mousse over the 2 year period was attributed to the limited diffusion of
oxygen and/o~ minerals into the mousse. Thus , it was suggested that aside
from removal if n-alkames in the open system, microbial biodegradation was not
a major process causing observed changes.
MacGregor and McLean (1977) investigated the weathering behavior of
Venezuelan crude oil (Guanipa) on synthetic seawater in a fiberglass tank
equipped with a wave generator and a controlled radiation system located in an
.
.———. — —_——. . .——. .—
environmental chamber held at 2°C. The crude oil studied in this experiment
had negligible wax content, but asphaltenes were measured at 5.2%, and .Signifi-
cant trace metals (vanadium-105 ppm and nickel-18ppm) were measured in the
oil. The total sulfur content was 1.6%, and the specific gravity was 0.859
grams/ml in the original oil. Evaporation removed the largest quantity of
material , and the rate of evaporation was observed to vary directly with ex-
posure time to solar radiation. After 400 hours, losses due to evaporation
ceased with approximately 85% of the oil remaining. Only minimal amounts of
oil were lost by sinking or solution, although these factors were observed to
increase with time. The most notable change was a rapid formation of stable -
water-in-oil emulsions which eventually formed discreet lumps or tar balls;
this occurred within a few days after the spill. During the four month period
of the experiment, these tar balls remained very stable, and they drastically
reduced weathering effects by reducing the oil contact from the air-sea inter-
face. During the mousse and tar ball formation a rapid increse in water
content to 85% occurred during the first few days, whereas this dropped off to
approximately 75% at the end of the experiment. The tar balls which were
observed after about 2 weeks had a flake like appearance similar to that
observed in the Potomac and IXTOC spills
Case Histories). Water content was noted
smaller lumps having lower concentrations
was attributed to entrapment of pockets
(which wi 11 be discussed later under
to vary with tar ball size, with the
of water than the larger ones. This
of water in the form of droplets
inside the larger tar balls. During the first few days of the experiment, thespecific gravity was noted to increase rapidly leveling out at approximately
1.0 compared to the seawater density at 1.027 at 2“C. When water content was
taken into consideration the real increase in crude oil specific gravity (due
to evaporation and dissolution alone) was from 0.85 to approximately 0.93.
Concentrations of oil dispersed in the water or in true solution
increased rapidly to approximately 2 ppm and then continued to increase as
time progressed. After 500 hours, the oil concentration in the water was 15
ppm, and was still increasing. Only 2-3 ppm was expected to be in true solu-
tion with the dispersed oil making up the difference. The authors analyzed
15
_—. —. ..— ——— ———-
the outer surface of the tar
significant difference in the
concentrations were found to
balls compared to the inner materials, and no
n-paraffin distributions was reported. Nickel
decrease approximately 30% at the end of the
experiment, however, vanadium concentrations increased slightly by
10-15%. Because of the lack of differences in external and internal
composition in the tar balls, the authors attributed their formation
from mechanical break-up of the parent mousse from available wave
about
al kane
to be
energy
rather than from additional
Nagata and Kondo
crude O?lS in 6m x 2m x Im
to interact with the oil.
or extended chemical weathering effects.
( 1977) studied the artificial weathering of five “ .
deep tanks where wind , waves and rain were allowed
Changes with elapsed time of physical and chemical
properties were measured for Arabian light crude oil, Iranian heavy crude oil,
Kuwait crude oil, an unspecified heavy oil A (50*C viscosity below 20 centi-
stokes and flash point 60*C) and heavy oil B (50°C viscosity 20-50 centi-
stokes, and flash point 60-70*C). Twenty-one day experiments were conducted
and measurements of specific gravities, viscosities, and the amount of water
incorporated were made in addition to gas chromatographic analyses of the
oil. The heavy oil A showed the least change; heavy oil B and Arabian light
crude oil exhibited similar and median changes and Iranian heavy and Kuwait
crude showed the most significant changes, particularly during the first three
days. Specific gravities for these mixtures ranged from 0.87 to 0.98 after 7
days, and constant values were approached after 21 days when an oil-in-water
type emulsion was formed. The specific gravity closely paralleled the change
in the amount of water in the oil, with the Iranian heavy crude and Kuwait
crude showing, the most significant increases which paralleled specific gravity
increases. If was also stated that evaporation was found to be greatest in
the cases of non-emulsified oils. Microbial degradation was reported to be –
approximately 30% for hydrocarbons below nC-15 after 5 days. Hydrocarbons
above nC-15 remained unchanged at that time, whereas about 50% of the n-
alkanes were degraded after 15 days. Photochemical decomposition studies
illustrated that secondary and tertiary paraffins were more easily decomposed
relative to normal n-alkanes, and this was attributed to the Iowerec activa-
16
—...—. .._ __ ——_— — . . . .— —-————- .- ———.. — —
tion energies encountered in breaking tertiary C-H bonds during the oxidation
process. A number of aromatic compounds were also shown to be removed by
photo-decomposition. These included anthracene, phenanthrene, l,2-benzo-
anthracene, chrysene, fluourene, pyrene, 3,4-benzo-a-pyrene, benzothiophenes
and dibenzothiophenes. All of the compounds were decomposed; however, the
rates of the individual compounds were very different from one another.
Anthracene, phenanthrene and 1,2-benzoanthracene were rapidly decomposed in
comparison with the other aromatics, and sulfur containing hetero-aromatic
‘compounds showed the same approximate degree of decomposition as compounds
with anthracene rings when pure compounds were tested. When a mixture of the
hetero-atoms and aromatic compounds were examined, the aromatic coupounds were
quickly deocmposed with the sufur containing hetero-aromatic materials remain-
ing longer.
130card and Gatellier (1981) generated water-in-oil emulsions with
Arabian light crude oil topped at 150°C, Safanya, and heavy fuel oil. Gen-
erally, viscosities greater than 10,000 centipoise were obtained with all
three oils while the viscosity ranged from 10,000 to 20,000 for the Arabian
light, from 20,000 to 50,000 for the Safanya and from 60,000 to 80,000 for the
heavy fuel oil depending on mixing speed. All of the measurements indicated a
plastic like behavior for the emulsions and the viscosities were shown to
decrease as the shear rate increased. Microscopic examinations of the 75%
water in Arabian light crude oil mixture showed that like other studies of
mousse formation, most of the water droplets, were from 1-10 micrometers in
diameter. These authors found that Nigerian light or Zarzatine (both low
asphalt content crudes) did not form stable emulsions. They noted however,
that the higher viscosity oils formed emulsions apparently independently of
asphalt content.
Twardus (1980) has studied the characteristics of water-in-oil emul-
sions for 8 oils, and the stability of the resultant mousses vs. water content
is represented in Table 1. It is interesting to note, however, that the
observed increases in viscosity due to mousse formation were very similar to
17
—.
viscosity increases due to simple evaporation in pan experiments completed
using the same crudes and petroleum products (Twardus, 1980). In the evapora-
tion experiments no seawater was added, however, the pans did accumulate some
water from rain and snow fall. When this occurred, the formation of water-in-
oil emulsions with several of the crudes and Bunker C fuel oil was noted. Theevaporative loss of hydrocarbons (primarily within the C-4 to C-14 range) was
most significant in the pan evaporation experiments during aging intervals of
6 hours, 1 day, and 2 days. For longer aging periods (1-4 weeks) hydrocarbon
evaporation occurred at much lower rates. Evaporation of components from
marine diesel fuel oil and Bunker C were relatively insignificant in the pre-
vailing sub-arctic weather conditions, primarily due to the low percentage of
volatile hydrocarbons in these fuel oils.
The percent water incorporated into the emulsions was significant for
the stability of mousse formed with Norman Wells crude and Sweet Blend crude.
With the first mixture, mousse which exhibited marked stability for several
hours could only be formed with 50:50 and 40:60 water-to-oil ratios. ForSweet Blend crude, only 60:40 water-to-oil and 50:50 water-to-oil ratio pro-
duced mousse which was stable for several days. At greater water concentra-
tions the mousse separated followlng formation. For the other oils tested,
Bow River, Lloydminster and Wabern-Midale, stable mousse was formed at water-to-oil ratios ranging from 20% to 60%. As in other experiments, no stable
mousse could be formed using marine diesel fuel.
mousses were in general higher than those of the
Norman Wells and Sweet Blend crude oil mousses, the
The pour points for the
fresh oils, but for the
pour point was less thanthat of the residue obtained by
Crude oil mousse, the pour point
pan evaporation experiments in the
simple evaporation. For the !dabertl-Midale
was very similar to that obtained from the
absence of added seawater.
In order to alleviate problems of density changes due to this evapora-
tion behavior, Mackay et. al. (1979, 1980) used a 25% weathered Alberta crudeoil and measured changes in viscosity as a function of water uptake. Their
emulsion studies were conducted in wave tanks, and they have perhaps completed
18

. . — —— —
the most thorough examination of the competitive processes of oil-in-water
dispersions vs. water-in-oil emulsion behavior. During the first ten minutes
after a spill of Alberta Crude oil (SG 0.829, viscosity 8.25 cP) the dominant
process was the dispersion of oil droplets into the water column with concen-
trations of 20-50 mg/1 being reached. It was speculated that concentrationswould increase approaching limiting values at which dispersion and coalescence
rates would be equal, however, this was not observed. Instead, after approxi-
mately 20 minutes, the concentrations in the water columm fell and settled out
at a steady 10 mg/1 after 1 hour. This drop in concentration was noted to
coincide with a sign~ficant change in oil appearance, water content, and vis-
cosity. The water content in the oil increased to 70-80% volume within 30
minutes, and the viscosity correspondingly increased to 100-200 centipoise.
The slick underneath the waves was noted to be thicker at wave crests and thin
in the troughs, and significant formation of neutrally buoyant water-in-oil-in-
water droplets was observed. Additional details of their studies as they
relate to modeling water-in-oil emulsion formation are presented later in the
discussion of modeling and computer simulations.
In several of the studies cited above, the authors also noted that
mousse stability was inversely proportional to the size of the water droplet
entrained in the emulsions. In general, mousses with 1-10 micrometer diameter
water droplets were the most stable up to 70-80% water.
Although mousse can contain anywhere from 1O-8O% water, emulsions
with less thannation suggest
These mousses,
dustrial fuel
viscous oils
that viscous
less than 500
50% water generally have characteristics which on visual exami-that the oil properties are similar to that of a neat oil.
are generally free-flowing fluids with the consistency of in-
oils. Laboratory studies on spreading properties of several
(with viscosities greater than 40,000 centipoise at 25°) showed
oils behaved differently than non-viscous slicks (viscosities
centipoise) and that spreading was significantly inhibited.
19

Identification of Emulsifying Agents Responsible for Mousse Formation
Berridge et al. (1968b) found some correlation between the asphaltene
content and stability of the emulsions formed. Mackay et al. (1973) attempted
to determine the nature of the asphaltic compounds responsible for the sta~il-
ity of the mousse and like Canevari (1969) they concluded that each water
droplet was encapsulated in an envelope of surfactant type molecules having a
plastic nature preventing coalescence of the water droplets due to altered
interracial oil-water tensions.
The exact nature and identity of the surfactants responsible for this
behavior have yet to be completely elucidated, and most laboratory studies
indicate that slightly different factors are responsible for emulsion forma-
tion in different oils. In the crudes studied by Berridge et al., 1968b, the
percentage of residues boiling above 370°C, the asphaltene content and the
vanadium content all showed a definite positive correlation while acidity,
sulfur content and wax content showed no correlation with mousse stability.
On the other hand, Bridle et al. (19i30a,b), in working with dewaxed and de-asphaltenized Kuwait crude and refined lub oil, found that wax content, in
combination with asphaltenes, did play a significant role; these observations
are discussed in detail below. Berridge et al. ( 1968b) found that water-in-
oil emulsions generated with high asphaltene content crude oils were stable
for many months on exposure to the elements on glass plates and on aerated
seawater surfaces. These data suggested that the surface-active materials
responsible for mousse formation were components of the non-volatile residues,
and they were, believed to most likely be asphaltenes and possibly metallopor-
phyrins. Whefl an artificial blend of Tia Juana crude was made by mixing
various portions of all of the distillates except for the 30% vacuum residual,
no mousse could be artificially generated, although it was stated that the
metalaporporines were reasonably volatile enough to have been present in the
distillates. Thus, it was assumed that the asphaltenes were primarily respon-
sible for mousse formation. These authors also reported that the presence or
absence of particulate material or bacteria did not apparently affect mousse
20
-——. . —_._—— —.. .
formation or the stability of the stranded mousse on land or on seawater sur-
faces, although some evidence suggested that under certain conditions, mousse
formation can be stabilized due to the presence of bacterial slime.
Zajic et al. (1974) found that a pseudomonas growing on #6 fuel oil
or on aliphatic hydrocarbons formed an extra-cellular emulsifying agent which
appeared to be a higher molecular weight polysaccharide. It was found that
the emulsification behavior of this extra cellular material was not affected
by temperature as low as 6“C, however, when 3% sodium chloride was added to
the mixture the emulsion broke up and a patch of surface oil was produced
along with oil pellets from 1-2 mm in diameter. Mhen Pseudomonas aeruginosa
and two yeasts Candida petrophilus and & tropicalis were grown with hexa-
decane as a sole carbon source, the organisms produced extra cellular emul-
sifying agents (Friede 1973 and Guire et al. 1973). These materials were
believed to also contain polypeptides because they could be partially de-
stroyed by pancreatic lipase suggesting some protein components.
- As noted above, Bridie et al.” (1980a ,b) have examined the emulsion
forming tendency of various crude oils and found that contrary to Berridge et
al.’s results, the presence of wax and asphaltenes had significant effects on
emulsification. A 200° topped Kuwait curde oil fraction was deasphaltized by
30-fold dilution with pentane and then de-waxed by 6-fold dilution in methyl
ethyl ketone dichloromethane mixture. Attempts to form a water-in-oil emul-
sion failed as the mixture lost 90% of its water after standing 15 minutes.
The water-in-oil mixture from the treated oil plus the original wax exhibiteda similar behavior, whereas the “mousse” from treated oil plus original
asphaltene co!ntent showed loss of 86% of its water content after standing 15minutes. Th U’S , neither the original wax or the original asphalting content
alone were responsible for stable mousse formation. When the treated oil plus
original wax content and original asphaltene content were mixed, a stable
mousse was generated, and a stable mousse was also found with the treated oil
plus the original wax content and only 10% of the original asphaltene content.
Thus, it appeared that components in the wax were important for mousse genera-
tion, although the asphaltene fraction played a more significant role. When
21

._-.. —— --. —
various lube oils were treated with 5 and 10% mixtures of the asphaltene-wax
mix, stable emulsions with water content ranging from 57-67% could be formed.
Mater droplet size in these emulsions ranged from 10 to 30 micrometers. No
emulsion was formed with the lube oil blank in the absence of the added
asphaltene/wax mix.
Products of photochemical and auto-oxidation have also been impli-
cated in mousse stability. Thus, while rigid emulsions could not be formed
with fresh 3rega and Nigerian light crude oil (Berridge et al. 1968b), stable
mousse with water contents ranging from 67-84% were obtained using artifi-
cially weathered Brega and Nigerian crudes. Similarly, Bocard and Gatellier
(1981) examined the effects of photo-oxidation on mousse stability by irradi-
ating a thin layer of oil (0.3mm) with a fluorescent lamp emitting ultraviolet
and visible light between 300 and 450 nm with a maximum at 365 nm. In this
procedure, Arabian light crude (topped at 150°C) produced oxygenated products
corresponding to 0.08% after 132 hours. In general, it was found using
Arabian crude and Zarzatine 150°C (a crude with very 1 ittle asphalt), that
emulsions made with unoxidized oil were very unstable whereas the emulsions
made with the photo-oxidized oil were particularly stable.
Auto-oxidations resulting from free radical chain processes (with the
rate of propagation being controlled by the rate of proton extraction from the
hydrocarbon by alkyl peroxide radicals) have also been demonstrated to occur
in oil-in-water mixtures. In addition to a number of oxygenated products
which can be formed by these reactions, higher molecular weight polymerizationproducts in the oil itself can result in enhanced mousse stability. In gener- ~
al, tertiary free radicals are found to be mare stable than those from primary
or secondary hydrocarbons, such that isoprenoids leading to tertiary free
radicals can be attacked more readily. Alkyl-substituted aromatics such as
tetralin and cumene where alkyl-radicals can be resonance stabilized are also
rapidly removed by auto-oxidation. Photo-oxidation can compete with auto-
oxidative processes, however both processes are affected by the presence of
vanadium and other metals of variable valiance which have been shown to
22
strongly catalyze oxidations. Sulfur compounds, on the other hand, are
believed to inhibit oxidation due to terminating reactions caused by sulfoxide
formation, so all of these factors singly and in combination can affect mousse
formation and stability. The water soluble carboxylic acids, ketones, alde-
hydes,
cesses
higher
tional
alcohols, sulfoxides, peroxides etc. which are formed by these pro-
are rapidly removed from the surface of the oil leaving a more viscous
density residue. Once mousse formation has occurred however, addi-
photo-oxidation of the etnulsion or resultant tarry lumps must be ex-
tremely slow because of the lowand auto-oxidation would tend to
viscous and diffusion controlledtrate into the interior of the
surface area to volume ratio. ‘That is, photo
be limited to the external surfaces of rather .
emulsions where oxygen and light cannot pene-
mousse.
Mexico very few oxidation products were
lected during the Researcher cruise, and
photo-oxidation products were presumably
very soon after the time of formation.
In the IXTOC spill in the Gulf of
obtained in the mousse samples col-
it was concluded that most of the
leached from the material near or
Klein and Pilpel (1974) reported that viscous oil slicks actually
appeared to contract as photo-oxidation proceeded, and this was attributed to
polymerization of the petroleum components and to the resulting increased
viscosity which restricted diffusion of oxidation products to the oiT/water
interface. In this instance, then, photo-oxidation could thereby help gener-
ate intractable tarry residues and stabilize water-in-oil emulsions. Burwood
and Spears (1974) exposed surface slicks of crude petroleum to artificial
light to examine the effect of dissolution of specific petroleum hydrocarbons
in seawater. They postulated chat indigenous auto-oxidizable hydrocarbons
could react photolytically with thiacyclanes to form complex water solublemixtures of thiocyclane oxides. _ Such compounds were detected in seawater
following prolonged equilibrium with a medium sulfur content middle east crude
oil, and the compounds showed up as a mixture of high boiling water soluble
components reflected as an unresolved complex envelope in the nC-15 to nC-23
range of the water sample extracts. The area of this UCM increased signifi-
cantly as the photo-degradation of the oil progressed, and Burwood and Spears
23

— -— ..——
(1974) suggested that such a process might explain the loss of sulfur mate-
rials during weathering of crude oils at sea such as that which occurred in
the Torrey Canyon spill. Similar loss of sulfur containing hetero-aromatics——specifically, benzothiopherte and dibenzothiophene were observed in the IXTOC
spill where it was believed that formation of sulfoxides caused these mate-
rials to be preferentially leached from the bulk oil before and during mousse
formation.
Physical and Behavioral Properties of Water-in-oil Emulsions
The significant increase in viscosity and specific gravity observed
for many water-in-oil emulsions affect their behavior in seawater including,
spreading, dispersion, interaction with suspended particulate material andpresumably evaporation and dissolution. Twardus (1980) indicated that no
quantitative data existed on mousse effects on evaporation, but that
suspected that once mousse formation occurred evaporation would occur
duced rates. Similar results have been suggested by Nogata and Kondo
In our field programs on sub-artic weathering of crude oils, we have
it was
at re-
(1977).
studied
the quantitative loss of lower molecular weight volatile components from fresh
Pru~hoe Bay crude oil and artificially (shaker-table) generated mousse where *
evaporation was prevented during mousse formation in a sealed teflon con-
tainer. Figures 1 and 2 present Flame Ionization Detector-temperature pro-
grammed gas chromatograms of the volatile components released from fresh
Prudhoe Bay crude oil and freshly generated mousse, respectively, on outdoor
flow-through sea water aquariums where turbulence was induced by propellar
mixing. The ,water and air temperatures at the time of sampling were 6° and
6-12”C, respectively. The volatiles shown in these chromatigrams were trapped
by vacuum pumping measured volumes of air (sampled 1-2 inches above the slick)
through stainless steel columns packed with Tenax’” 1.0 and 1.5 hours after the
fresh oil and mousse were spilled on the water surface of the tanks, respec-
tively. These traps were then capped with stainless steel Swagelokm fittings
and stored at room temperature until analysis in the laboratory. Back-up
columns, in series with the front columns showed no break-through of lower
24

.— .—-— . —— -- . . . .
t —r t%. . .J .-: METHYLBUTANE
+ 2 7. 3 0 OCTANE
?
3B. 7531.5s XYLENE
33.21
35.3636.46
L
1 33.53
41.91
}44.98 NONANE
FIGURE 1. FLAME IONIZATION DETECTOR - TEMPERATURE PROGRAMMED GAS CHROMATOGRAPHICANALYSIS OF TENAX-TRAPPED VOLATILE COMPOUNDS LOST FROM FRESH PRUDHOE BAYCRUDE OIL AFT~R 1 HOUROF W~ATHERING (WITH TURBULENCE) ON SEAWATER. WATERTEMPERATURE 6 C, AIR TEMP 6 C). (FROM PAYNE ETAL., 1981b.)
25

— .-
FIGURE 2.
‘;TF!RT .. l.+? PROPANE
*:.3; ‘2
-E. .4e CYCLOPENTANE
METHYLBUTANE
.ti. i= CYCLOHEXANEMETHYLPENTANE
c L BENZENE
t
i\
+.~’=BUTANE
lS.SS PENTANE
41.93
44. 9%
\ 43.0S
, S T IFLAME IONIZATION DETECTOR - TEMPERATURE PROGRAMMED GAS CHROMATOGRAPHICANALYSIS OF TENAX-TRAPPED VOLATILE COMPOUNDS LOST FROM FRESH PRUDHOE BAYMOUSSE (80% WATER) AFTER 1.5 HOURS OF WEATHERING (WITH TURBULENCE) ONSEAWATER ( WATER TEMp 6°c, AIRTEMP 6°c). {FROM PAYNE ETAL., 198~b.)
26

..----
molecular weight materials, indicating 95+% recovery on the front traps.
Interestingly, the qualitative appearance of the chromatigrams of the vola-
tiles from both systems are remarkably similar, and the time series data pr~-
sented graphically in Figure 3A and 3B illustrate that essentially identical
losses of lower molecular weight compounds ranging from butane to xylene were
obtained for both the fresh oil and fresh mousse. The data in Figure 3C and
3D, however, show l o n g e r retention of these corn~ounds in mousse spread on
s e a w a t e r in the absence of turbule~ce. One of the static (non-mixed) mousse
systems was treated with Carexit 9527 imme~iately after the spill (3D), but
this did not apparently affect evaporative loss compared to the non-dispursant-
treated control ( 3C). Figure 4 presents computer-generated time series con-
centration profiles from capillary FID gas chromatographic analyses of the
intermediate and higher molecular weight components remaining in the oil and
mousse from the well stirred tanks. Kovat indices for the compounds in each
plot are identified in the figures. These data illustrate that compounds in
the range of NC-9 through nC-11 are- preferentially retained in the mousse
sample for longer time periods. Figure 5A and 5B show the time series concen-
trations of components with kovat indices ranging from 1300 to 2000 for the
oil and mousse samples, respectively. A similar relative increase in these
higher molecular weight compound concentrations (ug/g oil) is noted for both
the oil and mousse after approximately 25 hours, and this is due to the re-
moval of significant mass of the oil from evaporation of the lower molecular
weight components (compounds with molecular weights above nC13 are not lost
during this time frame). The absolute concentrations of the individual compo-
nents in each of the mousse sample plots (on a ~g/g of mousse basis) are lower
than those of the fresh oiT because of the additional mass of the seawater
(80% by weight) in the water-in-oil emulsions. Thus, in the presence of turbu-
lence in these studies, the higher viscosity of the 8il% water-in-oil mousse
did not significantly affect evaporative loss of the lower molecular weight
components boiling below xylene, but some reduction in “evaporation was noted
for intermediate molecular weight compounds (kovat Index 800 to 1100) in the
mousse. More s’~g~~ficar?t differences were noted in the amounts of oil a n d
fresh mousse that were dissolved and dispersed into the water column due to
,
27

L&o
;0.3
mctiq, I
Lo
0.1
0.01
.
\
0.01 110 a mR nd’hu (n)
$0 40 m lm
1.0 Jj -4 -> -z -
0.1
~~
s-4-s-2-
71m *
Bci2yExuc
1
-2t
o.01 Jo m 40 m 40 tm lb
nu Mn Snu (*I
FIGURE 3. TENAX TRAP/FIrI G& DATA ON SUB-ARCTIC VOLATILE COMPONENT LOSS FROMPRUDHOE BAY CRUDE OIL AND MOUSSE ON FLOW-THROUGH SEAWATER ENCLOSURESIN KASITSNA BAY, ALASKA. A) FRESH OIL AND TURBULENCE; B) FRESHMCIUSSE AND TURBULENCE; C) FRESH MOUSE (NO TURBULENCE).MOUS~E AND COREXIT 9527 (NO TURBULENCE). WATER TEMp 66 C~)A~~E~[Mp6-13 C. (FROM PAYNE ET AL., 1981b. ) .
28

-. .——
A
:
c
. .
..”
B
.:
0a
.
*
00.
Trnc IFRslX.c W. 9 -J ia. s 1Z5. O 154.:
rrm. IHffsllx
FIGURE 4. COMPUTER GENERATED PLOTS OF CAPILLARY FID-GC DATA ON INTERMEDIATE MOLECULARWEIGHT COMPONENTS REMAINING IN PRUDHOE BAY CRUDE OIL AND MOUSSE WEATHERINGUNDER SUB-ARTIC CONDITIONS ON FLON-THROUGH SEAWATER ENCLOSURES AT KASITSNABAY, ALASKA. KOVAT INDICES ARE IDENTIFIED ON EACH PLOT. A AND B FRESHPB CRUDE AND TURBULENCE; C AND D FRESH PB MOUSSE AND TURBULENCE.TEMPERAT!JREAS IN FIGURE 3. (FROM PAYNE ET AL.,
1981b.)
29
. — —— —. .—
.
n,
00.
a.c s.a ?59 lX. C 125.0 15% : ;1TIME IW?st
a ,a. 3 a.o 9.5 7s.0
Im.o 12s.s lsn. a !7s.0Hilt [I’m]
FIGURE 5. COMPUTER GENERATED PLOTS OF CAPILLARY FID-GC DATA ON HIGHER f-10LECIJLARWEIGHT CO}!PONENTS RENAINING 1;4 PRUDHOE BAY CRUDE OIL AND i?OUSSE P!EATHERIf!GUNZJER SUB-ARCTIC CONDITIONS ON FLOW THROUGH SEAMATER ENCLOSURES ATKASITSNA BAY ALASKA. KOVAT INDICES ARE IDENTIFIED ON EACH PLOT. ANDENVIRONMENTAL CONOITIONS AREAS IN FIGURE 3. (FR0M pAyNE ETAL., 1981b.)
30

.—— . .. —-- .
the turbulence regiern, and Table 3 presents the time series water column con-
centrations for the two systems. The three orders of magnitude difference
between the fresh oil and fresh mousse systems clearly reflects the latter’s
resistance toward dissolution and dispersion into droplets.
Differences in the rates of volatile components from mousse and fresh
Oil may affect the flash point and burn point, but more significant pertiba-
tions to oil combustabillty probably result from simple incorporation of
water. Twardus (1980) has provided the most complete characterization of the
combustibility and other physical properties of aged oils and emulsions. The
flash point, fire point, viscosity and pour point were all found to go up
significantly as the percent of water increased. Thus, longer pre-heating and
ignition times were required for water-in-oil mousse, and it was noted that
since these emulsions do not spread as rapidly, evaporation and flame propaga-tion occurred very slowly. In water-in-oil emulsions having water content
approaching 20% a slight elevation in fire point was observed, and in heaviercrudes where water concentrations went up above 20-30%, fire points increased
dramatically. Thus, while water-in-oil emulsions formed with fresh crude oils
could be burned successfully in situ (when solid fuel igniters were employed
to initiate the combustion process) the maximum water content for effective
burning of the emulsion layers was approximately 70% by volume for medium
crudes and 30% by volume for heavy crudes. It was also noted that in emul-
sified crudes, separation of water and oil must occur before effective combus-
tion could occur, and this ultimately required longer pre-heating and ignition
times in the case of emn.ilsified oils. Further, unlike the ignition of unemul-
sified oil slicks, the emulsified oils required a definite size flame before
flame propagation over the entire oil surface could occur. Slick thickness o f .:.
w~ter-in-oil emulsions was also critical, with 10 mm thick slicks easily ig-
nited for Norman Wells and Sweet. Blend crude oils having water contents of up
to 30% by volume. In fact, a 10 mm thick slick of Norman Wells crude oil
emulsified with up to 70% water by volume could be easily ignl~ed with a solid
fuel igrlitor. Water-in-oil emulsions of tie same thickness for heavier crudes
(Lloydminster and Mayburn-M5dale with water contents of up to 30%) were much
.

TABLE 3
Time-se~les t.+atet- column concentrations (~g/1) of dissolved and dispersed
hydrocarbons from fresh Prudhoe Bay crude oil and mousse weathering on flow-throughseawater enclosures (tIJrbIJle8t regime) at I(asitsna Bay, Alaska. (Water temperature6° C, air temperature 6 - 13 C). Concentrations determined by capillary temperature-programned FID.gas-chromatography. (from Payne et al., 1981b)
Fresh Oil O hrs 1 hrs 1.5 hrs
Resolved Components 7200 4740 1400
Unresolved Complex Mixture 3140 1460 420
Fresh Mousse* O hrs 1 hrs 6 hrsK
Resolved Components 23 7 29
Unresolved Complex Mixture ND ND 12
., *Water column concentrations corrected fortotal oil volume added as “mousse.”
ND = none detected
+possibly due to excessive oil droplet entrainment
26 hrs 53 hrs
10110+ 659
447 114I
19 hrs 30 hrs 45 hrs 100 hrs I
18 10 24 34
45 37 69 59 I
.

.
more difficult to ignite and often Fequi red tlte
tlteir ignition. The residual oil layers remaining
in-oil emulsions ranged between 0.4 and 1.9 m in
addition of fresh oil for
after combustion of water-
thickness and these values
were similar to residual oil layers remaining after the combustion of unemul-
sified oil layers of the correspoffdlng crude oils.
Kolpack et al., 1977 reported that the residues that remained after
burning “of the Bunker C cargo during the explosion and sinking of the San-
sinena had densities significantly greater than the unburned cargo and that
these rapidly sank to the bottom. Computer simulations of-changes in cofnposi- .
tion of a standard Bunker C after 2 hours of evaporation at 4 different tem-
peratures were generated using API standard Bunker C composition (paraffin
C-12 to C-28 maximum at C-14-15; naphthenes C-9 to C-25, bimodal with maximum
at 10 and 22; aromatics C-8 to C-23 with maximum from C-10 to C-17 and as-
phal tics starting at C-12 and increasing to 30% relative composition at C-48).
In this simulation the density of Bunker C increased to that of seawater
within 10 hours when the oil temperature was 75°. A specific gravity of 1.025
was attained after 40 minutes at 125°C and within less than 10 minutes at
250*C. Oil simulations for unburned spilled oil showed it to take more than 1
week
that
ture
tion
for this residual -material on the water surface to reach a density of
approaching seawater.
Interestingly, when Dickens et al. (1981) introduced an oil -gas mix-
of Prudhoe Bay crude oil and air under ice, no significant mousse forma-
was observed. During spring break-up of the ice the oil was found to be
sandwiched ammg. thin ice sheets and brine channels, and none of the oil was
in an obviously emulsified water-in-oil form. This oil could be removed from
the scene by ’burning with burn efficiencies ranging up to 95%. Final mass
balance of the oil In this instance was 31% burned off, 31% evaporated, 17%
manually cleaned up and 21% naturally dispersed. Nelson and Allen (1981)
found little dissolution or microbial degradation of Prudhoe Bay crude oil
spilled under ice, and it was found that mousse formation presumably required
the loss of these volatile components and possibly the formation of pltotochem-
Ical and microbial degradation products in addition to significant turbulent ‘
33

mixing which did not occur under ice. As a result, when the oil was released
in brine channels during the spring breakup of the ice, burning could be used
as an effective clean-up/oil removal procedure. Further, the potential for
mousse formation may have been attenuated by alternate freezing and thawing of
the oil-water mixtures. Dickens et al. (1981) and Twardus (1980) reported
that alternate freezing and thawing cycles of water-in-oil emulsions in pans
caused the emulsions to separate to some extent into separate water and oil
phases during aging. From these studies it can be see that freezing of water-
in-oil emulsions will result in a destabilization. This behavior was also
observecl
was more
sorbant)
content
in our laboratory when mousse samples were frozen.
Twardus (1980) also found that the clean-up of water-in-oil emulsions
complicated as the sorption capacity (grams of emulsion/gram of dry
o.f 3M brand oil sorbant was significantly reduced as the water-in-oil
increased for Loydemister, Wayburn-Mildale, Sweet Blend and Norman
Wells crude oils.
Breaking and Interaction of Laboratory Mousse ~jth !lispersants
,
To evaluate the possibility of preventing mousse formation at sea
Berridge et “al. ( 1968b) attempted to generate mousse i n the 1 aboratory with
0.1% by weight ESSO Breaxit and varying concentrations of the dispersant
BP1OO2 added to the starting oils. Results from these and other tests are
presented in Table 4. In these mixtures, the crude oil was observed to take
up large quantities of water ranging from 66% for the 8rega crude to 75% for
Gatch Serar?, however, no stable mousse could be formed. The time required for
separation of{ the oil and water layers ranged from several seconds to 2 min-
utes . Photo ~icrographs showed that water particles ranging in size from 1 to
50 micron were encapsulated in most of the oils however, due to the lower
viscosity of the mixtures (presumably from the presence of the dispersants)
the phases rapidly separated. The Nigerian crude used in their study appeared
to contain smaller’ droplets and was slightly more stable.
ratios of from 0.1 to 1.0 weight percent BP1OO2, various types
Using various
of mousse were
.
34

Inhibition of
Crude
Kuwait
Tia JuanaBregaIran (Agha Jari)Imega (Kirkuk)NigerianGach SaranKuwait
Tia Juana
Imega (Kirkuk)
Brent
KuwaitBunker C
TABLE 4
Stab?e Mousse Formation by the Addition of Chemical Dispersants(frm8erridge et al., l~68b and 8ridie et al., 1980a, b)
Dfspersant
8reaxi t8reaxf tBreaxit8reaxi tBreaxi tBreaxitBreaxi tBP 10028P 10028P 10028P 1002BP 1U028P 1002BP 1002Lh 1834u 1834IA 1834
~
0.10.10.10.10.10.10.10.10.50.750.751.00.10.750.10.10.1
%H20
74.572.16671.478.170.5?5.68176
76657767
Appearance
No stable mousseNo stable mousseNo mousseNo stable mousseNo stable mousseNo stable mousseNo stable mousseGood nmusseFair mousseNo mousseSticky mousseNo mousseSoft mousseGood mousseNo mousseNo mousseNo mousse
Time to Separateinto layers
1 minute1.5 minutes
2 secondsi second1 second2 minutesStahl e2 hours
10 hours
12 hours10 minutes
,,
35

.-. —— -- —- . . . . .
obtained, and their properties ranged from stiff to sticky and soft to no
mousse formation with increasing dispersant concentration. The time required
for breaking of the emulsion ranged from 10 minutes to 2 hours. Less encourag-
ing results were obtained in attempts to breakup previously stabilized mousse
with emu?sifers. 13reaxit was tested at three temperatures and BP1OO2 was
tested at ambient temperature. In general, higher concentrations of the
BP1OO2 were required to break the emulsion.
From these results, Berridge et al. suggested that to prevent mousse
formation from large crude oil spills, the oil could be de-asphaltized before .
shipment or that emulsion breaking surface active agents could be added to the
crude before shipment.
Bridie et al. (1980b) evaluated a dispersant additive (LA1834) in
laboratory tests with artificial mousse generated with a Brent 200+ crude at
10”C and found that the viscosity immediately dropped significantly and that
60% of the water separated (residual water content <50%). After the mixture
stood at 30°C for 4 hours, additional water separated and the residual water
content in the oil was less than 10%. Similar results were obtained with
Kuwait ZOO+ mousse, but its residual water content remained higher. Adding
LAl~34 to either the oil or water prevented mousse formation (Table 4) at all
stirring speeds and temperatures tested using Kuwait crude, Brent crude and
Bunkee C fuel oil (LA1834 concentration, 300-1000 mg/g). In large scale (10
ton) tank tests, addition of 3000 mg/~ LA1834 caused the viscosity of the
70:30 water-in-oil emulsion to dip from 130,000 CP (18”C, shear rate 3.28 x
105g/cm S2) to 3,800 cP, and the water content dropped to 25% after 10 min.
and 15% aften 60 min. The additive was also successfully used to lower theviscosity of “recovered beached mousse from several thousand tons of Basra
Light
1980,
waste
200 g
crude spilled from the
such that the material
disposal trucks. In
drum. ‘ ‘
Irene’s Serenad after an explosion near Greece in— —could be pumped from oil drums and picked up by
this case 200-4009 of LA1834 was added to each
36
In another recent study, Bocard and Gatellier ‘(1981) studied the
effects of various dispersants on water-in-oil emulsions formed from Arabian
light crude topped at 150”C, (viscosity 10,000-20,000 cP), a Safanya crude
(viscosity 20,000 to 50,000 cP) and heavy fuel oil (viscosity 60,000 to 80,000
CP). To determine the effectiveness of various dispersant products, mixtures
of the dispersants were ~ddeci to the laboratory generated mousse with four
vertical blades rotating at 500 rpm for specific time intervals. The water
released as a function of stirring time and settling time was measured in a
graduate cylinder. Ratios of emulsion-breaking product to mousse ranged be-
tween 250 to 1000p pm; however, it was noted that above 500 ppm the gain in
effectiveness was relatively slight. After mixing times in excess of 150
minutes, variable ‘results were obtained with the seven different emulsion
breaking products tested. Anywhere from a low of 18% to a high of 56% of the
water could be removed with this procedure. For the more viscous mousse, much
greater agitation of the mousse and emulsion breaking product was necessary to
effect similar separations. In all cases, injection of emulsion breaking
product did immediately cause a significant drop in the viscosity before any
water separation occurred. This was illustrated for the Arabian light crude
oil mousse (75% water) treated with 1000 ppm of product “A”. In this case,
the viscosity of the emulsion measured at 20” at the pump outlet of their
laboratory emulsion breaker, showed that the viscosity decreased from approxi-
mately 22,000 CP to 5,400 c? at 10 rpm after introduction of the dispersant.
From infrared and TOC hydrocarbon measurements, it was also shown that ap-
proximately 20-25% of the deemulsified products passed into the aqueous phase.
To determine the effects of emulsion breakers on stabilized mousse
aged in a natural environment, the authors performed
March 1979 to February 1980 in the oil port terminal
Approximately 400 liters of Arabian light crude were
metal enclosure and the oil layer was measured to
Samples were taken periodically over time and the temperature was noted to,,vary from 6°C in winter to 199C in sumner. Up to 75-80% water was taken up by
the crude within the first week and approximately 30% of the materials were
field experiments from
of Antifer (Le tfarve).
poured onto a floating
be about 15 mm thick.
37
believed to have been evaporated at that time. Over the 11 month period,
water content in the mousse dropped to approximately 65-75% while evaporation
only inc~eased to 44%. When dispersant
samples at 20”C (~itti 100 ppm of Product
the mousse on and after September 1979
tested were able to cause the slightest
tests were performed with time on the
“A”), a progressive stabilization of
was noted, and none of the products
phase separation. The stability of
the naturally generated mousse was not apparently directly correlated to an
increase in viscosity. The 12 month old weathered water-in-oil emulsion
exhibited a 20°C viscosity of 24,000 CP at 10 rpm, 11,000 CP at 20 rpm and
2800 CP at 50 rpm. All of these values were considerably lower than those
obtained from synthetic emulsions of Arabian light crude (topped at 150”C)
with 7$4 water generated in the laboratory. When mixtures of the naturally
generated mousse were mixed with 150” cut Arabian light cmide, an emulsion was
formed which had a viscosity of on”ly 1600 CP at 10 rpm. This emulsion could
not be broken up at 20”C with any of the products tested. Similar results
were obtained with other artificial mixtures of Arabian crude mousse (with 70%
water) and other oils. Stabilization of the emulsions by incorporation of
microparticulate particles of sedimentary material was suggested as one pos-
sible hypothesis for the observed stability. It was also stated that theformation of oxygen compounds front photochemical, microbial and auto-oxidation
may have acted as surfactants, thus, having a further stabilizing affect on
the emulsion.
While Bocard and Gatellier (1981) suggested that viscosity did not
directly affect water-in-oil emulsion stability, slightly conflicting results
were reported by Lee et al. (1981). The latter authors reported that changes
in water contents and viscosities for 8 crude oil mousses directly influenced
dispersant efficiency. In general, it was found that dispersant efficiency
was very low with mousse mixtures having viscosities greater than 10,000 cP;
however, little useful dispersion could actually be achieved above 7500 CP for
most crude oil emulsions stidied. Lubricating oil base stocks gave an even
lower viscosity ’li~itation for effective dispersant treatment of about 2500
CP. This was attributed to a probable lack of any natural dispersants in the
38
lube oil stocks themselves. When
mousse were spread at sea it was
was very short, and that within
point where dispersant efficiency
a mixture of two ciifferetit concentrations of
shown that the time to form a stable mousse
5 hours, the viscosity had increased to a
was significantly reduced. Different prod-
ucts from different manufacturers varied considerably in performance when
used, however, they all performed better when used neat rather than diluted
into seawater. Once detergents were pre-diluted with seawater and applied to
the oil, their performance became similar and usually inferior to that ob-
served with undiluted dispersants. The effect of viscosity on dispersant
effectiveness was attributed to the fact that when the viscosity of the oil is
above the limiting value, the dispersant is removed physically from the oil by
wave action before it can diffuse into the slick and become effective. In
independent investigations, MacKay et al. ( 1980) have stated that viscosity
increases in mousse are critical in dispersant treatment, and that viscosity
can be correlated mathematically with percent water uptake. In their studies
they concluded that mousse with viscosities in excess of 4,000 centipoise
would be .d.ifficult if not impossible to disperse.
Dispersants have been used with mixed results in various major open
ocem and coastal spills, however, they will not be considered in detail in
this paper. In the Amoco Cadiz spill when emulsion breakers were used in
intermediate storage tanks and mobile van trucks, very little separation of
water from the mousse occurred, however, addftion of dispersant did speed up
transfer of the mousse by reducing the viscosity of the emulsion. It was
hypothesized (Bocard and Gatellier, 1981) that significant mixing energy wiis
not present ~,n the trucks or storage tanks to release a large proportion of
the water. ~ecommertdations were made, such that during clean-up operations,
emulsion breakers be injected on-line upstream from the pump at a flow-rate
that is proportional to the pumping throughput. Also, in field applications,when emulsion breakers were applied to slicks, the efficiency of skimmers was
improved, however, preliminary tests performed in the laboratory with slight
stirring have sh’own that the emulsion breaking action is very slow under these
conditions.
39

.— -
i3acterial Utilization of Laboratory Generated Mousse
As
utilization
evidence of
observed by
evjdence of
noted earlier, Berridge et al. ( 1968b) indicated that microbial
of laboratory generated mousse was minimal. Likewise only limited
bacterial degradation of 350° topped Kuwait crude oil mousse was
Davis and Gibbs (1975). IrI their open tank system there was some
rt-alkane removal (presumably due to biological activity); however,
this was not observed in their closed tank system. There the rate was be-
lieved to be limited by significant 02 and/or -nutrient depletion over time.
Oxygen and nutrient concentrations in the surrounding bay ~aters were Such .
that microbial processes were not significantly affected in the bay or open
tank. It was clear from their work, however, that truly effective degradation
of the mousse would occur only after physical dispersal into smaller par-
ticles. Nagata and Kondo (1977) reported that limited microbial degradation
occurred on laboratory generated crude-oil mousse with hydrocarbons below
nC-15 being 20-30% degradeci after 5 days. Hydrocarbons above nC-15 remained
unchanged at that time whereas about 50% of these were degraded after 15 days.
In open ocean oil spills, microbial degradation and utilization of
components in mousse has been “variable. In the Amoco Cadiz spill, for ex-— .
ample, there was abundant evidence that microbial degradation processes were
significant and even approached rates of loss due to evaporation and dissolu-
tion. On the other hand, in the IX~OC and Potomoc spills there was little
ev i d e n c e o f microbial degradation of the mousse or tar fld~es, and these
phenomena will be discussed in more detail in the next section on case studies
of mousse fo~mation from major open ocean and
After the Tanyo oil spill, mousse samples were
tion was measured after adding mixed microbial
coastal spills and blowouts.
collected and oxygen consump-
cultures to mousse/water mix-tures; however, no activity was detected during the first 200 hours. !Wen the
sample was first treated with a surfactant (1% by weight) a positive reaction
was observed, and the bacterial activity was directly related to the amount of
oil available (Bocard and Gatellier, 1981).

-.——
SELECTED CASE HISTORIES OF THE MORE DETAILED
CHEMISTRY STUDIES OF MOUSSE BEHAVIOR AND LONG TERNFATE IN NEAR-COASTAL AND OPEN OCEAN OIL SPILLS/EILOW(llT.S
A number of fairly large oil pollution incidents involving mousse
formation have occurred over the last decade, and Table 5 presents details
from several selected cases where mousse formation was noted and in some cases
chemically studied. In the following summaries only those factors dealing
with mousse formation were included, and by the nature of available litera-
ture, there are obviously some gaps in our knowledge of complete details for
some of the oil spills. Because of the increased number of spills and scien-
tific investigations during the last several years, however, it is not sur-
prising that the most detailed chemistry data have only become available
recently. Thus, most of the deficiencies in our data base are from the
earlier spills, and there are obviously numerous other spills which have
occurred over the last 15 years which are not included in this review. Inmany cases these other spill events were not studied in detail, or if they
were, the data were not available at the time of this writing.
It will be noted from examination of Table 5 that most of the oilswhich generated mousse in real spill events also formed stable water-in-oil
emulsions in laboratory experiments (Tables 1 and 2). Very limited data were
available from other spills where mousse formation did not occur, and as a
result, we do not have as much significant field data on oil spills occurring
with other crudes. Nevertheless, it is significant that the majority of oils
which have bqen shown to form mousse in laboratory studies were also the oils
causing the ~st problems with mousse in actual oil spills as reported in the
literature.
Torrey Canyon-
This was the first major spill event where mousse formation received
significant attention in terms of transport and clean-up. The Kuwait crude
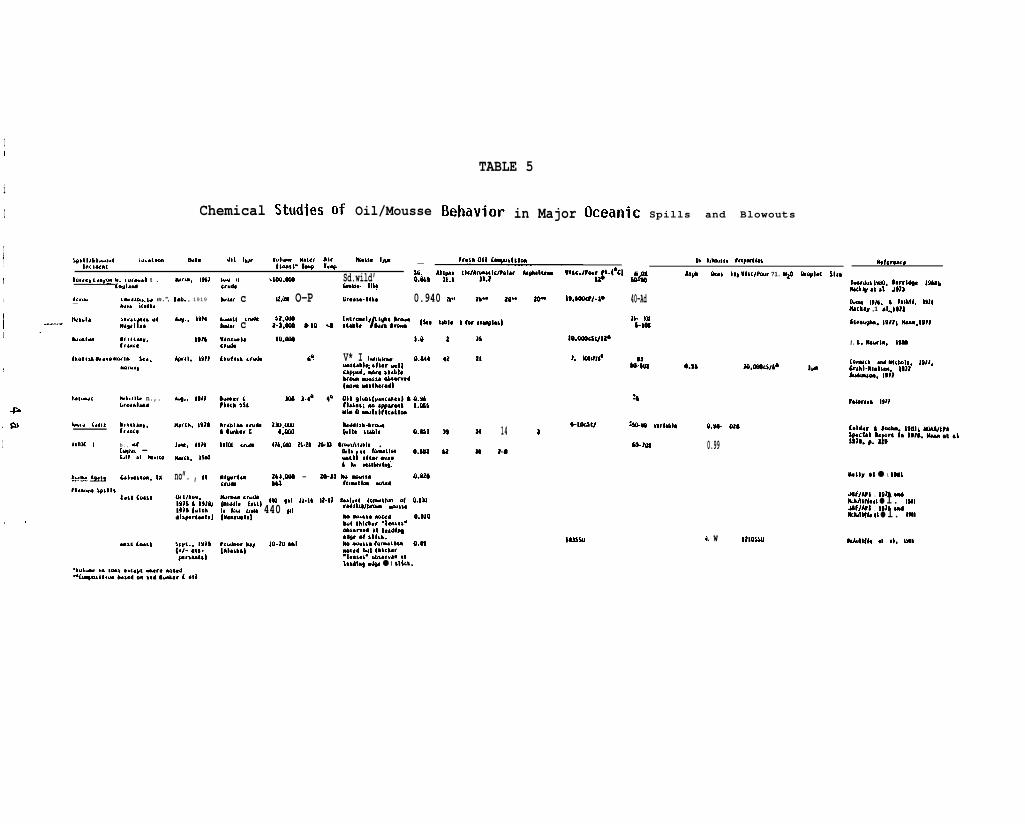
II
TABLE 5i
I Chemical Studies of Oil/Mousse in Major Spills and Blowouts
Ii! WM.-d I!lt.tllhl ht. 081 I,* V“ld.! ml., Al. fkm$. I“*(1-1).1+ I.w —u. Al]+ flc/AI&;w?olu AI@lmm UIIC.I?4W *.(*c)Sd.wild’ &Ab9 . . ,$LmA,*- m.
08 I{mu’,. ertlp.rlh’~* L%. &It” Ufscl?aur ?1. K@ Alrqll,t u,,4??
Rd.””,,1 1.’,., L.r.,u.l y-d..l t . Iu’.b, 1%1 h., It .100.wJ
Ctuti
OUA*. c U.lw O-PInwdu. WJ, *.rrt* I*Mb41Ack+ .481 J913k., WIA. & DbMd. M14MIch## ,1 *4,.1*1*
$tr*ugAI1. 1911L HMn.lwl
I A<,* ,sw.J.m,%,” m.”, f,t.. , 1 9 1 9— h“,, scull, Gr**”.lth* 0.940 w. 16- ail- 8d- 19,99DW-V
KG’’%%’:!- ISc. tbblc I fw9n4@*d
40-Ad25- 3Ms-MaI – Ux’”(k,”l.
1’ h’111..” Ultm,.fr..ceho,,,, u,,.” H.*lb k..
I klru.”
q., 19)41916
AptIl. t9tt
.-1, Uiido $Z.IJIAOhmk.r c Z4.0C4 8.10 8An21
nm
Io.dvacsl/l@l. fcQc?\#
WUU91. Io.wWud 1.0V* I 10dshla,lhm- e.A44“.l~abl~,fta, AIc~ff.ed, W<* SIAI*brmmti’,e .VJ1aw*dkm nithwd)
1. t.mu,ta. lzml
A& O.m Coruck Andula”m. l$IJ.Lrbhb.ntalmb. 19)1&ARbm. Isfl
10.mztw ha
0Z8
Vo,m’ *1.*11. n.,.& r.ruAM
.@ Au.. (.4,* my,
I lam I b . , “tt-#-, -6.11 d b.,’*
A+, 19)1 ?azwmm 8911
fwcrn, h9m %&m “*,1*1, o.9A-60-M6 0.99
A#lw,b-bruCU19* MAI, 0.4S1 b-10m/14 *8-0Jw. IO)*
fl-cb. 19WIInlu ‘,Ud@ 416.OM Zb-Z8 AO-lZ #.u..al,aabl, .kl, ad fa’wJ1lOni O.wz-II ,#t.r ,,.0I h. 8M18rlm#:411’4WIW ZU.UM - za-~~ AO W!** (MMclue n) tlllmitlc., *M
till” ,1 ● l. mlno”. , 19J4.uflul , 1916 dfkA!l)lna d ● I. 1991J4fMl . 1$16 MA4k<lw. tt ● 1. I*1
- ,,.-,“,4,, ,,’,, 4411 @ 11.14 12-11 Lk.1”.d lo-atoll af O.bkl1A AM* U* 440 gd ,,ddlSb/b_ WSM[U.”*I*} m w.,’, axed 0.910
bw lMcb*r .14JU*S”ab$cwtd at l,tdl~*+ *i SI1’k.
P,lAtm m,, lo-2iA ml W-IS. f.-t8m a.nW.sbbl MI*A but Ihlch.r
%.,,*. @s,r”*4 .11.*4$** ● l tlkk.
. .e. w IilosulIAMU 14CAUlfff. .l d. 1991

-— -—
oil spilled by this vessel was reported to form a semi-solid, gel-like mousseafter the spill at sea and during clean-up operations (Smith, 1968). These
emulsions were fairly stable and some contained up to 80?i water. In this
instance, the spilled oil was fairly heavy with the composition-percent dis-tiJled at 21O”C being only 21%. The oil composition consisted of 31% satu-
rates, 33.7% aromatics and had an initial density of 0.866. There were
several discussions of Oil spill clean-up problems of the beached mousse along
the Cornwall coast, however, most of the reports centered on the toxic effects
of the dispersants used in the oil spill clean-up, and this received much
greater attention in the literature immediately following the spill.
Tanker Arrow
The Liberian Tanker Arrow carrying 108,000 barrels of Bunker C crude
oil was grounded off Cerberus rock in Chedabucto Bay, Nova Scotia in February
1970. It was estimated that approximately half of the cargo was spilled and
driven out to sea and onto the coast contaminating approximately half of the
600 kmof shoreline (Keizer et al., 1978). Mackay et al. (1973) reported that
much of this oil was ir? the form of mousse containing up to 40% water, but it
was also noted that because of the high viscosity of the cargo and the cold
water teinpeature (0-2”C), the oil was observed (by divers) to be released as“discrete pieces, like a rope
vessel (Barber 1970). While
tually reached the shores of
broken-up into smaller partic’
1-3 feet long” through holes in the hull of the
much of this very viscous oil and mousse even-
Chedabucto Bay, significant portions were also
es during the first 15 days following the spill
by heavy turbulence and the addition of 10 tons of the dispersant Corexit
8666. These particles were detected at significant dist~nces from the vessel.
Forrester (1971) reported that particles of finely dispersed oil ranging from
5 mm to 10 mm were found in–the water column to a depth of 80 m, and occa-
sionally droplets as large as 2 mm were found. In general, the total oil
concentration decreased with depth, however, the relative abundance of the
smaller particles increased. Finely dispersed particles could be traced from
the vessel to a site approximately 250 km southward from Chedabucto i3ay in a
42
. . . .— _ ..—.—— ----- .—.. . ——___ ______ - -.. .
band extending up to 25 km offshore, and two weeks after the wreck, particles
were still observed 70 km to the east of Nova Scotia in 10 km wide tongues
along the surface. Fragmentation of large pelagic tar lumps into small par-ticles has been studied by Wade (1974) and Wade et al. (1976), who observed
that on shaking tar balls with filtered seawater for 4 weeks, micro particu-
late in the following size ranges are formed: 0.25 to 1 UM, 50%; 0.25-0.3
wm, 38% less than 0.3 w, 12%. Likewise, Peak and Hodgson (1966, 1967) and
Gordon et al. ( 1973) have mixed hydrocarbons with di sti 1 led water and found
that less than 1 M particles of oil increased the whole,water oil burden to
values greatly in excess of those for saturated solutions. This excess .in
concentration above saturation levels was due to colloidal particles, andGorden et al. ( 1973) noted that the greatest number of particles formed by
mixing hydrocarbons with seawater occurred in the size range of 1-30 m.
Conover (1971) reported that significant quantities of the finely
dispersed oil from the Arrow were ingested by zooplankton, but it was believed
that most of this ingested oil was eliminated in the feces which were observed
to contain up to 7% oil by weight. Thus, Conover estimated-that as much as
2(I% of the oil droplets with a diameter less than 0.1 mm could be removed from
the water column, and once incorporated into the feces with a specific gravity
greated than seawater, rapidly sink. In a related study, Parker (1970) found
oil droplets in the gut contents and fecal pellets of copepods and barnacle
larvae. In both instances, however, there was little evidence to suggest that
any adverse effects to the species studied occurred as a result of the in-
gested oil. Parker, et al. ( 1971) later estimated that one copepod (Cal anus
finmarchicus), could conceivably ingest up to 1.5 x 10⁻⁴ grams of oil per day.
Thus, a population of 2,000 individuals per cubic meter of seawater ingesting
oil at this rate and covering an area of 1 sq. kilometer to a depth of 10
meters could theoretically remove as much as 3 tons of oil daily, if oil con-
centrations were 1.5 micrograms per liter or greater.
With regard to the stranded mousse from
( 1!377) stated that most shoreline sampling stations
43
the Arrow spill, fiomas
showed 100% oil cover in
.
——.—- .-—--- - .- . . . . . . . . .

.
1970 at mean high water. Surface coverage was observed to decrease at a
logarithmic rate at the lower tidal levels with shores exposed to heavy wave
and ice action showing the fastest removal. By 1973, most of the oil in the
lower cliff zone (lower 27-33% of the tidal range) had been removed. Above
this, the percentage of surface oil increased to the mean high water mark and
then rapidly declined. Slow removal was shown in higher tide levels and
sheltered locations, and under the calmer conditions in the sheltered areas
surface oil existed at the lower levels until 1973. 8y 1977, the degree of
oiling was directly proportional to the wave energy and degree of sheltering
of the stations, and in the more sheltered areas surface oils still persisted.
Correlations of oil content with intertidal and subtidal substrates were
noted, with the long-term contamination increasing from: 1) broken rock and
boulder, to 2) bedrock with sand at the high water level, to 3) broken rock
and gravel, to 4) muddy sand at high water, and to 5) sandy mud at low water.
Toxicity to the salt marsh cord grass & alterniflora) was delayed for one
year, and this was ’attributeci to the fact that the s’pill occurred in an
extremely cold regime and that at the time of the initial oiling the plants
were dormant with aerial portions not being directly coated with the oil. The
oil could not penetrate into the soil as the latter was frozen and the oil was
extremely viscous. Thus, in the Spring of 1970,. the marsh grass penetrated
the oil and foliage ]peared normal. During the following Summer, however,
the oil was remobilized during warm periods, and living parts of the plants
did contact it such that the following year the plants were reduced in number
and exhibited Chlorisis. Owens (1978) also reported that the residence time
of stranded oil increased as the degree of energy in the shorelines decreased,
and Rashid (1974) reported on changes in viscosity as a function of weather~ng
conditions. In a stored sample of the cargo obtained at the time of the
spill, allphatic and aromatic hydrocarbons constituted 51% of the total ,
asphaltenes made up 30%, and resins and NSO’S contributed 29%. The viscosity
of the stored cargo was 19,584 c?. The viscosity of stranded oil increased
from 28,600 to 1,210,0110 to 3,640,000 CP in going from low energy to moderate
energy and high energy coastlines, respectively. These samples were collected
3.5 years following the spill. At a site protected from wave action at all
44
— . . . . . . . _--— —— ._- _-—.. --
times, the oil was observed to have a low viscosity and a“ high total hydro-
carbon content (49%). Thus, oil exposed on beaches subject to continued and
active wave action weathered to mixtures having higiwr viscosities and in-
creased asphaltene contents.
Iri a concomitant study, where oil composition was considered, Vander-
meulen et al. (1977) observed that 7 years after the Arrow incident, aromatic
and cycloalkane components remained significantly more resistant and unaltered
compared to the aliphatic components. The site studied in their article was
part of a gently sloping shoreline of a large low energy lagoon system, and it
was characterized by a 2-3 cm thick tar layer up to a meter wide lying along
the high tide line at the top of the beach. Concentrations in the sediments
ranged from 6.7 to 10 ppm at the mimimum to a high of 1200 to 5500 ppm. In-
creasing concentrations with depth were noted in the high tide sediments, but
the reverse was observed in the low tide sediments. Significant degradation
of the aliphatic components was noted, in that the unweathered 8unker C con-
tained a normal compliment of n-alkanes from nC-13 through nC-30, and the
weathered samples showed almost total loss of alkanes up to nC-30. This was
most pronounced in the mid- and low-tide samples, although no differences in
alkane losses were noted with depth into the sediments. Large unresolved com-
plex mixtures characterized the” gas chromatograms of the unweathered Arrow.—Bunker C, and all of the weathered samples. Synchronous fluorescence spectra
of the original oil and extracts from the high-, mid- and low-tide zones
appeared to essentially identical illustrating the extreme longevity of the
polynuclear aromatic components in sediments. The loss of the alkanes and the
predominance of the aromatics was generally attributed to microbial activity.
Kaizeret a?. (1978) reported that an oila “pavement like” consistency was found in the
Rabbit, Crichton and Durelle Islands 6 years after
and sediment mixture having
upper intertidal zones of
the spill. Evidence of oilcontamination was also found in the intertidal sediment in many other areas of
the bay; however, the pavement like material was primarily limited to the moresheltered locations. Along some of the shores of Rabbit Island and Inhabit-
ants 8ay, oil, sand and pavement mixtures up to 15 cm thick were noted in the
45
/.
— ----- - .----- .——. ..— ._”_. :— . . . . . . . . . . . ..-. —.

upper half of the intertidal zone, and this oil was observed to spread out and
flow on hot days causing additional leached components to enter the intersti-
tial waters. During their studies there was also evidence of more recent oil
sedimentation on the beach, so they were not able to completely evaluate the
overall extent of weathering and mobility of stranded Bunker C from the Arrow.
Thus, while most of the oil stranded on the shores of Chedabuctos Bay disap-
peared over the 6 year period, there was persistent evidence of contamination
in many locations. Specific identification of much of this oil was impos-
si~le, but a few isolated spots had visible oil contamination which could be
identified as Arrow Bunker C.
Metul a
The htetula grounded off of $ate?lite Patch just west of the first
narrows in the Strajts of Magellan on August 9, 1974. From that date until 25
Sept. 1974, 50,000 to 56,000 tons of oil were spilled. Most of this was
Kuwait crude, but 3,000 to 4,000 tons of Bunker C were also lost after the
first fewdays of the grounding (Straughan, 1977). This spill occurred during
the southern hemisphere winter and was augmented by extreme turbulence and
very cold conditions (water temperatures during the surveys ranged from 8-10”C
while air temperatures averaged 8*) (Straughan, 1977). It is not known
whether mousse was formed immediately upon release of the oil to the sea, but
two distinct types of mousse were observed during field studies two weeks
1 ater. A dark brown mousse containing
from the Bunker C fuel, while the light
mousse with 25-30% water (Harm 1977).
including 2 small tidal estuaries, was
weeks fallowing this spill. Both types
beach front by spring tides and waves,
5-10% water was presumably generated
Arabian crude generated a light-brown
A total of 25 miles of coastline,
heavily impacted during the first 3
of mousse were deposited high on the
and both types of mousse had incor-
porated seaweed, sand, and numerous small organisms. The darker mousse ranged
from 5-10 cm thick and covered from 6-15 m of flat areas at the top of the
beach. The lighter material typically covered from 15-60 m of beach at depths
from 1-5 cm. During the first site visit, between 75-90% of the total oil was
46
. . .—— --

washed ashore along the 40 mile stretch of Tierra del Fuego. Five months
later, between 120 and 150 miles of beach was visibly impacted, and at several
locations, dozens of black tar balls ranging from 3-5 cm in diameter were
observed. These consisted primarily of weathered oil, shell and sand frag-ments. In other areas, tar balls ranging from 0.5 to 8 cm in diameter existed
in beached sands. Mud flats were perhaps the most severely impacted, with
mousse and sand mixtures from 15-25 in wide present. Like the mousse-sand
mixtures from the Arrow incident, this material had hardened like a road or
sidewalk (observed during the southern hemisphere summer). In January 1976,
the lower tidal zone at Puerto Espora contained” significant mousse and sand-asphalt material. At this site the intertidal zone ranges from 500 to 600 m
wide and is about 3-4 km long. Of the 400 m wide lower intertidal zone, ap-
proximately 60% of the western 1/3, 95% of the middle 1/3, and 80% of the
eastern 1/3 was covered with black asphalt like material. This mousse ranged
from 5-10 cm thick and in some areas reached 15 cm. At one area, mousse mixed
with sand was noted to a depth of 30 cm. Heavily impacted areas such as thesewill obviously take years to recover and will be a continuous source of con-
taminants to interstitial waters and the general coastal environment. Inter-estingly, the seaward 100 m wide stretch of the intertidal zone (exposed only
at low spr+ng tides) was not generally coated with oil, and this area didcontain a rich abundance of algae and mussels (Straughan, 1977).
Ekofisk Bravo Blowout
The Ekofisk Bravo well blew-out on April 22, 1977, and was the first
major blowout to occur in the Northtime to any spill event to date, a
oceanography “study was initiated
Nielsen, 1978). Also, before the
Sea area. In perhaps the fastest response
detailed chemical, biological and physical
36 hours following the blowout (Grahl-
blowout, Cormack and Nichols (1977) had
conducted a number of field tests with 0.5 ton amounts of Ekofisk oil so addi-
tional information was available on what to expect in the event of a major
spill. They had shown that while emulsion formation was as rapid as forKuwait crude oil, the resulting viscosity of the Ekofisk emulsions was low and
47
.- -. .—. — -.-. — - .- . . ——..
. .
insufficient to allow interference with the natural spreading and dispersion
rates. Evaporation was a significant removal mechanism for the Ekofisk oil as
some 53% of the weight of the uil boils below 350°C. During the test spills
(sea temperature 11.6”C, air temperature 18°C, wind speed 12 knots with gusts
to 18 and sea state 3-4 on t!?e Beaufort scale), it was observed that up to 21%
of the weight of the oil was lost to evaporation in 7.5 hours. After 3 hours,
there was no evidence of any hydrocarbons below nC-9, and after 7.5 hours,
hydrocarbons up to C-n were lost and C-12 and C-13 hydrocarbons were signifi-
cantly depleted. Thus, while
did not have serious effect on
Ekofisk crude has a
emulsification did occur in the test spills, it
the rate of evaporative loss.
relatively low asphaltene content (0.03% by
weight) when compared to other oils such as Kuwait crude (1.45% by weight),
which is known to form stable water-in-oil emulsions, so extensive stable
mousse formation was not anticipated with the Ekofisk Bravo oil. Cormark and
Nichols did observe the Ekofisk crude oil took up water from 35% to 72% in a().5 to 1.3 hour period following the test spills, however, the emulsion was
rapidly broken up into patches of about 1-5 cm in diameter, and after approxi-mately 21 hours, these were further broken down into small flakes with 5-10 mm
diameter. It was also noted that the rate of water-in-oil emulsification wasextremely dependent on the degree of turbulence and sea state: at wind speeds
in excess of 12 knots the oil incorporated 70-80% water in less than 2 hours.At 2-3 knots the rate was 10-20 times slower. Using this data, Mackay et al.
( 1980) estimated hal f-times for emulsion formation of 2.8 hours at 3.1 knots,16 minutes at 10 knots, and 1.6 minutes at 31 knots. Thus the oil behavior is
extremely dependent on the physical oceanographic conditions, and Mackay et
al. ( 198CI) stated that a very real need exists to determine which of di sper-
sion and emulsion formation (which are competitive processes) occurs withvarious oils under given temperature and sea state conditions.
In the actual spill situation from the Ekofisk Bravo rig, Grahl-
Nielsen (1978) measured levels of oil-in-water at approximately 100 ug/l, to
400 ~g/1 and these values clearly suggested the presence of oil-in-water emul-
sions. Grahl-Nie?sen used GC/MS analyses to characterize naphthalene,
48
-— ..—. — ..-. .- . - .----.—-— .—
phenanthrene and dibenzothiophene (NPil) components in” the’ oils, and he re-
ported 3 basic observable phases which occurred during and after the blowout.
First, during and immediately after the blowout, fresh oil appeared on the
surface and at depth as a oil-in-water emulsion; second, 2 weeks after the
blowout was stopped, the remaining oil was found in small lumps north of the
we?lhead, and third, 4-5 weeks after the blowout was capped, small oil patches
on the surface of the sea wera observed south of the wellhead. Although an
estimated total of 20,000 tons of oil were eventually released, no detectable
napthalene, phenahthrene or dibenzothiophenes could be found in the water
column under the oil patches isolated. 4-6 weeks after the blowout. At the
time of the blowout, these components totalled approximately 8 ~g/liter in the
water near the wellhead, while their concentrations dropped to 0.1 lJg/liter
outside the inmediate well vicinity. Two weeks after the blowout was stopped,
the NPO concentration dropped to 0.4 vg/liter near the well and down to 0.05
~/1, (the limit of detection) with increased distance from the wellhead.There was no significant depth gradient noted at that time.
Audunson (1978) also studied the fate and weathering of the surface
oil from the Bravo blowout. The oil, at a temperature of 75°C, was sprayed
into the air, and estimates of 35.40% of total material were given for com-
ponents lost to evaporation before and after the oil hit the water surface at
6°C. The specific gravity of the crude was 0.85 to 0.87 and this increased to
0.95 afte~ 2 days of weathering on the sea surface. The oil was observed to
spread in a 1 nun thick slick, 100-200 m wide in bands up to 1 km long. At the
outer edge of these bands, 1-20 mm thick water-in-oil emulsions with a
yellowish-brown color and up to 70% water were noted. These proved to be very
unstable, an~ were rapidly broken into long strips 1-20 mm thick and 10 m
wide. Thes&”bands were then further broken up by turbulence. A more stablemousse was formed later, around the time the well was capped, ancl this had a
brownish appearance and
the rigid structure of
smaller 2-20 m ‘patchesexaminations of the 56%
contained up to 50-60% water. This too did not have
a Kuwait crude oil mousse, and was broken up into
and ultimately 1-3 mm droplets with time. Microscopic
water-in-oil emulsion showed 1 ‘W sized water droplets
49
. ..— —. .___— _._— —.
to be dispersed in the mixture. The slightly more stable mousse which formed
after the well had been capped presumably was partially stabilized by bacte-
rial or photo-oxidation products which were not present in starting crude.
The viscosity of the oil on the sea surface increased from an initial value of
approximately 1,501J cp (at 6“C) to a value of 76,000 cp (at 6°C) after 2 days.
This was attributed to weathering and evaporation plus the incorporation of
water (Audunson, 1978). Even this relatively more stable mousse however, was
rapidly broken up into smaller patches.
To determine if this dispersed Ekofisk oil was deposited in the sedi-
ments near the well site, Johnson et al. (1978) undertook a detailed sediment
sampling and analyses program. GC/MS mass fragmatograms, nC-18/nC-19 and
nC-27/nC-26 ratios were used along with hopane diastereomer ratios to charact-
erize Ekofisk Bravo crude from background pollution. Even immediately after
the blowout, Ekofisk Bravo oil levels were relatively low compared to, hydro-
carbons from other materials and manmade sources, and at 4-6 weeks after the
spill, the hydrocrabon levels in the sediments surrounding the wellhead had
returned to background levels. Of all of the sediments showing positive evi-
dence of Bravo oil, the concentrations were less than 8 ppm, and in the major-
ity of the samples the levels were less than 1 pprrt. All the sediment samples
were collected with a Smith-klacIntyre grab, however, so some problems may have
been encountered due to the loss of surface flocculate material during the
sampling. This phenomena will be discussed in greater detail later when con-
sidering the IXTOC spill in the Gulf of Mexico.
Addy et al. ( 1978) looked foe changes in the biological populations
occurring nea~r the wellhead. Despite the fact that there were changes noted
it was not possible to distinguish between the effects of the spill and back-ground activities. Chronic petroleum pollution in this area and significant
sediment disturbances from anchoring and pipeline installations were believed
to have caused as great a perturbation to the biological species present sur-
rounding the wells$ From this study it was not possible to attribute anyspecific changes specifically to the Ekofisk Bravo incident. Thus, the over-
all impact of the Bravo spill was relatively insignificant, as no coastlines
50
. ———. - . .--.———— ------ . . . -—.- .—

..- ———. .—-. —.—
were impacted directly, and this points out the significant differences in
overall environmental impact when considering open ocean vs. coastal spills..)
US/NS Potomac in Melville Bay, Greenland
On August 5,
being escorted by the
in intermittent dense
1977 the US/NS Potomac was holed by an iceberg while
USCGC Uestwind through scattered sea ice of Melville Bay
fog in the northeastern part of Baffin Bay off Green-
land. Approximately 380 torts of cargo (primarily Bunker C crude oil, specific
gravity 0.96 containing 55% pitch, specific gravity 1.055) were lost, and
Petersen (1978) studied the oil weathering behavior which occurred shortly
after the spill. Evaporation and dissolution were the primary weathering
mechanisms operating following the spill, however, the water temperature
{3-4”C), light winds (O-7 knots) and thick oil slick (up to 0.75 cm) all low-
ered evaporation rates. Nevertheless, alkanes up to nC-17 and substituted
naphthalenes were depleted as much as 50-100% after 15 days. Shortly afterthe spill the oil was seen to form small pancakes (10-20 cm in diameter and
0.5 to 0.75 cm thick). The pancakes organized in wind rows about 4 m wide,
and sheen (visible thin slick} was observed to emanate from them during the
first two weeks. Calm seas (waves O-2 feet) prevented significant dispersing
for the first several days, and by August 19, 14 days after the spill,
cakes ranging from 8-15 cm in diameter were still in wind rows (several
dred meters long and up to 7 m wide). By August 20, 80% of the pancakes
no longer observed to emanate a sheen, and the majority of the mass of
cakes was submerged. In addition to the pancake phenomena, corn flake
pan-
hun-
were
pan-like
particles of tar were observed at the water surface and in the water column 10
days after the spill. These were quite possibly from submerged oil droplets
which had re-surfaced after an unknown period of enhanced dissolution of water
soluble components. The surface oil was spongy in texture, although it was
not undergoing water-in-oil emulsification. Even after 2 weeks of weathering,
less than 5% water was found in the surface collected oil., \
51
.
------ .. —.-. . . . . .. ——— . ..— - . ..——- .-—. .——-— __ —— -
.—— - . . —.. .—
Relative increases in methyl phenanthrenes In the”” weathered oil and
sub-surface flake samples suggested that enhanced dissolution of the lower
aromatics may have been occurring, however, gravimetric measurements of the
asphaltenes showed no significant changes from 5-10 August. The lack of any
change in nC-17/pristane, nC-18/phytane ratios over a 2 month period suggested
that microbial degradation of the oi7 was not occurring to a significant ex-tent, and it was estimated that most of the residues eventually sank and
reached the bottom of
Grose ( 1979)
which computes slick
Melville Bay in less than 50 days.
used data from this spill to validate a computer model
thickness of spilled oil as a function of the physical
characteristics of the oil and weathering by sheen formation and evaporation
(wind speed dependent). This model will be considered in more detail in the
modeling section, however, it should be noted that the model was designed to
account for 3 observed phenomena: the first was that the oil did not form a
single pool but rather was composed of numerous patches of thick oil sur-
rounded by thinner sheen; the second was that the thickness of the patches was
a function of the bulk physical properties of the oil and local environmental
conditions including wave height, water temperature and wind speed; and the
third was the weathering of individual components were dependent on the
physical/chemical properties of the components in the original oil. Losses of
oil dispersions into the water column were ignored in the model because they
were observed to be relatively small in the field and because of a lack of
parameterizations for the pertinent process. Also, there were no data avail-
able on the probability of size distribution of the patches as a function of
either sea state or spill rate, although Grose did suggest that the mean size
of patches w$ll get larger as the sea state decreases and as the spill rate
increases. Thus, for the model he used an equal probability for all sizes of
initial oil patch volume. The model did not include parameters for emulsi-
fication or incorporation of water which would change specific densities,
viscosity and the total surface area and volume of the patches, however, as
noted above, significant water-in-oil emulsion formation was not observed in
the field. The best fit of the data to the computer predicted outcome
occurred with a 0.01 m3 patch and a wind speed of 2 m/see. The largest
52
—. —— -. .- --—- .— ____ .— ----- . . . —.-
._. -—.- —.. ——.
. .
discrepancies between predicted and observed behavior occurred in the size of
the patches which were reported to be an order of magnitude less (0.018 mz) in
the field vs. the modeled area of 0.4 cmz.
Amoco Cadiz
On March 16, 1978 the supertanker Amoco Cadiz was grounded off the——coast of North Brittany, France, and its entire 220,000 ton cargo of Arabian
crude oil and Bunker C fuel was released to the environment. Mousse formation
was noted almost immediately after release of Oil from the vessel or even Prior .
to release because of mixing from wave and tide action in the bottom of the
ruptured tanks. The oil and freshly released mousse consisted of 39% satu-
rated hydrocarbons, 34% aromatics, 24% polar materials and 3% residual (Calder
and Boehm, 1981). Significant downward mixing of the oil and mousse into the
water column was caused by turbulence in the nearshore waters, and concentra-
tions of dispersed mousse ranging from 200 to 1,000 ug/liter were observednear the entrance of Aber Mrac’h. Concentrations in excess of 500 ug/liter
were observed in much of the waters throughout the estuary (Calder and Boehm,
1981). Additional evidence of dispersed oil or mousse in the water column can
be inferred from Wolfe et a?. (1981) where gas chmnatograms of aromatic hydro-
carbon fractions isolated from transplanted mussel samples (suspended in cages
in areas of high contamination) showed high levels of dibenzothiophene, alkyl-
substituted dibenzothioghenes and 3 and 4 ring aromatics, including phen-
anthrene, anthracerte, benzo-a-anthracene, and chrysene plus their alkyl-substituted homologs. Gas ct?romatographic profiles from the organisms closely
resembled those of background mousse samples, and these data suggested thatthe mussels Incorporated significant quantities of either particulate oil or
particulate mousse, in that other studies have indicated that these highermolecular weight components were not present in true solution in the water
column.
53
.——. —.—------- --- - . -.. — _ ___-. ..— — . . . - —-—— -
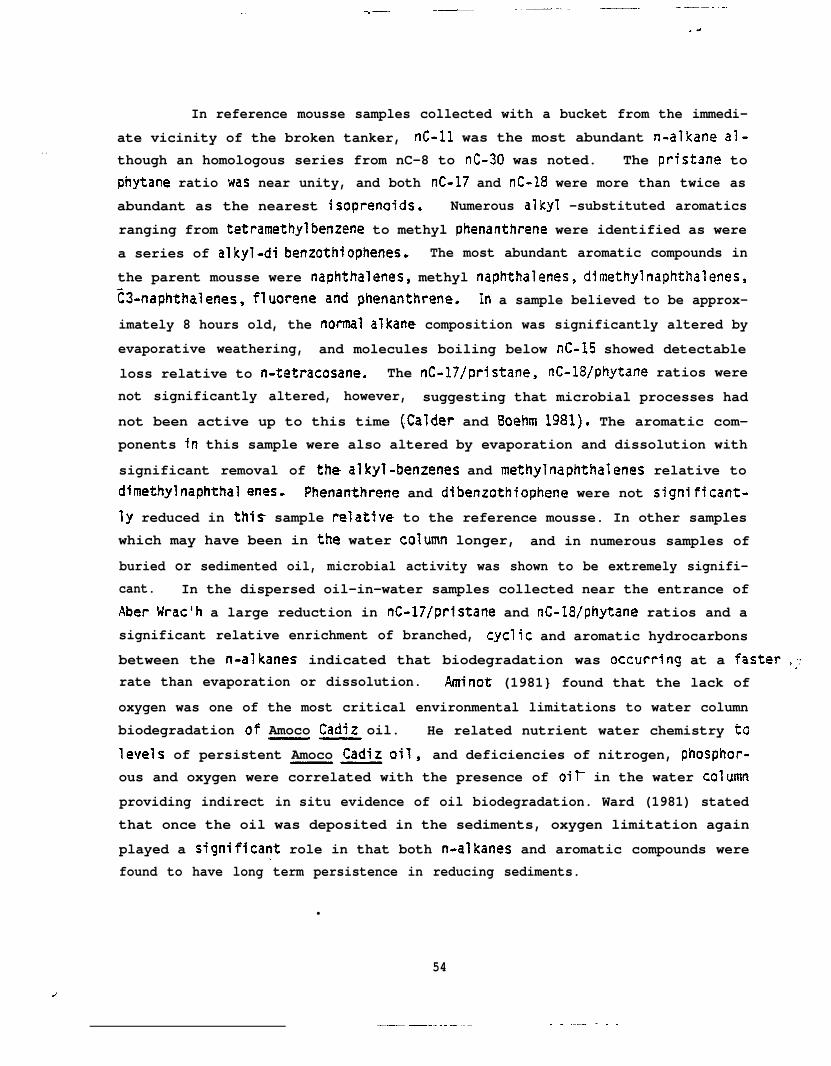
——. — .- —- ——— . . . . . —. —— ..—
.&I
In reference mousse samples collected with a bucket from the immedi-
ate vicinity of the broken tanker, nC-11 was the most abundant n-alkane al-. .
though an homologous series from nC-8 to nC-30 was noted. The pristane to
phytane ratio was near unity, and both nC-17 and nC-18 were more than twice as
abundant as the nearest isoprenoids. Numerous alkyl -substituted aromatics
ranging from tetramethylbenzene to methyl phenanthrene were identified as were
a series of alkyl-di benzothiophenes. The most abundant aromatic compounds in
the parent mousse were naphthalenes, methyl naphtttalenes, dimethylnaphthalenes,~3-naphthalenes, fluorene and phenanthrene. In a sample believed to be approx-
imately 8 hours old, the norm? allcane composition was significantly altered by
evaporative weathering, and molecules boiling below nC-15 showed detectable
loss relative to n-tetracosane. The nC-17/pristane, nC-18/phytane ratios were
not significantly altered, however, suggesting that microbial processes had
not been active up to this time (Calder and i30ehm 1981). The aromatic com-
ponents in this sample were also altered by evaporation and dissolution with
significant removal of the alkyl-benzenes and methylnaphthalenes relative todimethylnaphthal enes. Phenanthrene and dibenzothiophene were not significant-
ly reduced in this sample relative to the reference mousse. In other samples
which may have been in the water column longer, and in numerous samples of
buried or sedimented oil, microbial activity was shown to be extremely signifi-cant. In the dispersed oil-in-water samples collected near the entrance of
Aber Nrac’h a large reduction in nC-17/pristane and nC-18/phytane ratios and a
significant relative enrichment of branched, cyclic and aromatic hydrocarbons
between the n-alkanes indicated that biodegradation was occurr~ng at a faster ,:rate than evaporation or dissolution. Aminot (1981} found that the lack of
oxygen was one of the most critical environmental limitations to water column
biodegradation of Amoco Cadiz oil. He related nutrient water chemistry to——levels of persistent Amoco Cadiz oil, and deficiencies of nitrogen, phosphor-——ous and oxygen were correlated with the presence of oir in the water column
providing indirect in situ evidence of oil biodegradation. Ward (1981) stated
that once the oil was deposited in the sediments, oxygen limitation again
played a significa~t role in that both n-alkanes and aromatic compounds werefound to have long term persistence in reducing sediments.
●
54
——= —.. ._ .—-- . . ..— . . .
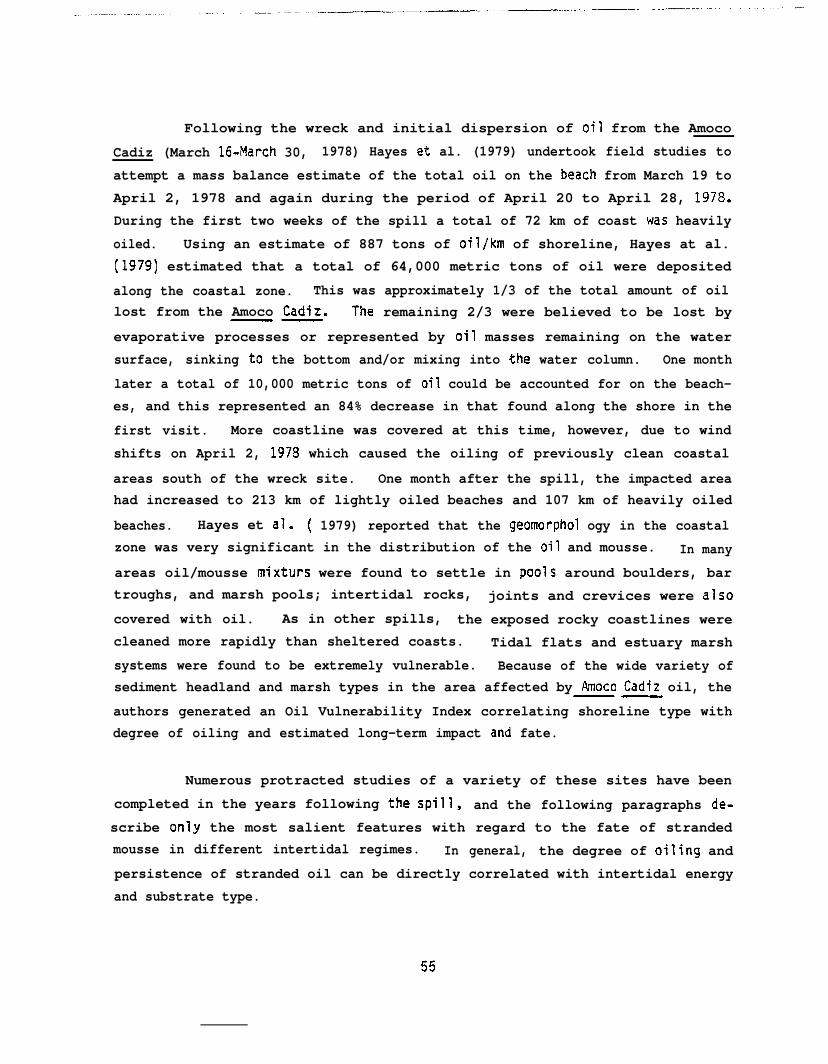
Following the wreck and initial dispersion of oil from the Amoco
Cadiz (March 16-Marcti 30, 1978) Hayes -et al. (1979) undertook field studies to
attempt a mass balance estimate of the total oil on the beach from March 19 to
April 2, 1978 and again during the period of April 20 to April 28, 1978.
During the first two weeks of the spill a total of 72 km of coast was heavily
oiled. Using an estimate of 887 tons of oil/km of shoreline, Hayes at al.(1979) estimated that a total of 64,000 metric tons of oil were deposited
along the coastal zone. This was approximately 1/3 of the total amount of oillost from the Amoco Cadiz. The remaining 2/3 were believed to be lost by——evaporative processes or represented by oil masses remaining on the water
surface, sinking to the bottom and/or mixing into the water column. One month
later a total of 10,000 metric tons of oil could be accounted for on the beach-es, and this represented an 84% decrease in that found along the shore in the
first visit. More coastline was covered at this time, however, due to wind
shifts on April 2, 1973 which caused the oiling of previously clean coastal
areas south of the wreck site. One month after the spill, the impacted areahad increased to 213 km of lightly oiled beaches and 107 km of heavily oiled
beaches. Hayes et al. ( 1979) reported that the geomorphol ogy in the coastalzone was very significant in the distribution of the oil and mousse. In many
areas oil/mousse mixturs were found to settle in pools around boulders, bartroughs, and marsh pools; intertidal rocks, joints and crevices were also
covered with oil. As in other spills, the exposed rocky coastlines werecleaned more rapidly than sheltered coasts. Tidal flats and estuary marsh
systems were found to be extremely vulnerable. Because of the wide variety ofsediment headland and marsh types in the area affected by Anoco Cadiz oil, the.—authors generated an Oil Vulnerability Index correlating shoreline type withdegree of oiling and estimated long-term impact and fate.
Numerous protracted studies of a variety of these sites have been
completed in the years following the spill, and the following paragraphs de-
scribe only the most salient features with regard to the fate of strandedmousse in different intertidal regimes. In general, the degree of oiling and
persistence of stranded oil can be directly correlated with intertidal energy
and substrate type.
55

-—.. . -—---—. . .
Calder and Boehrn (1981) reported that the mousse which was deposited
on sandy tidal flats at Aber Mrac’h contained a lower percentage of saturated
aliphatic hydrocarbons compared to the aromatic components and that this pre-
sumably reflected microbial degradation of the saturated materials. Duringthe first four months following the spill, both saturated and aromatic hydro-
carbons were rapidly lost in surface sediments, however, after approximately 5
months the concentrations remained relatively constant at about 5% of their
initial values for the next 8 months. During the 7 month period following thespill, the unresolved complex mixture observed in gas chromatographic profiles
of sediment samples decreased from 410 ppm to 80 ppm, and the n-alkanes in thenC-10 to nC-35 range decreased from 35 ppm to 1.5 ppm. During the first
month, the pristane plus phytane concentration dropped from 6.5 to 3 ppm(factor of 2) and the nC-17 PI us nC-18 concentrations dropped from 1.8 to 0.3
ppm (factor of 6). This greater loss of the straight chain aliphatics com-
pared to the isoprenoid compounds clearly demonstrated the importance of bacte-
rial activity in the reasonably well oxygenated sediments during the firstmonth. After 7 months the isoprenoid family was dominant in the chromatograms
of the sediment extracts, and only a few n-alkanes were detected across theentire boiling point
ic fractions showedin April to 90 ppm
components dropping
range of nC-10 to nC-34.
similar losses with totalin late October with the
from 29 ppm to 2 ppm over
Gravimetric analyses of aromat-
aromatics dropping from 630 ppm
sum of the identified resolved
the same time frame. Below 20cm depth in the sediments, aliphatic and aromatic hydrocarbons represented
materials of only biological origin. In March 1979, 1 year after the spill,alkyl-substituted phenanthrenes and dibenzothiophenes were still easily detect-
able in the sediments above 20 cm.
Boehm et al. (1981) studied compositional changes in beached or sedi -mented oil/mousse at a variety of coastal environments including rocky shores,
sand flats, coastal embayments, tidal mud flats and salt marshes. The authorsfound that much of the oil appeared to be relatively long-lived in
ments, although some fractions were rapidly weathered and removed.
resistant compounds to chemical and biological weathering were
56
the sedi-
The most
alkylated
——.—— .— --- .—— — . ..-. . . . . . . . . . . ..-

organo-sulfur compounds (dibenzothi ophenes), alkylated phenanthrenes and poly -
cyclic aliphatics (e.g., pentacyclic triterpanes and hopanes). It should be
noted that the alkylated phenanthrenes and dibenzothiophenes did decrease on
an absolute basis, although they were the more predominant compounds relative
to the other aromatics as weathering occurred. Boehm et al. (1981) also de-
tected a number of pyrolitic polynuclear aromatic hydrocarbons (PNAs) in the
sediment samples collected from the spill area and control sites. .These com-pounds included: fluoranthenes, pyrene, benzofl uoranthenes, benzopyrenes and
pyrelene at ppm levels. The concentrations of these PNA’s were fairly uniform
with the depth of the core, and these materials were attributed to background
hydrocarbons presumably from combustion sources.
At Portsall (Station AMC-4) the surface sediment was comprised p r i -
marily of coarse sand, and after an initial heavy mousse coating, absoluteconcentrations decreased rapidly although the n-alkane to isoprenoid ratio
remained relatively high until December 1978. The December 1978 aromatic dataindicated that the remaining mousse/sediment mixture was quite abundant in
alkylated 2 and 3 ring aromatics and dibenzothiophenes. hleathering reactions
then appeared to increase between December 1978 and March 1979, presumably as
a result of increased mixing and resuspension of the sediments due to winterstorm activities. At El Grande salt marsh (station AMC-18) the degradation of
deposited mousse appeared to be slower. At St. Michael-En-Greve (stationAMC-19), a massive kill of benthic fauna was observed in the sand flat due to
heavy oiling. Sediment samples collected in December 1978 and March 1979showed aliphatic and aromatic profiles indicative of highly weathered oil.
Several offshore stations were also studied adjacent to the Bay of Morlaix
(stations AC-42, 138, 371 and 453). In April 1978 immediately after the
spill, the sediments from these areas showed only low quantities of AmocoCadiz oil: a mixture of chronic and background hydrocarbons and terrigenous
runoff material, and perhaps small amounts of Amoco Cadiz oil were suggestedby GC traces. Weathered Amoco Cadiz oil dominated the aliphatic and aromatic
hydrocarbon assemblages in July 1978 presumably due to extended offshore trans-port. By November 1978 overall concentrations were significantly reduced and
57

—. — — .—.—.
the gas chromatographic profiles illustrated that the oil had approached afinal weathering stage. Almost all of the resolved features other than
hopanes were removed and not discernible above a large bimodal UCM. Amoco
Cadiz oil was weathered and removed most rapidly from the sand beach at St.
Michael-En-Greve and offshore sediments adjacent to the Bay of Morlaix. The
composition of the oil changed rapidly, but remained quantitatively abundant
in intertidal mud flats of Aber Wrac’h and at Isle St. Grande salt march where
the oil was found to degrade slower in the fine substrates. In general,buried oil appeared to be preserved over the 15 month period of the study, and
deeper buried oils apparently escaped significant weathering processes pre-
sumably due to anoxic conditions at depth in the sediments. In general, it
was found that nitrogen, sulfur and oxygen, (NSO content) increased in the
residues as hydrocarbon concentrations dropped, however the degree of oiling
was important in this context, because at the more heavily oiled sites weather-
ing appeared to be slower at both high and low energy shorelines. Thus, Boehm
et al. ( 1981) concluded that the most important factors responsible e for the
observed relative weathering patterns were: extent of oiling = shorelineenergy > sedimentation oxidation state >> distance from the wreck site.
Vandermeulen et al. (1981) examined the high energy rocky shorelineon Ti Saozin Island and a lower energy tidal mud flat at Aber !3enoit for
mousse content in April 1978, June 1978 and January 1979. Self-cleaning ofthe mousse at the high energy shoreline of Ti Saozin was nearly 90% complete
within 9 months after the spill. In April 1978, the shoreline was uniformlyoiled and mousse was deposited along the upper beach at several stations. In
June 1978, dried mousse completely covered one station while patches werefound at other locations at an approximately 1 m lower tidal level. Other
areas appeared to be visually clean of oil although sheen was noted in some ofthe tide pools. By January 1979, only traces of mousse mixed with beached
debris were found at one station while some tar could be seen in rocks, cracksand under boulders at another. The rest of the slope appeared to be clean of
the ‘oil. In analyzing the tide pool samples from this location, however, onlythe water soluble components of the stranded oil were examined. Thus, the
58
. . . . . . . ..— .__. - .— -.. .. —-— -..

.- ——-——— —— — — —— —— —.—
presence of highly insoluble asphaltenes and other residuals were not studied.
They may have been present under rocks, sediments or bound-up in interstitial
debris. Vandermeulen et al. (1981) did note that the rapid cleaning of theforeshore area of the intertidal zone (with traces of some oil remaining in
the high tide zone) at Ti Saozin was faster than for similar shorelines in
Chedabucto Bay after the Arrow spill. In the latter case, high energy shore-
lines were cleaned after approximately one year and Vandermeulen et al. (1981)
stated that the differences between the two spill situations might lie indifferent oil viscosities and in a difference in air and water temperatures at
the time of the spills (February vs. April). The self cleaning time for Ti
Saozin was estimated about 2 to 4 times faster than for similar shorelines in
Chedabucto Bay.
In the lower energy tidal mud flats at Aber Benoit large amounts of
petroleum hydrocarbons were observed to remain in the sediments of the inshore
mud flats and along the vegetable fringe at the edge of the river Aber Benoit
9 months after the spill. Synchronous excitation emission fluorescence scan-
ning spectroscopy (SEES) spectra of the parent mousse and stranded tar collect-
ed in January 1979 showed that a number of 2, 3, 4 and 5 ring and larger aro-
matic compounds persisted at Aber Benoit where the tidal range was 9 m duringhigh spring tides. Thus, in contrast to the Ti Saozin sites, the sediments atAber Benoit remained heavily oiled as of 1979 with
Cadiz present at levels well above those found inlower energy regimes it appears that the long term
extent into 10’s of years.
IXTOC I Blowout, Bay of Campeche, Gulf of Mexico
Background
hydrocarbons from the Amoco
control sediments. In the
persistence of this oil may
On June 3, 1979 the Petroleos Mexicanos (PEMEX) exploratory well,
IXTOC-1, blew out in approximately 60 m of water at a site about 80 km north-west of Ciudad del Carmen in the Bay of Campeche, Gulf of Mexico. Within 1
59
.—— — . ..- -..
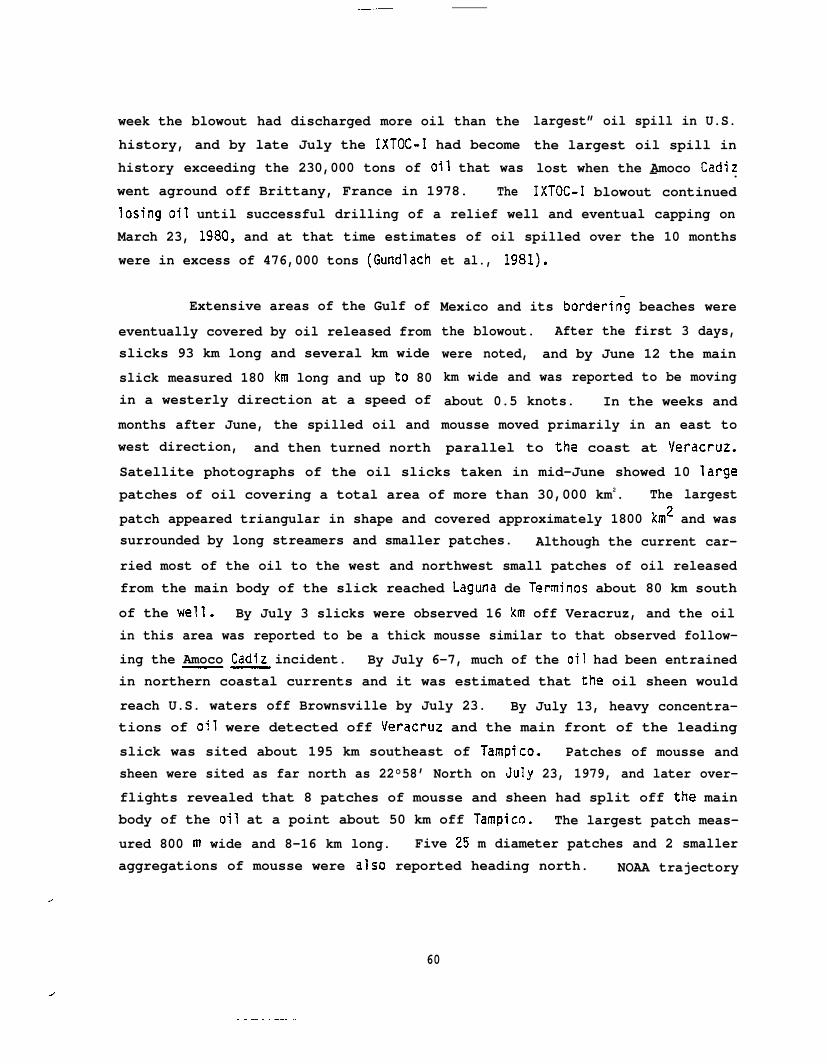
–—
week the blowout had discharged more oil than the
history, and by late July the IXTOC-I had become
history exceeding the 230,000 tons of oil that was
went aground off Brittany, France in 1978. The
largest” oil spill in U.S.
the largest oil spill in
lost when the Amoco Cadiz— .IXTOC-I blowout continued
losing oil until successful drilling of a relief well and eventual capping on
March 23, 1980, and at that time estimates of oil spilled over the 10 months
were in excess of 476,000 tons (Gundlach
Extensive areas of the Gulf of
eventually covered by oil released fromslicks 93 km long and several km wide
slick measured 180 km long and up to 80in a westerly direction at a speed of
months after June, the spilled oil andwest direction, and then turned north
et al., 1981).
Mexico and its borderi~g beaches were
the blowout. After the first 3 days,
were noted, and by June 12 the main
km wide and was reported to be moving
about 0.5 knots. In the weeks and
mousse moved primarily in an east to
parallel to the coast at Veracruz.
Satellite photographs of the oil slicks taken in mid-June showed 10 large
patches of oil covering a total area of more than 30,000 km2. The largest
patch appeared triangular in shape and covered approximately 1800 kmz and wassurrounded by long streamers and smaller patches. Although the current car-
ried most of the oil to the west and northwest small patches of oil releasedfrom the main body of the slick reached Laguna de Terminos about 80 km south
of the well. By July 3 slicks were observed 16 km off Veracruz, and the oilin this area was reported to be a thick mousse similar to that observed follow-
ing the Amoco Cadiz incident. By July 6-7, much of the oil had been entrained——in northern coastal currents and it was estimated that the oil sheen would
reach U.S. waters off Brownsville by July 23. By July 13, heavy concentra-tions of oil were detected off Veracruz and the main front of the leading
slick was sited about 195 km southeast of Tampico. Patches of mousse andsheen were sited as far north as 22°58’ North on July 23, 1979, and later over-
flights revealed that 8 patches of mousse and sheen had split off the mainbody of the oil at a point about 50 km off Tampico. The largest patch meas-
ured 800 m wide and 8-16 km long. Five 25 m diameter patches and 2 smalleraggregations of mousse were also reported heading north. NOAA trajectory
.
60
d
. . . . . -----

—--- .-– -—
models indicated that much of the spilled oil reaching the branching point off
of Tampico would turn south and likely impact Mexican coastlines. On July 20,
oil was washed ashore at Coatzacoalcos, and by July 24 oil was washing ashore
north of Tampico, on the beach at Cabo Rojo near Tuxpan de Rodriguez, and at
Veracruz. By July 29, sheens and mousse were located about 180 km south of
Brownsville, Texas, and large patches were observed off of Tampico to a point
230 km south of Brownsville. These slicks/patches were reported to be moving
north at a rate of about 0.5 knots, and the mousse aggregates were measured to
be 2-3 m in diameter and several cm thick forming a broken line more than 16
km long.
IXTOC-I mousse was first observed in the U.S. waters on August 6 with
patches floating about 70 km off of Brownsville. By this time, oil had
already washed onto Mexican coast as far north as 25°48’ about 13 km south of
the Rio Grande river. Much of this oil then stalled off the U.S. coast, al-
though tar balls and patches of mousse had washed onto South Padre Island
beaches north of Port Mansfield, and pancakes and sheen had been sited less
than 2 km from Port Mansfield. NOAA divers discovered that subsurface oil in
concentrations up to 3600 particles per cubic meter at depths of up to 12meters could be observed outside Laguna Madre. By August 13 and 14 large
c~ncentrations of sheen were observed about 48 km offshore between Port
Mansfield and Brownsville, and ribbons of mousse up to 16 km long and 85 m
wide were observed 32 km offshore. By August 13 patches of mousse and sheen
at varying concentrations were” observed up to 530 km out to sea between
Tampico and Tuxpan de Rodriguez Cane, and an 11 km stretch of heavy mousse
concentrations were reported near Tampico. Dense oil coatings were reportedon the beaches of Tuxpan de Rodriguez Cane, near Veracruz and at Laguna Madre.
Heavy concentrations of mousse washed ashore along 80 km of Texas coast with
the return of southeasterly winds on August 18, 1979, and NOAA oil spill tra-
jectory models indicated that if the well were successfully capped by October
15, the oil would wash ashore according to the following; 3% between
Brownsville and Matagorda Bay, Texas; 21% around Laguna Madre; 32% around
Tampico, 40% north of Veracruz and 4% around Campheche, Mexico. If the well
61
/
.—. ..— ._ . . .. ___ .——-— —.. .-—- .

..—. ..—
were not capped until early spring 1980, as actually occurred, the NOAA model
predicted that the following distribution would be obtained: 1% between
Brownsville and Matagorda Bay, Texas; 10% in Laguna Madre area; 24% in the
Tampico area; 43% north of Veracruz and 22% in the Campheche area.
Oil finally stopped washing onto Texas shores in mid-September whenthe seasonal change of winds and currents offshore began reversing the north-
ward flow. Estimates in late August by Research Planning Institute staffsuggested that when the oiling of the beaches had reached a maximum, up to
3,900 tons of oil covered Padre Island and Port Aransas, Texas, beaches(Gundlach et al., 1981). Higher levels were reported by Roy Hahn of TAMU and
John Robinson of NOAA who estimated that a total of 10,000 tons of oil hadwashed in total onto Texas shores (OSIR, 1980). Researchers and cleanup
workers noted that in September IXTOC mousse had collected in the sand todepths of up to 30 cm along the beaches of Padre Island.
Significant quantitities of IXTOC mousse and oil impacted many areas
of the Mexican coastline; however, details on the extent of oiling and cleanup
operations are not available. It was stated (Oil Spill Intelligence Report,
1980) that approximately 2100 gallons of oil was recovered from Tuxpan de
Rodriguez Cane, and that at Laguna de Terminos, Ciudad del Carmen, the oil was
unable to cross the natural barrier at the interface between the saltwater and
fresh water of the lagoon. Thus at that location only minor quantities of oil
entered the sensitive biological habitat during the first few months of the
spill. Increased rains and heavy river flow extended the natural offshorebarrier and helped protect the lagoon and shrimp nurseries within it.
In late September with the change in currents at the well-head, oil
slicks in the Bay of Campeche were noted along the eastern coast of Mexico,
and these were moving south at about 2.7 knots. Thus, the oil was flowingsoutheast during the third week of $eptember, but by October 1, the flow had
shifted and the oiT was moving primarily to “the northeast. In October largeamounts of oil were sited between the IXTOC-1 well and the northwestern tip of
62
,.
— . -. .- —-.—- .. —.-. —— -- .- —-- — -. - -- ..—. .

.— —— .——— .-—.
the Yucatan Peninsula, and scattered sheen was noted up to 560 km northeast of
the well. With this current shift, heavy coverings of IXTOC mousse (between
15-30 cm deep) were reported in November 1979, at several locations on the
western shore of the Yucatan Peninsula between Ciudad del Carmen and Progreso,
Mexico.
In response to this spill, the United States EPA and the National
Oceanic and Atmospheric Administration, among others, launched a number ofprograms to study the weathering and fate of the released oil as it was moved
by Gulf stream and localized currents throughout the Gulf of Mexico. Perhapsthe most extensive study of weathering effects on IXTOC crude at sea occurred
during the NOAA ship Researcher and GM Pierce cruises which took place at the——wellhead and along the eastern coast of Mexico and Texas during September 1979
(Preliminary results from the September 1979 Researcher/Pierce IXTOC-I cruise,
Symposium Proceedings - 1980).
/
. .-. —— . . .. —- . ..-. --. — .--—. —. . . . . . . . . .
concern andMexico and
comment about IXTOC mousse dis-its eventual impact on U.S. and
Although there was much
tribution throughout the Gulf ofMexican shores, the Researcher/Pierce field studies in September demonstrated
that contrary to earlier reports (Ross et al., 1980), IXTOC mousse was notforming immediately after release of the oil at the wellhead, but was instead
the product of extensive evaporation, dissolution and presumably photochemicalweathering. According to a Canadian environmental protection service study in
June (Ross et al., 1980), the IXTOC-I oil at the well site was reported toimmediately form a viscous water-in-oil emulsion. Based on preliminary chem-ical analyses, the emulsion at the water surface was found to contain about70% water and to have a viscosity of 350 CP and a specific gravity of 0.99.
It was a very stable water-in-oil emulsion containing very fine droplets of
water coated with thin viscous layers of oil; however, it was noted to exist
as a 1-3 mm slick on theered patches observed in
indicated that almost all
were missing; having been
water surface as opposed to the thicker more weath-September. Analyses of the oil collected in June
of the lighter fractions (boiling less than nC-10)burned, evaporated or dissolved before water-in-oil
. . .- —.
63
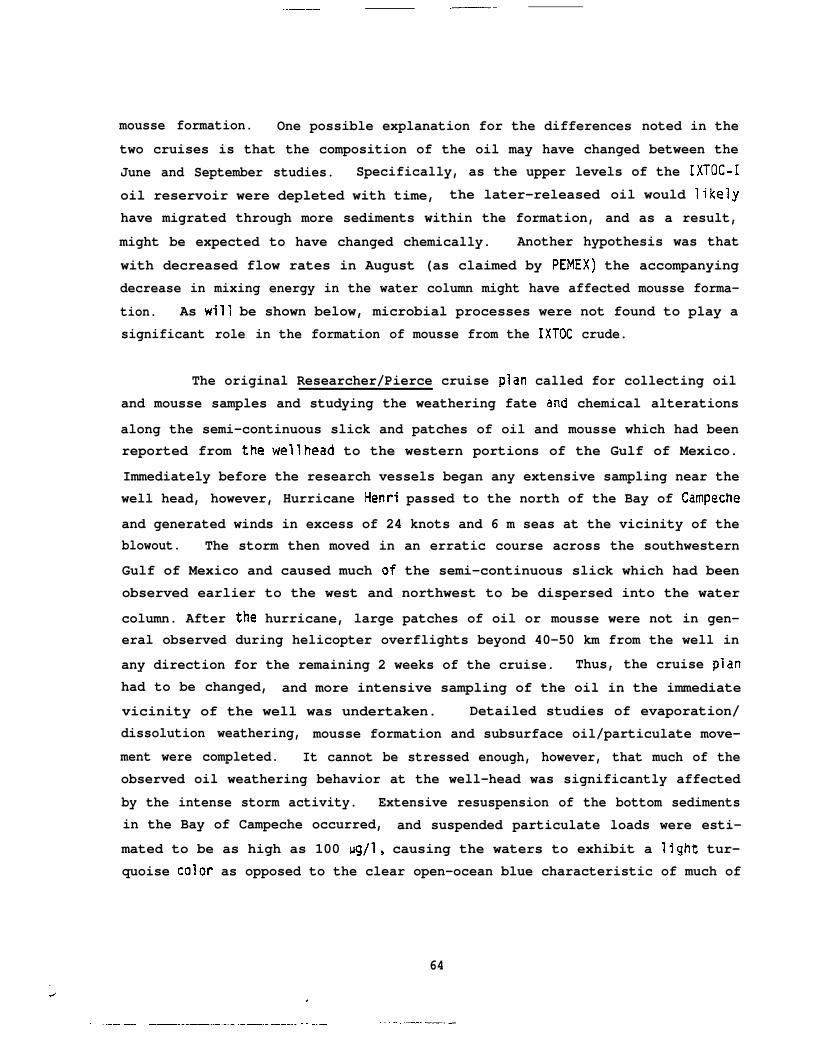
——.. —.
mousse formation. One possible explanation for the differences noted in the
two cruises is that the composition of the oil may have changed between the
June and September studies. Specifically, as the upper levels of the IXTOC-I
oil reservoir were depleted with time, the later-released oil would likely
have migrated through more sediments within the formation, and as a result,
might be expected to have changed chemically. Another hypothesis was that
with decreased flow rates in August (as claimed by PEMEX) the accompanying
decrease in mixing energy in the water column might have affected mousse forma-
tion. As will be shown below, microbial processes were not found to play a
significant role in the formation of mousse from the IXTOC crude.
The original Researcher/Pierce cruise plan called for collecting oil
and mousse samples and studying the weathering fate and chemical alterations
along the semi-continuous slick and patches of oil and mousse which had beenreported from the wellheacl to the western portions of the Gulf of Mexico.
Immediately before the research vessels began any extensive sampling near thewell head, however, Hurricane tlenri passed to the north of the Bay of Campeche
and generated winds in excess of 24 knots and 6 m seas at the vicinity of theblowout. The storm then moved in an erratic course across the southwestern
Gulf of Mexico and caused much of the semi-continuous slick which had beenobserved earlier to the west and northwest to be dispersed into the water
column. After the hurricane, large patches of oil or mousse were not in gen-eral observed during helicopter overflights beyond 40-50 km from the well in
any direction for the remaining 2 weeks of the cruise. Thus, the cruise plan
had to be changed, and more intensive sampling of the oil in the immediate
vicinity of the well was undertaken. Detailed studies of evaporation/dissolution weathering, mousse formation and subsurface oil/particulate move-
ment were completed. It cannot be stressed enough, however, that much of theobserved oil weathering behavior at the well-head was significantly affected
by the intense storm activity. Extensive resuspension of the bottom sedimentsin the Bay of Campeche occurred, and suspended particulate loads were esti-
mated to be as high as 100 ~g/1, causing the waters to exhibit a light tur-quoise color as opposed to the clear open-ocean blue characteristic of much of
64
.— .—..— _——.—- .——..—.—- . . ..— . . . . . .—. _.. — .

. . . . ..—. —..—. ..——
the Gulf of Mexico. This highly turbid water was observed from helicopter
overflights to extend along much of the coastline of the Bay of Campeche area,and the distinct turbid/clear-water boundary appeared to be associated with
oceanic fronts. At the time of the Researcher/Pierce study, the area immedi-
ately around the IXTOC-I wellhead was within the turbid, light turquoise aqua-
marine waters. In related mineralogy studies, Nelson (1980) reported that no
mineral species occurred in the suspended particulate material (SPM) in the
water column that did not also occur in the sediment directly below. Thus, he
concluded that although significant amounts of SPM were introduced from heavyriver flow from the intense rainfall associated with the storms, most of the
water turbidity was the result of resuspended sediments in the vicinity of the
well head. Six terriginous and four carbonate minerals were identified in the
SPM. The terriginous suite contained quartz, plagic feldspar and the clay
minerals chlorite, srnectite (montmorillonite), illite and kaolinite while the
carbonate suite contained arroganite, calcite, dolimite and magnesium calcite.
Many of these minerals have been shown to actively adsorb particulate and
dissolved hydrocarbons from the water column (for a review see Jordan and
Payne, 1980), and their presence was believed to significantly affect oilbehavior.
Observations at the Wellhead
Upon arrival at the wellhead during the Researcher/Pierce cruise in
September 1979, the slick was observed to be flowing in a northeasterly direc-tion, 40-50 nautical miles from the wellhead at approximately 45-55° true. At
times the plume took sharp meanders which were generally to the south, how-ever, the direction of the oil flow on the surface was not directly correlated
to wind speed or direction. Because the oil was being released at depth,water column currents In the vicinity of the well controlled the direction of
oil flow, and on several occasions it was noted that the wind direction wasoften 180” to the direction of the plume.
.,
-— . ..-. —.. — . . . -—. - .
65
. ..-— —-
Immedlatel y over the wel 1 head, a 1 arge fire, about 50 m i n diameter
and 7 meters in height, was burning on the water surface. The fire was essen-
tially yellowish-orange and generally smoke free with occasional discharges of
a light gray smoke. From these observations, it appeared that the fire was
consuming primarily lower molecular weight gases and liquid hydrocarbons.
Much of the oil that was released from the wellhead was not exposed to thefire as it was advected or removed from the source by sub-surface currents.
There appeared to be a continuous upwelling of water within and surroundingthe fire diam&er, and within 20 m of the burning zone smaller random surface
flares appeared and disappeared periodically. These were generally extin-guished by the surrounding turbulent surface waters. Tan to rust-colored oil
could be observed on the surface ringing the fire and extending out about 150m on each side of the flame. This oil in addition to the rising droplets
released from the wel? then formed a semi-continuous slick which was observed
progressing towards the northeast. The oil observed eminating from the well-
head and drifting to the northeast was definitely not emulsified into a stable
mousse, although it was a light brown color and probably contained some water
as reported earlier by Ross et al. (1980). Immediate formation of a stablewater-in-oil emulsion or mousse was not observed. At distances of 3-50 nauti-
cal miles from the wellhead, large patches of stable water-in-oil emulsionswere observed, and these had varying sizes and shapes. Because of reversing
current conditions, however, it was often difficult to always tell freshlygenerated mousse from more weathered materials which had presumably been
formed at an earlier period and then re-entrained into the slick by eddy cur-
rents near the wellhead.
In the vicinity near the wellhead the physical state of the oil could
best be described in terms of fiveplume. The relative size and position
of many factors including sunlight(Atwood et al., 1980).
distinct zones within and without the
of the zones appeared to be a function
intensity, wind stress and flow rate
66
.- .- . ..— .—-. ——— —.. . . .
L

Zone 1 was characterized by the continuous light brown colored emul-
sion of water-in-oil on the surface, and this material existed in the immedi-ate vicinity of the flames and extend~d for no more than a few hundred meters
down plume. This zone represented 100% coverage of the water surface with an
oil film ranging from 1 to 4 mm thick.
Zone 2 was characterized by a 30-50% coverage of the sea surface by a
light brown water-in-oil emulsion ‘- ‘-A-J4:---: -*-_-l._ -1-L:_ .—-- .A--A_J -
few hundred-meters down plume from
to 2 nautical miles depending onnomenan was virtually absent and
environmental conditions.
In alsurlen~ea sLredKs. inls area scdrcea d
the burn and extended out to a maximum of 1
wind stress. At times, however, this phe-
appeared to depend very critically on the
by a 20-50% coverage of the sea surface byZone 3 was characterized
light brown water-in-oil emulsions oriented in Langmuir “streaks” parallel to
the wind direction. These streaks varied in width from a few centimeters to
several meters, and the length varied from 1 to 10’s of meters. .These dimen-
sions depended on wind stress, and in general (although not always) the
streaks were surrounded by a light to heavy sheen of oil. This zone also
extended from as close as a few
nautical miles down plume.
Zone 4 was characterized
hundred meters
by a darkening
from the flames to several
of the light brown water-in-
oil mixture until the streaks were black. This was assumed to result fromoxidation of the oil, and the rate appeared to be dependent on sunlight in-
tensity. A slight color gradation was noted, with many of these streaksblackened in the center and light brown at the outer edges. At times these“streaks” coalesced into long lines of blackened oil that extended for severalkilometers. Along the edges of these “s~reaks,” small balls of chocolatemousse-like emulsion were observed to break off. As will be discussed later,these balls readily coalesced into larger masses upon contact, and at other
times the wind rolled portions of the slick up onto itself, and this wasobserved as a mechanism for mousse agglomeration. In some instances these
,
67
-— .— - . ——. ..-. -. .-

—
mousse balls reached grapefruit to basketball size and/or coalesced into huge
“rafts” of mousse up to 50 or 60 meters in diameter. Several rafts of this
type were found to be up to one meter thick. This zone began 5 to 15 nautical
miles from the well head and extended out to about 20 nautical miles. Detailed
observations of formation of this type of material on a micro-scale were made/- during a 26 mile down plume transect on the GM Pierce, and these observations_. —
will be discussed in detail later.
Zone 5 was characterized by an extensive light to heavy sheen of oil
that covered >50% of the surface. Usually this sheen was in the form ofLangmuir lines, and this zone overlapped Zones 2, 3 and 4 and extended out to
the furthest extremity of the plume.
As noted in the introduction, these descriptions may have been opera-
tive only for the period of the Researcher/Pierce cruise, and they may have
been influenced by the intense storm activity from Hurricane Henri. At sever-
al stations surrounding the wellhead there was no distinct boundary between
these various zones as they often tended to interweave at the transitions.
Cantalope sized patches of mousse from several stations appeared tohave had been stained with fresh oil. Sheen was observed coming from some of
the mousse patches but not others. To a limited degree, the presence or ab-sence of sheen emanating from the external surface of the mousse (or the in-
terior portions, if the samples were broken and re-introduced into oil-freewater) appeared to correlate with stickiness, and the lack of this sheen or
. “stickiness” was taken as evidence that such samples may have been moreweathered before formation. The sizes and dimensions of the mousse patches
varied, ranging from baseball sized balls to ellipsoidal 20-30 cm diameterpatches ranging from 1/8 to 1/4 inch thick. Elsewhere, solid 1-2 mz patches
were observed with thicknesses ranging from 2-3 inches. When 20-30 m diameterby thick “rafts” of mousse were encountered, yellow discolored water was often
noted to float on top of the mousse (particularly in calm sea conditions).
Most of the mousse balls or pancakes were a light chocolate brown in color and
68
—. . ..-_ ___________ .—. .._ . . ..-

——. — — --- . .. —.— —.—
had a cerebral (brain-like or “popcorn ball”) appearance. Many of these ap-
peared to contain large (several cm) pockets of water. Several such mousse
balls were observed to melt and separate into water and oil when they were
removed from the water column and exposed to sunlight. With this occurrence
the color changed from a light chocolate brown to a dark brown/black or mahog-, any. Attempts to separate such mixtures by centrifugation and heating onboard
the Researcher were unsuccessful. At other stations, mousse was observed to
be associated with large quantities of marsh detritus and sugar cane stock,
and it was hypothesized that these materials provided sites of nucleation upon
which additional aggregation of mousse could occur.
Subsurface TransDort and Weathering of IXTOC Oil
Because of the sub-surface release of the oil at 60 m, significant
amounts of the particulate oil droplets were transported horizontally for
20-30 km distances before the oil surfaced and was exposed to evaporative
loss. Accoustic profiling was completed by Walter and Proni (1980) and by
Macaulay et al. (1980), and subsurface water and oil-in-water dispersions
immediately beneath the surface slick were collected and studied by 130ehm and
Fiest (1980). Concentrations of particulate and/or colloidal petroleum in the
top 20 m of the water column within 25 km of the wellhead, (beneath the sur-
face slick), exceeded the maximum values observed in the other spills con-
sidered (Ekofisk Bravo blowout, 300 )g/1, Grahl-Nielsen, 1978; Amoco Cadiz— .spill, 350 )g/1, Calder et al. 1978; and the Argo Merchant, 450 )g/1, Gross
and Matson, 1977) . The total amount of petroleum estimated in the top 20 m of
water within 25 km of the well at the time of the sampling cruise was equal to
20,000 gallons or 70 x 106 grams. This was estimated to be approximately 1%
of that observed on the surface. Therefore, Boehm and Fiest (1980a) hypothe-
sized that for this type of sub-surface blowout , about 1% of the higher molecu-lar weight hydrocarbons would be present in the water column for considerable
distance from the wellhead. Of this material, about 90% was believed to be
particulate and about 10% in the truly dissolved state.
,.
69
--- . ..— —— .-. ..—. -. .. -—— .——

——. — —— --
Before the passage of Hurricane Henri, a vertically stratified water
column existed, and the transport of much of this dispersed oil appeared to beassociated with density gradients in the water column. Boehm and Fiest re-
ported subsurface particulate material at distances up to 25-30 nautical milesfrom the wellhead, and Payne et al. (1980a) measured dissolved and particulate
bound hydrocarbon loads above but not below significant density gradients atdistances up to 20 nautical miles from the wellhead. After the passage of
Hurricane Henri, the water column appeared to be nearly homogeneous from the
surface to the bottom in the vicinity of the wellhead, and at that time higher
levels of particulate bound hydrocarbons were noted in samples collected 5 mabove the bottom (Payne et al., 1980a). It was not possible, however, to
differentiate between the possible settling out of oil scavenged from the
entire water column by the heavy particulate load vs. nearbottom re settling
of resuspended bottom sediments which had been previously oiled. Followingthe storm it was noted that concentrations of dispersed or SPM bound oil were
generally 1-2 orders of magnitude greater than concentrations of oil in thetruly dissolved state (Payne et al., 1980a). The particulate phase contained
primarily the higher mo?ecular weight aromatics while the dissolved phasesshowed evidence of preferential dissolution of the lower molecular weight
aromatics and alkyl-substituted naphthalenes. Whole water samples beneath theslick showed the presence of both low and high molecular weight compounds
(Boehm and Fiest, 1980a).
By the time much of the subsurface oil droplets reached the surface
significant weathering and removal of lower molecular weight components had ,
already occurred. Thus, many aromatics were lost from dissolution rather than
evaporation because of the sub-surface release. Payne et al. (1980b) measured
quantities (up to 100 ~g/1) of benzene, toluene, ortho-, meta-, and para-
xylenes and other selected aliphatic and aromatic compounds in the water col-
umn immediately benath and adjacent to the surface slick, and air samples
obtained on TENAX’” traps immediately above the slick illustrated that dissolu-tion rather than evaporation accounted for removal of many of the more water
soluble components during transport through the water column. Significantly,
70

.—— ..- .———- -. .._— —. ..—
only traces of benzene were observed in the air (particularly in comparison
with toluene, xylene and aliphatic and cyclo-alkane comoounds with similarmolecular weights and vapor pressures, but lower water solubilities) at dis-
tances as close as 3/4 of a mile from the wellhead. Using selected ion
monitoring GC/MS, no positive identifications of benzene could be observed in
the air (level of detection 1 ppb) above the slick even though pre-field
studies had demonstrated the applicability of the technique for determining
benzene and alkyl-substituted lower molecular weight aromatic and aliphatic
compounds in a certified Matheson gas standard of benzene in air and in air
samples collected over several test spills of gasoline and oil. Brooks et al.
(1980) also measured significant quantities of benzene and other lower molecu-
lar weight aromatics in the water column. Their analyses also demonstrated
that traces of these components were present in the oil slick as close as 1/2
mile from the wellhead, although they were at significantly reduced quantities
compared to the higher molecular weight compounds above nC-10. In that these
lower molecular weight aromatics generally constitute a fairly significant
portion of most crude oils, their rapid removal during transport from the
bottom to the surface was noted. Continued evaporative processes then domi-nated, such that by the time the surface oil had traveled several miles from
the S1 ick, (to where
with vapor pressures
1980b; Brooks et al.,
Thus , whi 1 e
water column in the
significant mousse formation was noted), most compoundsless than that of nC-11
1980) .
very high concentrations
were removed (Payne et al.,
of oil were measured in the
immediate vicinity of the wellhead 10,600 vg/1 within
several hundred meters of the blowout to (5 ~g/1 at a distance of 80 km) this
oil was generally in the form of a sub-surface plume of oil droplets suspended
in the top 20 m of the water column (Fiest and 130ehm, 1980). Only the morewater soluble mono-cyclic aromatics appeared to be in the form of a true solu-
tion in this region, and this was attributed to enhanced dissolution from thehigh surface to volume ratio of sub-surface oil droplets.
71
. ..-.. —- . .
.—. —-—..
observedlow, and
At short (~ 10 nautical mile) distances away from the wellhead and
surface plume, water column concentrations were observed to be verythey approached those generally observed in more pristine environ-
ments (Payne et al., 1980a; Payne et al., 1978). As noted above, significant
quantities of the oil in these outer stations were associated with suspended
particulate material, and it was hypothesized that the high concentrations ofSPM in the water column acted to scavenge the remaining dispersed and semi-
soluble components from the water column thus, eventually leading to theirremoval via sedimentation processes (Payne et al., 1980a). Interestingly,
significant quantities of IXTOC oil were not observed in sediment samplesobtained near the wellhead, and this led 8oehm et al. (1980b) to conclude that
only 1 to perhaps 3% of the spilled oil would be foundThese observations may be confounded however, by the fact
samples were obtained after the passage of Hurricane Henri
in the sediments.
that the sediment
such that much ofthe recently deposited sediment load was resuspended in the water column and
not amenable to collection. Secondly, all of the sediment samples wereobtained with a Smith-McIntyre grab sampler, and with such a device the sur-
face 1-2 cm can be disturbed and lost during the sampling operations (Callahanand Soutar, 1976). If either of these factors were in operation, then arti-
ficially low values of hydrocarbons would be measured in the sedimentssurrounding the well head.
Observations of Micro-Scale Mousse Formation
Uith regard to mousse formation, a 26-mile downplume transect was
occupied on the vessel G. W. Pierce and continuous time-series observations of——the surface oil behavior, the loss of volatile compounds due to evaporation
and the eventual breakup of the continuous oil slick into 0.5 - 1 cm sizeflakes or droplets were made. During this transect, no significant stable
mousse formation was observed up to a distance of 12-18 km from the well head.The estimated age of the oil droplets or flakes at this point would be any-
where from 13-19 hours. At that distance (and time), an interesting agglomera-tion phenomena of these small (snowflake to cornflake sized) heavily weathered
72
. . .-. --—4— . .. —.. -—— . . . . . . . . . .

.—. —
oil flakes was noted in a narrow 1 m band along the leeward side of the ves-
sel . With the main engines off for a 2-3 hour period on the evening of 19
September 1979, the G. W. Pierce oriented itself perpendicular to the wind,
and the combined effects of small waves from the rolling vessel and the wind
(5-10 knots ) which swirled over the lee side as an eddy current, caused the
oil flakes to concentrate as a 1 m wide band approximately 1-2 meters from thehull . ‘This band was observed along the entire length of the ship, and there
was no such accumulation of flakes or tar lumps along the windward hull. Asthese well weathered flakes were agitated by the waves from the gentle roliing
of the ship, they repeatedly contacted one another, and a number of the
smaller flakes were noted to aggregate into larger balls. Considerable silver
sheen was also present in a concentrated band, although it appeared to spreadfurther from the hull than did the flakes and the tar/moussa balls. Internal
markers were added to the flakes in the form of chips of styrofoam or piecesof paper to ensure that time series observations of these flakes would not be
compounded by drifting into different oil/particulate mixtures. These markersremained with the oil droplets for 10-25 minutes before sinking and did not
move more than 20-30 feet aft during observations. With time (45 minutes),the corn
suit in
flake sized droplets consolidated into penny sized balls.
To determine if continued gentle agitation of these flakes would re-
agglomeration of larger tar/mousse balls, a bucket cast of these
flakes and tar balls was obtained. (lne golf ball sized mousse ball and 10-15snowflake to cornflake sized pieces (3-12 mm) were isolated. The ball andflakes were left on the water surface in the bucket, and the side of the
bucket was tapped lightly setting up a number of small (l-Z cm) standing
waves. After 5 minu;es, the smaller pieces began to aggregate together whenthey bumped, and most of them eventually adhered to the larger piece. At 5-7minutes, there was only one large mousse ball and 2 semi-large (quarter-sized)
flakes. The rest of the flakes had been observed to stick to the ball, and as
it grew, approximately 50% in size with a large irregular shape, it was
obvious that a similar mechanism could lead to the cerebral-like appearance of
tar balls and pancakes observed at various locations around the wellhead.
73
.. —...__ ——. .———— - . . . . . __..—
—
That is, as one layer of flake adheres to the next, a popcorn ball type matrix
with significant water entrapment is generated. Then with continued wave
agitation this agglomerate would be compressed into the irregular shapes noted
during the cruise. Thus, this formation mechanism could be used to explain
the cerebral appearance of the cantelope size lumps located near the wellhead.
After standing in the still water in the bucket for approximately 30 minutes,
the golf ball sized tar ball and the two remaining flakes eventually formed
one body. This was later broken up into two pieces which again came together
with time. Chemical characterization of these flakes later showed the composi-
tion of this material to be identical to that obtained from several of the
larger mousse patches and from a large beached mousse sample obtained at
Laguna Madre (Payne et al., 1980a; Overton et al., 1980b).
Thus, one hypothesis for mousse formation in the IXTOC spill, would
be that the breakdown of the continuous oil slick proceeds through the dissolu-
tion and evaporation of lower molecular weight components leading to a thinsemi-continuous oil film. Photochemical oxidation and continued evaporation
then eventually caused this slick to break up into streamers or partiallysubmerged droplets or f?akes. Sheen leads to the removal of many of the lower
molecular weight materials and enhances dissolution and evaporation, and withthis, the volatile and lower molecular weight aromatics are gradually removed.
The residual surface droplets, which resembled corn flakes or snowflakes in
the water column, no longer had a runny consistency and appearance to be very
sticky. At this stage, surface spreading is no longer a factor and the flakescan exist as discrete particles. These tar flakes were observed to collect inwind rows or against the side of vessels, and under the influence of turbu-lence from wal~e energy they bump into each other and gradually aggregate into
larger particles. With continued addition of small flakes, or after nuclea-tion on drifting detrital materials such as sugar cane stock, these materials
then formed larger oil bodies. This aggregation pattern was completely ran-dom, and thus, could help to explain the cerebral (brain-like appearance) of
the larger clumps of the mousse collected earlier during the IXTOC cruise.This hypothesis tends to indicate that, at least in the case of this spill,
74
.
. . .- - -.. . . . .. -—-.-— —.. .— -— ..- ---- — —. .- - —. —

-.—— ..— .—
the mousse balls and tar balls are growth products from sma~ler particles in
addition to breakdown products from the larger emulsified slicks. Such forma-tion could occur in wind rows of oil flakes (which were an observed phenomena)
or in standing wave situations.
In this instance, the formation or aggregation of mousse only ap-
peared to occur after significant removal of lower molecular weight compounds
by evaporation and dissolution and photo-oxidation of the slick to generate
the appropriate surface active materials to stabilize the water-in-oil emul-
sion and mousse agglomeration. Overton et al. ( 1980a) identified a number of
fatty acid methyl esters and normal fatty acids from C-7 to C-n and branched
fatty acids from C-9 to C-12 after photo-oxidation of fresh IXTOC crude oil.
Alkyl-phenols, alylic benzoicacids with anywhere from C-1 to C-6 alkyl-
substitutes, alkyl-substituted naphthols, alkyl-substituted naphthanoic acids
and alkyl-substituted
alkyl benzothiophene
these compounds couldmousse formation.
phenanthroic acids were also identified in addition to
acids and alkyldibenzothi ophene acids. Any number ofact to further stabilize water-in-oil emulsification or
Although many of these compounds would be expected to be leached from
the oil surface as they are formed (or during extended weathering) they might
serve to help stabilize the aggregation products of the smaller flakes. Evi -
dence for this is suggested in that samples of beached tar from Laguna Madre
were examined by Overton, et al. ( 1980b), and the outer surface of thisbeached mousse consisted primarily of n-alkanes with limited numbers of aro-
matics and no sulfur containing compounds detected by a Hall detector. Themiddle portions of the mousse had higher aromatic contents and a number of
peaks that responded to the sulfur detector. Weathering thus appeared to— remove the oxygenated products from the surface of the mousse ball but not
from the interior. Figure 6 shows the relative aromatic concentrations of
selected PNAs in the IXTOC crude oil
station PIX-13 (during observation of
Figure 7 shows the relative aliphatic
and in the mousse flakes obtained at
micro-scale mousse ball formation) and
distributions for the IXTOC crude, the
75
..—.—. ——.-.— . . . ..— - . ____ ._

—.—— ..—
A
3/
CA=3CN WN9E3 —
ii ‘2
B
FIGURE 6.
—— - —.
CARSON ‘ IU.3E,? —
RELATIVE ABUNDANCE OF ALKYL-SUBSTITUTED POLYNUCLEAR AROMATICHYDROCARBONS IN IXTOC CRUDE OIL COLLECTED 1/2 MILE FROMTHEWELL HEAD (A) AND VOUSSE FLAKES COLLECTED 16-18 P!lLES FROHTHE WELL HEAD (P-13) DURING THE Gld PIERCE IY3!d!!-PLUP!E TRANSECT.NAPH = NAPHTHALENE, 51BEN-S = DI~NmPHENE, FLUOR =FLUORANTHENE, PHEN = PHENANTHRENE, PYR = PYRENE: CARBON NUHBER
= NAPHTHALENE, ll=C - NAPHTHALENE, 12 = C2 - NAPHTHALENE,EC. (FROM PAYNE ET Al.. 1980a. I
76 ‘. ..—. _______ .-. — .— ___ . . _____ _ .-.

.—. — ———
-1
/’/
I#-#’ f
/
/“.
77
L
-—-—- --.—— _____ . . . . . . . . . . . . . . . _ .—. — . . . .

mousse flakes described above and the beached mousse sample obtained at Laguna
Madre (Payne et al. , 1980a). Clearly, the alkyl-substituted naphthalenes,
benzothiophenes, dibenzothiophenes, phenanthrenes, flourenes and pyrene are
present at much higher relative concentrations in the mousse than the alkyl-
substituted naphthalenes in the starting crude. Likewise, the distribution of
the aliphatics shows that in the flakes and beached mousse, compounds with
molecular weights less than nC-14 have been significantly removed. Based on
the observations in the field, it is believed that this weathering process
occurred before mousse flake or tar ball agglomeration/formation occurred.
Table 6 presents ratios.of nC-25 to nC-16, nC-25 to nC-19 and phytane to nC-18
with depth in the beached mousse collected at Laguna Madre, and these data
clearly suggest the lack of any significant microbial degradation or differen-
tial weathering after formation. Again, it appears that overall chemical
weathering occurred in the bulk of the oil begfore agglomeration into the
larger 1 m2 patch which was eventually stranded in the upper intertidal zone.
With regard to microbial processes relating to mousse formation,
Buckley et al. (1980) reported that Vibrio bacteria populations were associat-ed with the mousse, but that microcosm experiments showed little chemical
evidence of microbial degradation of the bulk oil. This was attributed toeither the large influx of oil which masked any minimal changes due to micro-
bial activity or as Atlas postulated (1980) to the lack of nutrients in thewater column in the Gulf of Mexico at the time of our observations. Another
possibility was that microbial populations were inhibited by toxic effectsinherent to the IXTOC I oil (Buckley et al., 1980; Ron Atlas, personal communi-cation). Specifically, in the microcosm experiments, fresh oil inhibitedamino acid uptake, and microbial activity could only be stimulated after 5
days, whereas mousse enhanced amino acid uptake immediately, suggesting thatthe removal of toxic components later allowed microbial populations to accumu-
late if they were capable of hydrocarbon utilization. Overton et al. (198(lb),
in analyzing samples from the microcosm experiments, stated that no evidence
of nC-17 or nC-18 removal relative to pristane and phytane was observed infresh oil and mousse microcosms.
78
d
. - - - - . . . _ ._-__e ___

TABLE 6. SELECTED COMPONENT RATIOS,FOR THE DISSECTED MOUSSE SAMPLEBEACHED AT LAGUNA M4DRE (STATION RIX 23). (FROM PAYNEETAL., 1980a.)
Oepth ~3atqlei Be?cu SkirI ‘25/&16 Hc25/ti19 Phytane/*18
pl surface 3 nxn 3.1 0 . 6 6 “ 0.46
02 3-8 Inn 4.3 1.05 .0.42
03 6-13 m 2.6 0.63 0.46
04 16-23mu ,. 2.3 U.61 0.44
95 Heeds —
06 ‘ 5-10 III fmel L4 0.69 -0.44battasl
07 bottw511ml 2.9 0 . 7 9 0.46
ml represents the sample frmthe air/mousse fnterface and 07 thatfrcm the sandheusse interface.
79
—.— . ----- ..- . ..__ .

—— — .— . ———. —.. .-—
During the meeting of the Researcher/Pierce cruise ”synthesis steering
committee in February 1981, it was postulated that the presence of living or
dead microbial biomass on the surface of mousse flakes may enhance agglomera-
tion stability, and it was offered as one explanation for the increased non-chromatographable residual material noted by Boehm and Fiest (1980b) in many
of the mousse samples. Atlas et al. (1980) indicated that microbes associatedwith the mousse could be sluffed off during incubations, however, he also
found that microbial degradation of the mousse in the IXTOC spill was extreme-ly slow, and that only 7% of the mousse was actually mineralized during 180
day incubation periods. No changes in nC-17/pristane and nC-18/phytane ratioswere observed up to 120 days in the incubations and nutrient limitations were
suggested as being the biggestfor example, where mousse was
isms appear to degrade mousse
ably due to the availability
factor. Only in specialized micro-environments
associated with plant material, did microorgan-
particles at higher rates, and this was presum-
of nutrients from the decaying plant material
(Boehm and Fiest, 1980b). Similar observations were reported by Blumer et al.(1973) for stranded tar bal 1s associated with decaying seaweed in the upper
intertidal zone.
. .Fate of Stranded IXTOC Mousse ~long the Southeast Texas Coastline
With regard to the persistence of beached IXTOC mousse, Gundlatch et
al. ( 1981) described several large patches of mousse observed on the south
Texas coast. During August and September 1979 large patches of mousse cameashore along much of the south Texas coastline. In addition, 20 miles ofnorth Padre Island and 4 miles of Brazes Island had heavy coverage. Duringthis period the oil that reached the shorelines was estimated to be 3,900
tons. Due to storm activities the shoreline became noticeably cleaner due todeposition of sand over the surface oil, and the desiccation of mousse to tarcaused a reduction to at least half the original volume. On September 3-6,calculations revealed that approximately 31% of the beached oil was on the
surface, 53% was buried and 16% remained within the swash zone. Thus, eventhough the beach surface appeared cleaner, the actual mousse content stayedapproximately the same.
80
.—.—— . . . . .—- , ——. —.. .

.— . . . ——— .-- .--— . .
On September 13, very high tides, strong onshore winds and 1-2 m
waves were generated by tropical storms, and within 2 days, over 90% of the
oil from the shoreline was removed. The authors noted a significant amount of
sheen in the surface swash zone as waves reworked the sediments, however, the
small amounts of oil that remained were found primarily high on the beach
along the base of a four dune ridge. The sample of beached mousse from Laguna
Madre, described above, was found in this high beach zone region, and as
stated earlier, the chemical composition was remarkably similar to mousseflakes obtained only 13-16 miles from the site of the IXTOC wellhead. After
the mid-September tropical storms, at least 36 “tar mats” (deposits of mousseand sediment) were discovered.
formed from the large oil/moussewith sediment during the tropical
It was believed that these tar mats were
masses which were then compressed and mixedstorm.
Seven months later, during mid-April 1980 only 19 of the tar matswere still visible, and two different types of mats could be differentiated bycolor, sediment and vegetation content (Sadd, 1980). The largest mat was 65 m
long, 7.5 m wide and 20 cm thick, and it was composed of 7% oil, 14.7% water(showing significant desiccation) and 77.6% sediment yielding a specific grav-
ity of 1.38. The amount of oil incorporated in the 19 measured tar mats wasestimated to be 180 tons or less than 5% of the maximum quantity of oil found
on the Texas shorelinetaken in August 1980,
mats remained, and inseveral new tar mats
ability of these mats
during September 1979. A final beach ~urvey was under-
a week after the passage of Hurricane Allen. The tar
fact, because of the erosion of sand from the storm,
(though general ly very smal 1 ) became uncovered. The
to endure Hurricane Allen suggests that they will per-sist for several more years.
Deposition of oil was found to vary with beach type such that when
oil was buried along shell beaches, penetration as deep as 40 cm occurredwhereas on fine-grained, sandy beaches tt reached a depth of only 7 cm. Small-
er patches of mousse were observed to be broken up into tar balls by stormactivities and these were commonly found along the bottom within the shoreline
.
81
.. -.-—- .-— —._— .-. .—-——-. .
.—— —.. ..— .
,
break and swash zone inshore of the first sediment
rapidly decreased in size from 1-5 cm to less than 1
“armored’’tar balls appeared to be the most common
sandbar. The tar balls
cm, and sediment laden or
at the shorebreak and on
the first sandbar. Seaward of the first sandbar tarballs became very sparse,
and very little evidence was found of great quantities of nearshore bottom
oil. Within the first trough, sediment laden mousse patches of up to 3 x 4 m
and 10 cm thick were sparsely scattered. In conclusion of more than 476,000
tons of oil estimated to be released by IXTOC-I into the Gulf off Mexico, lessthan 0.8% washed ashore in Texas and after the storms one year later less than
0.04 remained as tar mats. As has been observed for other major open ocean
and nearshore spills, longer term persistence in lower energy lagoons and estu-
aries is anticipated.
Burmah Agate
The tanker 13urmah Agate and the freighter Mimosa
buoy in the Galveston, Texas-ship channel on November 1,
were engulfed in flaming crude, and large quantities of
collided near a sea
1979. Both vessels
a light (39.3° APIgravity) Nigerian crude oil were spilled from the Burmah Agate. A heavier——21.9° API gravity Nigerian crude held in the Burmah Agate was not believed to
be spilled. The spill was fairly continuous for the first few days, and thenintermittent flow was noted to continue until January 8, 1980 when the fire
was extinguished. Approximately 263,000 barrels of the original 400,000 bar-rel cargo were estimated to be ultimately spilled or burned, and an estimated
630 barrels of residue remained in the burned out tanks after the fire was
extinguished. The initial slick was noted to move 12 miles in approximately
12 hours and approached a width of 500 ft. with thickness of 0.1 inches
(Kel 1 ey
was not
various
oil was
et al., 1981).
This is one example of a substantial oil spill where mousse f,~ation
noted. or believed to be a significant problem. In correlation withlaboratory studies, this presumably reflects the fact that the spilleda light Nigerian crude which would not be believed to form a viscous
82
—.. —— ————.——. —— -- . . . . . . ..— -... .
—. —— .— —
mousse. No direct references to the presence or absence of mousse were cited
in several reports on this spill, and observations of the slick behavior
suggest that mousse formation was not a problem in this incident. On the
third day after the spill, the slick was transformed into a Z formation by the
influence of estuary currents, and the oil was observed to pool against the
ships hull while still being quite fluid in patches as long as the length of
the vessel. On the fourth day following the spill, wind directions were noted
to change and the oil moved with the wind in closer to the shore and formed
wind rows parallel -to the wind before impacting the shoreline at Galveston.
The fluidity of the oil and the observed changes in shape of the slick as
influenced by the wind and tidal currents were taken as evidence to further
support the lack of any significant mousse formation problems.
Open Ocean Field Tests of Spilled Petroleums
Several controlled open ocean spills have been conducted to determine
the chemical and physical behavior of crude oil in the early minutes and hours
after the oil is released (JBF/API, 1976). Approximately 440 gallons of alight and heavy crude oil were spilled separately in four studies in both calm
and rough seas in October and November 1975, approximately 75 miles east of
Boston. A Murban crude (SG, 0.83; 39.0% API) and La Rosa crude (SG 0.91;
23.9% API) were used in the studies, and while the Murban crude appeared to
initially spread faster than the La
total slick area because of greater
observed to form lenses or globs of(down wind) edge of the slick.
Rosa, the latter may have gained a greater ~
surface slick persistence. Both oils werethicker portions of the oil at the leading
Evidently these thicker masses exhibited
higher wind resistance and had a different frictional resistance at the oil-
water interface compared to the thinner slick and sheen which trailed behind
them. Hollinger and Mennella (1973) have reported that as much as 90% of the
total oil may exist in such thick patches in open ocean spills. While thelenses appeared immediately after the spill, the formation of “mousse” ap-
peared to be delayed by 60-90 minutes, and then only occurred in selectedconditions. In these spill studies, mousse was reported to form with the less
83
——-- .— ..- . .

—-. .—-— — ——. . ——
dense Murban crude, but not with the La Rosa. Surprisingly, mousse formationwas only specifically mentioned in the 1976 article for the Murban crude,
whereas one might have a priori expected the Venezuela crude to have formed a
more stable emulsion because of its higher specific gravity and several labo-
ratory studies which have shown that Venezuelan crudes (in general) are cap-
able of forming stable mousse. As in the IXTOC case, it appeared that mousse
formation only occurred after sufficient time had passed to allow significant
evaporation and dissolution of lower molecular weight components.
One of the most significant outcomes from these studies was the re-
commendation that time-variable factors for the behavior of thicker lenses and
mousse be incorporated into mathematical and descriptive models for more accu-rate oil weathering and trajectory. Specifically, it was noted that the non-
homogeneity of the oil slick must be considered when predicting oil spill
transport, spreading and behavior. Such approaches have been undertaken by
Berridge et al. ( 1968b) and more recently Grose ( 1979). Further, it was notedthat the chemical differences in terms of composition and weathering rates
between the lenses and the thinner oil films should be established. Approach-es to studying these
al. (1980b) and Boehm
In 1978 and
differences in chemistry were undertaken by Overton et
and Fiest et al. (1980b) for the IXTOC spill.
1979 four additional tests were conducted, 1 each year
off of New Jersey and southern California (McAuliffe et al., 1981). The 1978
east coast studies consisted of 4 10-barrel spills using the same Murban and
La Rosa crudes, however, in these instances the slicks were sprayed by heli-copter with a self-mixed dispersant after 2 hours. With this treatment the
Murban crude was almost completly dispersed, ?.nd” the La Rosa about 1/2 dis-
persed. Concentrations in the water column up to 18 mg/1 at 1 meter were
found to grqatly exceed those previously observed in the 1975 spills under
natural dispersion.
In the September 1979, controlled oil spills, 10 to 20 barrels of
Alaskan Prudhoe Bay crude oil were discharged off of Long 8each, California.
84
u
—. .. —..- . .—-. .. —-- ..-— _____ ..-—. — . . . ..— ---- .-. — . . ..- .

.—— . . .—— —. _____ .-—. ..— —.. —
.-
In this instance different approaches to dispersant application were incor-
porated into the experiments, and untreated slicks were used as controls.
Three slicks were sprayed with a self-mixing dispersant from a DC-4 aircraft,
three were sprayed with the same dispersant from a boat, and one was sprayed
with a second dispersant from a boat. Chemical analysis snowed that 45-80% of
the oil was dispersed by aerial treatment, and the lens (thicker oil patch)
phenomena noted in the 1975 spills was specifically address~d with regard to
its behavior after treatment with dispersants. When the lenses of the thicker
oil were treated from the surface vessel, 60% of the oil could be successfully
dispersed whereas when the entire slick was uniformly treated, dispersment of
only 5-10% occurred. In the southern California spills it was also noted that
the chemically dispersed oil had a lower tendency to adhere to solid surfaces
such as bird feathers, rocks, sand and sediment in the water column. Del ayed
application of dispersant was also incorporated into the tests to study its
effect on a more dense and viscious weathered oil. Thus while the fresh
Prudhoe Bay crude oil had an API gravity of 26.6° API (0.90 g/ml) and a vis-
cosity of 183 centistokes at 15.6°0, the partially weathered crude (23% volumenC-11 and less removed by distillation) had an API gravity of 22° (0.92 g/ml)
and a viscosity of 1210 centistokes.
In general, it was observed that dispersants sprayed from the air-
craft more effectively dispersed Prudhoe Bay crude oil than when applied from
a spray boat. The dispersants worked best when applied neat, as dilution with
water destroyed the “self-mix” property that caused fine oil-in-water dropletdispersion. The amount of dispersant applied also resulted in differences in
removal of oil from the water surface. In 1978, the aerial application of4.9% dispersant resulted in 78% dispersion of the oil, whereas a 3.6% disper-
sant application yielded only 60% dispersion. When the Prudhoe Bay crude oilwas allowed to weather on the water surface for 2 hours (as opposed to 15 rein)
before treatment, the dispersant efficiency decreased with only 45% of theslick vs. 60% of the slick being removed (McAuliffe et al., 1981). In allcases, the best results were obtained when the thicker portions or lenses ofthe slicks were treated directly. It was not stated in any of the articles
85.-./
.._. .— ___ ________ .--c . . . . . . . . . . . . . -—. . . . .——. -

.— —. . . . . . ..- .—— — . . . . ..—.
whether
strated
for the
sheens,
this thicker material was a true “mousse”, but the data clearly demon-
that dispersants must be applied to the heaviest part of the oil slickbest results. Dispersants applied to thin oil patches or surface
greatly overtreats them while not affecting the thicker oil. When the
entire slick surface was rather uniformly sprayed, only 5-8% of the slick
dispersed as opposed to 62% when the spray was concentrated on the thicker
portions or lenses.
Smith (1977) has reported on the results obtained from several
planned oil spills using #2, #4 and #6 fuel oils, light crude oil and heavy .
crude oil. All of the oils moved parallel to the wind direction, and a tear
drop formation similar to that described above for the Murban, La Rosa andPrudhoe Bay crude oil spills was noted. That is, after a period of time the
circular oil slick became distorted into a tear drop profile with the thickerportion of the oil concentrated near the down-wind leading edge of the slick
with a long tail of increasingly thin oil extending towards the point of re-lease. This was observed for all oil types and all wind conditions, but was
more noticeable in the low to mid-range conditions where the thin tail was notas rapidly dispersed into the rough seas. This again documents the importance
of incorporating time-variable and area-variable slick thickness parametersinto algorithms for modeling oil weathering behavior. In general, the thicker
oil slicks exhibited a greater leeway and moved faster than did the thinslicks. The apparent order of leeway arranged in decreasing magnitude (for a
given wind speed) was heavy crude oil > light crude = #2 fuel oil > #6 fueloi 1 = #2 fuel oil. Interestingly, there was no apparent systematic correla-
tion of either viscosity or density with oil slick leeway. That is, in termsof decreasing viscosity (and desnity), the oils could be arranged heavy crude
oil ~ #6 fuel oil > #4 fuel oil > #2 fuel oil = light crude oil.
The chemistry of the thin vs. thick slicks appeared to be different,and evaporation of volatile constituents occurred more rapidly from the thin-
ner slicks. Thus, in these studies, the thin films were enriched (with time)in the higher molecular weight less volatile constituents including a number
86
. - . —-.—.— ----- —.- .— .—.-——- -.

--—. .—— .—. -.. .- —..
of non-volatile constituents with some surface activity. “One explanation to
describe the observed behavior of the thin films following the leading edge of
the slick was that they had surface active materials which tended to make them
associate with the water surface and thus spread to form a mono-molecularfilm. The results of dye marker studies suggested that the thinner tailing
portions of the film had little or no net velocity relative to the water sur-
face because of the surface active materials. The thicker portions of the oil
present a larger drag profile to the wind, and thus, exhibit a positive velo-
city with respect to the surface water. This lense was noted to fold over o;
itself because of the drag profile of the water, and as in the IXTOC
and in laboratory and field measurements using Prudhoe
own studies, this folding behavior was noted to lead to
and apparent mousse formation in the absence of other
Bay crude oil
enhanced watermore vigorous
I casein our
uptakemixing
regimes.
Conclusions
From the discussions of the various case histories of significant oil
spill events and controlled studies, it can be seen that in general mousse
formation is dependent upon the oil type and that the field observations from
world conditions generally tend to parallel laboratory results. Exceptions to
this field oil spill behavior were obtained with the loss of Bunker C from the
USNS Potomac off Greenland; however, this spill occurred in extremely calm
seas and demonstrated the important role played by physical oceanographic
conditions. The results have also shown that the optimum particle size of
water droplets incorporated into the more stable water-in-oil emulsions in
laboratory mousse formation and field observations of stable mousse appear to
be identical.
Finally, it is important to note the drastic differences in environ-
mental impact in open ocean vs. coastal spills. In most of the open oceanincidence where landfalls were not directly oiled, the overall impact of even
major oil spills such as the Ekofisk Bravo has been minimal or short-lived.
87
. . ..— . ---- . . . . . . . ..— -— -.._ .— .— . . . . . . . . . .._
.— —... .———
When direct oiling of coastlines by oil or mousse occurs, deleterious effects
may last for 10-20 years or more (depending on the energy regime of the coast-
line). In the case of the IXTOC blowout, which was generally considered to beopen ocean, the magnitude and time involved in the spill allow it to be clas-
sified as one exhibiting impact-effects for both open ocean and coastal situa-
tions. Thus, while the loss of hydrocarbons at the wellhead from dispersion,
dissolution, dilution, evaporation and eventual sedimentation may tend tominimize long-term effects in that area, localized and heavy mousse contamina-tion of impacted estuaries, lagoons and higher intertidal zones of beaches
will cause extended damage which may persist for tens of years.
,.../
‘.
88
.—_—__—._ ___ .._ ._._._ ._ . . . ___ .—.—.
. .

—.. ——
TAR BALL FORMATION AND DISTRIBUTION
Numerous reports have appeared in the last decade on the occurrence
of tar balls in surface water samples (Horn et al., 1970; Butler et al., 1973;
Morris and Butler, 1973; Wong et al., 1973; Sleeter, et al., 1974; Mommessin
and Raia, 1975; Butler, 1975a, b; Sleeter, et al., 1976; Smith, 1976; wade et
al., 1976; Pequegnat, 1979; Shaw and Maples, 1979; Geyer, 1981; and van Dolah
et al., 1980). Data from these and other studies were compiled by Clark and
MacLeod (1977) and Table 7, adapted from Clark and MacLeod, presents an up-
dated summary of documented tar ball measurements in the worlds oceans as of
1980. From these data it is evident, as noted by Feldman (1973), that the
Mediterranean Sea is significantly more contaminated with tar balls than is
the Sargasso Sea or the North Atlantic. The North Atlantic and North Pacific
tar ball concentrations were estimated in 1973 to be approximately equal, but
Wong et al . (1973, 1974) showed that there was a significant difference in theaverage levels of tar balls in the western and eastern North Pacific. Tar
balls ranging in size from 0.05 to 3 cm were obtained in 30 of 37 tows in the
North Pacific, and the consistency ranged from hard to soft and tacky with the
majority found in the first category. A longitude center-line of 172.5° West
appeared to separate the western from the eastern Pacific, with average concen-
trations in the western Pacific reaching 3.8 mg/m2 while the eastern Pacific
contained on an average 0.4 mg/m2. As noted above, this range is similar to
that found in the North Atlantic, and in general, it has been noted thathigher levels of tar balls on the sea surface occur either along ocean routes
supporting high densities of oil tanker traffic or downstream from these
routes (Clark and MacLeod, 1977; NAS, 1975; Butler et al., 1973; Morris et
al., 1975) .
Although the distribution of sited tar balls was noted to be highly
variable (variations by a factor of 10 or more found at a single station dur-ing the course of a single day and by as much as a factor of 500 in the course
of a year), estimates of standing crops of tar balls have been made for sev-
eral of the world’s oceans: Northwest Atlantic marginal sea, 2000 metric
89
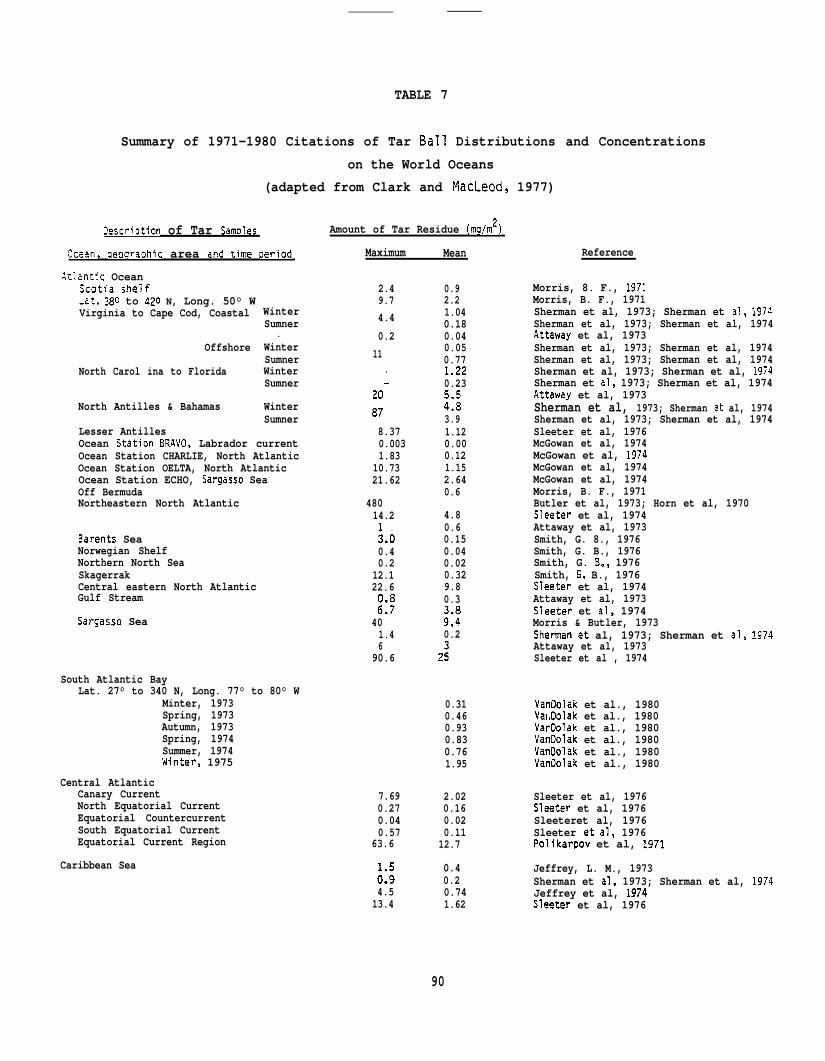
TABLE 7
Summary of 1971-1980 Citations of Tar Ball Distributions and Concentrations
on the World Oceans
(adapted from Clark and Macleod, 1977)
OescrlPtion of Tar Samoles
Ocs~n, qe~graDhjc area and time period
Atlantic OceanScotia shelfi-at. 380 to 420 N, Long. 50° WVirginia to Cape Cod, Coastal
Offshore
North Carol ina to Florida
North Antilles & Bahamas
Lesser Antilles
WinterSumner
.WinterSumnerWinterSumner
WinterSumner
Ocean Station-ERAVO, Labrador currentOcean Station CHARLIE, North AtlanticOcean Station OELTA, North AtlanticOcean Station ECHO, Sargasso SeaOff BermudaNortheastern North Atlantic
Barents SeaNorwegian ShelfNorthern North SeaSkagerrakCentral eastern North AtlanticGulf Stream
Sargasso Sea
South Atlantic BayLat. 27° to 340 N, Long. 77° to 80° W
Minter, 1973Spring, 1973Autumn, 1973Spring, 1974Summer, 1974!4inter, 1975
Central AtlanticCanary CurrentNorth Equatorial CurrentEquatorial CountercurrentSouth Equatorial CurrentEquatorial Current Region
Caribbean Sea
Amount of Tar Residue (mg/m2)
Maximum Mean
2.49.74.4
0.211
.
20-878.370.0031.83
10.7321.62
48014.2
:.00.40.2
12.122.6
$;401.46
90.6
7.690.270.040.57
63.6
:::4.513.4
0.92.21.040.180.040.050.771.220.23
:::3.91.120.000.121.152.640.6
4.80.60.150.040.020.329.80.3
;::0.2
2:
0.310.460.930.830.761.95
2.020.160.020.1112.7
0.40.20.741.62
90
Reference
Morris, 8. F., 1971Morris, B. F., 1971Sherman et al, 1973; Sherman et al, 197~Sherman et al, 1973; Sherman et al, 1974Attaway et al, 1973Sherman et al, 1973; Sherman et al, 1974Sherman et al, 1973; Sherman et al, 1974Sherman et al, 1973; Sherman et al, 1974Sherman et al, 1973; Sherman et al, 1974Attaway et al, 1973Sherman et al, 1973; Sherman et al, 1974Sherman et al, 1973; Sherman et al, 1974Sleeter et al, 1976McGowan et al, 1974McGowan et al, 1974McGowan et al, 1974McGowan et al, 1974Morris, B. F., 1971Butler et al, 1973; Horn et al, 1970Sleeter et al, 1974Attaway et al, 1973Smith, G. 8., 1976Smith, G. B., 1976Smith, G. B., 1976Smith, G. B., 1976SIeeter et al, 1974Attaway et al, 1973Sleeter et al, 1974Morris & Butler, 1973Shennanet al, 1973; Sherman et al, 1974Attaway et al, 1973Sleeter et al , 1974
VanDolak et al., 1980Va],Dolak et al., 1980VarDolak et al., 1980VanDolak et al., 1980VanL)olak et al., 1980VanOolak et al., 1980
Sleeter et al, 1976Sleeter et al, 1976Sleeteret al, 1976Sleeter etal, 1976Polikarpov et al, 1971
Jeffrey, L. M., 1973Sherman et al, 1973; Sherman et al, 1974Jeffrey et al, 1974Sleeter et al, 1976

TABLE 7 (continued)
Summary of 1971-1980 Citations of Tar Ball Distributions and Concentrations
on the Morld Oceans
(adapted from Clark and klacLeod,
Cescriotion of Tar SamDles.,+cs?n, :eouraonic area and time oeriod
Gulf of Mexico
South Texas 1976Winter (Jan. - Feb.)MarchApri 1Spring (May - June)J u l y
AugustFall (Sept. -Oct.)NovemberDecember
South Texas 1977Winter (Jan. - Feb.)MarchADri 1Spring (May - June)JulyAugustFall (Sept. - Oct.)NovemberDecember
Overall average from 2 year study
Mediterranean SeaIonian Sea 1969
1975Alboran Sea 1969
1975Tyrrhenian Sea 1969
1975Balearic Sea 1969
1975Central ( tarbal 1s )Eastern (tarballs)Central (emulsions)Eastern (emulsions)
Northwest Pacific OceanLat. 35°N, Lon~. 140°E to 175°WLat. 25° to 40 N, Long. 1400 to 160°WOutside the Kuroshio Current
Northeast Pacific OceanLat. 35°N, Long. 1750 to 1300WLat. 350N, Long. 175° to 130°W
South Pacific Ocean
Amount af Tar Residue (mg/m2~
,!4aximum !4ean
10.0
:::
540540110
::201510
:.110.00.300.36
1416.3
3
1.21.11.12
.992.2511.210.780.120.270.620.185.92
1.2611.110.410.930.460.081.381.760.561.66
1::16.0
1:::
:::2.40.5
4:1
0.14
3.82.10.4
0.40.03
0.0003
1977)
Reference
Jeffrey et al, 1974Jeffrey, L: M. , 1973Sleeter et al, 1976
Pequegnat, 1979Pequegnat, 1979Pequegnat, 1979Pequegnat, 1979Pequegnat, 1979Pequegnat, 1979Pequegnat, 1979Pequegnat, 1979Pequegnat, 1979
Pequegnat, 1979Pequegnat, 1979Pequegnat, 1979Pequegnat, 1979Pequegnat, 1979Pequegnat, 1979Pequegnat, 1979Pequegnat, 1979Pequegnat, 1979Pequegnat, 1979
Horn et al, 1970; Morris, B. F., 1971Horn et al, 1970; Morris et al, 1975Morris et al, 1975Horn et al, 1970; Morris et al, 1975Morris et al, 1975Horn et al, 1970; Morris et al, 1975Morris et al, 1975Horn et al, 1970; Morris et al, 1975Morris et al, 1975Morris and Culkin, 1974Morris and Culkin, 1974Morris and Culkin, 1974Morris and Culkin, 1974
Wong et al, 1974Wong et al, 1976Wong et al, 1976
Wong et al, 1974Wong et al, 1976
Wong et al , 1976
90a

tons, Gulf Stream 18,000 metric tons, Sargasso Sea 66,000 metric tons, t~tal
Northwest Atlantic 86,000 metric tons, Mediterranean 50,000 metric tons, total
Northwest Atlantic and Mediterranean 136,000 metric tons (Morris & Butler,
1973 and Feldman 1973). The extreme variability in the data and lack of synop-
tic and sufficient measurements from the broad expanse of the world’s ocedns.
make such standing crop estimates tenuous at best, and at this time it is
impossible to determine whether tar ball concentrations are increasing or
decreasing. Further, Wade et al. (1976) in investigating pelagic tar from the
Sargasso Sea, stated that many smaller particles (ranging from 0.3 urn to 1.0
mm in diameter) are present and tnat previous estimates of pelagic tar may be
low because they may not have included the smaller size range of these parti-
cles. Furthermore, Morris et al. (1976) measured tar like particles with
diameters of 1(I to 500 urn in the Sargasso Sea and estimated their total mass
in the water column to a depth of 100 m to be about 4 times the standing crop
of larger pelagic lumps at the ocean surface. These smaller particles would
be more apt to disperse into the water column, rather than contribute to pel-
agic tar, however, so their inclusion in surface tar ball estimates is prob-
ably not’appropriate.
Chemical Composition of Tar Balls
Butler (1973) provided a detailed summary of information on the dis-
tribution and chemical composition of tar lumps found on the surface of the
Oczan up to the end of 1972. Gas chromatographic profiles of a number ofsamples showed that in general, aliphatic and dromatic materials with molecu-
?ar weights less than nC-14 to nC-17 were significantly depleted. and most ~f
the samples showed an evenly repeating series of alkanes out to nC-45. Bimodal
distributions of lower and intermediate molecular weight alkanes were observed
in several instances, and unresolved complex mixtures characterized many of
the samples.
Koons (1973) analyzed 34 tar balls collected from Texas beaches and
the Gulf of Mexico, and the physical appearance and chemistry of the samples
91
.——
was found to vary appreciably. Tar balls ranged in size from a few mm to
several cm, and some SamPles were quite soft and appeared to flow on the beachdue to heating from the sun while others were quite hard, almost brittle, and
could be broken with a clean fracture. The saturated hydrocarbon composition
of the tar balls ranged from 1.6 to 56.1% and the asphaltene contents from 8.8
to 54.7%. Average values of the 34 samples showed: saturated hydrocarbons,
31%; aromatic hydrocarbons, 24%; LC-elutable NSO’S, 14%; non-LC-elutable
NSO’S, 6% and asphaltenes 25%. Evaporation and dissolution had stripped away
hydrocarbons up to nC-15 to nC-17 in all of the samples, and in the fresher
appearing samples, ratios of nC-17 to pristane and nC-18 to phytane did not
appear significantly different from those of the seep oils from the area. The
harder, brittle tar ball samples had undergone appreciable chemical and bio-
logical oxidation in addition to the physical evaporation/dissolution weather-
ing. These latter samples, in general, contained lower amounts of saturated
hydrocarbons (1.6 - 10%) and greater amounts of NSO’S and asphaltenes. Furth-
er, the ratio of saturate to aromatic hydrocarbons decreased significantly (by
a factor of 10) and the nC-17/pristane ratios approached zero. Both of these
observations support significant biological degradation in the samples.
Mommessin and Raia (1975) presented a summary of chemical characteri-zation data on a total of 110 tar samples collected from the northwestern
Atlantic, the Sargasso Sea, along shipping routes in the vicinity of coastguard stations Echo and Delta in the Northwest Atlantic, along the Florida
coast, in the vicinity of New York harbor, along the Texas coast near
Galveston, and from three samples collected near coast guard station November
in the Pacific ocean. The tar ball samples ranged from pea size to 1-3 inchesin diameter, and in general the tars were black or brown/black and had irregu-
lar shapes. Hardness varied from very hard and dry to soft and sticky, andthree of the samples examined were essentially liquid. Surface portions of anumber of samples were shiny with substantial oil stain. As noted in the casehistory of-the IXTOC spill, researchers observed numerous large tar and mousse
balls which showed evidence of accumulation of fresh oil on the surface (as
demonstrated by a significant darker black oil stain).
92
!Wf

. . -. .—. - -—. . .
Several of the tar balls examined in the Mommessin study were coated
with tree leaves, Sargassum, unspecified plants, barnacles, bryozoa and otherpelagic organisms. In other samples, insect> and wood fragments, in addition
to continental plants and leaves along with substantial quantities of quartz
and carbonate sand or clay particulate, suggested that they may have been
beached at one time. In the IXTOC spill, numerous large tar balls and mousseagglomerations were noted with sugar cane stock or other intertidal debris
present, and these substrates were believed to act as sites for nucleation andfurther mousse accumulation. Mommessin also noted pieces of plastic, bits of
buttons, tubing, metal fragments, synthetic fibers, fly ash and rope to befrequently abundant, illustrating industrial and commercial byproducts as a
source for numerous tar samples.
In line with other observations by Blummer et al
(1973), the inside portions of the tars in the Mommessin
not contain materials boiling below nC-12, and residues
. (1973) and Butlerand Raia study did
boiling above nC-34
were very h’igh. Distinct variations were observed for the volatile materials
lower than nC-34, and of the 110 samples analyzed, the median value of resid-
ual material with molecular weights greater than nC-34 was 64%. Of the sam-
ples analyzed, 90% had residues of the nC-34+ material ranging between 38-80%.
In a number of the sample , large peaks were observed at nC-20 and nC-23, and
unlike refined or crude petroleum products which show a smooth distribution
curve throughout the distillation range, the presence of these compounds sug-
gest biogenic material or manufactured chemicals. Most of the samples exhibit-
ing this behavior came from New York Harbor, and were believed to be influ-
enced by urban and/or industrial activities. Only two of the samples hadappreciable lower molecular weight compounds between nC-10 and nC-30 (5 and
12%, respectively); however, the n-C34+ residue contents were the highest in
these samples [70 and 80%, respectively), and the presence of the low boiling
components was taken to suggest that the samples had a relatively short his-
tory in the marine environment.
93

.— —... . —.. .——
The 110 samples were organized into five groups depending on the
molecular weight distributions of the alkanes observed. Tar, asphaltene and,,
resin characterizations were completed on the samples, and sulfur contents in
the tar ranged from 0.1 to 2.7%. The asphaltene fractions generally had high-
er levels of sulfur, with most samples in the range of 1-3.5%. The resin
fractions contain sulfur compounds in approximately the same range as theJ asphaltenes. Infrared spectra of the tar and asphaltene fractions were simi-
lar to petroleum derived waxes and oxidized petroleum products, and generally,the presence of oxygenated carbon compounds was suggested.
The authors concluded that two distinct sources for the types of tarsamples were indicated. One appeared to be due to urban and industrial waste
products, and the other included petroleum based materials modified by various
weathering processes. High sulfur content was noted in tar samples collected
from Florida, suggesting that the samples originated from sour crudes known to
be transported in that area. The substantial presence of specific components
at nC-20 and nC-23, and low sulfur contents with notable carbon double-bond
oxygen infrared absorption suggested that most of the samples from the New
York Bight were derived from waste or manufacturing processes. The higher
boiling normal n-alkanes found in many of the open ocean samples were attrib-
uted to materials found in discharges from tanker washing and ballasting
operations. It was interesting to note that in some instances several samplesd“’ collected from the same vicinity showed similar composition values; however,
many samples collected at the same locations showed no correlation of composi-
tion with location.
Wade ei. al. (1976) analyzed a number of smaller tar particles (0.3 urn
to 1.0 mm diameter) by gas chromatography and infrared spectrometry and foundthat the pelagic tar samples averaged about 32% water (with a range of 11-44%)
and 68% dry weight material. Butler et al . (1973) found that tar lumps fromthe Atlantic ocean typically contained about 25% water by weight. An averageof 53% of the wet tar was soluble in benzene (range of 31-8’9%) and this mate-rial counted for approximately 78% of the average dry weight of the samples.
.
94

.—- ——-.
The benzene
ganic salts,tar samples
insoluble fraction of tar was reported to possibly include inor-
nonorganic debris and higher molecular weight material. The wet
averaged about 16% total hydrocarbon material, and the remaining
weight percentage included non-hydrocrabon organic material, or hydrocarbons
not measured by their procedures (for example, hydrocarbons less than nC-14
and greater than nC-38). Jeffrey et al. ( 1973) found that Gulf of Mexico
pelagic tar samples contained 26% asphaltenes on average, based on the dry
weight of sample. The gas chromatographic analyses showed that the hydrocar-
bon weight percent was predominantly from components in the unresolved complex
mixture (average 79% -- range of 67-97%) which would include a complex mixture
of aromatic and cycle-paraffin compounds. Different degrees of resolved al-
kanes were observed in the different samples, with several showing no resolved
peaks over the UCM, and one showing an evenly repeating series of alkanes from
nC-15 to nC-34. A number of other samples showed alkanes only above nC-25,
with evidence of persistent pristane and phytane suggesting microbial degrada-
tion of the lower molecular weight normal paraffins. Infrared analyses showed
that of the 8 samples considered, all but 2 contained aromatic hydrocarbons.
The elevated levels of NSO compounds found in a number of tar balls
are frequently higher than what might “be expected from simple evaporation anddissolution of weathered crude. This enrichment could quite easily come from
the formation of NSO compounds from petroleum hydrocarbons by photo andmicrobial-oxidation. While these photo-oxidized NSO compounds would have
enhanced water solubilities and might be expected to be removed from the tar
mass, increased diffusion coefficients as a result of elevated viscosities and
specific gravities may prevent these materials from being lost. Also, withsemi-fl~id tar masses folding over on themselves and aggregation of small
flakes during tar ball formation, these materials can be entrained in theinterior where ultimate loss would be inhibited by decreased diffucivities in
the viscous residues. Further, bacteria have been shown to coat the surfaceOf tar balls (Butler 1973), and oxidation products, cellular materials and
bacterial cell wall components can contribute to the residual nonchromatograph-
able materials and NSO compounds.
95

. . —. —— .
Sources of Pelagic Tar
It is generaily
tank washings of tankers
accepted that waxy crude-petroleum sludge from cargo
1s a major source of much of the pelagic tar whichhas been isolated ‘from the world’s oceans (Butler, et al., 1973; Long et al.,
1973; Koons, 1973; Berridge, et al., 1968a; and Blumer et al., 1973). Evi -dence for this source comes from the high content of ferric oxide (as high as
18% on a dry weight basis) in some residues (Attaway et al., 1973) and thepredominance of paraffin-rich wax inclusions which are a common feature in
open ocean tar balls (Blumer et al., 1973). The increased levels of iron arebelieved to originate from rust particles picked up by the oil from steel
tanks or apparatus encountered during pumping, storage and transport of petro-leum by ocean going tankers. The paraffin rich wax inclusions, which are
found in many tar balls, are believed to result from the waxy precipitateswhich can form during production and transport of petroleum products. In
general, normal alkanes are relatively soluble and uniformly dispersed through-out most oils. With long storage and transport at lowered temperatures, how-
ever, these materials can precipitate in a form which adheres to surfacescausing problems in pipelines and tanks (Blumer et al., 1973). This formation
during transport in oil tankers is one of the reasons that necessitates “tankCleanlng, and the fact that such waxy precipitates are not present in free
flowing oil, in submarine seeps or oil from blowouts lead Blumer et al. (1973)to propose their presence as an unequivocal characteristics of oil from
tankers either not equipped for load-on-top procedures or not following thattechnique. The authors also hypothesized that these waxy aggregates may play
an active role in the formation of tar balls, since theweight waxes are not readily dispersed and can provide a
around which additional floating oil may accumulate. Thus ,Stdted that most of the tar balls stranded on many ~eaches
higher molecular
nucleation site
McAuliffe (1977)
was believed to
come from tanker compartment washings, Bunker C discharges or bilge pumping,and he added that most crude oil spills probably contribute little oil appear-
ing as tar balls. Field observations from a number of open ocean and nedr-coastal spills have shown that this is not necessarily the case. As described
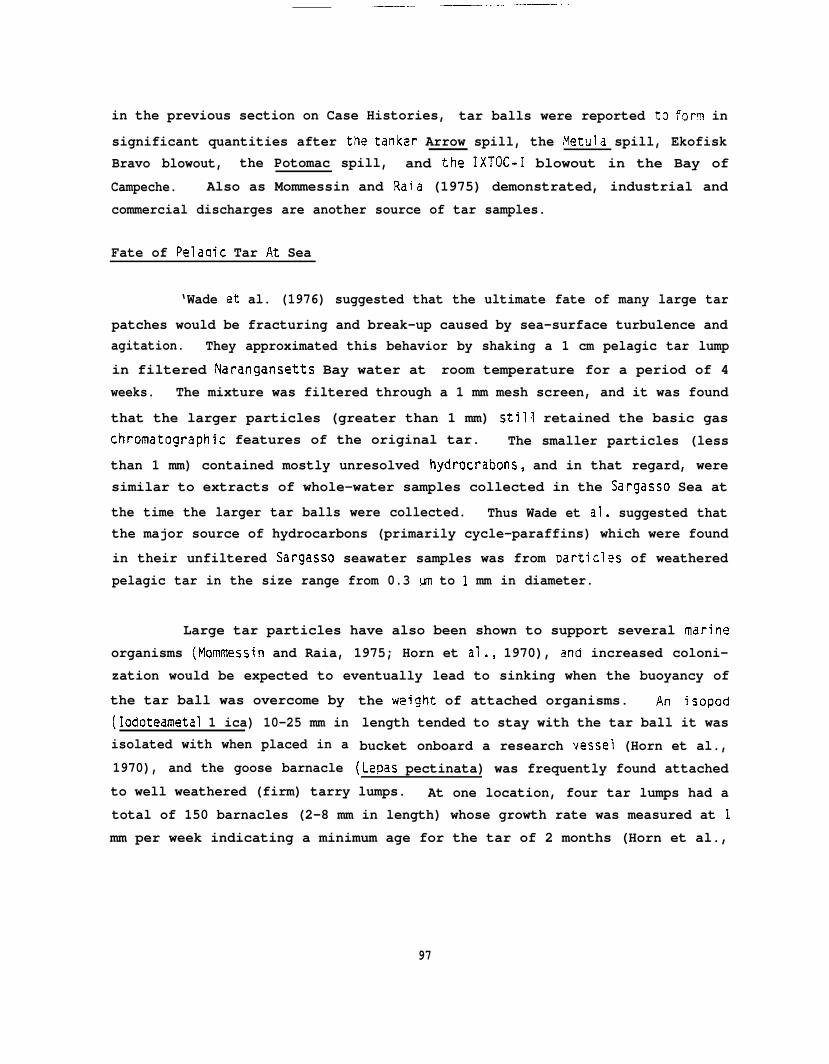
..—. ..— ..- ———— --
in the previous section on Case Histories, tar balls were reported to form in
significant quantities after the tanker Arrow spill, the Metula spill, EkofiskBravo blowout, the Potomac spill, and the IXTOC-I blowout in the Bay of
Campeche. Also as Mommessin and Raia (1975) demonstrated, industrial and
commercial discharges are another source of tar samples.
Fate of Pelaaic Tar At Sea
‘Wade et al. (1976) suggested that the ultimate fate of many large tar
patches would be fracturing and break-up caused by sea-surface turbulence andagitation. They approximated this behavior by shaking a 1 cm pelagic tar lump
in filtered Narangansetts Bay water at room temperature for a period of 4weeks. The mixture was filtered through a 1 mm mesh screen, and it was found
that the larger particles (greater than 1 mm) still retained the basic gaschromatographic features of the original tar. The smaller particles (less
than 1 mm) contained mostly unresolved hydrocrabons, and in that regard, weresimilar to extracts of whole-water samples collected in the Sargasso Sea at
the time the larger tar balls were collected. Thus Wade et al. suggested thatthe major source of hydrocarbons (primarily cycle-paraffins) which were found
in their unfiltered Sargasso seawater samples was from particlss of weatheredpelagic tar in the size range from 0.3 UM to 1 mm in diameter.
Large tar particles have also been shown to support several marine
organisms (Mommessin and Raia, 1975; Horn et al., 1970), and increased coloni-
zation would be expected to eventually lead to sinking when the buoyancy of
the tar ball was overcome by(Iodoteametal 1 ica) 10-25 mm inisolated with when placed in a
1970), and the goose barnacle
the weight of attached organisms. An isopodlength tended to stay with the tar ball it was
bucket onboard a research vessel (Horn et al.,
(Lepas pectinata) was frequently found attached
to well weathered (firm) tarry lumps. At one location, four tar lumps had atotal of 150 barnacles (2-8 mm in length) whose growth rate was measured at 1
mm per week indicating a minimum age for the tar of 2 months (Horn et al.,
97

.—— . ..— -.-—- —- ___— ——
1970) . As noted in the IXTOC spill, and by Mommessln and Raia above, other
detrlal materials are also associated with tar lumps, and accumulation of
these can a?so lead to Increased density and eventual sinking. High levels of
suspended particulate material have been found in tarry residues collected off
of Florida (Attaway et al., 1973), and it was noted by Gundlach et al., (1981)
that sand encrusted tar balls resulting from the IXTOC-I spill were rapidly
removed from the mid and lower intertidal zones of several Texas beaches dur-
ing storm activities. These tar balls were found along the bottom, within the
shoreline break and swash zone. Seaward of the first sand bars, however, they
became very sparse and were presumably dispersed by nearshore currents. Tar
balls generated from heavier crudes, or some petroleum products such as Bunker
C, can obtain high enough densities with the loss of volatile and soluble com-
ponents to reach near bottom waters at significant rates. Following a Bunker
C oil spill in San Francisco Bay in 1971, one to three cm, near buoyant oildrops were observed by remote control television moving just off the sea floor
with bottom currents in 30 feet of water in Bolinas Bay (Conomos. 1975;McAuliffe, 1977). Thus, most pelagic tars are believed to eventually break up
during weathering at sea. These smaller droplets are then dispersed in near-surface waters, and most are believed to remain suspended and be dispersed by
water currents (Brown et al., 1973; Brown et al., 1975; Brown and Huffman,
1976).
Microbial degradation of large tar balls is believed to be only a
minimal factor in their fate since oxygen and nutrient levels would not dif-fuse into the tar balls at sufficient rates to sustain ctegraddtive processes.
Bacterial utilization of the smaller dispersed materials would be enhanced bythe increased surface area-to-volume ratio, and it may play a more important
role in their ultimate degradation.
Butler (1975) evoked a simple semi-quantitative model of evaporativeweathering to estimate the breakup and residence time of petroleum residues at
sea. This model presumed that the evaporative losses were proportional to the
98

_—— —— —.. . . .._—
components equilibrium vapor pressure and the amount remaining in the sample
at a given time. It was stated that the equilibrium vapor pressure would not
be precisely equal to the vapor pressure of the pure compound because petro-
leum is a mixture of compounds, however, large variations in the activity
coefficients as weathering processes occurred were not anticipated or incor-
porated into the model. Although it was noted that as evaporation occurs at
the surface and loss of components within the slick would become limited be-cause of diffusion control, the prospect for diffusion control was not includ-
ed in the model. To more closely approximate observed oil spill behavior,however, artificial parameters were envoked to limit compounds larger than
nC-16 from diffusing” into the surface sheen around the larger tar patches. On
the basis of a mass balance apl
stock of tar with estimates of
fraction of this oil which reman
order of 1 year was obtained in
roach (combining estimates of the standing
the amount of oil spilled annually and the
ns as pelagic tar) a residence time on the
earlier studies (Morris 1971; Butler et al.,
1973). This was not consistent with the predicted lifetime from the evapora-
tive weathering model, however, unless the diffusion rates were smaller than
expected or the lumps collected at sea were but fragments of original lumps
from which weathering began (Butler et al., 1976). Both of these hypotheses
were concluded to be applicable, but they did complicate the quantitative
dating of tar lumps. Estimating the lifetime of pelagic tar at sea is further
complicated by the” observed tendency of larger tar balls to break up into one
‘m to 1 mm fragments which can be dispersed to depths more than 100 in into the
water column.
As noted in the Arrow spill, ingestion of oil particles by copepods
can enhance their sedimentation rates, however, it is still unclear at this
time whether the ultimate fate of dispersed petroleum residues in the open
ocean is biodegradation or sedimentation. From the few sediment samples which
have been analyzed from the top 5 cm of the deep ocean floor in the Sargasso
Sea, hydrocarbon distributions appear to be a mixture of biogenic and petro-
leum mixtures, and the concentrations of these materials (on the order of 50
mg/m2) are comparable to those of particulate in the water column found near
99

—. . . . . . ..—. –- —- .——. .–. .— - -..——- .--. —- -----
the surface (40 mg/m2) (Barrington and Trip, 1975; Butler et al. , 1976). It is
not possible, however, to directly correlate these observations because of
complications from horizontal advection and the fact that it was not clear how
deeply buried the material analyzed actually was, or what the ratio of petro-
leum to biogenic hydrocarbons might be (Butler et al., 1976). Evidence from
the Ekofisk and IXTOC I blowouts also suggests that little of the released oil
from either of these events ended up in the sediments near the well sites, but
as noted in the section on Case Histories, these results may have been influ-
enced by the sampling techniques (Smith-McIntyre grab samplers) and signifi-
cant re-suspension of the bottom due to severe storm activities prior to sam-
pling the sediments in the IXTOC spill.
When degradation rates of known oil
ments have been studied, they were found to(Griffiths and Morita, 1981). Payne et al.
concentrations in benthic sedi-
be very concentration dependent
(1981b) [cited in Griffiths andMorita (1981)] studied the chemical changes which occurred in oiled sediment
plots in 15-30 meters of water in the sub-arctic environment of Kasitsna Bay,
Alaska. The results of these studies showed that the most significant weather-ing of the oil occurred at the air/sea interface or in the water column before
the oil was incorporated into the sedimentary regime. In an experiment whereboth fresh and weathered Cook Inlet crude oil were spiked into the sediments
at one part per thousand (ppt), n-alkanes were depleted, but very little sig-nificant loss of higher molecular weight aromatic hydrocarbons occurred over a
one year period. At spiked levels of 50 ppt (with both fresh and weatheredcrude oil), nearly complete inhibition of abiotic and microbial degradation of
aliphatic hydrocarbons was also observed, especially for those sedimentsspiked with fresh crude. In the 0.1 ppt spiked samples, there was little orno evidence of either aliphatic or aromatic hydrocarbon contamination after
one year. Sediment plots spiked with fresh and weathered crude oil at 50 ppt
plus added nutrients (starch and Chitin) showed no evidence of enhanced bioticrecovery or selective hydrocarbon utilization. It was suggested, however,
that this lack of recovery may have been from the toxic aromatic compounds inthe oil itself, rather than from inhibition of microbial activity by limited
nutrient concentrations.
100

_——...
Fate of Beached or Stranded Tar Balls
The occurrence of tar ball residues on beaches have been reported on
an almost global scale (Morris and Culkin, 1974; Morris and Butler, 1973;Butler et al., 1973; Saner and Curtis, 1974; Sleeter et al., 1976; Wong et
al., 1976; Dwivedi and Parulekar, 1974; and Attaway et al., 1973). Table 8,
adapted from Clark and MacLead (1977), presents the tar ball residues observed
on beach surfaces from a variety of locations.
Because of the ease of accessibility to stranded tar balls on beach
surfaces, their fate and weathering have been better characterized compared to
tar balls dispersed in the water column. As was the case for major oil spills
impacting intertidal zones (considered in the section on selected Case His-
tories), the results of the studies on isolated tar ball degradation suggest
that weathering rates are also dependent upon the degree of exposure, avail-
ability of nutrients and extent of mixing into the intertidal sediments.
Obviously, aside from aesthetic factors, the environmental impacts of tar ball
stranding In intertidal zones are far less serious than those which occur from
massive oilings.
g~umer et al. (1973) conducted a detai led study on the chemical
changes which occurred to stranded tar in Bermuda and in Falmouth Harbor, nearWoods Hols, Massachusetts. In general, evaporation processes predominated,
and after 13 to 16 months the oil retained about 10% of the compounds boilingnear nC-17 to nC-18 and 50% of those compounds boiling between nC-19 and
nC-21. Compounds above nC-23 to nC-24 were not significantly evaporated ctur-ing the extended time spans. In contrast, oil incorporated into bottom sedi-
ments and organisms soon after a spill shows little evaporative loss even aslow as nC-12. Climatic differences between Martha’s Vineyard and Bermuda had
only minimal effects on the evaporative loss. In the Bermuda station, the oilformed a crust which cracked after extended times exposing additional surface
area, arid this perhaps increased evaporative loss slightly.
101

TABLE 8
Summary of 1971-1976 Stranded Tar Ball Distributions
and Concentrations on Beach Surfaces
(adapted from Clark and MacLeod, 1977)
Description of tar samples
Geographic area
Southwest Florida coast, 1 km of shorelineBermudaBarbados, Windward shore
Leeward shorePuerto Rico, North shore
West shoreCentral Caribbean island, Windward shore
Leeward shoreHondurus, Windward shore
Southern CaliforniaSunset Beach (Long Beach)Torrance (Los Angeles)Mussel Shoals (Sea Cliff)Sunrnerland Beach (Santa Barbara)Coal Oil PointGaviota Beach
Beaufort Sea, Canada 264 km of shoreline (1974)Yukon 16 km of shoreline (1974)N.W.T. 10 km of shoreline (1974)N.W. T. 86 km of shoreline (1974)
West India coast
Mount of tar residue (g/m*)a
23190 (mean)
40-62
52-;iZ12-2013-2300-2.2
90-127
0.018-1.350.006-0.920.003-0.600.002-0.381.22-23.9
0.023-1.01
No tar residues380 g grease425 g grease157 g grease a asphalt
4,460 (max.)
Reference
Saner and Curtis, 1974Butler et al, 1973Sleeter et al , 1976Sleeter et al, 1976Sleeter et al, 1976Sleeteret al, 1976Sleeter et al, 1976Sleeter et al, 1976Sleeter et al, 1976
Ludwig and Carter, 1961Ludwig and Carter, 1961Ludwig and Carter, 1961Ludwig and Carter, 1961Ludwig and Carter, 1961Ludwig and Carter, 1961
Wong et al, 1976Wong et al, 1976Wong et al, 1976Wong et al, 1976
Owivedi and Parulekar, 1974
a In g/m2 except where otherwise indicated.
102

.—. . — — ——.
Microbial degradation of the n-alkanes and other components in the
stranded oil depended very significantly on the presence of nutrients. Oi 1 ed
rocks placed in enclosures high in the intertidal zone showed essentially no
microbial degradation. In the presence of decaying seaweed in this upper
intertidal-zone enclosure, alkanes were depleted within 4 months. In the
absence of decaying plant material in the upper intertidal splash zone of theBermuda station, microbial degradation occurred at significantly slower rates
than at Martha’s Vineyard, but they were faster than the Martha’s Vineyardrock sample that was maintained above the highest high-water line. ~hen micro-
bial degradation did occur, lower molecular weight components were utilizedcompletely before higher molecular weight compounds above nC-25 were degraded.
Limited information on dissolution of aromatics and cyclic compounds appearingin the gas chromatographic unresolved complex mixtures suggested that this
dissolution process was extremely slow and limited to compounds occurring inthe UCM before nC-20. After 13 1/2 months of exposure at Bermuda the oil
showed little evidence of purely chemical alteration. The initial ratio of
saturate to aromatic hydrocarbons was preserved, and the asphaltene and
hydroxyl content were not significantly increased. A modest increase in esteror acid content was noted; however, after 13 1/2 and 16 months at Bermuda and
Martha’s Vineyard, respectively, the spill residues were still far from inertasphalts. They had not been depleted of the more biologically active higher
molecular weight aromatics, and the half life in terms of contamination poten-tial for SUCh beached materials was estimated to be in terms of years.
103

—-.—— .—. — . . —.. -— . . —— . ..- ..—— .- —--
fl~V~:flPMENT OF ALGORITHMS AND COMPUTER PROGRAMS TO
SIMULATE THE FORMATION OF WATER IN OIL EMULSIONS
Numerous mathematical formulations have been generated to describevarious individual aspects of water-in-oil emulsion behavior including: 1)
the work (or mixing energy) required to generate emulsions, 2) the viscosity.changes of water-in-oil emulsions as a function of water content, 3) the com-
petitive process of dispersion of oil and mousse into the water column (oil-
in-water dispersion), 4) the thickness and spreading of oil and mousse, and 5)
the breakup or decomposition of slicks based on evaporation and dissolution
weathering and creaming (mousse destabilization by separation of water and oil
into distinct phases). Unfortunately, no single oil weathering model exists
at this time which encompasses all
have stated that it is impossible
formation and behavior because of
physical chemistry of this system.approach to this problem has been
emulsification process, and relate
of these factors, and Mackay et al. (1980)
to completely model water-in-oil emulsion
the lack of a sound understanding of the
Perhaps the most pragmatic and successfulto postulate a realistic mechanism for the
the viscosity of the resultant mousse tothe water content (Mackay et al. 1980). Algorithms for each of these various
separate, but interconnected processes will be considered briefly below.
In citing work completed by Becher (1955), Twardus (1980) stated thatthe work or energy required for generation of either water-in-oil or oil-in-
water dispersions could be theoretically calculated. Before emulsificationoccurs, the interracial area between two emiscable liquids is at a minimum and
is essentially determined by the surface tension values of the two liquids.Following emulsification, it is assumed the drop~ets of the first liquid (A)
are dispersed into the second (B). If all droplets are considered, the inter-racial area between liquids A and B is increased, and since liquids tend to
keep their surfaces to a minimum, an emulsifying agent and work (or energy),.are clearly required to allow emulsification to occur. In theory, the amountof work (u) required to increase the surface area by an amount (S) can begiven by the following formula from Becher (1955)
104

. . . . . ——. .——
where y is the interracial tension between the two 1 iquids. An emulsifying
agent, as noted in previous sections, nay be any surface active substancewhich forms a thin interracial film between liquids A and B maintaining the
emulsion by minimizing the contact and aggregation of the dispersed liquid.Additional chemical properties of this stabilizing agent are discussed by
Twardus (1980) and were considered briefly in the general discussion of emul-
sification processes in Part 1 of this paper.
Taking advantage of the considerable literature on the theological
properties of suspensions of rigid particles, Mackay et al. (1980) have used
the Mooney equations (Mooney, 1951; Mooney & Hermonat, 1955) to develop a
relationship between the viscosity of mousse and its water content
l.yuo = exp(2.5W/[1-KIWl)
where P is the apparent mousse viscosity, Do is the apparent oil viscosity, W
is the fractional water content of the emulsion and KI is a constant. Figure
8, from Mackey et al. (1980), shows a plot of the curves generated with this
equation and the fit of experimental data obtained for six crude oils. Al-
though there is some spread in the data, the equation gives a good average fit .to the measured viscosities. It was noted by Mackay et al. (1980) that the
oils usually exhibited non-Newtonian behavior, causing the viscosity ratio todepend on the shear rate as well as the water content. Similar findings have
been reported by Bridie et al. (1980b). As noted by Berridge et al. (1968b),the increase in viscosity for these oils is most significant after the water
content has reached 50%, and before that point many have the basic flow pro-
perties and appearance of the starting crude.
105

——. — ———— .—
10I918[7(6[
2C
4
3
2
1
.
.EXPERIMENTAL.
. ~SALT WATER
. -f!r-&’FRE5H WATER
. .
0.621
au MO SCWCE— .91 ESCARO$ .WGERIA+ 2 %8. LIBYA
/
/’$$ ‘3 f~ TEn s’saloM ./ ~ G@UIN
% 10 ZYEITQU , LEYA/’
/I I I I I I I 1
nmmfinn,m . . . - ””.-.....u u &u&J waol.1 iu au 90 190
WATER CCNTENT SURFACE OIL , “AVOL
FIGURE 8. MOUSSE/OIL (P/PO) RELATIVE VISCOSITY RATIO OF SIX TEST CRUDE OILS AS AFUNCTION OF MATER CONTENT. (MACKAY ET AL., 1980.) REPRODUCED BYPERMISSION OF THE AUTHOR.

——..— —— __. _.— -—
.
Mackay et al . (1980) then used these relationships to develop a
kinetic expression to descr~be the processes of water uptake and release. Therate of water incorporation into the oil (I) was postulated to depend on the
sea state (S) and the viscosity of the oil as follows:
I = Kis/lJ ~3,m2.s
The rate of coalescence or water removal (R) was estimated to be dependent on
the oil composition, its water content, the viscosity and the slick thickness
(D) as follows:
R = K#/vil m3/m2*s
where KT is a coalescing tendency constant.
Thus at any time the net rate of water
d(VW)/dt = A(I-R)
ncorporat
where V is the emulsion volume and A is the area. Thus,
on would be:
D is V/A. Substi-tuting yields:
dW/dt = (Ki S/0 - KTW/D2)/~
Complete discussions of the derivation of these equations and their basis on
physical properties is beyond the scope of thisrsferred to the original articles by Mackay et al.
The. general solutions to the differential
paper were pr~sented, however, explicit solutions
review, and the reader isfor details.
equations generated in this
could only be provided whenthe water-in-oil emulsion showed no tendency for coalescence (because of high
concentrations of surfactant or coalescence preventing materials) or when the
rate of water removal equal led the rate of water incorporation and the vis-
cosity and water content stabilized at a constant value. This limitation
107

——
applies to oils which do not exhibit a mousse forming tendency. Nevertheless
the equation did have predictive capabilities in generating emulsion formationrates and extents for a variety of oils ranging from heavy fuel oils, which
exhibit rapid stable emulsion formation to light distillates, which rejectwater rapidly, and thus show little or no emulsion formation tendencies.
Data from Cormack and Nichols (1977), who reported water contents for
three spills of Ekofisk oil, were fit to curves generated with the proposedequation (Figure 9), and very acceptable fits of the observed field data and
predicted water uptake for varying wind speeds were obtained. Half times ofemulsion formation were generated from these studies, and values of 2.8 hours
at 3.1 knots, 16 minutes at 10 knots and 1.6 minutes at 31 knots were obtained(Mackay et al., 1980).
A simpler finite difference form of the equations used to describe
the process of emulsion formation was also presented by Mackay et al. (1980)and this is presented below.
AN = KA(U+l)2(l-KBW)At
where
W is the fractional water content
KA is a constant
KB is a constant with a value of approximately 1.33
U is the wind‘t is time.
Until more experiments
speed
data are available, it was suggested that this simpler
version would be adequate for describing emulsion formation.
In that Mackay et al. (1979, 1980) and others have noted that mousse
formation and oil-in-water dispersion are competitive processes for any given
108

L
—. .——— . .
10C
90
80
70
60
50
40
30
20
10
0
bmock a Nieilds 4>“
—---A--—- —— -- —--— .
~ Equation
WWO S?SEO EQuATION”mom CON5LWTS— .—,m : 0.6s4
/’ ● JULY 1975 12 m: 1.2s6D: O.oo11o
0 JUNE 197sKt : 0.654
/2 - 3 0
42: 1.230 /K3 : Q.~Og6~ / /
A ,AN t~77K1 : 0.654 , 0
1 s - 3 0 Kz: 1.13*
f K3:>.003300
//,&
/
eo
//FI I I I I I I I
0 1 2345678 glo
TIME, h
FIGURE 9. COI?PUTER MODEL - pREDICTED AND OBSERVED (C0FU4MK AND NICHOLS,1977) TIME-DEPENDENT UPTAKE OF WATER INTO EKOFISK OIL AS AFUNCTION OF WIND SPEED AND SEA-sTATE. (FROPI M4CK4Y ET AL.,1980.) REPRODUCED BY PERMISSION OF THE AUTHOF?.
109
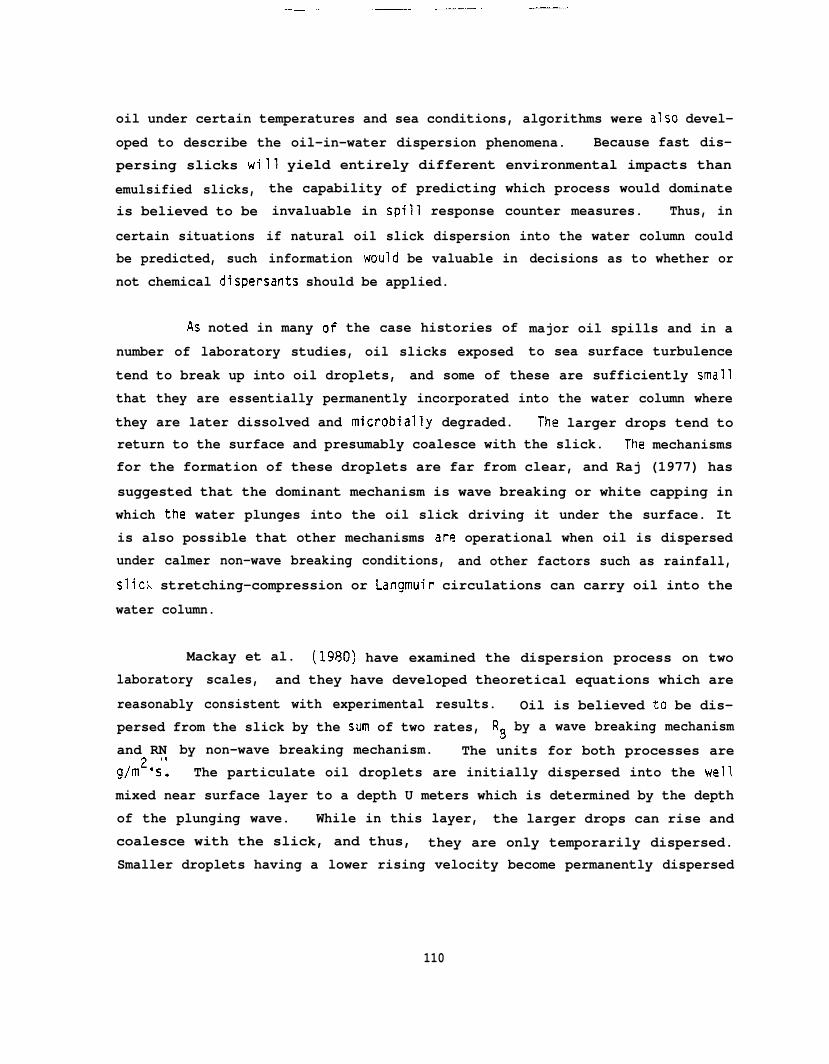
.—— — . . . . .— ———— . —.-
oil under certain temperatures and sea conditions, algorithms were also devel-
oped to describe the oil-in-water dispersion phenomena. Because fast dis-
persing slicks wi
emulsified slicks,is believed to be
certain situationsbe predicted, such
11 yield entirely different environmental impacts than
the capability of predicting which process would dominate
invaluable in spill response counter measures. Thus, in
if natural oil slick dispersion into the water column couldinformation would be valuable in
not chemical dispersants should be applied.
As noted in many of the case histories of
number of laboratory studies, oil slicks exposed
decisions as to whether or
major oil spills and in a
to sea surface turbulence
tend to break up into oil droplets, and some of these are sufficiently small
that they are essentially permanently incorporated into the water column where
they are later dissolved and microbially degraded. The larger drops tend toreturn to the surface and presumably coalesce with the slick. The mechanismsfor the formation of these droplets are far from clear, and Raj (1977) has
suggested that the dominant mechanism is wave breaking or white capping in
which the water plunges into the oil slick driving it under the surface. It
is also possible that other mechanisms are operational when oil is dispersed
under calmer non-wave breaking conditions, and other factors such as rainfall,
slick stretching-compression or Langmuir circulations can carry oil into the
water column.
Mackay et al. (1980) have examined the dispersion process on twolaboratory scales, and they have developed theoretical equations which are
reasonably consistent with experimental results. Oil is believed to be dis-persed from the slick by the sum of two rates, R8 by a wave breaking mechanism
and RN by non-wave breaking mechanism. The units for both processes areg/m2’s. The particulate oil droplets are initially dispersed into the well
mixed near surface layer to a depth U meters which is determined by the depth
of the plunging wave. While in this layer, the larger drops can rise and
coalesce with the slick, and thus, they are only temporarily dispersed.Smaller droplets having a lower rising velocity become permanently dispersed
110

. . . . . . —— — –. —. —.-. ..—
and diffuse (in part) vertically down into the less well mixed layer of depth
Z meters in which the vertical diffusivity (D) is m2/s. With constant wave
turbulence, the concentration of the small or potentially permanently dis-
persed droplets is a constant CC in the well mixed layer and a variable C inthe layer of depth Z. C incre~ses with time at any
trations are in g/m3. The rate of diffusion into the
is the product of diffusivity D and the gradient in C
the layers where Z is equal to zero. That is,
given depth and concen-
less well mixed layer RD
at the interface between
‘D = D(dC/dZ)z=O = C5K1
where KI is the mass transfer coefficient (m/s).
Two different size calssifications were considered for the model.Large drops
ocity of VLthan 0.1 mm
may diffuseprocesses.
(arbitrarily greater than 0.1 mm diameter) rise quickly at a vel -
m/s and coalesce with the slick. Smaller drops (arbitrarily lessdiameter) have a lower rising velocity VS m/s and may coalesce or
downwards. Their fate is thus controlled by these two competingIf the concentration of the large drops is C, then
must be VLCL g/m2*s, and similarity for the small dro~s theV5C g/m2*s.
3Adding these two fluxes to.give the total coa
g/m ● s yields:
‘c= VLCL + V~C~ g/m2*s
the rising flux
rising flux is
escence rate R
!dhen a differential equation is written for this upper layer, one obtains
RN + RB - Rc - RD = Ud(CL + CS)/dt
Mhen a quasi-steady state is obtained the right hand side becomes zero.
If it is postulated that the volume fractions for the small dispersedoil drops for the two dispersion mechanisms are F ~ and FB for non-breaking and
111

——. .— —... —.
breaking sea states, respectively, the above equation can be broken down into
small and large components. For small droplets
‘NRN + ‘BRB - ‘Scs - ‘() = ‘dcs/dt
Substituting CSKI for Ro, separating variables
hl(FNRN + FBRB - CS[VS + Kll) = -t(Vs
Although the mass
a constant and at
Thus ,
transfer coefficient, Kl, isthe initial condition CS was
and integrating yields
+ K1)/U + constant
time dependent, it was taken asset to zero.
(FNRN + FBRB)(1-exp[-t(VS + Kl)/U])Cs = (“S + Kl)
and at large time intervals, the quasi-steady state in CS is reduced to
Cs = (FNRN+FBRB)/(v~+ Kl)
Likewise, for large drops after extended
to reduce to
CL = (~l-FN:RN + ~l-FB]RB)/vL
time, the concentration can be shown
Details for these derivations are given in Mackay et al. (1980), and separate
algorithms for non-breaking wave dispersion and breaking wave dispersion were
derived. Forthe following
‘N =
the non-breaking wave dispersion mechanism it was suggested thatequation applies:
K2Xn
112

-—— —.
where R~ is the dispersion rate (g/m2*s), K2 is a constant dependent on sea
state, X is the slick thickness in meters and n is a constant. This equationhad the correct properties such that when X is zero RN is zero. Unfortu-
nately, this equation also hasRN approaches infinity when X
that a better formulation where
RN = KA/(l+KI#)
The dependence of K2
the undesirable property that if n is negativegoes to zero. Thus , Mackay et al. suggested
n can be positive would be
on sea state in the first equation above ‘can
only be suggested very approximately, a reasonable form of dependence being
‘2= K3Sm
where K is a constant, S is the sea state and m is a constant which was arbi-3trarily assignedFrom these equat
time T
a value of unity in absence of information to the contrary.
ons it was possib’e to drive an algorithm for the slick life
‘c = X 1“25P/(1.25K3S)o
where Xo is the initial slick thickness and P is the oil density. For illus-trative purposes, life times of slicks of variable thickness were then cal-culated. Illustrative data are presented below:
Initial Slick Thickness
1 cm
lmm
0.1 mm10 um
11.IM
T -- Slick Lifetime
290 days
16 days
22 hours
75 minutes
4.1 minutes
113

—— .—. ..— — —.. -.-. —
In summary then, it was suggested that for non-wave breaking condi-
tions an expression for the dispersion rate into small droplets be used of theform
RNFN = K3SmX-0”25 g/m2”s
where K3 will probably have a value of approximately 10-4 and M a value of 1.
Similar derivations were presented for the wave-breaking dispersion
model ; however, the authors concluded that this mechanism like the non-breaking dispersion mode was only poorly understood, and that their equations
could be criticized as containing an excessive number of adjustable param-
eters. Further, there were insufficient data to justify the equations com-
plexities. Therefore, a simpler set of equations were derived and pressntedin finite difference form suitable for incorporation into oil spill models.
The breaking and non-breaking dispersion algorithms were then combined in one
process, the rate of which was given by
F = KA(U + 1)2
where
F is the fraction of sea surface subject to dispersion per second
U is the wind speedKA is a constant, and
‘B = 1/(1 + KB!J0*5X*Y)
where
FB is the fraction below the critical size
KB is a constant
114
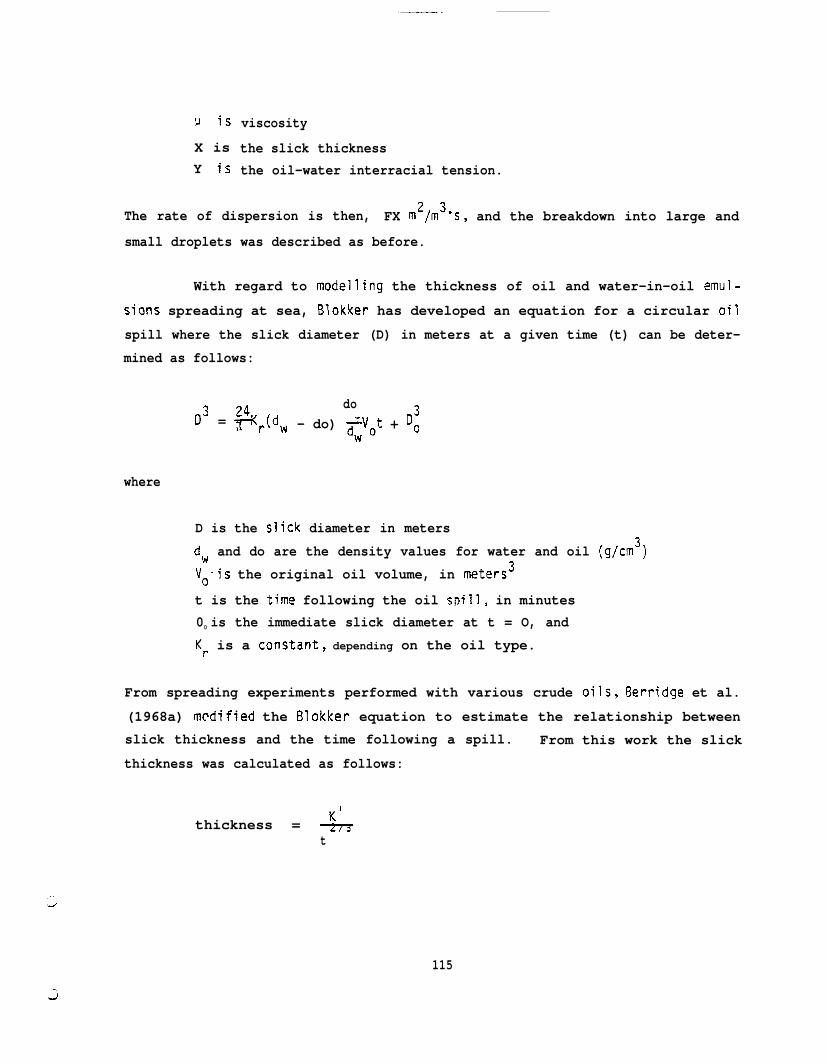
.— .
u is
X isY is
viscosity
the slick thicknessthe oil-water interracial tension.
The rate of dispersion is then, FX rn2/m3”s, and the breakdown into large and
small droplets was described as before.
With regard to modelling the thickness of oil and water-in-oil emul-
sions spreading at sea, Blokker has developed an equation for a circular oil
spill where the slick diameter (D) in meters at a given time (t) can be deter-
mined as follows:
03do
= #Kr(dw - do) ~Vot + D:
where
D is the slick diameter in meters
dw and do are the density values for water and oil (g/cm3)
Vo-is the original oil volume, in meters3
t is the time following the oil spill, in minutes00 is the immediate slick diameter at t = O, and
Kr is a constant, depending on the oil type.
From spreading experiments performed with various crude oils, Berridge et al.
(1968a) mrdified the Blokker equation to estimate the relationship between
slick thickness and the time following a spill. From this work the slick
thickness was calculated as follows:
Ithickness = &
t
115

__. . ..—. -——— .—.– .- .--.
where:
t is the time, in seconds.
K’ = [/’3 [~~ ~D:D ~ ]2’3o(wo)r
v is the vi31ume of oil, in cm3
Do and DW are the densities of oil and water, respectively (in g/cm3)
Kr is a constant, depending on the oil type.
Although neither of these models was designed to accommodate the emulsifica-
tion process, Twardus (1980) stated that the change in spreading tendencycaused by the water-in-oil emulsification could be approximated by substi-
tuting a higher value of oil density in both models. Thus, under the sameconditions the equations predict that emulsified petroleum will spread less
readily and will not spread as thinly over water as non-emulsified petroleum.
Grose (1979) has also reported a model which computes the thickness
of bulk oil as a function ofweathering parameters determined
influenced by wind speed. Theserved phenomenon:
the physical characteristics of the oil and
by the formation of sheen and evaporation as
model takes into account three generally ob-
1.
2.
3.
Spilled oil does not form a single pool, but is rather generallycomposed of numerous patches of thick oil surrounded by thinnersheen;
The thickness of the patches is a function of the bulk physicalproperties of the oil and local environmental conditions includ-ing wave height, water temperature and wind speed;
The weathering of the individual components are dependent uponthe physical-chemical properties in the original oil.
116

_.— .—— ..—. —. ,.. -— .-— .
The patch thickness of the bulk oil was estimated by balancing surface
sion, buoyancy and compressive forces after Grose (1978) which expandedthe static equilibrium model derived by Langmuir (1933). The algorithm
is:
t~q.
lJDonused
h = &Ol*(Cd*Sw”Y2) + SQRT([Cd*Sw-W2]2 - 2@FS*E)/E
where h is the thickness in meters, Cd is the drag coefficient of the patchmoving over the water surface, Sw is specific gravity of sea water, W is the
relative speed of the patch through the surface water in cm/s, FS is thespreading force in dynes/cm and E is the buoyancy factor:
E = 980* SO*(S - S.)/Sw w
where So is the specific gravity of the bulk oil. The spreading forces range
from +20 to -10, and are computed as the surface tension of water minus thesum of the surface tension of water and interracial tensions of the oil.
The bulk density of the patch was computed by summing masses from
each fraction, and dividing by the sum of the ratios of the masses to their
characteristic densities (total volume). Evaporation is computed using the
bulk properties of the fractions within the patch and the vapor pressures
after Mackay and Matsugu (1973). The mode? does not include parameters for
emulsification or incorporation of water which would change the specific den-
sity, viscosity, total surface area and volume of the patches. Thus, SOIW
modifications would be required to predict the thickness of water-in-oil emul-
sions or mousse. This model was used to predict patch sizes of the Bunker C
cargo lost from the Potomac off Greenland in 1977 (Petersen, 1978), and therelative agreement between predicted and observed behavior was discussed in
the case history of that spill.
Several models describing the break up and dispersion
at sea have been presented (Mackay and Matsugu, 1973; Butler,of oil slicks
1975a; Grose,
117
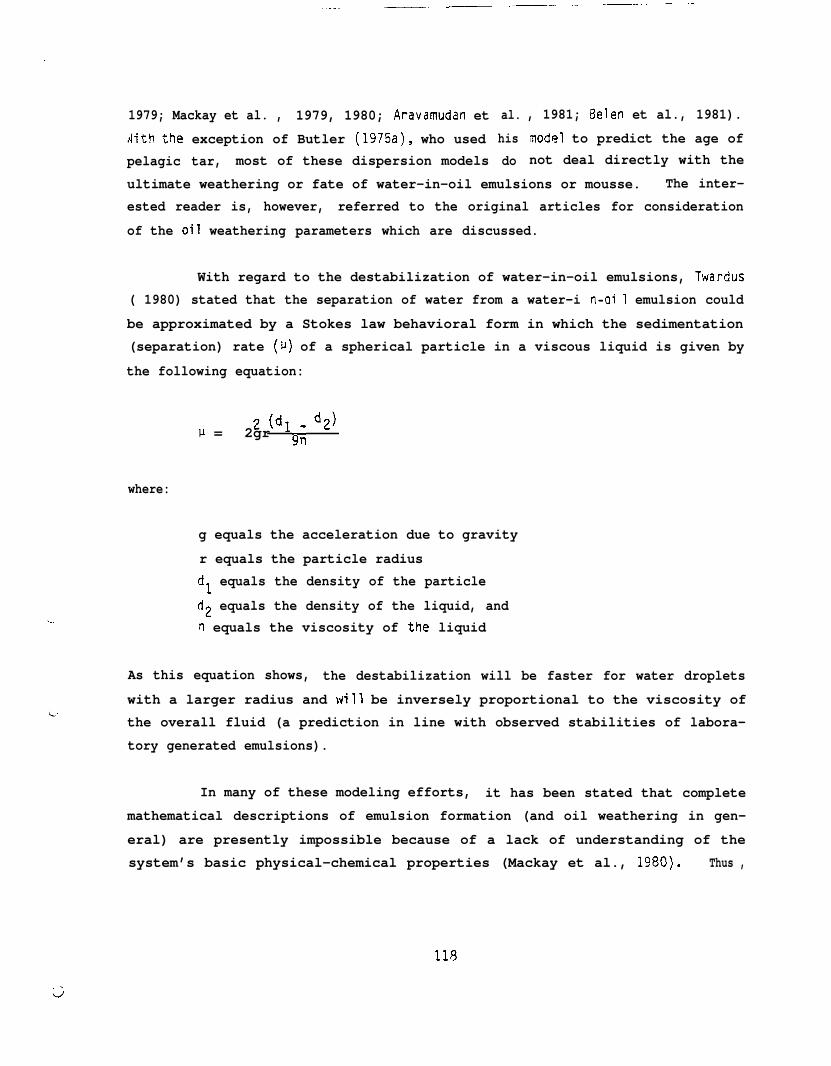
. . . . . ___ — ——— --- --—--—-—— ---
. .
1979; Mackay et al. , 1979, 1980; ,4ravamudan et
With the exception of Butler (197!5a), who usedpelagic tar, most of these dispersion models
al.
hisdo
, 1981; Belen et al., 1981).
model to predict the age ofnot deal directly with the
ultimate weathering or fate of water-in-oil emulsions or mousse. The inter-
ested reader is, however, referred to the original articles for consideration
of the oil weathering parameters which are discussed.
With regard to the destabilization of water-in-oil emulsions, Twardus
( 1980) stated that the separation of water from a water-i n-oi 1 emulsion could
be approximated by a Stokes law behavioral form in which the sedimentation
(separation) rate (u) of a spherical particle in a viscous liquid is given by
the following equation:
z (dl dz)M = 2gr ~;
where:
g equals the acceleration due to gravity
r equals the particle radiusdl equals the density of the particle
d2 equals the density of the liquid, andn equals the viscosity of the liquid
As this equation shows, the destabilization will be faster for water droplets
with a larger radius and will be inversely proportional to the viscosity of
the overall fluid (a prediction in line with observed stabilities of labora-
tory generated emulsions).
In many of these modeling efforts, it has been stated that complete
mathematical descriptions of emulsion formation (and oil weathering in gen-
eral) are presently impossible because of a lack of understanding of the
system’s basic physical-chemical properties (Mackay et al., 1980). Thus ,

—.— — -.— .—
although Grose (1979) had a fair agreement with the predicted patch thickness
and that observed in the field after the Potomac spill of Bunker C fuel oil inMelville 3ay, he too stated that the model was limited by the lack of perti-nent data to determine some of the transfer rates and coefficients. This was
particularity true for further parameterization of the availability of each
fractional component at the air/oil interface for evaporation and the param-
etrization for sheen generation at the oil/water interface, including in
particular, the availability of material for generating sheen. The availa-bility of material for generating sheen is constrained by the total mass in
the fraction and the scale length related to the ratio of the thickness to the
diameter of the patch. With the Availability of Material parameter in par-
ticular, the volumetric transfer rate into sheen was assumed to be dependent
only on the inverse molecular weight of fraction. The authors stated that
this may not sufficiently differentiate between the more and less mobile frac-
tions within the oil, and that it did not account for diffusion control of
individual components as the viscosity of the material increased. Thus, as
noted earlier, an arbitrary constant was imposed in the model to constrain the
heavier fractions (>nC16) from entering into the sheen.
Obviously, much more work is required before model simulations willbe able to accurately predict slick behavior and emulsification processes, and
ultimately it may be necessary to incorporate compound specific propertiesinto such models to fully predict
under different environmental cond”
Research is currently una,
oil/mousse weathering for a variety of oils
tions.
sr way in a number of laboratories, includ-
ing our own to generate much of this needed compound specific data for algo-
rithm development and model verification. Specifically, ciiffusivities ofindividual oil components for oils of different viscosities, and Henry’s law
constants for evaporation of soecific components in different crude oils orpetroleum product mixtures need to be determined. Also, the detailed and spe-cific effects of water-in-oil emulsification on these parameters has y=t to be
elucidated.
119
. ..—— —— –-—– -—
SUMMARY
Laboratory Studies
In the laboratory studies completed to evaluate water-in-oil emulsion
formation and behavior to date, it has been found that the results depend very
significantly on the unique chemical compositions of the different crude oils
and petroleum products tested. Heavier crudes with higher viscosities are, in
general, found to form the more stable emulsions (Bocard and Gatellier, 1981),
and the Presence of” asphaltenes and higher molecular weight waxes have beenfound to be positively correlated with mousse stability (Berridge et al.,
1968a, b, Davis and Gibbs, 1975; MacGregor and McLean, 1977; Mackay et al.,1979, Mackay et al., 1980; Twardus, 1980; Bocard and Gatellier, 1981; Bridie
et al., 1980a, b). Slightly differing results have been obtained in different
investigations, but it has generally been found that these materials act
together in the emulsification Drocess, although the asphaltenes do appear to
play a more sicjnificant role (Bridle et al., 1980a, b; Berridge et al.,
1968b) . The crystallizing properties of the component waxes (near the pour
Points of the oils tested) are believed. to be imDortant in affecting the
internal oil/mousse structure and viscosity, and the asphaltenes are believedto act as surfactants preventing water-water coalescence in the more stable
mixtures (Berridge et al., 1968b; Canevari, 1969; Mackay et al, 1973; Bridieet al., 1980a, b; Cairns et al., lg74). Other indigenous surface activeagents such as metallo-porphyrin and other sulfur and oxygen compounds havebeen found to be equally important. The products of photo-chemical and
microbial oxidation have also been identified as having an important role asstabilizing agents. In several instances, in oils where the above primary
stabilizing components were not present, stable mousse could only be formedwith photo-chemically or microbially weathered oils, notably Brega, Nigerian,
Zarzatine and Lt. Arabian (Berridge et al., 1968b; Bocard and Gatellier, 1981;Klein and Pilpel, 1974; Burwood and Spears, 1974; Zajic et al., 1974; Friede,
1973; and Guire et al., 1973).
120
L

. . ..— —
No stable mousses could be formed in laboratory studies at any temper-
atures with light petroleum distillates such as gasoline, kerosines and sever-al diesel fuels (Berridge et al., 1968b; and Twardus, 1980). Interestingly,
stable mousse formation could only be obtained with several light lube oilswhen they were fortified with wax and asphaltene mixtures obtained from known
mousse forming oils such as Kuwait crude (Bridie et al., 1980a, b). This
asphaltene mixture could also contain other high molecular weight surface
active agents.
Tem~erature is also a factor in mousse formation, and in several
instances (at lower temperatures approaching the pour point of the heavier
oils), stable emulsions have been generated regardless of wax or asphaltene
content. Conversely, if stable water-in-oil emulsions are repeatedly exposed
to freeze-thaw cycles, some destabilization and separation of water and oil
have been noted (Dickens et al., 1981, and Twardus, 1980). Similar results
have been obtained when laboratory generated and real spill water-in-oil emul-
sions are subjected to prolonged heating on removal from the water column.
The absolute amount of water content and the size of water droplets
incorporated into various mixtures of mousse also significantly affect theirstability and viscosity (Berridge et al., 1968b; Mackay et al, lg@3; Twarc!us,
1980; ‘30card and Gatell ier, 1981). Positive correlations of percent waterversus mousse stability and viscosity have been noted for several of the crude
oils studied (Mackay et al,, 1979 and 1980), and, in general, the most stable
emulsions from laboratory and field observations contain water droolets in the
size range of from less than one to ten micrometers. Stable mousse can beformed with many oils in the range of 20 to 80% water, however, above an oil-
specific critical point, significant destabilization of the emulsions occurs(Berridqe et al , 1968b and Twardus, 1980). Presumably, this reflects enhancedwater-water contact and coalescence resulting in ultimate phase separation.
In most of the laboratory studies, the presence andlor absence ofbacteria and suspended particulate material do not appear to affect emulsion
121

.—— .. .
behavior (Berridge et al., 1968a, b; Davis and Gibbs, 1975). Bacterial growth
is generally limited to the surface of the mousse products tested and is be-
lieved to be inhibited by limited oxygen and nutrient diffusion into the
mousse. Toxic materials inherent to the oils themselves may also be respon-
sible for these observations, although water content (and in particular tne
size of the water droplets encapsulated within the mixtures) has also been
correlated with bacterial infestation on the less stable emulsions (Berridgeet al., 1968a, b). In several laboratory studies it has been found that
significant bacterial utilization of the mousse only occurs after treatmentwith dispersants, resulting in the break up of the material with concomitant in-
creased surface-to-volume ratios (Bocard and Gatellier, 1981).
Physical Properties of Mater-in-Oil Emulsions
The physical properties of stable emulsions are impressively differ-ent from those of the starting crudes, and increases in soecific gravity andviscosity have been observed to affect spreading, dispersion, and dissolutionrates (Berridcje et al., lgGgb; C)avis and Gibt)s, 1975; MacGregor and Ncl-can,
1977; Mackay et a’
evidence has also
C12) hydrocarbons
Kondo, 1977). In
, 1979, 1980; Twardus, 1980; and Payne et al, 1981b). Some
suggested that evaporation of intermediate mol. wt. (C9 to
is affected (Payne et al., 1981b; Twardus, 1980; Nagata and
general, these effects are most significant in the emulsions
containing greater than 50% water. Water-in-oil emulsions with less waterusually have pour points, spreading properties and viscosities which propor-
tionately resemble those of the starting oils (Twardusi 1980; Mackay et al.,
1980) .
The flash ooints and burn points of the water-in-oil emulsions stud-
ied have been found to vary significantly with water content, and for medium
crudes, in situ combustion was inhibited when the water content reached 70%
(Twardus, 1980). For heavier crudes, Significant combustion inhibitionoccurred when the water content reached 30% (Twardus, 1980). Water dependentincreases in viscosity also affect clean-up procedures as skimming, mopping,
122.-,.u

.—. .——
and pumping of such mixtures becomes more difficult. The sorption capacity of
various commercially available sorbant materials has also been observed to
decrease as the water content in the mousse mixtures studied increases. This
behavior is believed to be inherent to the hydrophobic properties of the sorb-
ant materials examined (Twardus, 1980).
Treatment of Mousse with Dispersants
Pre-treatment of oil and/or seawater with dispersants or demulsifiers
generally inhibits laboratory mousse formation with most of the oils and petro-leum products tested (Berridge et al., 1968b; Bridie et al., 19f30a, b). In
these studies, only 0.1 to 1% dispersant was required, and with several of theproducts tested, similar results were obtained when the dispersant was added
to either the water or oil. Previously stabilized mousse is much more dif-ficult to break up with commercially available dispersants, although some
success has been obtained with various products when sufficient mixing energyis utilized in the laboratory to thoroughly mix the dispersant into the water-
in-oil mixture (Bridie et al., 1980b; Bocard and Gatellier, 1981; Lee et al.,1981). In general, however, it has been noted that with water-in-oil emul-
sions with viscosities greater than 4000-7000 cP, no effective break-up ofstabilized mousse could be achieved (Mackay et al, 1980; Lee et al., 1981).
1’--
The ineffectiveness of several of the dispersants studied to break up
stable mousse formations at sea has been attributed to the lack of penetration
of the dispersant into the mousse and its rapid removal from the mousse sur-face into the water column by waves and sea-surface turbulence (Lee et al,
1981). In several planned sea tests, mousse forming crudes such as La Rosa,were effectively dispersed before mousse formation occurred (McAuliffe et al ,
1981; JBF/API, 1976). Thicker lenses or patches of oil were observed to move
alonq the leading (downwind) edge of these slicks, and dispersant effective-
ness was best when the dispersants were applied directly to the thicker lenses
or patches rather than the trailing sheen or” thinner slick. Again, in theat-sea tests, mixed results have been obtained depending on the type of
123.
-— . . . —— ..— -.——
dispersant/demu lsifier used and the oil/mousse mixture tested. It has been
noted, however, that all dispersants work better when applied to the emulsions
neat, rather than when diluted with seawater.
While many Of the mousse formations have not been effectively broken
Up by demulsifier addition in laboratory tests, significant and near immediate
decreases in viscosities are often noted, and in several clean-up operations,
the injection of demulsifier and dispersants into oil/mousse mixtures has
greatly enhanced pumping efficiency (8ridie et al, 1980b; Bocard and Gatsl-
lier, 1981).
Case Histories of Real Spill Events
In the case histories of major open-ocean and near-coastal spills and
blowouts, the occurrence of mousse formation and the subsequent fate of the
mousse were found to be directly dependent upon the type of oil spilled. In
general, the oils which were capable of forming a stable water-in-oil emulsionor mousse in laboratory studies were also the ones that caused the most signif-
icant problems with mousse formation in real spill situations. Thus, the
Kuwait crude oil cargoes from the Torrey Canyon (Smith, 1968) and Metula— .(Straughn, 1977; Harm, 1977) were noted to form a very stable mousse, as wouldbe predicted from the laboratory experiments. Likewise, the loss of theArabian crude oil cargo and Bunker C fuel from the Amoco Cadiz resulted in.—stable and almost immediate water-in-oil emulsion formation (Calder and Boehm,
1981; Harm et al., 1978). Weathering of Bunker C cargoes was somewhat more
variable, with significant mousse formation notsd after the Arrow spill
(Owens, 1978, Rashid, 1974 and Mackay et al., 1973), but no apparent water-in-oil emulsification noted for the loss of the Bunker C cargo from the
Potomac (Petersen, 1977). In this latter instance, however, the cargo con-tained 5!5% pitch, and the spill occurred in very calm seas. When the Arrowwent aground, intense storm activities undoubtedly contributed to the 40 to
60?? water-in-oil emulsion formation. In laboratory studies using Bunker C, arigid and sticky water-in-oil emulsion has been formed with water contents up
to 60% (Berridge et al., 1968b).
124
— __ — .—. ——
,’
in both the Arrow and Potomac spill incidents, significant break-up
of the cargo into sub-micrometer to several centimeter sized oil/vousse partic-ulate was noted, and in the Arrow spill these were observed at significant
distances from the soill sight (Forrester, 1971). Ingestion of these micro-
particulates by pelagic organisms was noted, and their incorporation into
fecal pellets was postulated as a significant removal mechanism of such drop-
lets from the water column (Conover, 1971).
in line with previous laboratory and field experiments using similar
oils, no significant “mousse” formations were observed to occur in the Burmah
Agate spill, where a light Nigerian Crude (39.3° API) was released (Kelley et
al., 1981) .
In the two open ocean blowouts considered in
cantly different results were observed. In the Ekofisk
unstable yellowish to brown water-in-oil emulsion (35 to
this review, signifi -
Bravo blowout, a very
72% water) was noted,
but this material was rapidly broken up into smaller particles and tar
patches, and was removed from the wellhead with little long-term significant
environmental damage (Cormack and Nichols, 1977; Grahl -Nielson, 1977; and
Audumson, 1978). A slightly more stable mousse was observed to form with
increased sea-surface weathering, but this too was unstable and disappeared
after several weeks. It should be noted, however, that this crude containsvery low levels of stabilizing agents (asphaltenes =0.03%). In the IXTOC I
blowout in the Bay of Campeche, Gulf of Mexico, mousse formation was observed
to occur only after significant evaporation, dissolution, and photochemlcal
weathering (Atwood et al , 1980; Overton et al., 1980a). The mousse resulting
from these orocesses was extremely stable and extensive coverage and contamina-
tion of much of the Gulf of Mexico and its adjacent shorelines was noted.
Microbial degradation of the oils releasedouts considered was found to be extremely variable.
off of Brittany, France, microbial processes were
from the spills and blow-
In the Amoco Cadiz spill——observed to compete very
125
— — .—. ——. ..—
effectively with evaporation and dissolution weathering for removal of specif -ic components in the oil while still in the water column (Calder and Boehm,
1981) . In the IXTOC I blowout and the Potomac spill, on the other hand,
little, if any, microbial degradation occurred to the oil or mousse in the
water column over extended periods of time (IXTOC--Boehm and Fisst, 1980a;
Overton et al., 1980b, Payne et al., ‘1980a; Buckley et al., 1980; Atlas et
al., 1980; Potomac--Petersen, 1978). Long-term microbial processes were
observed to be important in the fate of beached and stranded oil and mousse in
the Torrey Canyon (Smith, 1968), Arrow (Vandermeulen et al, 1977), Metula
(Straughn , 1977) , and Amoco Cadiz (Calder and Boehm, 1981; Boehm et al ., 1981;——Ward 1981; Vandermeulen et al., 1981) spills, but little evidence of microbial
degradation of stranded IXTOC I mousse was observed after several Iweeks, in
samples collected up to 500 miles from the wellhead along the upper intertidal
shores of Laguna Madre (Payne et al., 1980a; Overton et al., 1980b).
The long term environmental impact of oil and mousse which reaches
shorelines appears to be directly correlated with the amount of coverage, the
intertidal substrate type and the energy regime at the sight of the oil/mousse
stranding (Blumer et al., 1973). Without exception, the most significant
deleterious effects have been noted in low energy lagoons, estuaries and bays,and in these instances the persistence of stranded oil may be expected to last
for upwards of 10 years.
Tar Ball Distributions and Chemistry
Tar ball concentrations and compositions have been found to be vari-
able over the world’s oceans, but localized “hot spots” of significant tar
ball accumulations have been noted in several areas. Quite often these higher
concentrations are noted along known lines of tanker traffic or in currentsdownstream from these areas. In general, the Mediterranean Sea and the
Sargasso Sea have similar high levels of tar balls which in turn are greaterthan those observed in the broader exoanses of the North Atlantic and North
Pacific oceans.
126

Chemical compositions of tar balls are extremely variabls, and the
physical appearance can range from brittle and h;rd to soft and very sticky,with sizes ranging from several mm to tens of cm (Butler, 1973, Koons, 1973,
Mommessin and Raia, 1975; Wade et al., 1976; Jeffrey et al., 1974; Jordan andPayne, 1980). In general, compounds with molecular weights less than n-C15
are not present, and most of the tar balls considered have very high residues
of compounds with molecular weights greater than n-C34. Several sources for
these tar balls have been identified, and these include tanker cargo-holdwashings, bilge discharges, urban/industrial wastes and residues resulting
from major spills or blowouts such as the Amoco Cadiz and IXTOC I. In some——instances the chemical composition of tar bal?s isolated from, localized areas
are very similar; however, remarkably different chemical compositions of tar
balls isolated in the same neuston tows have been noted (Mommesin and Raia,
1975). Because of the extreme patchiness of tar ball occurrence, and theseveral orders of magnitude variations in tar ball loadings in the same area
over the period of a single day, standing stock estimates of tar ball pollu-tion are tenuous at best, and it is not possible at this time to determine if
tar ball occurrence is increasing or decreasing.
The ultimate fate of most of these tar balls at sea is believed to be
their break up and sinking within one year (Morris, 1971; Butler et al., 1973;
Butler, 1975a, b,; Horn et al., 1970; Brown et al, 1973; Brown et al., 1975;
Brown and Huffman, 1976; Wade, 1976), whereas beached or stranded tar ballshave a fate similar to that of larger patches of mousse or oil released from
major spill incidence. Tar ball siting on beaches have been reported glob-
ally; however, most evidence suggests that their levels have not changed over
the last decade. The decomposition of stranded tar balls is extremely depend-
ent on the shoreline substrate, the energy regime of the shoreline environ-ment, the presence and absence of nutrients, and the degree of sedimentationinto the intertidal zone (Blumer et al., 1973). Microbial degradation of tar
balls is believed to be generally limited to the outer surfaces due to dif-
fusion limited transport of oxygen and nutrients to the interiors. The factthat numerous tar balls have not been observed to have a significant component
127

——- . —-. .—.-
concentration gradient with depth into the interior, suggests that significant
evaporation , dissolution, photochemical and microbial degradation occurs to
the materials before agglomeration and tar ball formation.
Mathematical and Computer Modeling of Mousse Behavior
In reviewing the status of mathematical and computer modelling ofmousse formation and degradation, it was noted that numerous mathematical
formulations have been generated to describe the various individual aspects ofwater-in-oil emulsion formation and behavior (Mackay et al., 1979, 1980;
Twardus, 1980; Raj, 1977; Grose, 1979). Unfortunately, however, no single oil
weathering model exists at this time which encompasses all of the variable
factors, and it is impossible to completely model water-in-oil emulsion forma-
tion and behavior because of the lack of a sound understanding of all of the
physical chemistry properties of the system. Significant advances have been
made in model ling viscosity changes of water-in-oil emulsions as a function of
water content (Mackay et al , 1979, 1980), the competitive process of disper-sion of oil and mcjuss~ into the water column (Mackay et al., 1979, 1980), and
the break-up or decomposition of slicks or patches of oil based on evaporationand dissolution weathering (Mackay and Matsugu, 1973; Butlsr, 1975a; Grose,
1979; Mackay et al., 1979, 1980; Aravamudan et al., 1981; Belen et al., 1981;and Payne et al., 1981b), but much more work will be required before modelsimulations will be able to accurately preciict slick behavior and emulsifica-
tion orocesses. Ultimately, it may be necessary to incorporate compound spe-
cific properties into modelling efforts to fully predict oil/mousse/tar ball
weathering for a variety of oils under different environmental regimes (Payne
et al., 1981b).
128

BIBLIOGRAPHY
Addy, J. M., D. Levell, and J. P. Hartley. 1978. E?iological Monitoring ofSediments in Ekofisk Oil field, pp. 514-519. In Proceedings, Conferenceon Assessment of Ecological Impacts of Oil Spi_ils (June 14-17, Keystone,Colo. ). American Institute of Biological Sciences.
Audunson, T. 1978. The Fate and Weathering of Surface Oil from the BravoBlowout, pp. 445-475. In Proceedings, Conference on Assessment of Eco-logical Impacts of Oil ~pills (June 14-17, Keystone, Colo.). AmericanInstitute of Biological Sciences.
Aminot, A. 1981. Anomalies de Systeme Hydrobiologique Cotier Apres L’echougede L’Amoco Cadiz. Considerations Qualitative et Quantitative sur laBiodeg~tifi Situ des Hydrocarbures, pp. 223-242. In, Amoco CadizFates and Effects of the Oil Spill. Proceedings of th~Internat~Symposium Centre Oceanologique de Bretogne, Brest (France).
Aravamudan, K. S., P. K. Raj, and Lt. G. Marsh. 1981. Simplified Models toPredict the Breakup of Oil on Rough Seas, pp. 153-159. In Proceedings,1981 Oil Soill Conference. American Petroleum Institute Pui No. 4334.
Atlas, R. M., G. Roubal, A. Bronner, and J. tlaines. 1980. Microbial Degrada-tion of Hydrocarbons in Mousse from IXTOC-1, pp. 411-435. ~ Proceedingsof a Symposium, Preliminary Results from the Se~tember 1979 Researcher/Pierce IXTOC-I Cruise (June 9-10, Key Biscayne, Fla.). NOAA , tlce ofm Pollution assessment.
Attaway, D., J. R. Jadamec, and M. McGowan. 1973. Rust in Floating PetroleumFound in the Marine Environment. Unpublished Manuscript, U.S. CoastGuard. Cited in: Figs. 7 & 8 of J. N. Butler, B. F. Morris, and J.Dass, 1973. Pelagic Tar from Bermuda and the Sargasso Sea. BermudaBiol. Station Spec. Publ. #10, pp. 23.
Atwood, D. K., J. A. Benjamin and J. W. Barrington. 1980. The Mission of theSeptember 1979 Researcher/Pierce IXTOC-I Cruise and the Physical Situa-tion Encountered, pp. 1-16. In Proceedings of a Symposium, PreliminaryResults from the September 1979 Researcher/Pierce IXTOC-I Cruise (June9-10, Key Biscayne, Fla.). NOAA, OffIce of Marine Pollution Assessment.
Barber, F. G. 1970. Report of the Task Force: ODeration Oil (Cleanup ofArrow Oil Spill in Chedabucto Bay), pp. 35-54. In Ministry of Transport,Ottawa, Volume 3.
—
Becher, P. 1955. Principles of Emulsion Technology, pp. 31-53. ReinholdPublishing Corp.
129

.— ——. .—. —— .—.
Belen, M. S., !4. J. Lechr, and H. M. Cekirge. 1981. Spreading, Dispersion,and Evaporation of Oil Slicks in the Arabian Gulf, Dp. 161-164. In Pro-ceedings, 1981 Oil Spill Conference. American Petroleum Institu= Pub.No. 4334.
Berridge, S. A., R. A. Dean, R. G. Fallows, and A. Fish. 1968a. The Proper-ties of Persistent Oils at Sea, pp. 2-11. Peter Iiepple, ed. In Pro-ceedings of a Symposium, Scientific Aspects of Pollution of the~ea byOil.
8erridge, S. A., M. T. Thew, and A. G. Loriston-Clarke. 1968b. The Formationand Stability of Emulsions of Water in Crude Petroleum and Similar Rocks.Journal of the Institute of Petroleum. 54:539(333-357).
Blokker, P. C. 1964. 4th International Harbour Conference (June 22).
Blumer, M., M. Ehrhardt, and J. H. Jones. 1973. The Environmental Fate ofStranded Crude Oil. Deeu Sea Res., 20:239-259.
Bocard, C., and C. Gatellier. 1981. Breaking of Fresh and Weathered Emul-sions by Chemicals, pp. 601-607. In Proceedings, 1981 Oil Spill Confer-ence. (March 2-5, Atla. , GA) , A~erican Petroleum Institute Pub. No.4334.
Boehm, P. D., and D. L. Fiest. 1980a. Surface Water Column Transport andWeathering of Petroleum Hydrocarbons During the IXTOC-I Blowout in theBay of Campeche and their Relation to Surface Oil and Microlayer Composi-tions, PP. 267-338. In Proceedings of a Symposium, Preliminary Resultsfrom the September 19~ Researcher/Pierce IXTOC-I Cruise. (June 9-10,Key Biscayne, FL) NOAA, Office of Mar. PoT1. Assessment.
Boehm, P. D., and D. L. Fiest. 1980b . Aspects of the Transport of PetroleumHydrocarbons to the Offshore Benthos During the IXTOC-I Blowout in theBay of Campeche, Pp. 207-236. In Proceedings of a Symposium, PreliminaryResults from the September 1979—Researcher/Pierce IXTOC-I Cruise. (June9-10, Key Biscayne, FL) NOAA, Office of Marine Poll. Assessment.
Boehm, P. D., D. L. Fiest, and A. Elskus. 1981. Comparative Weathering Pat-terns of Hydrocarbons from the Amoco Cadiz Oil Spill Observed at a Vari-ety of Coastal Environments, pp~9~ In Proceedings of the Inter-national Symposium, Amoco Cadiz Fates and~ffects of the Oil Spill.——Centre Oceanologique de Bretagne, Brest (France).
Bridie, 4. L., Ms. Th. H. Vanders, W* Zegreld, and He 8* van der Heijdec
1980a. The Formation, Prevention ancl Breaking of Sea-Water-in-Crude-OilEmulsions: “Chocolate Mousse”, pp. 33-39. ln international ResearchSymposium, Chemical Dispersion of Oil Spill~ (Nov. 17-19, Toronto,Canada).
130
—. .—— .— .— .–– .-— .
Bridie, A. L.,Formation,“Chocolate
Brooks, J. M.,Bernard.
Th. H. Nandeps, W. Zegveld, and H. B. Van der Heijde. 1980b.Prevention and Breaking of Sea Water in Crude Oil EmulsionsMousses”. Mar. Poll. Bull. 2:343-348.
D. A. Weisenburg, R. A. Burke, M. C. Kenicutt, and B. B.1980. Gaseous and Volatile Hydrocarbons in the Gulf of Mexico
Following the IXTOC-I Blowout, pp. 53-85; In Proceedings of a Symposium,Preliminary Results from the September 1~9 Researcher/Pierce IXTOC-ICruise. (June 9-10, Key Biscayne FL). NOAA, Office of Marine Poll .Assessment.
Brown, R. 4., T. D. Searl, J. J. Elliot, 5. G. Phillips, D. E. Brandon, and P.H. Monaghan. 1973. Distribution of Heavy Hydrocarbons in Some AtlanticOcean Waters, pp. 505-519. In Proceedings, 1973 Joint Coriferencs onPrevention and Control of Oil ~lls. American Petroleum Inst., Washing-ton, D. C.
Brown, R. A., J. J. Elliot, J. M. Ken iher, and T. D. Searl. 1975. Samplingand Analysis of Nonvolatile Hydrocarbons in Ocean Water, Pp. 172-187. lnAnalytical Methods in Oceanography. Am. Chem. Sot. Adv. Ser. 147. —
Brown, R. A., and H. L. Huffman, Jr. 1976. Hydrocarbons in Open OceanWaters. Science, 191:847-849.
Buckley, E. N., F. K. Pfaender, and K. L. Kylberg. 1980. Response of thePelagic Community to Oil from the IXTOC-I Blowout: II. Model EcosystemStudies, pp. 563-586. ln Proceedings of a Symoosium, Preliminary Resultsfrom the September 197~Researcher/Pierce IXTOC-I Cruise. (June 9-10,Key Biscayne, FL) NOAA, Office of Marine Poll. Assessment.
Burwood, R., and G. C. Spears. 1974. Photo-oxidation as a Factor in theEnvironmental Dispersal of Crude Oil. Estuarine Coastal Marine Science,2:117-135.
Butler, J. N. 1973. The Occurrence and Amount of Pelagic Tar in the OpenOcean, pp. 376-399. ln Background Papers for a Workshop on Inputs,Fates, and Effects of ~troleum in the Marine Environment, Volume II.Prepared under the Aegis of Ocean Affairs Board, National Academy ofSciences, Washington, D.C.
Butler, J. N., 8. F. Morris, and J. Sass. 1973. Pelagic Tar from Bermuda andthe $argasso Sea. Special Publication No. 10, Bermuda Biological Sta-tion. 346 pp.
Butler, J. N. 1975a. Evaporative Weathering of Petroleum Residues: the Ageof Pelagic Tar. Marine Chemistry, 3:9-21.
Butler, J. N. 1975b. Pelagic Tar. Sci. Amer. 232:90-97.
131./
-. -—.—. .— .-
Butler, J. N., B. F. Morris, and T. D. Sleeter. 1976. The Fate of Petroleumin the Open Ocean, pp. 287-297. In Proceedings of the Symposium,Sources, Effects and Sinks of Hydroc~~ns in the Aquatic Environment.The American Institute of Biological Sciences, (August 9-11, Washington,D.C.).
Cairns, R. J. R., D. M. Grist, and E. L. Neustadter. 1974. The Effect ofCrude Oil-Water Interracial Properties on Water-Crude Oil Emulsion Sta-bility, pp. 135-151. In A. L. Smith, ed. Theory and Practice of Emul-sion Technology. Acade~c Press, New York.
Calder, J. A., J. Lake, and J. Laseter. 1978. Chemical Composition of Select-ed Environmental and Petroleum Samples from the Amoco Cadiz Oil Spill,pp. 21-84. &the Amoco Cadiz Oil Suill. A NOAA/E~e~Report.——
Calder, J. A., and P. D. Boehm. 1981. The Chemistry of Amoco Cadiz Oil inAber Wrac’h, pp. 149-158. In Proceedings of the Internfinal Symposium,Amoco Cadiz Fates and Effec~ of the 0{1 Spill. Centre Oceano16gique deB~gne, Brest (France).
Callahan, R. A., and A. Soutar. 1976.Collection of Analytical Samples.sored by the Narine Technology Sot.
Southern California Baseline Studies -In Proceedings, 2nd Annual Conf. spon-~nd the I MOS. News 29:3-667-674.
Canevari, G. P. 1969. General Dispersant Theory, pp. 171-177. In Proceed-ings, Joint Conference on Prevention and Control of Oil Spifis. NTISReport No. P% 194 395.
Clark, R. C., Jr., and N. D. Macheod, Jr. 1977. Inputs, Transport Mechan-isms, and Observed Concentrations of Petroleum in the Marine Environment,pp. 91-223. ~ Donald C. Mahl ins, ed. Effects of Petroleum on Arcticand Subarctic Marine Environments and Organisms, Volume I. Nature andFate of Petroleum. Academic Press, Inc.
Conomos, T. J. 1975. Movement of Spilled Oil as Predicted by Estuarine Non-tidal Drift. Limnol. Oceanogr. 20:159-173.
Conover, R. J. 1971. Some Relationships Between Zooplankton and Bunker C Oilin Chedabucto Bay Following the Wreck of the Tanker Arrow. Journal ofthe Fisheries Resource Board of Canada, 28:1327-1330.
Cormack, D., and J. A. Nichols. 1977. The Concentrations of Oil in SeawaterResulting from Natural and Chemically Induced Dispersion of Oil Slicks,PP. 381-385. In Proceedings, 1977 Oil Spill Conference (March 8-10, NewOrleans, LA) A~erican Petroleum Institute Publ. No. 4284.
Davis, S. J., and C. F. Gibbs. 1975. The Effect of Weathering on a Crude OilExposed at Sea. Water Research, Vol. 9, 3:275-289.
132
.— -. . . . . __-— —— —. -.—-
Dickens, D. F., I. A. Buist, and W. M. Pistruzak. 1981. Dome’s PetroleumStudy of Oil and Gas Under Sea Ice, Pp. 183-189. In Proceedings, 1981Oil Spill Conference (March 2-5, Atlanta, GA) Amer~an Petroleum Inst.Pub . No. 4334.
Dwivedi, S. N., and A. 1-1. Parulekar. 1974. Oil Pollution Along the IndianCoastline. Marine Poll. Monitoring (Petroleum). Nat. Bur. Stand. Spec.Pub. No. 409, pp. 101-105.
Barrington, J. W., and B. V. Tripp. 1975. A Comparison of Analysis Methodsfor Hydrocarbons in Surface Sediments. ln T, M. Church, ed. Marine Chem-istry in the Coastal Environment. ACS Sy7posium Series No. 18.
Feldman, M. H. 1973. Some Mechanisms of Feathering of Petroleum Hydrocarbonson Marine Waters: Competitive Pathways to fate and Disposition of Petro-leum Pollution, pp. 431-45. In Background Papers for a Workshop on In-puts, Fates, and Effects of P~roleum in the i+arine Environment, VolumeII. Prepared under the Aegis of Ocean Affairs Board, National Academy ofSciences, Washington, D.C.
Forrester, W. D, 1971. Distribution of Suspended Oil Particles Following theGrounding of the Tanker Arrow. Journal of Marine Research, 29:151-170.
Frankenfeld, J. W. 1973. Weathering of Oil at ,Sea. NTIS Report No. AD 787789, pp. 7-9. Submitted to the U.S. Coast Guard, Washington, D.C.
Friede, J. D. 1973. The Isolation and Chemical and Biological Properties ofMicrobial and Emulsifying Agents for Hydrocarbons. Progress Report. AD770-630. National Technical Information Service, U.S. Dept. of Commerce,Springfield, VA., 5 PP.
Geyer, 1?. A. 1981. Naturally Occurring Hydrocarbons in the Gulf of Mexicoand the Caribbean, pp. 445-451. In Proceedings, 1981 Oil Spill Confer-ence (March 2-5, Atlanta, GA) A~rican Petroleum Institute Publ. No.4334.
Gorden, D. C., Jr., P. D. Keizer, and N. J. Prouse. 1973. Laboratory studieson the Accommodation of Some Crude and Residual Fuel Oils in Seawater.Journal of Fisheries Research Board of Canada, 30:1611-1618.
Grahl-Nielsen, O. 1978. The Ekofisk Bravo Blowout. ‘?etroleum Hydrocarbonsin the Seea, pp. 477-499. In Proceedings of the Conference on Assessmentof Ecological Impacts of OIT Spills. (June 14-17, Keystone, CO) Ameri-can Institute of Biological Sciences.
Griffiths, R. P., and R. Y. Morita. 1981. Study of Microbial Activity andCrude Oil - Microbial Interactions in the Water and Sediments of CookInlet and the Beaufort Sea. Final Report RU 190, Submitted toNOAA/OCSEAP, Juneau, Alaska.
133
—— ——— —.—. .—. .— .——
Grose, P. L., and J. S. Mattson. 1977. The Argo Merchant Oil Spill: A Pre-liminary Scientific Report. A NOAA/EPA sp~al report, 133 pp.
Grose, P. L. 1978. The Behavior of Floating Oil from the Argo Merchant. Inthe Wake of the Argo Merchant, pp. 19-21. In Proceedin~of a Symposiumat The Center fo.r~ean Management Studies, ~iversity of Rhode Island.
Grose, P. L. 1979. A Preliminary Model to Predict the Thickness Distributionof Spilled Oil, pp. 1.1-1.16. In Workshop on the Physical Behavior ofOil in the Marine Environment. way 8-9, Princeton Univ. ) Prepared forNational !4eather Service, Silver Spring, MD.
Guire, P. E., J. D. Friede, and R. K. Gholson. 1973. Production and chartic-terization of Emulsifying Factors from Hydrocarbonocl astic Yeast andBacteria, pp. 229-231. In D. G. Ahern and S. P. Meyers, eds. The Micro-bial Degradation of Oil~ollutants. Publ. No. LSU-SG-73-01. Center forWetland Resources, LSU, Baton Rouge, LA.
Gundlach, E. R., K. J. Finkelstein, and J. L. Sadd. 1981. Impact and Persist-ence of IXTOC-I Oil on the South Texas Coast, PP. 477-485. In Proceed-ings, 1981 Oil Spill Conference. (March 2-5, Atlanta, GA)— AmericanPetroleum Institute Publ. No. 4334.
Harm, R. W., Jr. 1977. Fate of Oil from the Supertanker Metula, pp. 465-473.& Proceedings, 1977 Oil S~ill Conference. (March 8-10, New Orleans,LA) American Petroleum Institute Publ. No. 4284.
Hayes, M. O., E. R. Gundlach, and L. D’Ozouville. 1979. Role of DynamicCoastal Processes in the Impact and Dispersal of the Amoco Cadiz OilSpill (March, 1978) Brittany, France, pp. 193-198. In P=di~1979Oil Spill Conference (March 19-22, L.A., CA) Amerl~n Petroleum Inst.Publ. No. 4308.
Hollinger, J. P., and R.”A. Menella. 1973. Oil Spills: Measurements of theDistributions and Volumes by Multifrequency Microwave Radiometry. Sci-ence, 181:54-56.
Horn, M. H., J. M. Teal, and R. H. Backuso 1970. Petroleum Lumps on theSurface of the Sea. Science, 168:245-246.
JBF/API. 1976. Physical and Chemical Behavior of Crude Oil Slicks on theOcean. API Publication 4290, American Petroleum Institute, Washington,D.C.
Jeffrey, L. M. 1973. Preliminary Report on Floating Tar Balls in the Gulf ofMexico and Caribbean Sea. Unpublished report. Sea Grant Project 53399,Texas A8ti U., College Station, TX.
134

Jeffrey, L. M., D. J. Frank, N. Powell , 4. Bautz, A. Vos, and L. May. 1973.Progress Report on Pelagic, Beach and Bottom Tars of the Gulf of Mexicoand Controlled Weathering Experiments. Department of Oceanography, TexasA&M University, 86 pp.
Jeffrey, L. M., W. E. Pequegnat, E. A. Kennedy, A. Vos, and B. M. James.1974. Pelagic Tar in the Gulf of Mexico and Caribbean Sea. Mar. Poll.Monitoring (Petroleum). Natl. Bur. Stand. Spec. Pub. 409, pp. 233-235.
Johnson, J. H., P. !4. Brooks, A. K. Aldridge, and S. J. Rowland. 1978. Pres-ence and Sources of Oil in the Sediment and Benthic Community Surroundingthe Ekofisk Field After the Blowout at Bravo, Pp. 488-513. In Proceed-ings, Conference on Assessment of Ecological Impacts of 0~ Spills.(June 14-17, Keystone, CO) American Institute of Biological Sciences.
Jordan, R. E., and Payne, J. R. 1980. Fate and Weathering of PetroleumSpills in the Marine Environment, 174 pp. Published by Ann Arbor Sci-ence, Ann Arbor, Michigan.
Keizer, P. D., T. P, .4hern, J. Dale, and J. H. Vandermeulen. 1978. Residuesof Bunker C Oil in Chedabucto Bay, Nova Scotia, 6 Years After the ArrowSpill. Journal of the Fisheries Research Board of Canada, Volume 35,5:528-535.
Kelley, F. J., Jr., R. W. Harm, Jr., and H. N. Young. 1981. Surveillance,Tracking, and Model Correlation of the Spill from the Tanker BurmahAgate, pp. 147-152. In Proceedings, 1981 Oil Spill Conference. m2-5, Atlanta, GA) Ame=can Petroleum Inst. Publ. No. 4334.
Klein, A. E., and N. Pilpel. 1974. The Effects of Artificial Sunlight UponFloating Oils. Water Research, 8:79-83.
Kolpack, R. L., R. W. Stearns, and G. L. Armstrongq 1978. Sinking of Oil inLos Angeles Harbor, California, Following the Destruction of theSansinena, pp. 379-392. & Proceedings, Conference on Assessment ofEcological Impacts of Oil Spills. American Institute of BiologicalScienc2s.
Koons, C. B. 1973. Chemical Composition: A Control on the Physical andChemical Processes Acting on Petroleum in the Marine Environment, pp.475-484. In Background Papers for a Workshop on Inputs, Fates, andEffects of~etroleum in the Marine Environment, Volume [1, Pregaredunder the Aegis of Ocean Affairs Board, National Academy of Sciences,Washington, D.C.
Langmuir, I. 1933. Oil Lenses on Water and the Nature of Monomolecular Ex-panded Films. J. of Chem. Physics, V1:756-776.
135

——
Lee, !4., F. ilartinelli, B. Lynch, and P. R. Morris. 1981. The Use of Disper -sants on Viscous Fuel Oils and Mater in Crude Oil Emulsions, pp. 31-35.In Proceedings, 1981 Oil Spill Conference (March 2-5, Atlanta, GA) Ameri-=n Petroleum Inst. Publ. No. 4334.
Ludwig, H. F., and R. Carter. 1961. Analytical Characteristics of Oil-TarMateriais on Southern California Beaches. J. Wat. Poll. Control Fed.33:1123-1139.
Macauley, M. C., K. Daly, and T. Saunders English. 1980. Acoustic Observa-tions of Biological Volume Scattering in the Vicinity of the IXTOC-IBlowout, Op. 499-521. ~ Proceedings of a Symposium, Preliminary Resultsfrom the September 1979 Researcher/Pierce IXTOC-I Cruise. (June 9-10,Key Biscayne, FL) NOAA, Office of Mar. Poll. Assessment.
MacGregor, C., and A. Y. McLean. 1977. Fate of Crude Oil Spilled in a Simu-lated Arctic Environment, pp. 461-463. In Proceedings, 1977 Oil SpillConference (March 8-10, New Orleans, LA)— American Petroleum InstitutsPub. No. 4284.
Mackay, G. C. M., A. Y. McLean, O. J. Betancourt, and B. C. Johnson. 1973.The Formation of Water-in-Oil Emulsions Subsequent to an Oil Spill.Journal of the Institute of Petroleum, Volume 59, 568:164-172.
Mackay, D., and R. S. Matsugu. 1973. Evaporation Rates of Liquid HydrocarbonSc)ills on Land and Water. Canadian Jo Chem. Eng., 51:434-439.
ilackay, D., I. Buist, R. flascarenhas, and S. Patterson. 1979. ExperimentalStudies of Dispersion and Emulsion Formation from Oil Slicks, pp.1.17-1.40. In Workshop on the Physical Behavior of Oil in the MarineEnvironment. ~rinceton Univ., prepared for the National Weather Service,Silver Spring, MD.
Mackay, D., I. Buist, R. Mascarenhas, and S. Patterson. 1980. Oil SpillProcesses and Models. A report submitted to Environmental EmergencyBranch Environmental Impact Control Directorate Environment ProtectionService Environment Canada, (December) Ottowa, Ontario KIA 1C8.
Mao, M. L. M. and S. S. Marsden. 1977. Stability of Crude Oil-in-Water Emul-sions as a Function of Shear Rate, Temperature, and Oil Concentration.Journal of Canadian Petroleum Technology, Vol. 16, 2:54-59.
McAuliffe, C. D. 1977. Dispersal and Alteration of Oil Discharged on a WaterSurface, pp. 19-35. In Douglass A. Wolfe, ed. Fate and Effects of Petro-leum Hydrocarbons in-~arine Organisms and Ecosystems. Pergamon Press,Inc., Elmsford, N.Y.
McAuliffe, C. D., D. E. Fitzgerald, B. L. Steelman, J. P, Ray, W. R. Leek, andC. D. Barker. 1981. The 1979 Southern California Dispersant TreatedResearch Oil Spills, pp. 269-282. In Proceedings, 1981 Oil Spill Confer-ence, (March 2-5, Atlanta, GA) Amer~can petroleum Inst. Publ. No. 4334.
136

—————
McGowan, U. E., W. A. Saner, and G. L. Hufford. 1974. Tar Ball Sampling inthe !Jestern North Atlantic. Mar. Poll. Monitoring (Petroleum). NationalBureau of Standards Spec. Pub. 409, pp, 83-84.
Mommessin, P. R., and J. C. Raia. 1975. Chemical and Physical Characteriza-tion of Tar Samples from the Marine Environment, PP. 155-167. In Proceed-ings, Conference on Prevention and Control of Oil Pollutio~ (March25-27, San Fran., CA) American Petroleum Institute.
Mooney,
Mooney,
tiorris ,
“1I orr
Morr
At
s,
M. 1951. J. Colloid Sci., 6:152.
M ., and U. J. Hermonat. 1955. J. Colloid Sci., 10:121.
B. F. 1971. Petroleum: Tar Quantities Floating in the Northwesternantic taken with a new Quantitative Neuston Net. Science, 173:430-432.
B. F., and J. N. Butler. 1973. Petroleum Residues in the SargassoSea and on Bermuda Beaches, Pp. 521-529. In Proceedings, Joint Confer-ence on the Prevention and Control of Oil~pills. American PetroleumInstitute, Washington, D.C.
s, B. F., J. N. Butler, and A. Zsolany. 1975. Pelagic Tar in the Medi-terranean Sea. Environ. Conserv. , 2:275-281.
Morris, B. F., J. N. Butler, T. D. Sleeter, and J. Cadwallader. 1966. Trans-fer of Particulate Hydrocarbon Material from the Ocean Surface to theMater Column. In H. L. Windom and R. A. Duce, ed. Marine PollutantTransfer, Publified by D, C. Heath and Co., Lexington, MA.
Morris, R. J., and F. Culkin. 1974. Lipid Chemistry of Eastern FleditteraneanSurface Layers. Nature, 250:640-642.
(Nagata, S. , and G. Konclo. 1977. Photo-Oxidation of Crude Oils, pp. 617-620.In Proceedings, 1977 Oil Spill Conference (March 8-10, New Orleans, LA)7%ferican Petroleum Inst. Pub. No. 4284.
National Academy of Sciences. 1973. Petroleum in the Marine Environment.Workshop on Inputs, Fates, and the Effects of Petroleum in the MarineEnvironment (May 21-25, Airlie, VA) 824 pp.
Nelsen, T. A. 1980. Mineralogy of Suspended and Bottom Sediments in theVicinity of the IXTOC-I Blowout, September 1979, pp. 189-204. In Pro-ceedings of a Symposium, Preliminary Results from the Septembe~ 1979Researcher/Pierce IXTOC-I Cru~se (June 9-10, Key Biscayne, FL) NOAA ,TT Ice 07 Marine Pollution Assessment.
Nelson, U. G., and A. A. Allen. 1981. Oil Migration and Modification Pro-cesses in Solid Sea Ice, pp. 191-198. In Proceedings, 1981 Oil Spill~~nf::~:e. (March 2-5, Atlanta, GA) Ame=can Petroleum Institute Publ.
. .
137

—. -———- ..—— .__— — . ..— — .
Oil Spill Intelligence Report. 1980. An International Weekly Newsletter Fromthe Center for Short-Lived Phenomena and Cahners Publishing Co., VolumeIII, No. I, Jan. 4.
Overton, E. B., J. L. Laseter, W. Mascarella, C. Raschke, 1. Nuiry, and J. !4.Farrin@on. 1980a. Photo Chemical Oxidation of IXTOC-I Oil, pp.341-383. In Proceedings of a Symposium, Preliminary Results from theSeptember ~979 Researcher/Pierce IXTOC-I Cruise. (June 9-10, KeyBiscayne, FL) NO ,~e Pollution Assessment.
Overton, E. B., L. V. McCarthy, S. W. Mascarella, M. A. Maberry, S. R.Antoine, J. L. Laseter, and J. N. Barrington. 1980b. Detailed ChemicalAnalysis of IXTOC-I Crude Oil and Selected Environmental Samples from theResearch and Pierce Cruises, pp. 439-495. In Proceedings of a Symposium,P~ary Results from the September 1~9 Researcher/Pierce IXTOC-ICruise. (June 9-10, Kay Biscayne, FL) NOAA, Office of Mar. Poll. Assess-ment.
Owens, E. H. 1978. Mechanical Dispersal of Oil Stranded in the LittoralZone. Journal of the Fisheries Board of Canada, Vol. 35, 5:563-572.
Parker, C. A. 1970. The Ultimate Fate of Crude Oil at Sea; Uptake of Oil byZooplankton, pp. 242. In P. Hepp?e, ed. Water Pollution by Oil , Insti-tute of Petroleum (London.
Parker, C. A., M. Freegarde, and c. G. HatChard. 1971. The Effect of SomeChemi:;~ 2~4d Biological Factors on the Degradation of Crude Oil at Sea,PP* - In P. Hepple, ed. Water Pollution by Oil, Instituta ofPetroleum (iondo~.
payne, J. R., J. R. Clayton, Jr., B. W. de Lappe, P. L. Millikan, J. S.Parkin, R. K. Okazaki, E. F. Letterman, and R. W. Risebrough. 1978.Hydrocarbons in the Water Column, Southern California Baseline Study.Submitted to U.S. Department of Interior, 8LM, as SAI Report No.SAI-76-809-LJ:149 PP.
payne, J. R., G. S. Smith, P. J. hlankiewicz, R. F. Shokes, N. W. Flynn, V.Moreno, and J. Altamirano. 1980a. Horizontal and Vertical Transport ofDissolved and Particulate-Bound Higher-Molecular-Weight Hydrocarbons fromthe IXTOC-I Blowout, pp. 119-167. ~ Proceedings of a Symposium, Prelimi-nary Results from the September 1979 Researcher/Pierce IXTOC-I Cruise.(June 9-10, Key Biscayne, FL) NOAA, Office of Mar. Poll . Assessment.
payne, J. R., N. W. Flynn, p+ J, MankiewicZ, and G, S. Smith. 1980b. SurfaceEvaporation/Dissolution Partitioning of Lower-Molecular-Weight AromaticHydrocarbons in a Down-Plume Transect from the IXTOC-I !4ellhead, pp.239-265. In Proceedings of a Symposium, Preliminary Results from theSeptember ~979 Researcher/Pierce IXTOC-I Cruise. (June 9-10, KeyBiscayne, FL) NOAA, Office of Mar. Poll. Assessment.
138

—.. .- —.—. — —--
Payne, J. R., G. S. Smith, J. L. Lambach, and P. J. hlankiewicz. 1981a. Chemi-cal Weathering of Petroleum Hydrocarbons in Sub-Arctic Sediments: Re-sults of Chemical Analyses of Naturally Weathered Sediment Plots Spikedwith Fresh and Artificially Weathered Cook Inlet Crude Oils. Cited in:Griffiths, R. P., and R. Y. Morita. 1981. Stud,y of Microbial Activityand Crude Oil-Microbial Interaction in the Water and Sediments of CookInlet and the Beaufort Sea. Final Report RU 190, Submitted toNOAA/OCSEAP, Juneau, Alaska,
payne, J. R., B. E. Kirstein, R. E. Jordan, G. D. McNabb, Jr., J. L. Lambach,M. Frydrych, M. J. Paplawsky, G. S. Smith, P. J. Mankiewicz, R. T.Redding, D. M. Baxter, R. E. Spenger, R. F. Shokes and D. J. !laiero.1981b. Multivariate Analysis of Petroleum Weathering in the MarineEnvironment - SubArctic. Annual Report on Contract No. NA80RACOO018submitted to NOAA/OCSEAP Program Office, Juneau, Alaska. November 1981,364 PP.
Peak, E. E., and G. W. Hodgson. 1966. .Alkanes in Ageous Systems, I, Explora-tory Investigations on the Accommodation of C-20 to C-33 n-alkanes inDistilled Water and Occurrence in Natural Water Systems. Journal ofAmerican Oil Chemists Society, Vol. 43:215-222.
Peak, E. E., and G. W. Hodgson. 1967. Alkanes in Ageous Systems, II, Combina-tion of C-12 to C-36 n-alkanes in Distilled Water. Journal of AmericanOil Chemists Society, Volume 44:696-702.
Petersen, Hanne K. 1978. Fate and Effect of Bunker C Oil Spilled by the USNSPotomac in Melville Bay - Greenland - 1977, pp. 332-343. In Proceedings,Conference on Assessment of Ecological Impacts of Oil mills. (June14-17, Keystone, CO) American Institute of Biological Sciences.
Pequegnat, L. H. 1979. Pelagic Tar Concentrations in the Gulf of Mexico Overthe South Texas Continental Shelf, Contributions in Mar. Sci. 22:31-39.
Polikarpov, G. G., N. Yegorov, V. N. Ivanov, A. V. Tokareva, and 1. A.Feleppov. 1971. Oil Areas as an Ecological Niche. Priroda No. 11(translated from Russian by Precoda, N.) Pollut. Abstract 3:72-5TC-0451.Cited in: Sleeter, T. D., B. F. Morris, and J. N. Butlsr, 197fj. PelagicTar in the Caribbean and Equatorial Atlantic. 1974. Deep-Sea Res.23:467-474.
Ra,j, P. P. K. 1977. Theoretical Study to Determine the Sea State Limit forthe Survival of Oil Slicks on the Ocean. U.S. Department of Transporta-tion, USCG Reuort No. CG-D-90-77.
Ross, S. L., C. W. Ross, F. Lepine, and R. K. Langtry. 1980. IXTOC-I Blow-OUt, DO. 25-38. In Proceedings of a Svmoosium. Preliminary Results from
. (June 9-10. Keythe- September 19~Researcher~”Pierce ‘~XT-O-C-I- Cruise. ,.-. - - __, . .Biscayne, FL) NOAA, ~oll . Assessment.
139

—.. —. . . ..— —
.
..-
Rash”
Sadd
d, M. A. 1974. Degradation of Bunker C Oil Under Different CoastalEnvironments in Chedabucto Bay, Nova Scotia. Estuarine Coastal MarineScience, Volume 2:137-144.
J. L., E. R. Gundlach, !4. Ernst, and G. I. Scott. 1980. Distribution,Size, and Oil Content of Tar Mats and the Extent of Buried Oil Along theSouth Texas shor~~ine, PP. 14-20. In Research Planning Institute Reportto NOAA, Office of Mar. Poll. Assessfint, Boulder, CO.
Saner, W. A., and M. Curtis. 1974. Tar Ball Loadings on Golden Beach,Florida. Mar. Poll. Monitoring (Petroleum). Nat. Bur. Stand. Spec. Pub.No. 409, pp. 79-81.
Shaw, D. G., and G. .4. Mapes. 19790 Surface Circulation and the Distributionof Pelagic Tar and Plastic. Mar. Poll. Bull. 10:160-162.
Sherman, K., IJ. 8. Colton, R. L. Dryfoos, and B. S. Kinnear. 1973. Oil andPlastics Contamination and Fish Larvae in Surface Waters of the NorthwestAtlantic. hlARMAP Operational Test Survey Report: July-August 1972,January-March 1973. Unpublished report. NMFS, MARMAP Narragansett, RI.
Sherman, K., J. 6. Colton, R. L. Dryfoos, K. D. Knapp, and 8. S. Kinnear.1974. Distribution of Tar Balls and Nueston Sampling in the Gulf StreamSystem. Mar. Poll. Monitoring (Petroleum). Natl . Bur. of Stand. Spec.Pub. 409, PQ. 83-84.
Sleeter, T. D., B. F. Morris, and J. N. Butler. 1974. Quantitative Samplingof Pelagic Tar in the North Atlantic. 1973. Deep-Sea Res., Volume 21,PP. 773-775.
Sleeter, T. D., B. F. Morris, and J. N. Butler. 1976. Pelagic Tar in theCaribbean and Equatorial Atlantic. 1974. Deep-Sea Res. 23:467-474.
Smith, G. !3. 1976. Pelagic Tar in the Norwegian Coastal Current. Mar.Pollut. Bull. 7:70-72.
Smith, G. L. 1977. Determination of the Leeway of Oil Slicks. In ‘ D. A.Wolfe, ed. Fate and Effects of Petroleum Hydrocarbons in Marine~rganismsand Ecosystems. Pergamon Press, Inc., Elmsford, NY.
Strauqhan, 0. 1977. Biological Survey of Intertidal Areas in the Straits ofMagellan in January, 1975, Five !lonths after the Metula Oil Spill, pp.247-260. & D. A. Wolfe, ed. Fate and Effects ofmeum Hydrocarbonsin Marine Organisms and Ecosystems. Pergamon Press, Inc., Elmsford, NY.
Sweeney, R. E., R. 1. Haddad, and I. R. Kaplan. 1980. Tracing the Dispersalof the IXTOC-I Oil Using C, H, S, and N Stable Isotope Ratios, pp.89-115. In Proceedings of a Symposium, Preliminary Results from theSeptember~979 Researcher/Pierce IXTOC-I Cruise. (June 9-10, KeyBiscayne, FL) NOAA, Office of Mar. Poll. Assessment.
140
.—.. ..— ..— —— .—. --- ——- -
.,L.
Thomas, M. L. !-l. 1977. Long-Term Biological Effects of Bunker C in the Inter-tidal Zone, pp. 238-245. In D. A. Wolfe, ed. Fate and Effects of Petro-leum Hydrocarbons in Marl~e Organisms and Ecosystems. Pergamon Press,Inc. , Elmsforci, NY.
Twardus, E. M. 1980. ,4 Study to Evaluate the Combustibility and Other Physi-cal and Chemical Properties of Aged Oils and Emulsions. R and D DivisionEnvironmental Emergency Branch Environmental Impact Control DirectorateEnvironmental Protection Service Environment, Canada, Ottawa, Ontario.
Vandermeulen, J. H., P. D. Keizer, and W. R. Penrose. 1977. Persistence ofNon-Alkane Components of Bunker C Oil in Beach Sediments of ChedabuctoBay, and Lack of Their Metabolism by Mollusks, pp. 469-482. In Proceed-ings, 1977 Oil Spill Conference. (March 8-10, New Orleans, LA~ AmericanPetroleum Inst. Publ. No. 4284.
Vandermeulen, J. H., B. F. N. Long, and T. P. Ahern. 1981. Bioavailabilityof Stranded Amoco Cadiz Oil as a Function of Environmental Self-Cleaning:April 1978-J~ry~9, pp. 585-597. In Proceedings of the Interna-tional Symposium, Amoco Cadiz Fates and E~ects of the Oil Spill. CentreOceanologique de B~ne~est (France).
van Dolah, R. F., V. G. Burrell, Jr., and S. 8. West. 1980. The Distributionof Pelagic Tars and Plastics in the South Atlantic Bight. Mar. Poll.Bull., Volume 11:352-256. Pergamon Press, Ltd., Elmsford, N.Y.
Wade, T. L. 1974. Measurements of Hydrocarbon, Pthalic Acid, and PthalicAcid Ester Concentrations in Environmental Samples from the NorthAtlantic, M.S. Thesis, University of Rhode Island.
Wade, T. L., J. G. Quinn, T. L. Wai-ping, and C. W. Brown. 1976. Source andDistribution of Hydrocarbons in Surface Waters of the Sargasso Sea, pp.271-286. In Proceedings of the S,~posium, Sources, Effects and Sinks ofHycirocarboniin the Aquatic Environment. American Institute of Biologi-cal Sciences, Washington, DOC.
Walter, D. J., and J. R. Proni. 1980. Acoustic Observations of SubsurfaceScattering During a Cruise at the IXTOC-I Blowout in the Bay of Campeche,Gulf of Mexico, pp. 525-541. In Proceedings of a Symoosium, PreliminaryResults from the September 197~Researcher/Pierce IXTOC-I Cruise. (June9-10, Key Biscayne, FL) NOAA, Office of Mar. Poll. Assessment.
Ward, D. M. 1981. Microbial Responses to Amoco Cadiz Oil Pollutants, pp.217-222. In Proceedings of the Internial Symposium, Amoco CadizFates and E~fects of the Oil Spill. Centre Oceanologique de~tagnee,Brest (France).
141

-.—.—.- .— -— -- ——-. -. .
Wolfe, Cl. A., R. C. Clark, Jr., C. A. Foster, J. W. Hawkes, and M. D. Mac Leod,Jr. 1981. Hydrocarbon Accumulation and Histopathology in Bivalve Plol-lUSCS Transplanted to the Baie de Plor[aix and the Rade de Brest, PP.599-616. In Proceedings of the International Symposium, Amoco CadizFates and ~fects of the Oil Suill. Centre Oceanologique d=etagne,Brest (France).
hlong, c. s., D. R. Green, and !4. J. Cretney. 1973. Pelagic Tar in the NorthPacific Ocean, pp. 400-415. & Background Papers for a Workshop on In-puts, Fates, and Effects of Petroleum in the Marine Environment, Volume2. Prepared under the Aegis of Ocean Affairs Board, National Academy ofSciences, 14ashington, O.C.
Wong, C. S., D. R. Green, and W. J. Cretney. 1974. Quantitative Tar andPlastic Waste Distributions in the Pacific Ocean. Nature, Volume247:30-32.
‘Wong, C. S . , 1), R. Green, and W. J. Cretney, 1976. distribution and Sourceof Tar in the Pacific Ocean. Mar. Poll. Bull., Volume 7:102-106.
bjic, J. E., 8. Supplisson, and B. Volesky. 1974. Bacterial Degradation andEmulsification of No. 6 Fuel Oil. Environ. Sci. Technol. 8:664-668.
142