the classification of language of high school choral …
TRANSCRIPT

THE CLASSIFICATION OF LANGUAGE OF
HIGH SCHOOL CHORAL DIRECTORS
by
MATTHEW LYNN STRAUSER
A DISSERTATION
Presented to the School of Music and Danceand the Graduate School of the University of Oregon
in partial fulfillment of the requirementsfor the degree of
Doctor of Musical Arts
June 2008

11
University of Oregon Graduate School
Confirmation of Approval and Acceptance of Dissertation prepared by:
Matthew Strauser
Title:
"THE CLASSIFICATION OF LANGUAGE OF HIGH SCHOOL CHORALDIRECTORS"
This dissertation has been accepted and approved in partial fulfillment of therequirements for the Doctor of Musical Arts degree in the Department of Music by:
Harry Price, Chairperson, MusicPhyllis Paul, Member, MusicSharon Paul, Member, MusicRoland Good, Outside Member, Special Education and Clinical Sciences
and Richard Linton, Vice President for Research and Graduate Studies/Dean of theGraduate School for the University of Oregon.
June 14,2008
Original approval signatures are on file with the Graduate School and the University ofOregon Libraries.

© 2008 Matthew Lynn Strauser
III

IV
An Abstract of the Dissertation of
Matthew Lynn Strauser
in the School of Music and Dance
for the degree of
to be taken
Doctor ofMusical Arts
June 2008
Title: THE CLASSIFICATION OF LANGUAGE OF HIGH SCHOOL CHORAL
DIRECTORS
Approved: _
Dr. Harry E. Price
The revised Bloom's cognitive taxonomy classifies thinking into ways and kinds
of knowing. The ways of knowing are remember, understand, apply, analyze, evaluate,
and create. The kinds of knowing are factual, conceptual, procedural, and metacognitive.
Higher order thinking requires analysis, evaluation, or creation. It has been suggested that
ensemble directors spend little time teaching higher order thinking and concepts.
Rehearsals of six expert high school choral directors were audio-recorded at the
beginning, middle and end stages of performance preparation. The directors' language
was classified by type of activity. Language containing cognitive content was further
categorized using the revised Bloom's taxonomy. The data were coded using audio
annotation software developed by the author. The software enabled the user to hear the

recorded audio, mark event locations, and add annotations. Annotations included
transcribed text, coding, and comments. The software tracked event time and frequency
and calculated event duration and word counts oftranscribed text.
Results found that student performance was 44% of rehearsal and teacher talk
47%. Teacher vocal modeling was 12% of rehearsal. Teacher talk percentages of
rehearsals overall were 26% task presentation, 2.4% questioning, and 2.5% specific
feedback. Cognitive content was split almost evenly between lower levels of thinking
recall, understand, apply-and higher levels-analyze, evaluate, create. Conceptual
thinking occurred in 4.3% of rehearsal. Rehearsals were fast paced with average overall
event durations of 6.3s. Several ways to define higher order thinking in the two
dimensional revised taxonomy are presented as are suggestions for challenging students
to higher order thinking. The concept of a cognitive topography or cognitive signature is
proposed as a key component for describing a director's teaching style and may have
implications for teacher training and assessment.
v

VI
CURRICULUM VITAE
NAME OF AUTHOR: Matthew Lynn Strauser
GRADUATE AND UNDERGRADUATE SCHOOLS ATTENDED:
University of Oregon, Eugene, OregonWheaton College Graduate School, Wheaton, IllinoisOregon State University, Corvallis, OregonUniversity of Montana, Missoula, Montana
DEGREES AWARDED:
Doctor of Musical Arts in Music Education, 2008, University of OregonMaster of Arts in Biblical Studies, 1982, Wheaton College Graduate SchoolBachelor of Music Education, 1980, University of MontanaBachelor of Arts in Geology, 1980, University of Montana
AREAS OF SPECIAL INTEREST:
Teacher educationSight singing and audiationConductingMountaineering
PROFESSTONAL EXPERIENCE:
Associate Professor of Music, Corban College, Salem, Oregon. 1999-presentGraduate Teaching Assistant, University of Oregon, Eugene, 2002-2004Adjunct Choral Director, Oregon State University, Corvallis, 1997-1999Music Teacher, Grades 7-12, Santiam Christian Schools, Corvallis, Oregon, 1984
1999Music Teacher, Grades K-12, Charlo Public Schools, Charlo, Montana, 1982
1983

GRANTS, AWARDS AND HONORS;
Research Award, University of Oregon, Spring 2007
American Choral Directors Association, Life Membership, 2007
Graduate Teaching Assistant, University of Oregon, Eugene, 2002-2004
Association of Christian Schools International, Lifetime certification, 1999
vii

viii
ACKNOWLEDGMENTS
Many friends, teachers, colleagues, and family members have urged me on during
this project. I wish to thank my dissertation committee: Dr Harry Price, for his expert
guidance and willingness to ask the hard questions; Dr. Sharon Paul, for her
encouragement and enthusiasm for the choral art; Dr. Phyllis Paul, for sharing her love of
teaching; and Dr. Roland Good, for revealing the joy of statistics. I especially would like
to thank Dr. Randall Moore who encouraged me in the early days of my degree. His
friendship will be appreciated always. My gratitude goes to Dr. Shannon Chase who
constantly challenged me to do my best. Thank you Dr. Ann Tedards, whose open office
door and heartfelt interest in my studies was a constant support. I want to thank the
graduate school secretaries, Jill Michelle and Anne Merydith, who in so many ways were
always there to help guide me through the important program checkpoints.
A very special thanks to the administration and staff at Corban College who made
this possible. I want to thank president Hoff for encouraging the faculty to pursue
academic excellence. I need to thank my deans, Dr. Bernard and Dr. Samek, for making
the schedule and teaching load conducive to doctoral work. Thank you to my department
chairman, Dr. Cross, for her everlasting patience, support, and respect. I wish to express
my gratitude to my coworkers, Mr. Shuholm and Mr. Bartsch, for taking up the slack
during these last six years.
Thank you to my wife Naomi for her encouragement, help, and patience. She
provided invaluable assistance in the many weeks spent in data transcription and coding.

lX
I would like to thank my children, Hannah, Kara, Paul, and Alethea, for their continued
love during the days when dad was away doing doctoral work. I want to thank my son-in-
law, Seth, for running the race alongside me as he worked on and finished his degree.
Special thanks go to the teachers who gave so freely of their time during the data
collection phrase of this study. I spent many hours listening to your rehearsal recordings
and with each hearing my respect grew for you as skilled music educators. Oregon is
fortunate to have you.
Let the word of Christ richly dwell within you,with all wisdom teaching and admonishing one another
with psalms and hymns and spiritual songs,singing with thankfulness in your hearts to God.
(Colossians 3:16, NASB, 1995).

Dedicated to my wife Naomi.
x
xi
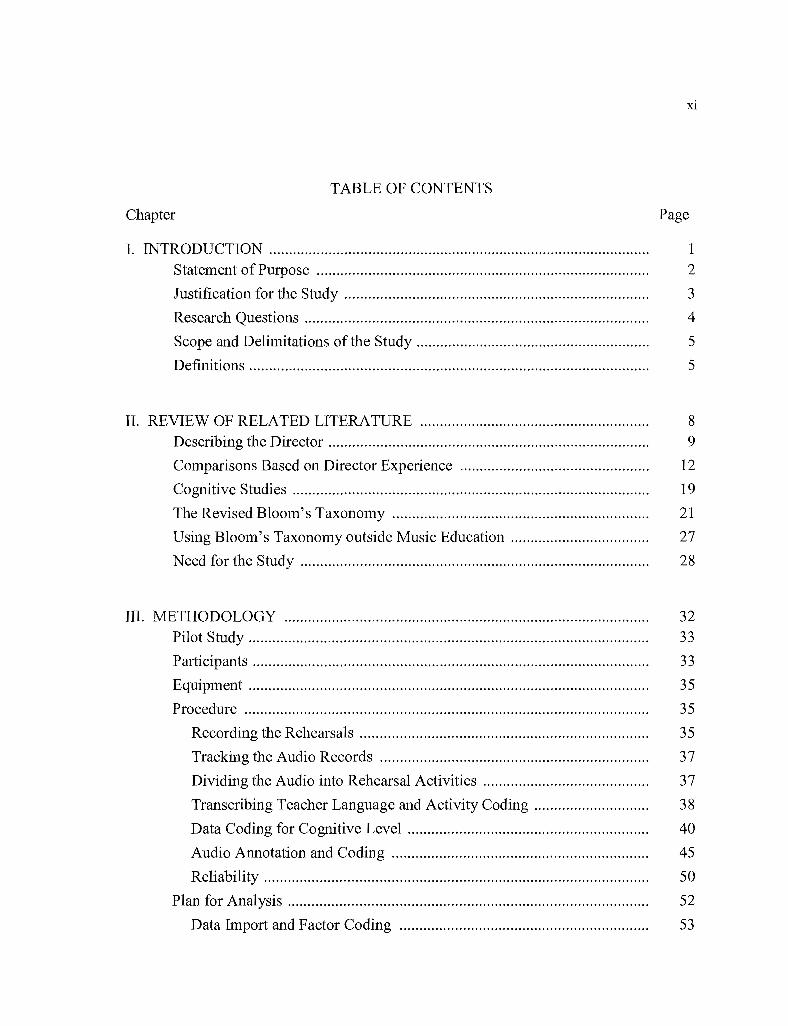
TABLE OF CONTENTS
Chapter Page
I. INTRODUCTION 1Statement of Purpose 2
Justification for the Study...................... 3
Research Questions 4
Scope and Delimitations ofthe Study........... 5
Definitions..................................................................... 5
II. REVIEW OF RELATED LITERATURE .. 8Describing the Director 9
Comparisons Based on Director Experience .. 12
Cognitive Studies 19
The Revised Bloom's Taxonomy................... 21
Using Bloom's Taxonomy outside Music Education 27
Need for the Study 28
III. METHODOLOGY 32Pilot Study 33
Participants 33
Equipment 35
Procedure 35
Recording the Rehearsals 35
Tracking the Audio Records 37
Dividing the Audio into Rehearsal Activities 37
Transcribing Teacher Language and Activity Coding 38
Data Coding for Cognitive Level............................................................. 40
Audio Annotation and Coding 45
Reliability 50
Plan for Analysis 52
Data Import and Factor Coding 53

xii
Chapter Page
Analyses 54
IV. RESULTS 55Restatement of Purpose 55
Participants 55
Recorded Audio 56
Activity Sequence Data 57
Sequences 66
Cognitive Data 68
Word Counts 76
Cognitive and Activity Combined 80
By Stage 84
By Kind and Way of Thinking 91
Speaking Rates and Cognitive Level 94
Sumlnary of Results 96
V. DISCUSSION 98Purpose of the Study....................................... 98
Summary of Results 98
Research Question 1: Can director language be effectively coded andclassified into the cognitive domain taxonomy? 98
Research Question 2: What are the general characteristics of therehearsal language of expert high school directors in terms of rehearsalactivity and cognitive content? 99
Research Question 3: Does the director's use of rehearsal time andcognitive language content change during the stages of songpreparation? 104Research Question 4: Do directors challenge students to think within thehigher cognitive levels of analyze, evaluate, and create? 105
Discussion 108
Limitations of the Study.............................. 109
Implications for Further Study................ 110
Implications for Teaching 111
Conclusion 112

---------- -------- - - ---
xiii
Chapter Page
APPENDICES 114
A. TI\JFORMED CONSENT FORM 114
B. INSTRUCTIONS FOR USING THE MP3 RECORDERS 117
C. USTI\JG R 123
REFERENCES 128

XIV
LIST OF FIGURES
~~ P~
3.1. Sample Recording in the Audio Annotation Software 47
4.1. Frequency of Rehearsal Activity per Minute 60
4.2. Activity Frequencies by Teacher with Standard Deviation 62
4.3. Stage Time for each Activity 64
4.4. Activity Frequency per Minute by Stage 66
4.5. Stage Time for each Kind ofTeacher Feedback........................................... 69
4.6. Time at each Cognitive Level 71
4.7. Cognitive Percentages by Stage 73
4.8. Speaking Rates for Rehearsal Activity and Stage 78
4.9. Speaking Rates for each Cognitive Level 80
4.10. lq, 3vas, and 3vds Rehearsal Time Spent by Cognitive LeveL................. 82
4.11. 1m Cognitive Component........................................................................... 84
4.12. 1m Frequency by Cognitive Level and Stage 85
4.13. Stage 1 Rehearsal Time for each Cognitive Level and Activity................. 86
4.14. Stage 2 Rehearsal Time for each Cognitive Level and Activity................. 87
4.15. Stage 3 Rehearsal Time for each Cognitive Level and Activity................. 88
4.16. lq Activity by Cognitive Level and Stage.................................................. 89
4.17. 1m Activity by Cognitive Level and Stage 90
4.18. Kind of Knowing (row) as a Percentage of Stage Time 92
4.19. Way of Knowing (column) as a Percentage of Stage Time........................ 93

xv
LIST OF TABLES
Table Page
1.1. Revised Taxonomy of the Cognitive Domain 2
1.2. Definition of Terms Used in the Study........................................................ 6
2.1. Symbols Used in Rehearsal Analysis 13
2.2. Revised Taxonomy ofthe Cognitive Domain 23
2.3. A more Detailed View of the Cognitive Process Dimension 24
2.4. A more Detailed View of the Knowledge Dimension 25
2.5. Revised Taxonomy of the Cognitive Domain Showing Column, Row........ 26
2.6. The New Bloom's Taxonomy Applied to Selected National Standards....... 28
3.1. The Yarbrough and Price Coding System with Modifications 39
3.2. Activity Coding with Sample Text 40
3.3. Revised Taxonomy of the Cognitive Domain Showing Column, Row........ 41
3.4. The New Bloom's Taxonomy Applied to Selected National Standards....... 42
3.5. Application of Bloom's Taxonomy to Music Education.............................. 43
3.6. Cognitive Coding with Sample Text............................................................. 45
3.7. Sample Spreadsheet Data.............................................................................. 48
3.8. Revised Taxonomy ofthe Cognitive Domain Showing Codes 49
3.9. Sample ofReliability Data Table.................................................................. 52
3.10. Sample Data Coded for Analysis................................................................ 53
4.1. Amount of Audio Recorded by Teacher and Stage 56
4.2. Summary Data for each Activity with Subtotals 58
4.3. Activities in Increasing Order of Percent Time, Count, and Frequency...... 59
4.4. Descriptive Statistics for the Activity Durations 61
4.5. Percent Time Spent in each Activity by Teacher 63
4.6. Activity Mean Durations by Stage 65
4.7. Frequencies and Percentage of Stage Time for Task Presentation 67
4.8. Event Counts and Percentage of Stage Time for Teacher Feedback 68
4.9. Revised Taxonomy of the Cognitive Domain showing Coding 70
4.1 O. Time at each Cognitive Level by Teacher 72
4.11. Rowand Column Sums of Cognitive Percentages 74
4.12. Time Spent at Low/High Levels by Teacher 74

xvi
Table Page
4.13. High/Low Cognitive Level as Percentage of Stage 75
4.14. Teacher Words for each Activity............................................................... 77
4.15. Words for each Cognitive Level by Count, Frequency, and Percent 79
4.16. Coding Count Composition Matrix for each Cognitive Level andTeacher Activity........................................................................................... 81
4.17. Cognitive Level by Cognitive Activity Percentages 83
4.18. Percentage of Rehearsal by Kind and Way ofThinking 91
4.19. Revised Taxonomy with Words/Minute 94
4.20. Words/Minute by Cognitive Level (10) 95
4.21. Words/Minute by Cognitive Level (4) 95

CHAPTER I
INTRODUCTION
There are data indicating that students are not engaged in higher order thinking in
rehearsal (Watkins, 1994). These data also suggest that music teachers spend little time
teaching concepts in rehearsal. To better understand these issues, this study examined the
rehearsal language of experienced successful choral directors at the beginning, middle,
and end points of song preparation.
Choral directors use spoken language as an essential teaching tool. Directors have
a variety of modes of communication but still use the spoken word as one of the primary
ways to interact and direct students in the rehearsal setting. Among other things, choral
directors use spoken language in rehearsal to instruct. These phrases of instructional
syntax are purposeful and reflect instructional objectives.
The teacher's style is composed of rehearsal tasks and the levels of thinking
exercised in these tasks. This style, when viewed graphically, begins to look like a
terrain. The topography of the terrain is the data about teacher tasks and thinking. The
classification work in this study allowed us to better understand the cognitive topography
traveled by successful music educators in the choral rehearsal setting.
2
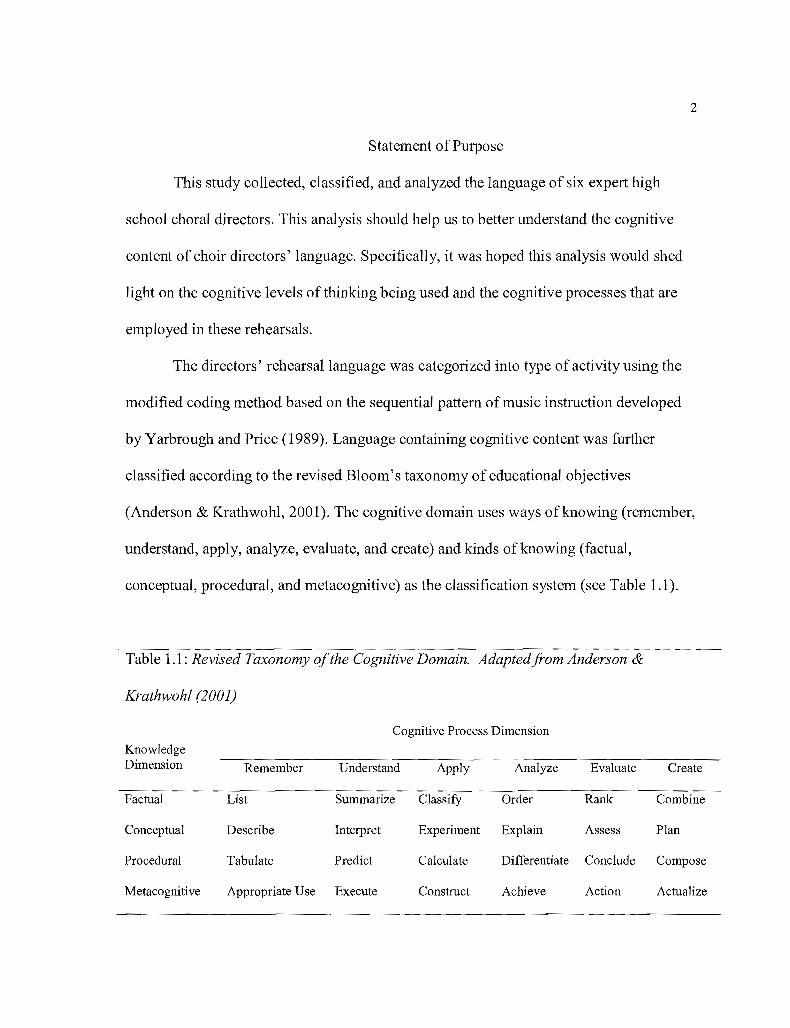
Statement of Purpose
This study collected, classified, and analyzed the language of six expert high
school choral directors. This analysis should help us to better understand the cognitive
content of choir directors' language. Specifically, it was hoped this analysis would shed
light on the cognitive levels ofthinking being used and the cognitive processes that are
employed in these rehearsals.
The directors' rehearsal language was categorized into type of activity using the
modified coding method based on the sequential pattem of music instruction developed
by Yarbrough and Price (1989). Language containing cognitive content was further
classified according to the revised Bloom's taxonomy of educational objectives
(Anderson & Krathwohl, 2001). The cognitive domain uses ways of knowing (remember,
understand, apply, analyze, evaluate, and create) and kinds of knowing (factual,
conceptual, procedural, and metacognitive) as the classification system (see Table 1.1).
Table 1.1: Revised Taxonomy ofthe Cognitive Domain. Adaptedfrom Anderson &
Krathwohl (2001)
Cognitive Process Dimension
KnowledgeDimension Remember Understand Apply Analyze Evaluate Create
Factual List Summarize ClassifY Order Rank Combine
Conceptual Describe Interpret Experiment Explain Assess Plan
Procedural Tabulate Predict Calculate Differentiate Conclude Compose
Metacognitive Appropriate Use Execute Construct Achieve Action Actualize
3
The revised Bloom's taxonomy presents the concept of lower and higher levels or
orders of knowing or thinking. This is reflected in both dimensions of the table:
Cognitive process or way of knowing/thinking, and knowledge dimension or kind of
knowing/thinking. Going toward the lower-right corner of the Table 1.1 requires higher
levels of thinking or deeper kinds of knowing. The taxonomy suggests that learners must
first begin in the upper-lett corner and then work their way toward the right and down.
The lower-right comer requires the highest level of knowledge and thinking process.
Justification for the Study
It should be a priority for us to improve the quality of music education
(Lindeman, 1998). The analysis of choral conductor instructional language in this study
might contribute to the framework of tools used for teacher assessment (Gumm, 1993)
and a better understanding of the rehearsal process. This could reveal key descriptive
factors of an instructional style consistent with excellent teaching. The identification of a
teacher's style must rely, partly, upon the teacher's choice oflanguage. This kind of
study might provide detailed qualitative and quantitative infonnation about teaching
styles and lead to measures for teacher assessment.
This study yielded frequency and percentage distributions for the classified
language according to rehearsal activity and cognitive level. It examined how the
directors' statements are distributed within the cognitive domain using the revised
Bloom's taxonomy (Anderson & Krathwoh1, 2001). Specifically, does director language
4
have more statements classified in the higher cognitive processes of analyze, evaluate,
and create or in the lower processes of remember, understand and apply (Anderson &
Krathwohl, 200 I)? This includes the question of what kinds of knowing are most utilized:
Factual, conceptual, procedural, or metacognitive. A related question is does the
director's language change while rehearsing a song from introduction to performance?
This could lead to the creation of the concept of a cognitive signature or profile for each
director. The cognitive signature is a map representing the topography of how the
director's language explores the cognitive domain during certain teacher activities.
Research Questions
The specific research questions examined in this study are:
1. Can director language be effectively coded and classified into the cognitive
domain taxonomy?
2. What are the general characteristics of the rehearsal language of expert high
school choral directors in terms of rehearsal activity and cognitive content?
3. Does the director's use of rehearsal time and cognitive language content change
during the stages of song preparation?
4. Do directors challenge students to think within the higher cognitive levels of
analyze, evaluate, and create?

5
Scope and Delimitations of the Study
The study data were collected from rehearsals of expert high school directors in
Oregon. The participants included six directors who had takcn their choir to the OSAA
state choral championships at least three ofthe five years prior to the study. The choirs
were mixed soprano, alto, tenor, and bass ensembles. Rehearsals were recorded during
the beginning, middle, and end ofsong preparation.
Data collection was done in fall 2006 between the beginning of the school year
and each choir's first concert. It was hoped that this time frame would help to find all the
directors and choirs in the similar learning context of a new school year, new music,
preparing for the fall concert, and no festival preparation.
The only criterion for selecting a choir for the study was that it had participated in
the OSAA state choir championships at least three of the previous five years. I hoped that
the rehearsals of this choir would reveal the director's teaching style in terms of
instructional language. Demographic data regarding the students within the choral groups
was not considered. Specific details of the choirs' or students' rehearsal activity such as
correctness of responses to teacher questions or quality of choral sound were not factors
addressed in the study.
Definitions
Table 1.2 defines terms and concepts relevant to the study.

6
Table 1.2: Definition o.fTerms Used in the Study
Tenn
Activity
Sequence or
Sequence
Code
Cognitive
Level
Cognitive
Code
Definition
A specific rehearsal event such as teacher task presentation, student
perfonnance, or teacher feedback and identified using a sequence code (See
Table 3.2).
Identifiers used to label rehearsal activity developed by Yarbrough and Price
(1989) as modified and used in the study. Examples include 1m (teacher
presenting musical task), lq (teacher asking question), 2p (students performing),
and 3vas (teacher providing specific verbal approval). Table 3.2 lists the coding
system used in the study. Sometimes referred to as activity or activity code.
Kind and way of thinking or knowing as defined by the revised Bloom's
taxonomy (Anderson & Krathwohl, 2001). Ways of knowing are remember,
understand, apply, analyze, evaluate, and create. Kinds of knowing are factual,
conceptual, procedural, and metacognitive. Detailed definitions are given in
chapters 2 and 3.
Identifier used to name a level ofthinking by column (1 - 6) and row (a - d) in
the revised Bloom's taxonomy as presented in Table 3.4. Examples include tla
(recall a fact), tlb (recall a concept), t3c (apply a skill), t4a (analyze a fact), and
t4c (analyze a procedure or skill).

7
Table 1.2: Definition a/Terms Used in the Study (continued)
Cognitive
Domain
Concept
Director,
conductor,
or teacher
Fact
Knowing
Recording
Rehearsal
Stage
Thinking
Thinking and knowing as described in the revised Bloom's taxonomy and
formalized in A Taxonomy for Learning, Teaching, and Assessing, (Anderson &
Krathwohl,2001).
Thinking or knowing that involves the relationship of several facts reflecting a
model, idea, categorization, or organization (Anderson & Krathwohl, 2001, p.
44). See Table 3.6 for examples.
High school choral educators, such as the six choral educators who participated
in the study.
The basic elements to be known to be acquainted with a discipline (Anderson &
Krathwohl, 2001, p. 45).
Cognitive activities of the teachers and students.
Digital audio collected from a high school choir rehearsal or portion of a
rehearsal used for the study.
Normal high school choir instructional time.
Refers to three rehearsal time slices of song preparation for the fall concert:
when the song is new to the choir, midway to concert preparation, and just
before the concert.
Used synonymously for the ways and kinds of knowing defined in the revised
taxonomy.

8
CHAPTER II
REVIEW OF RELATED LITERATURE
Many studies of rehearsals have described the director and focused on the use of
time, nonverbal teacher activity, and use of language. Among other ways, uses of time
have been characterized in terms of rehearsal organization, teacher intensity, and pace.
Nonverbal teacher activity included conducting, facial expression, and eye contact. The
use of language has been analyzed regarding sequential patterns, frequency of talk, type
of teacher talk, and type of reinforcement. Teacher language has been classified in the
cognitive domain according to higher level, lower level thinking, and concept
presentation. Studies overlapped making it challenging to classify a study into one
category. Specifically, studies about director language provided valuable background for
this research project.
Several researchers in music education have laid a solid foundation for the
procedures and method of activity categorization used in the present study. Activities and
time were studied by Madsen and Madsen (1998). Moore (1976) developed and used the
Music Teaching Reinforcement-Activities Form (MTRA). The MTRA allowed the
observer to quantify teacher and student activities in a continuous manner over time
(Wagner & StruI, 1979). Duke, Prickett, and Jellison (1998) presented methods to record

9
teacher and student language. Yarbrough and Madsen (1998) categOlized teacher
reinforcement. Yarbrough and Price (1989) developed a concise system for coding
rehearsal activity.
Language is the primary teaching tool for the choral director. Directors use visual
and audio aids, and nonverbal conducting techniques but, ultimately, choral directors use
their words to teach. Studies in this area have examined the frequency, duration, and type
of teacher talk. Music director language has been studied in the context of pace, use of
time, teacher intensity, style, and rehearsal organization. The director's language has
been classified regarding feedback, in the context of sequential patterns, into high/low
cognitive domain levels, and by general type oflanguage using Bloom's taxonomy.
Studies have also compared the characteristics of experienced teachers with novice and
student teachers.
Describing the Director
Many studies target the characteristics of the director. The director's use of
language is a defining characteristic and has been measured by type and quantity. Studies
have focused on the director's language as it related to use oftime, use of sequential
patterns, kind of reinforcement, type of talk, and nonverbal factors. Studies have also
explored factors that correlate with teacher skill and experience. The studies that have
helped to identify the presentation of concepts in teacher instructions, task presentation,
and feedback were particularly relevant for this study.

10
Sequential patterns have been shown to be an important teaching tool (e.g., Byo,
1994; Maclin, 1993; Yarbrough & Price, 1981, 1992; Yarbrough & Hendel, 1993;
Yarbrough & Price, 1989). The effect of sequential patterns on student's perception of
rehearsals was studied by Yarbrough and Hendel (1993), Yarbrough, Price and Hendel
(1994), and Price and Yarbrough (1994). In the 1993 study, high school and elementary
students rated a choral director's effectiveness. The choral director followed a script that
included 20 sequential patterns. A 20-minute videotape of the director and the script
provided the evaluation material. Student evaluators ranked patterns higher when the
sequence ended in an approval. Students preferred sequences that began with musical
infonnation rather than directions.
Yarbrough and Madsen (1998) examined choral rehearsals of two contrasting
pieces during a semester to ascertain the relationship between teaching skills and
rehearsal ratings. They used seven videotaped university choral ensemble excerpts that
focused on the director. Data were collected regarding sequential patterns and musical
concepts covered in director task presentations. Complete sequential patterns were
defined as task presentation, student response, and director feedback. InfOlmation was
collected about the director's eye contact, facial expression, body movement, inflection
of speaking voice, and conducting gesture. Student off-task behavior was measured. The
director self assessed her videotaped rehearsals and excerpts were rated by college music
majors. Comparisons of the highest and lowest rated excerpts showed that the highest
rated excerpt contained less student off-task behavior, more teacher approvals, more eye

11
contact, and more frequent activity changes, with a mean length of activity between five
and six seconds.
Davis (1998) identified director behaviors and the connection between
preparation and achievement. Rehearsal activities of advanced and beginning choirs were
categorized and analyzed, in general, by achievement, verbal instruction, student
performance, teacher conducting, instruction rate, teacher feedback, and positive teaching
sequences. The study videotaped 83 rehearsals, four final performances and used
beginning and advanced groups from two different high schools. Directors in this study
demonstrated a decrease in verbal instruction as their choirs progressed (also in Witt,
1986). Director feedback included more negative than positive feedback. Davis noted that
the results of this study were limited because only two directors were studied.
"Two of the foremost goals of research in music education are to (1) identify and
define observable behaviors of music teaching and learning, and (2) determine the
function of those behaviors in producing excellence in music performance" (Yarbrough
& Madsen, 1998, p. 469). The authors point out that most of the research in music
education from the previous 25 years has focused on the first goal.
Modeling is an important teaching tool (Grimland, 2001). Gonzo (1977) identified
three modes of teaching: explanation (cognitive), demonstration (modeling), and
descriptive language (imagery, analogy, or metaphor). Grimland pointed out that
directors would use extensive sessions of modeling without explanation or verbal
feedback. A director would ask students to listen and repeat while paying close attention

12
as they modeled vowel formation, diction, accent, or rhythm. In that context the director
used no verbal feedback as the modeling continues.
Type of teacher language is related to rehearsal activity context. Identifying the
kinds of rehearsal activity is crucial to categorizing teacher language. Yarbrough and
Price (1981) identified three kinds of activities: presentation, student response, and
teacher feedback. They established a concise system of coding or labeling for each of
these activities. Teacher presentation activity was labeled (1), student response was
labeled (2), and teacher feedback was labeled (3). Teacher presentation activities
included (1m) musical task presentation, (1d) directions about who should sing or where
to begin singing, (1 c) counting to get the group singing, (1 q) questioning, (1 s) social task
presentation, and (10) off-task statements. Student responses were labeled (2p)
performance, (2v) verbal, and (2nv) nonverbal. Teacher feedback was labeled (3va)
verbal approval and (3vd) verbal disapproval. Table 2.1 summarizes this coding system.
The studies in this section, that described the director, indicated that director
language might be a factor in student on-task behavior. Students had a better rehearsal
experience when directors used complete sequential patterns and gave positive feedback.
Music directors appeared to spend little time teaching concepts. These studies have
provided a framework for the classification of teacher rehearsal language.
Comparisons Based on Director Experience
The experience level of a director has provided a dimension worthy of study. The
studies presented in this section compare directors of differing experience levels. These

13
data include kind of talk, pace, timing, talk content, content level based on Bloom's
taxonomy, and use of time.
Table 2.1: Symbols Used in Rehearsal Analysis (Yarbrough & Price, 1989)
(1) Teacher Presentations
1m Academic musical task presentation (talking about musical or performance
aspects, including modeling by teacher or piano)
ld Direction (giving directions regarding who will, or where to sing/play; not how)
lc Counting (counting beats, usually ending in "ready go" and a downbeat)
lq Questioning (asking students questions about, musical, social, or directional
tasks; providing no infOlmation and requiring a response)
1s Social task presentation (presenting rules ofbehavior)
10 Off-task statement (statements not related to social behavior or academic tasks)
(2) Student Responses
2p Performance (entire ensemble, sections or individual perfOlming)
2v Verbal (ensemble members asking or answering a question, or making a
statement)
2nv Nonverbal (ensemble members nodding heads, raising hands, or moving in
response to teacher instruction)
(3) Teacher Feedback
3va Verbal academic or social approval (positive statement about student
performance or social behavior)
3vd Verbal academic or social disapproval (negative statement about student
performance or social behavior)

14
Goolsby (1996) investigated the use of time in rehearsals by experienced, novice,
and student teachers. He examined 60 high school band rehearsals and divided the time
use into initial activities, teacher activities, performance activities, and final activities.
Initial activities consisted ofpreparation, initial teacher talk, and total ensemble warm-up.
Teacher activities included verbal instruction, nonverbal instruction, verbal discipline,
and the number oftimes the teacher stopped. Performance activities were full ensemble,
group/sectional, individual, breathinglhumminglclapping/singinglcounting exercises, the
number of rehearsal segments, break after warm-up, first selection, second break, second
selection, third break, third selection, fourth break, and fourth selection. The final
activities were final teacher talk and dismissal time. The study did not find a significant
difference between music instruction/performance and nonteaching activities for the
student teachers and experienced teachers. A significant difference was found for
performance time of experienced versus student and novice teachers. GoolsbY found that
experienced teachers spent less time getting started, using verbal discipline, and verbal
disapproval. The shorter start-up time allowed the experienced teachers to spend more
time in warm-up. Experienced teachers spent significantly more time in perfonnance and
in using nonverbal modeling. The experienced teachers also allowed longer breaks,
longer performance segments, and their teaching segments were shorter.
In the choral setting, Pence (1999) categorized director rehearsal language into
talk, model, directive, off-task, explain, question, feedback, response to inappropriate
behavior, and student talk. The Pence study, modeled on Goolsby (1996), used 19 choral
directors representing three experience levels: expert, novice, and student teacher. Each

15
director was videotaped with the camera focused on the director. The study analyzed the
warm-up and the first rehearsal piece. This resulted in 17 to 30 minutes of tape for each
rehearsal. The data revealed that the total percentage of teacher talk was about the same
across teacher experience levels (Mean = 40%) with a mean percentage of 43.4 %
(expert), 37.5% (novice), and 43.3% (student teacher). Novice teachers had the most
student talking. Student teachers modeled less but had about the same rate of giving
directives (about 2.5 per minute).
Pace and timing in the music classroom have been shown to be as important as
content (Madsen & Madsen, 1998). Director language is a component of pace and timing.
Duke, Prickett, and Jellison (1998) had novice teachers categorize taped rehearsal
excerpts by pace into the six semantic differentiations of fast/slow,
appropriate/inappropriate, tense/relaxed, smooth/uneven, too fast/too slow, and good/bad.
The study used short, one- to three-minute videotaped rehearsal excerpts from four
novice teachers during choral and band rehearsals, and elementary music classes. Video
recordings of two differently paced excerpts of good teaching, as determined by the
researchers, by the same novice teacher were evaluated by other novice teachers using a
5-point scale for each of the six semantic differentiations.
Observers in the Duke, Prickett, and Jellison study rated excerpts higher that had
higher rates (shorter durations) of teacher activity and student performance episodes. The
evaluators consistently rated the faster paced excerpt, of each pair, as the better of the
two. Timing analysis of the teaching excerpts looked at relative duration and frequency of
teacher talk, teacher demonstration, full group student activity, and individual student

16
activity. This analysis revealed that there was more teacher activity in the faster paced,
higher frequency, excerpts with shorter mean episode durations. The faster paced
episodes also had more, and consequently, shorter opportunities for student performance.
The faster paced excerpts had higher rates of teacher directive and feedback and lower
rates ofteacher information giving and questioning. This study noted that good teaching
was characterized by using a variety of pacing. One should also remember that the study
focused on perceived pace, as opposed to actual measured behaviors, as it related to
quality of teaching.
Goolsby (1997) considered many performance and rehearsal variables in
comparing the language content of instrumental directors at the expert, novice, and
student level. The descriptive variables related to performance and rehearsal. The 15
performance variables used were posture, rhythm/tempo, notes, airstream, tone quality,
dynamics, balance/blend, articulations, style, expression/phrasing, energy, tuning,
intonation, guided listening, and unguided listening. The 10 rehearsal variables were
teacher demonstrations, explanations, unspecific posture feedback, specific posture
feedback, "again," "watch," "one more time," no instruction, focused questions, and
vague questions. He also looked for sequential patterns. Goolsby found that expert
directors stopped more often than novice directors and addressed several performance
variables at each stop. Compared with novice directors, the expert directors asked fewer
questions, focused on rhythm/tempo, addressed tone quality, intonation, expression, used
adverbs to encourage the band to playa certain way, and used more nonverbal
explanations and demonstrations. Novice directors asked more vague questions and often

17
stopped and started without any verbal instructions. The expert directors completed more
than 20% of their sequential patterns while the novice and student directors completed
less than 14%.
Watkins (1994) analyzed performance and nonperformance time in rehearsal.
This study built upon her previous work (Kvet & Watkins, 1993) as well as that of
Caldwell (1980) and Thurman (1977). She not only looked at basic time data but also
examined the goals of the nonperformance activities: exposition, modeling, questioning,
seeking to develop higher-order thinking (analysis, synthesis, evaluation), and
nonspecific, or critical thinking. She also sought to examine the correlation between years
of teaching experience and the amount of nonperformance time spent seeking to develop
the students' higher-order thinking skills. Watkins employed Bloom's original (1956)
taxonomy to classify director language regarding the higher-level, critical-thinking areas
of analysis, synthesis, and evaluation. The study looked at IS-minute videotaped
rehearsal excerpts of 32 advanced high school choirs. Rehearsal taping began when the
first song was rehearsed. Taped material was classified as performance or
nonperformance. Nonperformance material was then classified into activity directed
toward lower thinking, activity directed toward higher-order thinking, and nonspecific or
silence.
Results ofthe Watkins study showed that 38.6% of the rehearsal was
nonperformance, with 34.3% of activity directed toward lower level thinking, 1.3% to
higher-order thinking activity, and 3.0% nonspecific verbal activity. The study showed no
significant correlation between nonperformance activity and higher-order thinking
18
verbalizations or between years of teaching experience and higher-order thinking
directives.
A recent dissertation by Arthur (2002) used videotape analysis to compare the use
oftime in beginning and advanced choirs by experienced choral directors. She
videotaped five directors rehearsing a beginning and advanced choir each, for 10
rehearsals. The tapes were transcribed and behaviors were classified. She used as models
Moore, 1976; Yarbrough & Price, 1989; and Duke, Prickett, & Jellison, 1998 (Arthur, p.
48). Director activity was coded, timed, and converted to duration, frequency, and
percentage. She found that directors used a variety of pacing, mixed easy and hard music,
and all used three or more rehearsal segments in each rehearsal. Teacher instmction mean
durations were about 16 seconds and student performance segment means were between
26 and 31 seconds. Advanced choirs showed a higher rate of activity change.
Blocher, Greenwood, and Shellahamer (1997) investigated to see how much time
music teachers devoted to teaching concepts. This study categorized middle school and
high school band directors' teaching behaviors as nonmusical, nonverbal or verbal
instmction, noninteractive listening, nonverbal or verbal feedback, or conceptual
tcaching. Directors in this study used nonverbal instmction or direction about 27% of the
time. High school directors used nonverbal instmction or direction almost four times as
much as middle school directors. Twenty-two percent of the rehearsals were
noninteractive listening. Middle school directors used noninteractivc listening three times
more than high school directors. Very little feedback was given by the directors. Possibly
most importantly, time spent in teaching concepts was less than 3%.
19
Conceptual teaching behavior was defined as introducing a concept, reinforcing a
concept, asking questions about a concept, or answering questions about a concept. Thcy
stressed three aspects of conceptual teaching. First, it gives students "opportunities for
awareness and understanding with a potential for transfer" (Blocher, Greenwood, &
Shellahamer, 1997, p. 462). Second, conceptual teaching helps students to formulate
"relationships, new ideas, or expansion of categories." Lastly, the "conductor answers
questions in such a way that the answers relate to a broader array of instances than the
one at hand" (p. 462).
These studies found that experienced directors had many distinguishing
characteristics. They modeled more, had more student on-task behavior, spent less time
getting started, used a variety ofpace, tended to have high rates (short durations) of
teacher/student activity, and used more complete sequential patterns. However, it
appeared that most directors, regardless oflevel of experience, did not challenge students
with higher-order thinking typified by analysis, evaluation, or synthesis. These studies
identified key characteristics of expert choral directors and provided an important basis of
comparison for the present study.
Cognitive Studies
Several studies have examined the level of cognitive thinking to which the teacher
directs the class. Watkins (1994) showed that there was little higher-order thinking
evidenced in the rehearsals studied. Other studies (e.g., Good1ad, 1984; Blocher,

20
Greenwood, & Shellahamer, 1997) also indicate that little conceptual teaching occurred
in rehearsals.
Goodlad (1984) observed more than 27,000 students and the teachers of more
than 1000 elementary and secondary school classrooms to find that less than onc percent
of instructional time was dcvoted to soliciting a reasoned response from students. Most
instruction, at best, required the students to remember mere facts and none, or very little,
of the instruction asked students to understand the implications of the facts. The bulk of
student activity was "listening to teachers, writing answers to questions, and taking tests
and quizzes" (p. 124). Goodlad believes that the arts are one of the "five givers" of
human knowledge, along with mathematics and science, literature and language, society
and social studies, and vocations. The arts are not optional to the curriculum.
Watkins (1994) analyzed performance and nonperformance time use in rehearsal.
Part ofthe study sought to examine the cOlTelation between years of teaching experience
and the amount of nonperformancc time spent seeking to develop the students' higher
order thinking skills. Bloom's (1956) taxonomy was used to classify the director
language regarding the higher-level, critical-thinking areas of analysis, synthesis, and
evaluation. She found that 34.3% of nonperformance activity was directed toward lower
level thinking, 1.3% in higher-order thinking activity, and 3.0% toward nonspecific
verbal activity. It was of interest that 21 of the 32 subject directors did not use any
higher-order thinking verbalizations.
Conceptual teaching would logically seem to be an important, but apparently a
little used or investigated, part ofmusical task presentation. Conceptual teaching could

21
challenge students at many cognitive levels-ways and kinds of knowing. The revised
Bloom's taxonomy (Anderson & Krathwohl, 2001) classified language into different
ways of knowing and kinds of knowing that appear applicable to the music teacher
setting.
The Revised Bloom's Taxonomy
The idea that knowledge or thinking could be organized from simple to complex
was the thesis of the original Bloom taxonomy (Bloom et al., 1956). This organization of
thinking was explored in the context of assessment relating to the formulation of
educational objectives and test questions. The creators of the taxonomy explored the
cognitive domain of educational objectives to arrange kinds of knowing into an order of
increasing complexity. This order used the six headings of knowledge, comprehension,
application, analysis, synthesis, and evaluation.
The main purpose of the original Bloom's taxonomy was to facilitate the
exchange of examination questions by test preparers. It was never meant to be a static
document, but a work in progress. Bloom hoped that educators would translate the
taxonomy into terms relevant to their own subject areas (Anderson & Krathwohl, 2001, p.
xxvii). The revised taxonomy (Anderson & Krathwohl, 2001), in the spirit ofthe original
authors, reorganized, modified, and expanded the taxonomy to fit better with current
thought about learning, teaching and assessment; however, it has a major change in
emphasis. While the original was designed to facilitate test construction and assessment,
the revised taxonomy "emphasizes the use of the taxonomy in [the alignment ofthe three

22
areas of! planning cUlTiculum, instmction, and assessment" (p. 305). The revisers wanted
the taxonomy to be used by teachers. This present study fits well with the emphasis of the
revised taxonomy.
This research project is concordant with the desire ofthe authors for others to
adapt and expand the revised taxonomy and it was hoped that this study would add
another stage to the taxonomy's journey. The standard approach is to use the taxonomy in
the writing of curriculum, instmctional objectives, and assessments. The present study
attempted to classify rehearsal language of experienced choral teachers into the revised
taxonomy.
The revised taxonomy (Anderson & Krathwohl, 2001) is encapsulated in Table
2.2. The left column lists the knowledge dimension of the taxonomy. The knowledge
dimension categorizes kinds of knowing into factual, conceptual, procedural, and
metacognitive. The top row lists the cognitive process dimension or ways of knowing.
These are remember, understand, apply, analyze, evaluate, and create. The cells within
the table give one-word verbs that fit cognitive processes and kinds of knowledge found
at each row and column intersection of the table.
Anderson & Krathwohl (2001) provide many examples ofusing the taxonomy.
An instance of this is in the first cell that contains the word "List." When the teacher asks
the students to recall a list the student is being asked to remember (cognitive process or
way of thinking) facts (type ofknowledge or kind of thinking). Another example would
be to ask a student to make a conclusion (evaluate) about a procedure (procedural
knowledge).

23
Table 2.2: Revised Taxonomy o/the Cognitive Domain. Adaptedfrom Anderson &
Krathwohl (2001)
Cognitive Process DimensionKnowledgeDimension Remember Understand Apply Analyze Evaluate Create
Factual List Summarize Classify Order Rank Combine
Conceptual Describe Intelpret Experiment Explain Assess Plan
Procedural Tabulate Predict Calculate Ditlerentiate Conclude Compose
MetaCognitive Appropriate Execute Constmct Achieve Action ActualizeUse
The taxonomy contains types of knowledge. Factual knowledge involves details
or data. Conceptual knowledge is about ideas or models. Procedural knowledge is about
how things are done. Metacognitive knowledge, or self-knowing, relates to thinking
about what one knows.
Metacognitive is perhaps the least familiar label in the revised taxonomy. It
relates to what we think about what we know. An example of this could be found in the
question: "How well do you know Bach?" Instead of asking us to recall a specific fact
such as the date of Bach's birth, we are being asked to think about what we know about
Bach. Another example is when we think about the best way to study for a particular test.
We are not thinking about a specific test question; instead we are thinking about how we
best learn certain content. Asking the singers about how well they know a piece requires

24
metacognitive thinking. Asking the choir what is the best way to solve a tuning problem
at a particular measure and beat may be metacognitive.
The cognitive process dimension ofthe revised taxonomy is remember,
understand, apply, analyze, evaluate, and create. It is useful for our understanding of this
dimension to examine word groupings for each cognitive level. An example such as
instructing students to generate, plan, or produce something would fit within the creative
process. This process level could also he viewed as hypothesizing, designing, or
constructing (see the last row of Table 2.3). These cognitive processes could also bc
called hypothesizing, designing, or constructing. Table 2.3 provides more detailed
descriptions of the cognitive process dimension. The table lists subcategories for each
process along with alternatives names.
Table 2.3: A more Detailed View ofthe Cognitive Process DimensionFom Table 5.1 ofthe Revised
Taxonomy ofthe Cognitive Domain. Anderson and Krathwohl (2001)
Category Cognitive Process Alternative Names
Remember Recognizing IdentifyingRecalling Retrieving
Understand Interpreting Clarifying, paraphrasing, representing, translatingExemplifying Illustrating, instantiatingClassifying Categorizing, subsumingSummarizing Abstracting, generalizingInferring Concluding, extrapolating, interpolating, predictingComparing Contrasting, mapping, matchingExplaining Constructing models
Apply Executing Carrying outImplementing Using
Analyze Differentiating Discriminating, distinguishing, focusing, selectingOrganizing Finding, coherence, integrating, outlining, parsing, structuringAttributing Deconstructing
Evaluate Checking Coordinating, detecting, monitoring, testingCritiquing Judging
Create Generating HypothesizingPlanning DesigningProducing Constructing

25
Similar to Table 2.3, Table 2.4 lists the subcategories for the knowledge
dimension. Each type of knowledge is divided into more specific kinds of knowing.
Factual thinking includes terminology, details, and elements. Conceptual is composed of
classifications, categories, principles, generalizations, theories, models, and structures.
Procedural encompasses skills, techniques, and methods. Metacogntive is thinking about
strategy, thinking about thinking, and self-knowledge.
Table 2.4: A more Detailed view ofthe Knowledge Dimensionfrom Table 4.1 ofthe
Revised Taxonomy ofthe Cognitive Domain. Anderson & Krathwohl (2001)
MajorKnowledgeType SubtypesA. Factual Knowledge of terminology
Knowledge of specific details and elements
B. Conceptual Knowledge of classifications and categoriesKnowledge ofprinciples and generalizationsKnowledge oftheories, models, and structures
C. Procedural Knowledge of subject-specific skills and algorithmsKnowledge of subject-specific techniques and methodsKnowledge of criteria for determining when to use appropriateprocedures
D. Meta- Strategic knowledgeCognitive Knowledge about cognitive tasks, including appropriate contextual and
conditional knowledgeSelf-knowledge
The concepts outlined in Tables 2.3 and 2.4 provided the framework for
classifying a teacher statement into the cognitive domain according to the revised

26
Bloom's taxonomy. Table 2.5 combines and condenses the details of Table 2.3 and Table
2.4 and provides a coordinate pair in the fonn ofthe intersection of the cognitive process
dimension and the knowledge dimension. A coordinate of(Ia) refers to factual
remembering. A coordinate of (3c) references the application of a procedure or skill and
so on.
Table 2.5: Revised Taxonomy o/the Cognitive Domain Showing Column and Row
Coordinates
Cognitive Process DimensionKnowledgeDimension
(a) Factual
(b) Conceptual
(c) Procedural
(d) Metacognitive
Remember1
(la)
(lb)
(I c)
(ld)
Understand2
(2a)
(2b)
(2c)
(2d)
Apply3
(3a)
(3b)
(3c)
(3d)
Analyze4
(4a)
(4b)
(4c)
(4d)
Evaluate5
(5a)
(5b)
(5c)
(5d)
Create6
(6a)
(6b)
(6c)
(6d)
Tables 2.1 and 2.5 fonn the core rubric that was used in this study to classify
teacher language. Teacher talk classified as 1m (musical task presentation in Table 2.1)
was then further categorized using Table 2.5. An example would be a teacher task
presentation (1m in Table 2.1) asking the students the dates for J. S. Bach. This is asking
the students to remember a fact and would receive the coordinate 1a using Table 2.5.
Another example is the teacher asking the altos to look at the other parts (soprano, tenor,
and bass) in the musical score to see if any ofthe other sections are singing the same note

27
as the altos within a certain measure or phrase. This teacher task presentation (1m) is
asking the students to analyze facts about the music which is 4a in Table 2.5.
Each cognitive level is built upon its supporting levels. The taxonomy table
contains six columns and four rows making 24 column and row intersections. Moving to
the right and down is a process built upon the cells to the left and above. Conceptual
knowledge is built upon factual knowledge. Facts cannot be understood until they are
recalled. A procedure cannot be applied unless it is remembered.
Wendell Hanna (2007) placed several of the MENC national standards into the
revised Bloom's taxonomy. Table 2.6 shows her analysis of how several of the national
standards fit into the taxonomy. Singing (national standard la) was matched with the
cognitive level of apply a skill. Playing by ear (national standard 2d) was matched with
thinking about apply or as a strategy for apply. Analyzing music (national standard 6a)
was placed in the cell for analyze a fact. Hanna notes that teacher modeling is analyzing a
skill. This article was extremely useful as a guideline for coding teacher statements.
Using Bloom's Taxonomy outside Music Education
A small number of studies have used Bloom's taxonomy outside of music
education. In an examination of elementary science texts Risner, Skeel, and Nicholson
(1992) found little to encourage student critical thinking. Risner, Nicholson, and Wehh
(2000) later classified the questions in an elementary level social studies textbook
according to the cognitive levels outlined in the taxonomy, and were pleased to find more
textbook materials challenging students to apply, synthesize, and analyze information.

28
Table 2.6: The New Bloom's Taxonomy Applied to Selected National Standards for Music
Education. Hanna (2007, p 11)
KnowledgeDimension
Factual
Conceptual
Procedural
MetaCognitive
RememberRecognize
Recall
UnderstandInterpret
ExemplifyClassify
SummarizeInfer
CompareExplain
8aUnderstandingrelationshipsbetween arts andother disciplines9aUnderstandingmusic in relationto history andculture
SaRead andnotatemusic
laSinging
2dPlaying byear
6aAnalyzingmusic6aAnalyzingmusic
6aAnalyzingmusic
EvaluateCheck
Critique
7aEvaluatingmusicperformances
--Create
GeneratePlan
Produce
3bImprovising4aComposing
Need for the Study
"Two of the foremost goals of research in music education are to (1) identify and
define observable behaviors of music teaching and learning, and (2) determine the
function ofthose behaviors in producing excellence in music performance" (Yarbrough
& Madsen, 1998, p. 469). Many teaching behaviors have been identified by research.

29
These include the use of sequential patterns (e.g., Yarbrough & Price, 1981), teacher
approval versus disapproval (e.g., Madsen & Duke, 1985; Yarbrough, Hendel, & Price,
1994), teacher magnitude (Yarbrough, 1975), nonverbal teaching behaviors, pace (e.g.,
Gundersen & Williams, 1998), duration of verbal instruction, and use of instructional
time (e.g., Madsen & Geringer, 1989; Goolsby, 1996 & 1997). These studies are a
response to the necd to better quantify teacher effectiveness and teacher skillfulness.
There is finite contact time for music in schools and music teachers must
maximize effective use of rehearsal time to achieve their instructional goals. It might be
found to be more efficient to frame instructional syntax within certain domains and
within specific parts of these domains.
Choral rehearsals are interactive. Music teachers in training may not always
discriminate the complexities of the teacher/ensemble interaction. There is a constant
interplay between the director's input and the student's output. The director's skillful use
of language is likely critical for the musical growth of the ensemble.
Madsen (1998) notes that effective teaching strategies do not happen by accident
but are the result of teacher behavior. Teaching skills are as important as musical skills
(Madsen, Standley, & Cassidy, 1989; Teachout, 1997).
Some may wonder about what kind of teaching choir directors do and what is the
curriculum for a choir? The first word of the first content standard of the MENC National
Standards for Music Education is "singing" (MENC, 1994) and most people understand
choir to be about singing. This means that music educators need to understand how
singing advances the education of the student and becomes a vital component of the

30
school curriculum. This study may help to clarify how students are being cognitively
challenged as they sing.
The teacher's language should reflect the teacher's objectives. The objectives
reflect the curriculum. What are the objectives as suggested by an examination of the
director's language? More specifically, what instructional domains are employed to
execute the curriculum? We can say with certainty that the choir is singing. But, we may
find ourselves less certain of the answer when we ask the question about how that relates
to the general cognitive development of students. It is hoped that this study has begun to
answer some ofthe important questions about how the cognitive instructional domains
are targeted, what kinds of knowing are accessed, and what kind of cognitive processes
are exercised in choral rehearsals.
Information from this study may help to define why choral music is an important
component of the school curriculum. It could be important for us to understand, for
example, the routine cognitive activities shared between choir and calculus. An
understanding ofthe ways and kinds of knowing employed could build a bridge between
choir and calculus in the understanding of educators, administrators, students, and
parents. Content may change but the relevant domains, ways ofknowing, and the types of
knowing used in the choral rehearsal may be the same as those used in other disciplines.
It is important for choral educators to be able to speak in specific, educational language
about the cognitive processes and types of cognition used in the rehearsal setting. Clear
verbiage can help to clarify the relevance of choral education to the school curriculum.
It is essential for us to be able to identify the cognitive process and kind of
knowing employed for instructional statements in choirs. For this reason I chose to
investigate choral director language. I hoped that the results of this study would help to
quantify and clarify our understanding of how the cognitive domain is explored in the
teaching ofchoir.
31

32
CHAPTER III
METHODOLOGY
An examination of the relevant literature revealed that choral directors spend little
time teaching concepts and say little that challenges students in the cognitive domain.
This study proposed to investigate these issues by audio recording six expert high school
choral directors, transcribing verbatim their instructional language, classifying the
transcribed statements into specific rehearsal activities, and analyzing certain activity
statements for cognitive domain level. The study's methodology included:
1. Pilot Study2. Participants3. Equipment4. Procedure
a. Recording the Rehearsalsb. Tracking the Audio Recordingsc. Dividing the Audio into Rehearsal Activitiesd. Transcribing Teacher Language and Activity Codinge. Data Coding for Cognitive Levelf. Audio Annotation and Codingg. Reliability
5. Plan for Analysisa. Data Import and Factor Codingb. Analyses

33
Pilot Study
A pilot rehearsal was done to test recorder placement, appropriateness of
individual recording storage format, and adequacy of audio quality. The pilot study tested
all the various brands of MP3 recorders that would be used in the formal study. During
the pilot study the recorders were tested while being suspended around the director's
neck by a short lanyard or placed on the director's music stand. Recorded audio was
transferred to my computer via USB port and converted using commercial audio editing
software.
One important goal of the pilot study was to test the quality of the recorded audio.
The software program Adobe™ Audition 1.0 (2003) was used to convert all MP3
recorder data to 16 bit, stereo, 8 kHz audio in wav file format. Results verified that the
audio quality of the teacher's voice would be of sufficient clarity for the purposes of data
collection and transcription. Loud speaking or piano playing was somewhat distorted at
times. Choral performance could be clearly heard at lower amplitude.
Participants
Participants for this study were six (N = 6) expert high school choral directors in
the state of Oregon and were chosen using criteria similar to previous studies (Pence,
1999) for identifying expert choral directors. The directors met the following criteria:
1. They have taught at the same public school for the last five years or more
2. They have taught six or more years
3. They have a masters degree

34
4. They taught a mixed SATB high school choir
5. The mixed choir had qualified and participated in the Oregon State Activities
Association (OSAA) state choir championships during Spring semester for three
or more of the last five years (2002-2006)
The ensembles used in this study were the same ensembles that participated in the
State Choir Championships under the OSAA 1A to 4A classification. In this
classification the smallest schools were 1A and the largest schools were 4A. It was found
that 65 high school choirs have participated at the State Championships during the years
2002 - 2006 in the larger, 3A and 4A, classification. Thirty-four of these choirs
performed three or more times during the last five years. Several of these 34 choirs did
not qualify for this study. Twenty were not considered for data collection because they
were either too far away (N = 7), a private school (N = 1) or there had been a change in
director (N = 12). This left a pool of 14 choirs from which nine were recruited for the
study in order to accommodate the possibility of attrition.
After obtaining human-subjects approval from the University of Oregon I
contacted prospective participants by email and phone. I traveled to the school of each
participant and asked them to read and sign an informed consent form and fill out a brief
biographical survey (see Appendix A). A school administrator at each subject school also
signed for human-subjects approval.

35
Equipment
Three different MP3 player/recorders were used. The Muvo® TX PM by Creative
Labs (Creative Labs, 2006), the Truly® Digital MP3 Player (Truly, 2006), and the
Mambo (Kaiser, 2006) BW MP3 Player. All three players had 512 kb of memory which
allowed for about 30 hours of recording per player. These particular players were chosen
because of relatively low price and availability. All of the players had USB computer
connection ports.
Procedure
Recording the Rehearsals
Each subject was issued an MP3 player/recorder, lanyard, batteries, and printed
instructions for using the recorder (see Appendix B). Using the built-in microphone of a
portable MP3 audio recorder allowed the directors to record themselves without
supervision. Subjects were instructed to record at least three rehearsals of each song
during the three target stages or weeks. This helped to insure that at least two good
recordings of each of the two songs were made during the three target stages. Several of
the subjects were on a block type schedule which required that the songs be recorded
over more than a one week time period to get the required number of recordings. Subjects
were requested to say the date at the beginning of the recording.
Communication with the subjects was by email and phone to remind them to
record and to check on recording progress. I visited each subject approximately five times
including the initial invitation to participate, the delivery and instruction in the use of the

36
recorder, and the periodic collection of data. Audio was collected by plugging the
recorder into the USB port ofmy laptop to transfer the audio files to the laptop's disk
drive. At each visit during the data collection phrase I replaced the recorder's AAA
battery.
Each director was recorded rehearsing two different songs in an effort to be
representative of his or her teaching. The recordings were analyzed from three stages in
the songs' concert preparation. The stages encompassed the song rehearsed as new to the
choir, midway to the concert, and the week before the concert. The midway point was
selected by finding the middle week between the date of the introduction of the song and
the date of the first performance of the song. This allowed an examination of each
director's instructional language at three stages of rehearsal within the same ensemble
and repertoire. Only the target songs' portions of the rehearsals were recorded, not the
entire rehearsal.
Two songs were recorded from each choir. The director was requested to rehearse
each song for at least 15 minutes during the recording. Two recordings of each song were
selected from the same week at three stages of rehearsal. This produced four recordings
for eaeh rehearsal stage. These recordings yielded approximately 6x15 minutes of
recording for each song for a total of approximately 90 minutes per song. This equated to
about an hour of recording for each rehearsal stage. The total recorded material for all
directors was approximately 18 hours; seventy-two rehearsal segments (12 for each
director) of 15 minutes each. Specifically: Six directors x 2 songs x 2 rehearsals x 3
stages x 15 minutes = 18 hours.

37
Tracking the Audio Recordings
The recorded audio was transferred to my computer via USB port and converted
to wav format. Each director was coded as A, B, C, D, E, or F. Recordings were
numbered in sequential order. Each recording was audited for quality, content, and
length. Some recordings contained rehearsal time for more than the target song. These
recordings were broken into separate segments using the audio editing software. The final
sets of recordings were labeled by teacher identifier and recording number; teacher A's
recordings were labeled aOI, a02, a03 ... all, a12; teacher B's recordings were labeled
bOI, b02, b03 ...bll, b12, etc.
Dividing the Audio into Rehearsal Activities
Each recording was analyzed to identify rehearsal activities or events. The
beginning of each rehearsal recording was time indexed as zero seconds. Marked events
that contained teacher language were time indexed just before the first audible word of
each statement. The coding software allowed very accurate timings for rehearsal events.
All time indexes were rounded to a hundredth of a second.
Choral director speaking, student talk, silences, pauses, and singing were
identified in the recordings. All director language during student performance was
ignored. Most nonverbal communication was not classified due to the fact that only audio
was recorded, not video. Some nonverbal student response was coded when it was clearly
in response to the teacher's instructions. Examples of this included asking the students to
raise their hands, stand, or move into a new riser formation.
38
Transcribing Teacher Language and Activity Coding
The director's recorded language was transcribed verbatim and coded using a
modification of the method described by Yarbrough and Price (1989). Table 3.1
summarizes the modified system. This classification system labels each activity with a
sequence number: 1, 2, or 3. Sequence number 1 is teacher presentation activity,
sequence number 2 is student response, and sequence number 3 is teacher feedback. Each
activity within a sequence is labeled with a modifier to identify the specific kind of
activity. This system is referred to as the sequence code or activity code.
Two codes were added: Ie and s. The 1e code represents "extra" kinds of teacher
activity including conversational exchanges like, "yes, John," "yes," and so on. The Is
code was used to indicate a silence of more than a few seconds. The audio recording did
not allow accurate identification of the activity occurring during the silence periods.
Possible activities during these periods could have included teacher moving from the
piano to the music stand, conducting, or waiting for something or someone. Table 3.2
shows sample text with activity codes.

39
Table 3.1: The Yarbrough and Price (1989) Coding System with Modifications Showing
the Sequence Number (1, 2, 3) and the Activity Mod~fiers
(1) Teacher Presentations----------------------------1m Academic musical task presentation (talking about musical or performance
aspects, including modeling by teacher or piano)1d Direction (giving directions regarding who will, or where to sing/play; not how)lc Counting (counting beats, usually ending in "ready go" and a downbeat)1q Questioning (asking students questions about, musical, social, or directional
tasks; providing no information and requiring a response)1s Social task presentation (presenting rules of behavior)10 Off-task statement (statements not related to social behavior or academic tasks)1e Exchange or extra talk such as a verbal exchange with a student
(2) Student Responses2p Performance (entire ensemble, sections or individual performing)2v Verbal (ensemble members asking or answering a question, or making a
statement)2nv Nonverbal (ensemble members nodding heads, raising hands, or moving in
response to teacher instruction)
(3) Teacher Feedback3vas Specific verbal academic or social approval. A positive statement about student
performance or social behavior that identifies the particular student activity.
3van Nonspecific verbal academic or social approval A positive statement aboutstudent performance or social behavior that does not identify the activity.
3vds Specific verbal academic or social disapproval. A negative statement aboutstudent performance or social behavior that identifies the particular studentactivity.
3vdn Nonspecific verbal academic or social disapproval. A negative statement aboutstudent performance or social behavior that does not identify the activity.
Others Silence is a period of no audible sound or activity

40
Table 3.2: Activity Coding with Sample Text
Code Text
Ic 1,2....
1d Page 7.
Ie Yes, Bill
1m It's a consonant.
10 I don't know. It's not on the calendar yet.
1q Cause E sharp is the same as what?
1s Shhh....hey, hey, hey....
3van Very good.
3vas Ah, that balance was good
3vdn Man, we're just killing ourselves today.
3vds Too loud tenors
Data Coding for Cognitive Level
Teacher statements with cognitive content (1m, lq, 3vas, and 3vds) were further
classified within the cognitive domain using the revised taxonomy as presented by
Anderson and Krathwohl (2001) and explained in chapter two. The taxonomy is
summarized in Table 3.3. Statements in the cognitive domain were coded according to
the cognitive process dimension and the knowledge dimension. A statement that asked
students to remember or recall a fact or detail was classified as "remember a fact" and
was coded as tl a. A statement that asked students to apply a procedure was classified as
"apply a procedure" and was coded t3c. The "t" prefix is added to avoid any ambiguity
with the sequence codes. Non cognitive events were coded as z.

41
Table 3.3: Revised Taxonomy ofthe Cognitive Domain Showing Column and Row
Coordinates
KnowledgeCognitive Process Dimension
Dimension Remember Understand Apply Analyze Evaluate Createtl t2 t3 t4 t5 t6
(a) Factual (tla) (t2a) (t3a) (t4a) (t5a) (t6a)
(b) Conceptual (tlb) (t2b) (t3b) (t4b) (t5b) (t6b)
(c) Procedural (tlc) (t2c) (t3c) (t4c) (t5c) (t6c)
(d) Metacognitive (tld) (t2d) (t3d) (t4d) (t5d) (t6d)
Teacher activities were coded for the highest order thinking possible. Some
activities contained several sentences of teacher language. These sentences were analyzed
to identify the highest level of thinking. An example could be a 1m event where the
teacher asked students to recall a procedure (tIc) and then to apply the procedure (t3c).
This event contained tIc and t3c content but was coded nc.
The Hanna (2007) article was used to guide the cognitive coding. Table 3.4
shows Hanna's placement of several MENC national standards into the new, revised
Bloom's taxonomy. Examples include: Singing (national standard 1a) is aligned with
apply a skill (t3c in Bloom's). Music analysis (national standard 6a) is analyze a fact
(Bloom's t4a).

42
Table 3.4: The New Bloom's Taxonomy Applied to Selected National Standards for Music
Education Hanna (2007, p 11)
Cognitive Process Dimension
1) 2) Understand 3) Apply 4) Analyze 5) Evaluate 6) CreateRemember Interpret Execute Differentiate Check GenerateRecognize Exemplify Implement Organize Critique Plan
Knowledge Recall Classify Attribute ProduceDimension Summarize
InferCompareExplain
a) 6aFactual
I
Analyzing
ImUSICb) Sa 5a 6aConceptual Understanding Read and Analyzing
relationships notate musicbetween arts and musicother disciplines9aUnderstandingmusic in relationto history and
Iculturec) la 3bProcedural I Singing Improvising
4aComposing
d)I 2d t' 7a
I Meta Playing by Ana~yzing EvaluatingI Cognitive
Iear mUSIC music
I i performances
Table 3.5 summarizes Hanna's alignment of the revised cognitive taxonomy with
music education instructional activities. This table provided a framework of definitions
for coding rehearsal statements into the cognitive domain. A common teacher task
presentation method was modeling. Modeling is conceptualized as an active exchange
between teacher and class that requires students to pay careful attention to the teacher, to
analyze the teacher model in order to compare it with their own technique, and to apply it

for necessary changes in their performance. Hanna's work helped to code this as t4c
(analyze a skill or procedure). Other examples of applying her work to cognitive coding
include singing (t3c - apply a skill), recalling a musical fact (tla - recall a fact), and
understanding a musical concept (t2b - understand a concept).
Table 3.5: Application of the Revised Bloom's Taxonomy to Music Education (based on
Hanna, 2007, p. 10)
43
Type of knowledge I) Remember 2) Understand 3) ApplyRecognize, recall Interpret, exemplify. Execute, implement
classify, summarize,infer, compare, explain
------a) Factual Recognize and recall Understand music Apply basic musical
• Terminology music vocabulary, terminology and basic knowledge
• Basic elements symbols, note values, elements such as timeinstrument parts, etc. periods, styles, peda-
gogical concepts, etc. ----b) Conceptual Recognize and recall Understand, explain, Apply music
• Interrelationships among concepts of music and discuss music concepts to thethe basic elements within theory, time periods, concepts and music's performing,the larger structure. musical styles, specific relationships to other composing,
• Classification and composers, etc. areas both within and improvising, orcategory outside of music listening to music
• Principals andgeneralization
• Theories, model, andstructure
c) Procedural Recognize and recall Understand, explain, Apply certain skills,
• Skills basic procedures for and discuss performing, methods, techniques,
• Teclmiques and methods musical notation, composing, and performance
• Perfonnance criteria instru-mental and vocal improvising, or criteria to musicper-fonnance skills, and listening to music usingother musical methods correct proceduresand techniques
d) Metacognitive Recognize and recall Understand, explain, Apply metacognition
• Knowledge of self and self-knowledge and and discuss self- ability to musicalpersonal cognition of personal cognition in knowledge and personal tasksmUSIC music; strategies for cognition in music;
• Strategic knowledge remembering musical personal strategies for
• Knowledge of cognitive symbols, procedures, listening to music,
demands facts, techniques, etc. "audiation"
• Self-knowledge

Table 3.5: Application ofthe Revised Bloom's to Music Education (extended)
44
Type of knowledge 4) Analyze 5) Evaluate-
6) CreateDitTerentiate, organize, Check, critique Generate, plan, produceattribute
a) Factual Analyze basic musical Evaluate music by Improvise, compose,
• Terminology elements checking for correct and perform music by
• Basic elements notes, rhytlmls, and other using basic elementsbasic music elements
b) Conceptual Analyze music concepts Evaluate music through Improvise, compose,
• Interrelationships in a variety of ways such conceptual critique and perform music byamong the basic as music theory analysis, using principles,elements within the ethnomusicology, theories, and multiplelarger structure. philosophy, music musical concepts
• Classification and education, transcription,category etc.
• Principals andgeneralization
• Theories, model, andstructure
c) Procedural Analyze how to apply Evaluate music through Improvise, compose,
• Skills specific types of skills, checking and critiquing and perform music by
• Techniques and methods, and techniques whether certain using a variety of skills,methods to music techniques, methods, and teclmiques, and
• Performance criteria skills were used correctly methods
d) Metacognitive Analyze how Critique and self- Improvise, compose,
• Knowledge of self metacognition assists in evaluation of and perform music byand personal understanding a given performances, how music using self- knowledgecognition of music piece of music or is personally perceived and personal cognition
• Strategic knowledge analyzing a musical
• Knowledge of problem
cognitive demands
• Self-knowledge
Table 3.6 shows sample text and assigned cognitive codes based on the
application of the Revised Bloom's Taxonomy as described in Table 3.5.

45
Table 3.6: Cognitive Coding with Sample Text
Code Text
la What was the other thing we said? Measure what?
1b It is homophonic.
1c When the note goes down, sing?
ld Are you memorized?
2a The text is about the sea.
2b Contrasting style
2c Understand what I did? Nod your head if you understand.
2d Do you see what I'm saying there?
3a 1 and then your entrance.
3b Ready.. .it goes to forte.
3c Pencil friend. Just mark it sharp, it's a very easy fix.
3d That's the idea, now think about that, what did you just do?
4a Examine your next note, analyze it
4b Major, F major triad. Alright, F major.
4c Listen very carefully to this sound [teacher models]
4d You know the difference, right?
5a Which one do you like better?
5b You like that better? I sure do!
5c What did they do that was right?
Audio Annotation and Coding
Verbatim rehearsal transcripts were analyzed using audio annotation software that
I created using the Java™ computer language from Sun Microsystems (Java, 2006). All
events were coded by sequence. Director cognitive statements 1m, lq, 3vas, and 3vds

46
were classified into the cognitive domain taxonomy. These details were recorded into a
data table in a spreadsheet and became the basis for subsequent quantitative analyses.
Each audio recording was broken into rehearsal events. Figure 3.1 shows a sample
audio recording under analysis using the Audio Amlotation software that I developed.
The software program enabled me to mark the various rehearsal events in the recording,
transcribe teacher language, add comments, code the events for sequence and cognitive
level, and to perform reliability checks.
The Audio Annotation program is divided into lower and upper parts (sce Figure
3.1). The lower part is the audio view and the upper part is the data view. The lower part
of the image shows a graphical representation of the audio. The graphical view of the
audio is labeled with seconds and event marks. Within the graphical audio view the time
in seconds is indicated by the numbered vertical lines (251, 252, etc.). The rehearsal
events are indicated by the small boxes (labeled 66 and 67 in this example).
The upper, data view consists of a table with a row of data representing each
event marked in the audio view. The data includes an event index, time, and duration.
The duration is calculated by the difference between the two consecutive events. The
comment column is for comments that can help clarify an event. The column labeled text
contains the transcribed teacher talk. The "Words" column contains the word count for
the text data. The table columns labeled A, B, and C were used for coding the event. Each
event was coded with a sequence code in column B and a cognitive code in column C.
Column A was used for reliability checking.

47
I, , ) . '
il'k 1111 r,1o?SS.lUf:S ~ SOl IrHI10.Y
Ne;((
t;v'"1Irl,!'11 !lIn" )J.lldlIJ~I\
=n 7'1 ~ ~~ -~i'.Jl· .':'1'2'~3.:'':' .13.Cc:· U' 0 til')J.. h ,'-,
','"bit: IS::
:!"l. ')11 1!-'
~Sl 19 504i5~ ~3 a~c
~Qtl.70 I 2=.!r..~ ~3 -'05626, K' 1~ii
:fo~ it ,) at~,)£r ti9 1Be27i) ,~;;; I rr
l~f; ,11j 1 ~;2iJ.Y".:. O~::
lItltlu t.htlelu IOlllvO.Jta
1
i.J!111J'"l r~m",hj ~!tIJ:?-
1']('
I' T."l~ K l~h(JIuS is .?I ~apol!Jt""3 blll nc,t 1ft- b-:ilJll1llln~.
'/".'1weISe.
~( 011:)1 C.'ilt .'1'.....:-:;:: nc'E~~l OOI"~on.::-t:.~1lI~_ 'Jr,:· :'•. :liJ'~JJ~~).? _2f.... v(ju~n ~.:!..!£I) I: up a 1111;: bill"lla~~oJ II tnOl~ IIlt:f~!;:IIl(,l 801.:1'1 CI,lf:.ln J 1):It)(lr l!l.?rs OfQtii bQ' n
1"IJ.'l' ./--~-~
~,
:,,~ ,\.
",;5:]tj-
D6a09-071
72-J~7l
7r:.
Mark---
661, (6J. IIIHlo ~Izc 99
« 14251.1a - 4.1D 12B~,I: 3BO.3~1 r U,ti!t
I Isy,lclJrolillC vlow~? Opll.JUS SI.>0etl!ll1l I
-t!~
Figure 3. J: Sample Recording in the Audio Annotation Software.
Data for the Audio Annotation program were saved in a tab-delimited ascii file.
This ascii file was opened, or copied and pasted into the Microsoft Excel spreadsheet
program (see Table 3.7). The spreadsheet contained all the data for all the directors. The
Ti column is a total index (1, 2, ... ) for all data rows. The Ndex column is the index (1,2,
... ) for all the data from a particular teacher. The N column is the index (0, 1, ... ) for each
rehearsal recording. The T code (ta, tb, tc, td, te, or tf) identifies each of the six directors.
The Song column tracked song A and song B. The Reh column recorded the rehearsal
number (reh 1, reh2, reh3, reh4, reh5, or reh6) for each song. The Stage column tracked
the three rehearsal stages. Each statement's time index in seconds was measured from the
start of each rehearsal recording in the Time column. The event duration is in the

48
Duration column and is the difference between two consecutive time indexes. The
cognitive coding is in the B column and the sequence coding is in the C column. The
verbatim transcribed text of the statement is in the text column and any comments are in
the comment column (these two columns are not visible in this Table 3.5 due to space
considerations). The word count for the event's transcribed text is in the Words column.
Table 3.7: Sample Spreadsheet Data
Ti Ndex N T Song Reh Stage Rec Time Duration B C Words
0 ta songa rehl stage1 recOl 0.00 3.27 z ld 7
2 2 ta songa rehl stage1 recOl 3.27 16.57 t2c lq 64
3 3 2 ta songa rehl stage1 recOl 19.84 lAO z 2v 0
4 4 3 ta songa rehl stage 1 reeD 1 21.24 2.38 z 3van 11
5 5 4 ta songa rehl stage1 recOl 23.63 9.04 t3c lq 36
6 6 5 ta songa rehl stage1 recOl 32.66 4.56 z ld 22
7 7 6 ta songa rehl stage 1 recOl 37.22 4.92 z 2nv 0
8 8 7 ta songa rehl stage1 reeD 1 42.14 1.67 z Id 7
9 9 8 ta songa rehl stage1 recOl 43.81 21.60 z 2nv 0
10 10 9 ta songa rehl stage1 recOl 65.41 0.73 z Ie
11 11 10 ta songa rehl stage 1 recOl 66.14 1.46 z 2nv 0
Note: The text and comment columns are not shown
The transcribed teacher text was coded into the cognitive domains. Table 3.8 is a
summary of the revised Bloom's taxonomy showing the column numbers and row letters
used for coding. The cognitive process dimension headings of remember, understand,

49
apply, analyze, evaluate, and create are numbered 1 through 6. The knowledge process
dimension headings of factual, conceptual, procedural, and metacognitive are labeled a,
b, c, and d. The row and column intersections are labeled t1 a, tl b... t6c, t6d and have the
"t" (taxonomy) prefix added to avoid confusion with the sequence code lc and Id.
Table 3.8: Revised Taxonomy o/the Cognitive Domain Showing Codes
Knowledge Cognitive Process Dimension
Dimension Remember Understand Apply Analyze Evaluate CreateI 2 3 4 5 6
(a) Factual (tIa) (t2a) (t3a) (t4a) (t5a) (t6a)
(b) Conceptual (tlb) (t2b) (t3b) (t4b) (t5b) (t6b)
(c) Procedural (tIc) (t2c) (t3c) (t4c) (t5c) (t6c)
(d) Metacognitive (tId) (t2d) (t3d) (t4d) (t5d) (t6d)
A few examples should help to clarify the process of coding into the cognitive
domain. The teacher statement "did we rehearse this song yesterday?" asked students to
recall a fact and was coded tla. The statement "sing it forte" asked students to apply a
skill and was coded t3c. Teacher modeling required the student to analyze a skill and was
coded t4c. Modeled two different ways and asking "which is better?" asked students to
evaluate a skill and was coded t5c. The question "how well do you know this piece?"
asked students to think about their understanding and was coded t2d. The question
"basses, does anyone else sing the same note you are singing?" asks students to analyzes

50
a fact and was coded t4a. The statement "do you have this memorized?" asks students to
think about their recall and was coded t1d.
Reliability
High reliability was essential to the success of the study. Reliability was achieved
at multiple levels by an iterative process using a second coder. Reliability was required
for four steps in the process of coding the recordings: 1) Correctly marking events using
the audio annotation software, 2) transcribing the recorded teacher language, 3) coding
the activity using the sequence codes and, 4) coding teacher activities 1m, 1q, 3vas, and
3vds for cognitive level. All of this activity was done using the audio annotation software
I created and a second coder.
The first two steps of event marking and transcribing were continually refined as
we worked with the data until no more improvements could be made in event markings
or transcriptions. The recorded audio for each event was played from its mark and all
teacher language was represented in the transcribed text. As we listened to the audio we
would drag the event markers to accurately adjust the starting time of each event.
During the sequence coding step events were added, deleted, and merged as
needed. Consecutive events with the same activity code were merged into one longer
event. An example of this was when the teacher would make several statements regarding
a single topic as part of a single task presentation event.
After the preliminary sequence coding a second person coded the data again
making note of where their coding varied from my initial coding. I then coded the data a
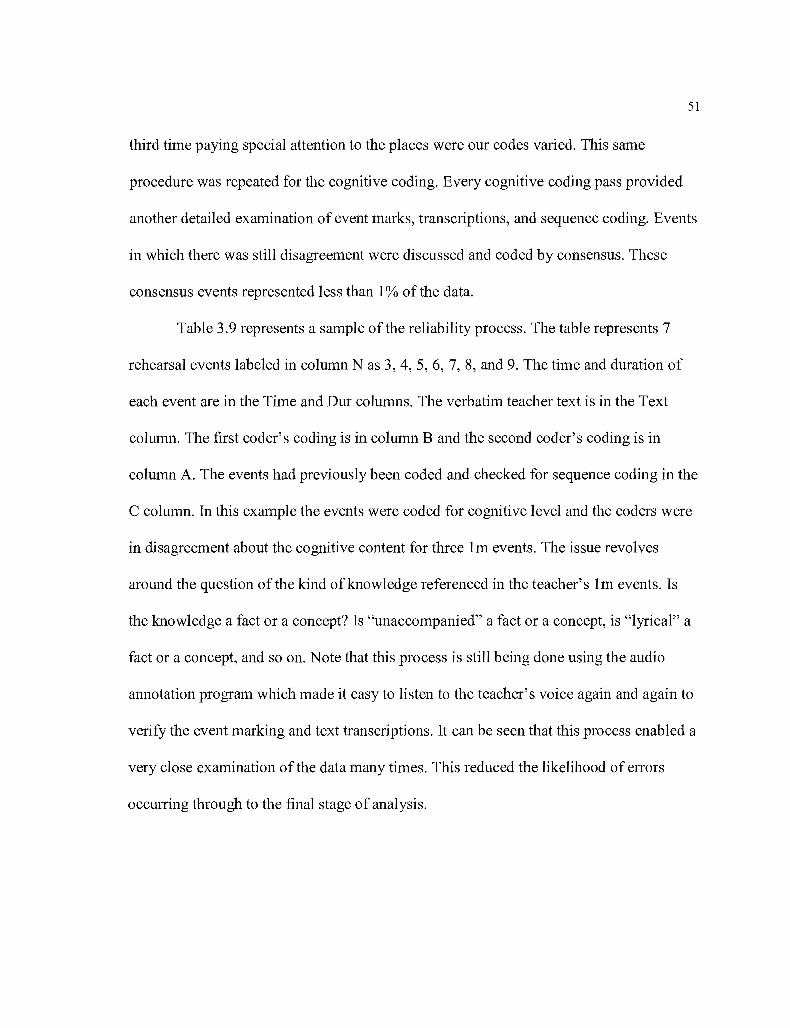
51
third time paying special attention to the places were our codes varied. This same
procedure was repeated for the cognitive coding. Every cognitive coding pass provided
another detailed examination of event marks, transcriptions, and sequence coding. Events
in which there was still disagreement were discussed and coded by consensus. These
consensus events represented less than 1% of the data.
Table 3.9 represents a sample of the reliability process. The table represents 7
rehearsal events labeled in column N as 3, 4, 5, 6, 7, 8, and 9. The time and duration of
each event are in the Time and Dur columns. The verbatim teacher text is in the Text
column. The first coder's coding is in column B and the second coder's coding is in
column A. The events had previously been coded and checked for sequence coding in the
C column. In this example the events were coded for cognitive level and the coders were
in disagreement about the cognitive content for three 1m events. The issue revolves
around the question ofthe kind of knowledge referenced in the teacher's 1m events. Is
the knowledge a fact or a concept? Is "unaccompanied" a fact or a concept, is "lyrical" a
fact or a concept, and so on. Note that this process is still being done using the audio
annotation program which made it easy to listen to the teacher's voice again and again to
verify the event marking and text transcriptions. It can be seen that this process enabled a
very close examination ofthe data many times. This reduced the likelihood of errors
occurring through to the final stage of analysis.

52
Table 3.9: Sample ofReliability Data Table
N Time Dur A B C Text
3 12.6 1.5 t4a t4b 1m raise your hand if you think it is unaccompanied
4 14.2 1.4 2nv
5 15.6 5.8 t4a t4b 1m raise your hand if you think this is a piece with lyrical, melodic lines
6 21.4 0.7 2nv
7 22.1 3.7 t4a t4b 1m raise your hand if you think this piece is more rhythmic in nature
8 25.8 1.3 2nv
9 27.0 4.3 3van yeah. you're exactly right, you're exactly right. ok.
Plan for Analysis
The analysis was designed to examine teacher activity and cognitive levels of
specific teacher statements. Sums and means of event durations were tabulated for each
teacher activity and cognitive level. These values were calculated by teacher, by stage,
and overall. The sums were used to calculate the percentage of time spent in each
teaching activity and cognitive level. The event frequencies and durations were used to
calculate the frequency of each event per minute.
Statistical analysis was done using R (2008). R is an open source program widely
used in academic settings. R runs on Windows, Linux, and Apple computers. I ran R on
my Windows XP Hewlett Packard laptop. Examples of using R for this study can be
found in the Appendix C. Tables and figures were produced to present the data and
results.

53
Data Import and Factor Coding
The data were loaded, organized, and formatted in a spreadsheet (see Table 3.1 0).
The data set contained columns for rehearsal event index (N), timc (Time), duration
(Duration), cognitive coding (B), sequence coding (C), and word count (Words).
Columns were added to code for overall event index (Ti), teacher event index (Ndex),
rehearsal recording index (N), tcacher (Teacher), song (Song), rehearsal (Rehearsal),
stage (Stage), and recording (Recording). The addition of these columns allowed the data
to be grouped, or sorted for analyses by the various factors of teacher, rehearsal, song,
stage, recording, cognitive code, and activity code.
Table 3.10: Sample Data Coded/or Analysis
Ti Ndex N Teacher Song Rehearsal Stage Recording Time Duration B C Words
0 ta sanga rehl stage 1 recOl 0.00 3.27 z ld 7
2 2 ta sanga rehl stagel recOl 3.27 16.57 2c lq 64
3 3 2 ta sanga rehl stage1 recOl 19.84 1.40 z 2v a4 4 3 ta sanga rehl stage1 recOl 21.24 2.38 z 3van 11
5 5 4 ta sanga rehl stage1 recOl 23.63 9.04 3c lq 36
6 6 5 ta sanga rehl stage 1 recOl 32.66 4.56 z ld 22
7 7 6 ta sanga rehl stage1 recOl 37.22 4.92 z 2nv 0
8 8 7 ta sanga rehl stage1 recOl 42.14 1.67 z ld 7
9 9 8 ta sanga rehl stage1 recOl 43.81 21.60 z 2nv a10 10 9 ta sanga rehl stage 1 recOl 65.41 0.73 z Ie 1
11 11 10 ta sanga rehl stage1 recOl 66.14 1.46 z 2nv a

54
Analyses
The potential analyses factors included teacher, song, rehearsal, stage, recording,
cognitive level, and activity sequence code. The cognitive level and sequence factors
could also be grouped by number and, for the cognitive code, by row letter. The factors
of teacher, stage, sequence, and cognitive level were chosen for analysis as being most
pertinent to this study. Data for each factor included duration in seconds and word count.
Durations data sets containing sums and means were collected for each factor (see
Appendix C for examples ofusing R for this analysis). Descriptive statistics of minimum,
maximum, mean, median, outliers, quartiles, variance, and standard deviation were
calculated for each grouped duration data set.
The sums and means were used to calculate the number of events (count =
sum/mean), percent of time used (percent of time = factor duration sum/total duration
sum x 100), and frequency (frequency = factor count / total duration). Percent durations
and frequencies were calculated at the levels of stage, teacher, and overall.

55
CHAPTER IV
RESULTS
Restatement of Purpose
This study analyzed the rehearsal language of six expert high school choral
directors for activity and cognitive content. Each director's verbiage was audio recorded.
The director language was transcribed verbatim, divided into rehearsal events, coded, and
analyzed. Activities containing cognitive content were further classified according to
cognitive level. Activity and cognitive data were analyzed for event count, duration,
percentage of rehearsal time, and frequency of occurrence.
Participants
Nine directors were recruited to allow for attrition. Six directors successfully
completed the requirements for the study. Attrition was, in most cases, due to directors
forgetting to record, not recording two rehearsals per stage, not recording two songs per
stage, or recording too little time. One director accidentally deleted the first half of his/
her recordings.

56
Recorded Audio
The six directors (N=6) who completed all phases of data collection recorded
audio that consisted of rehearsal segments representing two rehearsals of two songs at
three stages of rehearsal resulting in 6 recordings of each of the 12 songs for a total of 72
recordings. The average length for each recording was 14m 24s (sd=6.5m). The average
total amount of audio recorded for each teacher was 172m 54s (sd=33.0m). The mean
amount of audio for each teacher and stage (see Table 4.1) was 57m 38s (sd=19.6m).
Rehearsal time declined with each stage: Stage 1 was 36.2%, Stage 2 was 35.8% of the
total audio recording time, and Stage 3 was the shortest of the three stages at 28.0% of
total time.
Table 4.1: Amount ofAudio Recorded by Teacher and Stage
Director Stage 1 Stage 2 Stage 3
A 73:32 49:29 80:24
B 59:23 47:28 38:09
C 41 :58 48:21 31 :36
D 61 :43 105:00 73:18
E 74:26 60:17 22:54
F 64:22 59:32 44:28
Total 375:24 371 :07 290:29
Note: Time in minutes and seconds

57
Activity Sequence Data
The rehearsal was divided into events. The events were coded by activity using a
modified version of the sequential patterns coding method developed by Yarbrough and
Price (1989). The codes are summarized in Table 3.1.
The text of the total recorded audio of 1037.5 minutes was coded into 9899 events
(see Table 4.2). The averagc lcngth of each event was 6.3 seconds at a rate of about 9.5
events a minute. The events that accounted for the most rehearsal time were 44.0% for
student performance (2p) and 26.4% for teacher musical task presentation (lm). All
teacher task presentation events, coded 1 (l c, 1d, 1e, 1m, 10, 1q, and 1s), accounted for
47.1 % ofrehearsal. Teacher feedback (3van, 3vas, 3vdn, and 3vds) took 3.1 % of
rehearsal. Student activities (2nv, 2p, and 2v) were 49.3% of rehearsal.
Overall there were 6.2 events per minute for teacher talk (lc, 1d, Ie, 1m, 10, 1q,
and Is), 2.7 events per minute for student activities (2nv, 2p, and 2v), and 0.5 events per
minute for teacher feedback (3van, 3vas, 3vdn, and 3vds). These corresponded with
overall mean event durations of 4.5 seconds for teacher talk, 11.0 seconds for student
response, and 3.7 seconds for teacher feedback.
Table 4.3 shows the Table 4.2 activity in order of decreasing percent time, count,
and frequency. Student performance (2p) and teacher musical task presentation (1m)
consumed the larger percentages of total rehearsal. All other events represented much
smaller proportions. Nonspecific teacher disapproval consumed the least at 0.5%.
Nonspecific feedbacks (3vdn and 3van) represent only about 0.6% of the time combined
and were less common than specific teacher feedbacks (3vds & 3vas).

58
Table 4.2: Summary Datafor each Activity with Subtotals
Activity Minutes % Frcq Freq! Min MD1c 42.6 4.11 1240 1.20 2.11d 88.9 8.57 1741 1.68 3.1Ie 14.1 1.36 631 0.61 1.31m 273.6 26.37 1925 1.86 8.510 30.9 2.97 186 0.18 10.01q 25.0 2.41 514 0.50 2.9Is 13.7 1.32 235 0.23 3.5Subtotal 488.8 47.11 6472 6.24 4.5
2nv 20.4 1.97 305 0.29 4.02p 456.9 44.04 1721 1.66 15.92v 33.8 3.25 762 0.73 2.7Subtotal 511.1 49.26 2788 2.69 11.0
3van 5.4 0.52 137 0.13 2.43vas 14.3 1.38 194 0.19 4.43vdn 0.5 0.05 20 0.02 1.63vds 11.6 1.11 170 0.16 4.1Subtotal 31.8 3.06 521 0.50 3.7
s 5.9 0.56 118 0.11 3.0Total 1037.5 100.00 9899 9.54 6.3Note: MD=Mean duration in seconds.
Event counts and frequency values paralleled each other. Teacher task
presentation was most frequent at 1.9 events per minute. Giving directions (ld) was the
second most frequent with 1.7 events per minute. Student perfonnance (2p) was a close
third. The rate of 1.9 events per minute for task presentation (1m) would be equivalent to
28 events every 15 minutes or 112 per hour. The lowest frequency was for nonspecific
disapproval (3vdn) at 0.02 events per minute or about one event per hour. The feedback
ratios were 1.7 approvals (3van + 3vas) per disapproval (3vdn + 3vds) and 2.3 specific

59
feedbacks (3vas + 3vds) per nonspecific (3van + 3vdn). The visual representation of
thcse data in Figure 4.1 might help to illuminate relative event frequencies.
Table 4.3: Activities in Increasing Order 0.1Percent Time, Count, and Frequency
Percentage Frequency. Activity Percent Activity Freq Activity Freq/Min Freq/ 15 Min
2p 44.04 1m 1925 1m 1.9 27.81m 26.37 Id 1741 Id 1.7 25.2Id 8.57 2p 1721 2p 1.7 24.9lc 4.11 lc 1240 lc 1.2 17.92v 3.25 2v 762 2v 0.7 11.010 2.97 Ie 631 Ie 0.6 9.1lq 2.41 1q 514 lq 0.5 7.4
2nv 1.97 2nv 305 2nv 0.3 4.43vas 1.38 Is 235 Is 0.2 3.4
Ie 1.36 3vas 194 3vas 0.2 2.8Is 1.32 10 186 10 0.2 2.7
3vds 1.11 3vds 170 3vds 0.2 2.5s 0.56 3van 137 3van 0.1 2.0
3van 0.52 s 118 s 0.1 1.73vdn 0.05 3vdn 20 3vdn 0.0 0.3
Note: Activity=Sequence code and Percent=Sum of activity durations / total time.
Duration within activities varied greatly. Teacher task presentation (lm), teacher
off-task (l 0), and student performance (2p) events had the largest standard deviations
(see the SD column of Table 4.4). All categories had minimum durations ofless than 1
second. Teacher task presentation (1 m), teacher off-task (10), and student performance
(2p) had maximums of more than two minutes. Events with the smallest ranges of
duration included counting (I c), exchanges (Ie), and nonspecific disapproval (3vdn).
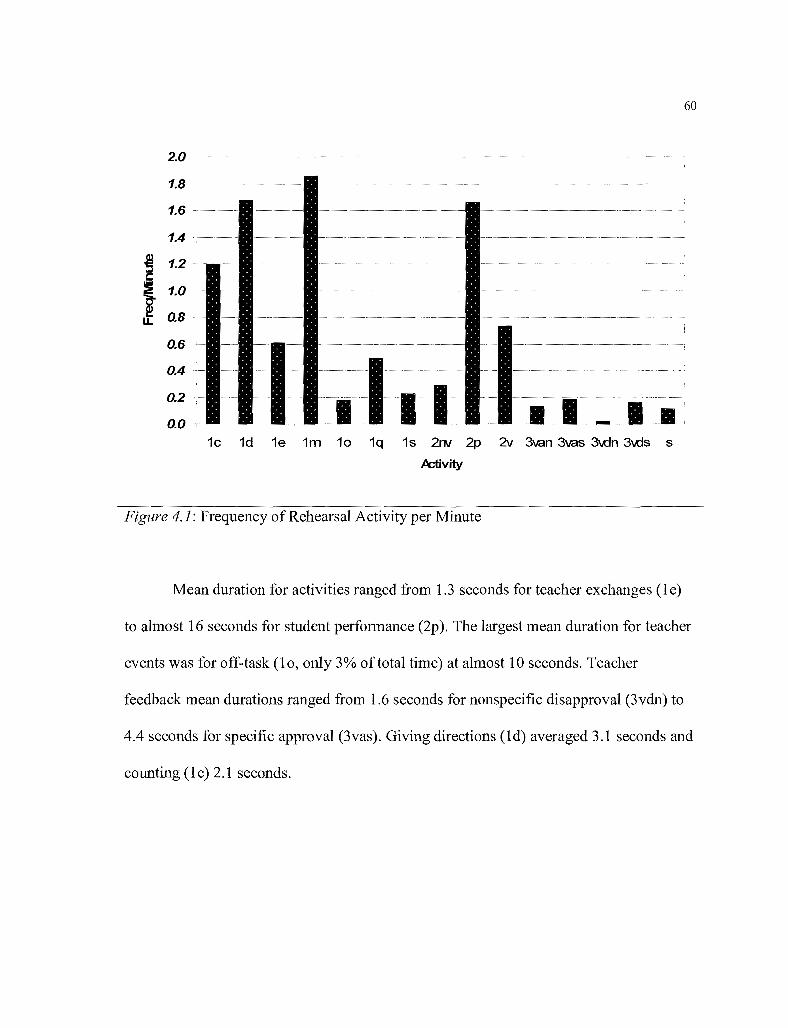
1.0 --
0.8-
60
2.0 --------------- -----.------.- -------.,--.--- --'----------.,-'----
1.8 -------------..-
1.6 ---- --.-
1.4--- - -------~---- ----.-. ---
~ 1.2 --- .
I0.6
0.4
0.2
0.0-1c 1d 1e 1m 10 1q 1s 2rw 2p 2v 3van 3vas 3\.dn 3\.ds s
Activity
Figure 4.1: Frequency of Rehearsal Activity per Minute
Mean duration for activities ranged from 1.3 seconds for teacher exchanges (1e)
to almost 16 seconds for student perfonnance (2p). The largest mean duration for teacher
events was for off-task (10, only 3% oftotal time) at almost 10 seconds. Teacher
feedback mean durations ranged from 1.6 seconds for nonspecific disapproval (3vdn) to
4.4 seconds for specific approval (3vas). Giving directions (l d) averaged 3.1 seconds and
counting (Ie) 2.1 seconds.

61
Table 4.4: Descriptive Statistics for the Activity Durations
Act Count Med Min Max M SD
Ie 1240 1.9 0.2 14.6 2.1 1.1
1d 1741 1.9 0.2 56.5 3.1 3.8
Ie 631 0.8 0.2 33.1 1.3 2.2
1m 1925 4.1 0.3 207.3 8.5 13.3
10 186 4.6 0.5 126.2 9.9 17.9
1q 514 2.1 0.4 20.8 2.9 2.6
Is 235 2.0 0.4 20.5 3.5 3.8
2nv 305 2.2 0.4 39.6 4.0 5.1
2p 1721 6.9 0.5 324.3 15.9 26.0
2v 762 1.6 0.3 57.7 2.7 3.5
3van 137 1.8 0.3 16.5 2.4 2.2
3vas 194 3.2 0.7 27.5 4.4 3.8
3vdn 20 1.4 0.4 5.1 1.6 1.1
3vds 170 3.2 0.7 26.8 4.1 3.3
s 118 2.3 0.5 14.2 3.0 2.0
Note: Act==rehearsal activity code, Med=median, M=mean
Event frequencies were close for each teacher (see Figure 4.2). Standard
deviations were 31 % or less of mean for Ie (14.5%), 10 (18.1 %), 1d (19.2%), 1m
(22.3%), 2p (25.5%), 1q (29.4%), and 2v (30.9%). Standard deviations were more than
70% of mean for s (69.7%), 3vds (70.5%), 3van (80.7%), and 3vdn (85.7%). The overall
mean frequencies per minute for each teacher were A==l 0.14, B=9.69, C=9.81, D=9.38,
E=9.32, and F=8.93 events per minute (SD=0.42 events per minute). These corresponded

62
with mean event durations of A=5.9s, B=6.2s, C=6.1s, D=6.4s, E=6.4s, and F=6.7s
(SD=O.3s). Overall event frequency was 9.5 events per minute or 6.3 seconds per event.
3.00 .-
2.00
~c:I 1.50
!u.
1.00
0.50
:-+-A
B
C
!-+-~-+-F
I SO
1c 1d 1e 1m 10 1q 1s 2rrv 2p 2:v 3van 3vas 3\dn 3\ds s
Activity
Figure 4.2: Activity Frequencies by Teacher with Standard Deviation
The six directors spent similar overall percentages of time in each rehearsal
activity with standard deviations across conductors less than 4.1 % (see Table 4.5). The
largest variation was for 2p, student performance (sd=4.0%, M=44.5%). The second
largest was in 1m, task presentation (sd=3.5%, M=26.4%). Teacher feedback standard
deviations were the smallest due to short mean durations.

63
Table 4.5: Percent Time Spent in each Activity by Teacher
Act A B C D E F M SD
Ie 4.26 2.96 4.89 5.03 3.43 3.67 4.04 0.83
1d 7.11 6.70 10.26 10.13 10.00 7.15 8.56 1.73
Ie 1.08 0.70 0.91 1.81 1.84 1.48 1.30 0.48
1m 24.85 28.10 22.65 24.51 25.75 32.67 26.42 3.54
10 2.74 4.94 0.88 3.35 2.69 2.81 2.90 1.31
1q 3.27 0.90 1.77 2.32 3.11 2.61 2.33 0.88
Is 1.07 1.80 1.28 1.67 0.96 1.06 1.31 0.35
2nv 3.33 1.27 1.21 1.40 3.56 0.82 1.93 1.19
2p 43.47 45.72 52.06 42.97 42.38 40.55 44.52 4.05
2v 4.65 1.66 2.55 4.19 3.30 2.07 3.07 1.19
3van 0.86 0.29 0.34 0.32 0.14 1.10 0.51 0.38
3vas 1.34 1.27 0.59 1.00 1.64 2.36 1.37 0.60
3vdn 0.07 0.10 0.05 0.01 0.04 0.05 0.05 0.03
3vds 1.05 2.36 0.33 0.87 1.07 1.09 1.13 0.67
s 0.86 1.21 0.23 0.43 0.10 0.53 0.56 0.41
Note: Act = Rehearsal Activity, A-F = Teacher A-F, M = Mean, Var = Variance, and SD= Standard Deviation.
Percentage oftime for each activity, except student perfonnance (2p), tended to
decrease from stage 1 to stage 3 (see Figure 4.3). This included teacher task presentation
(lm) which had a slight decrease from 27.3% to 26.4% to 25.5% in stages 1,2, and 3
respectively. A corresponding increase was observed in student performance (2p) going
from 40.9% to 43.3% to 49.0%. Teacher off-task (10) was the next largest increase from
1.9% to 3.6%. The activity with the largest decrease was teacher questioning (l q) going
from 3.5% to 0.9%. In general, the teacher talked less and the students performed more.

64
50%
45%-
40%~-
35%
,
25%-1
20%
~i= 30%Q)
I'0
I15%
I10%-'1
5%1
0% ~1..lI.-J""""'<!...J-I,~"""'J,W,.j"""-'\."""'..Il,.J-"-"-"~L-JL..L~""""""""'~Jo.a::"'--~_~"""'_-'-'D-1.V1c 1d 1e 1m 10 1q 1s 2nv 2p 2v 3\en 3\as 3\dn 3\ds s
Activity and Stage
o Stage 1 D ~age 2 0 Stage_3 I
Figure 4.3: Stage Time for each Activity
Two out of three of the activities' mean durations increased from stage I to stage
3 (Table 4.6). The largest increases were for teacher off-task and student performance.
There was a corresponding decrease in frequency (Figure 4.3). Teacher questioning and
student performance event frequency decreased by about one event every two minutes.
The largest decreases were in teacher questioning, teacher social, and teacher verbal non-
specific feedback. Teacher task presentation and giving directions decreased by about one
event every 2.5 minutes. Student verbal response, teacher counting, and teacher student
exchange decreased by almost one event per every three minutes.

65
Table 4.6: Activity Mean Durations by Stage
Act Stage 1 Stage 2 Stage 3 Delta
1c 2.11 2.06 1.98
1d 2.96 3.29 2.91 +
Ie 1.06 1.25 2.03 +
1m 8.06 8.40 9.48 -/-
10 6.66 11.70 11.75 +
1q 2.96 3.18 2.15
Is 3.78 3.84 2.77
2nv 3.30 4.45 5.01 +
2p 13.09 15.74 21.14 +
2v 2.66 2.58 2.77 +
3van 2.27 2.13 2.97 +
3vas 4.09 4.53 5.10 +
3vdn 1.36 2.62 0.89
3vds 4.11 3.63 4.80 +
s 2.46 3.31 3.52 +
Note: Values in seconds
Event frequencies tended to decrease from stage 1 to stage 3 (see Figure 4.4). This
was a consequence of the general increase in event durations in stages 2 and 3. In
summary, stage teacher activities by were 49%, 49%, and 43% for stages 1, 2, and 3,
respectively. Student responses by stage were 47%, 48%, and 54%. Teacher feedback by
stage was 4%, 3%, and 3%.

66
25- --------------- - ---~----
20 ---------
~ 1.5-~
~
11.00.5
ao-1c 1d 1e 1m 10 1q 15 2nv 2p 2v 3\an 3I.as 3\dn 3\ds 5
Activity
--_._-_.- --_ ..__ . ~-- - ---', -
• Stage 1 El Stage 2 II Stage 3
Figure 4.4: Activity Frequency per Minute by Stage
Sequences
The study did not tally sequences but it was possible to look at the proportion of
task presentation, student response, and teacher feedback. There were 1925 task
presentations and 1721 student performance events. This is almost a one to one ratio
(1.111). In contrast there were only 521 teacher feedback events. This was 3.3 student
performance events for every feedback and about 3.6 task presentations per feedback. At
best, less than one in four sequences could have been complete.
Teachers tended to give specific and positive feedback. Specific feedback was
364 of the 521 (70%) teacher feedback events. There were 331 positive feedback events
compared with only 190 disapprovals yielding a ration of2/1 for approval/disapproval.
The directors were 64% (331/521 *100) positive. It probably goes without saying that

67
specific feedback took more time because the feedback included more detail. Out of all
the recordings there were only 30 seconds of nonspecific disapproval compared with
almost 12 minutes of specific disapproval. Specific feedback (3vas & 3vds) represented
81 % of all feedback time (25.9/31.8 minutes, freq/min=O.4). Positive feedback (3van &
3vas) was 62% (19.7/31.8 minutes, freq/min=OJ) of the total feedback time.
The percent of stage time devoted to task presentation and feedback was almost
constant (see Table 4.6). It has already been noted that student performance time
increased for each stage. The ratio of task presentation events to student performance
events for each stage was similar to the overall ratio.
There were fewer feedback events as the stages progressed. There was only one
feedback for 2.8 (35%) student perfonnance events in stage 1 and this decreased to one
out of3.6 (28%) performance events in stage 3 (see Table 4.7). Stage 2 showed the
smallest percentage (26%) of feedback per student performance.
Table 4.7: Frequencies and Percentage ofStage Time for Task Presentation,
Performance, and Feedback
Activity Stage 1 Stage 2 Stage 3
1m 754 27.0% 701 26.4% 470 25.5%
2p 703 40.9% 613 43.3% 405 49.0%
3xxx 248 3.8% 161 2.6% 112 2.8%
Ratios of 1m/lp=1. 1 1m/lp=1.1 1m/lp=1.2
Counts 2p/3xxx=2.8 2p/3xxx=3.8 2p/3xxx=3.6
Note: 3xxx includes 3van, 3vas, 3vdn, and 3vds.

68
It was of interest to see if the type of feedback showed any variation with stage.
Table 4.8 and Figure 4.5 show that a larger percentage of time was spent in feedback
during stage 1. Approvals, specific and nonspecific, made up a larger percent of stage 1
time. Specific and nonspecific approvals decreased in stage 2 and stayed about the same
for stage 3. Specific approvals and disapprovals were an almost equal percent of time for
stages 2 and 3.
Table 4.8: Event Counts and Percentage ofStage Timefor Teacher Feedback
Act Stage 1 Stage 2 Stage 3
-
3van 79 0.77% 64 0.32% 27 0.46%
3vas 101 1.84% 54 1.10% 39 1.14%
3vdn 10 0.06% 5 0.06% 5 0.03%
3vds 61 1.11% 68 1.11% 41 1.13%
Total 248 3.8% 161 2.6% 112 2.8%
Cognitive Data
The revised Bloom's taxonomy of the cognitive domain was used to code (see
Table 4.9) the cognitive teacher events. This code started with tla (recall a fact). The
teacher events that were coded for cognitive level were task presentation (lm), teacher
questioning (lq), and teacher specific feedback (3vas and 3vds). All other events (lc, 1d,

69
Ie, 10, 1s, 2nv, 2p, 2v, 3van, 3vdn, and s) were coded with the code z representing an
event that was not given a cognitive code.
2.a'/o
1.8% - ,---
1.6% - ..
1.4%
~ 1.2%F
I 1.a'/o
'5 0.8% ,---
~0 0.6% f--.
0.4%,---
f- .
r--=---0.2%
o.a'/o
3\.en
f-_.
3\dn
Kind of Feedback
: 0 Stage 1 Stage 2 0 Stage 3
Figure 4.5: Stage Time for each Kind of Teacher Feedback
The overall percentage ofrehearsal time used by the cognitive events was
31 % and occurred at a rate of2.7 events per minute or about one event every 22 seconds.
The 31 % cognitive component was almost evenly divided between lower level thinking
(16.2%) and higher level thinking (15.1 %).
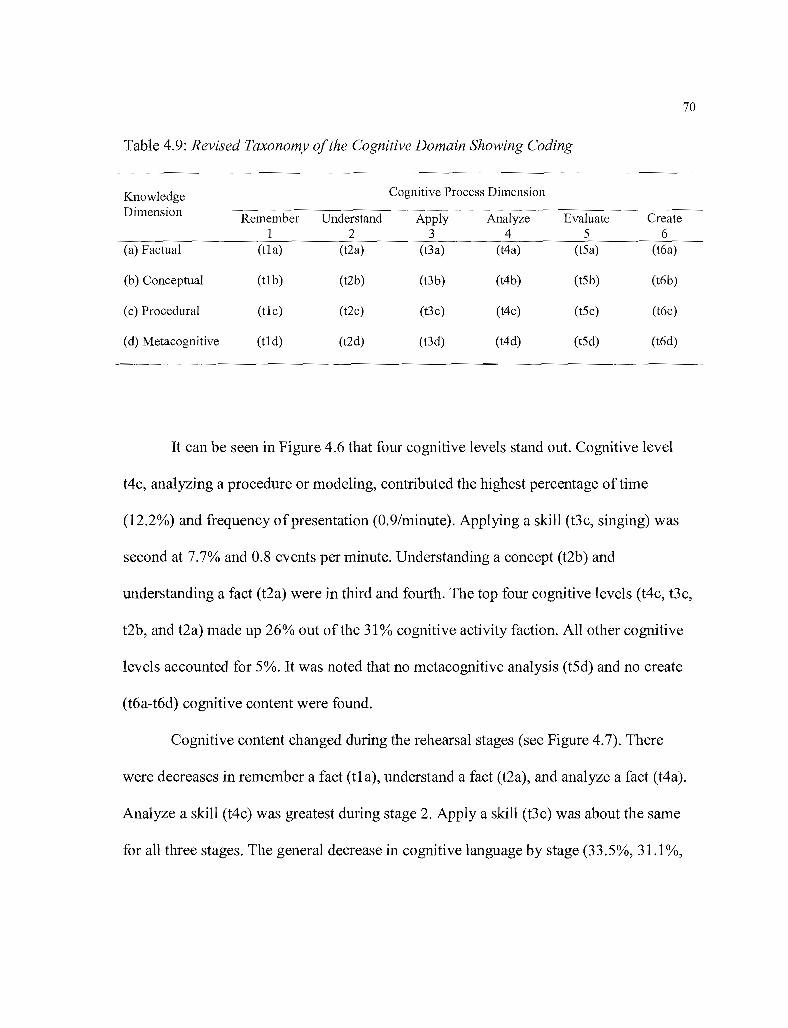
70
Table 4.9: Revised Taxonomy ofthe Cognitive Domain Showing Coding
Knowledge Cognitive Process Dimension
Dimension Remember Understand Apply Analyze Evaluate Create1 2 3 4 5 6
(a) Factual (tla) (t2a) (t3a) (t4a) (t5a) (t6a)
(b) Conceptual (tl b) (t2b) (t3b) (t4b) (t5b) (t6b)
(c) Procedural (tlc) (t2c) (t3c) (t4c) (t5c) (t6c)
(d) Metacognitive (tld) (t2d) (t3d) (t4d) (t5d) (t6d)
It can be seen in Figure 4.6 that four cognitive levels stand out. Cognitive level
t4c, analyzing a procedure or modeling, contributed the highest percentage of time
(12.2%) and frequency of presentation (0.9/minute). Applying a skill (t3c, singing) was
second at 7.7% and 0.8 events per minute. Understanding a concept (t2b) and
understanding a fact (t2a) were in third and fourth. The top four cognitive levels (t4c, t3c,
t2b, and t2a) made up 26% out of the 31 % cognitive activity faction. All other cognitive
levels accounted for 5%. It was noted that no metacognitive analysis (t5d) and no create
(t6a-t6d) cognitive content were found.
Cognitive content changed during the rehearsal stages (see Figure 4.7). There
were decreases in remember a fact (tla), understand a fact (t2a), and analyze a fact (t4a).
Analyze a skill (t4c) was greatest during stage 2. Apply a skill (t3c) was about the same
for all three stages. The general decrease in cognitive language by stage (33.5%, 31.1 %,
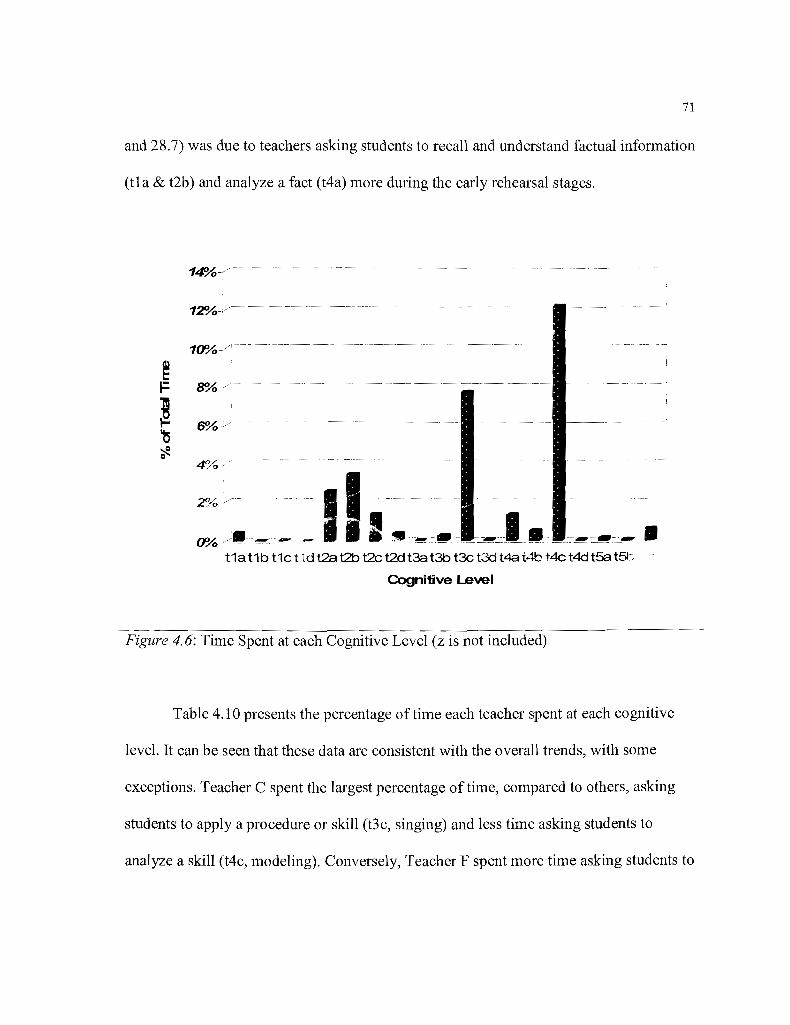
71
and 28.7) was due to teachers asking students to recall and understand factual infol111ation
(tla & t2b) and analyze a fact (t4a) more during the early rehearsal stages.
12%-Y---~ --~- -- ~--- -
1(1'../oj-~·· -.----
()O../o/
4%"
II(1'../o~.'-'~- III '" ~~~ ~~_~_-~~~_.I JI ~ -__~-~--_-- •
t1a t1b t1c t 1d t2a t2b t2c t2d t3a t3b t3c t3d t4a t4b t4c t4<:l t5a t5t,
Cognitive Level
Figure 4.6: Time Spent at each Cognitive Level (z is not included)
Table 4.1 apresents the percentage of time each teacher spent at each cognitive
level. It can be seen that these data are consistent with the overall trends, with some
exceptions. Teacher C spent the largest percentage of time, compared to others, asking
students to apply a procedure or skill (t3c, singing) and less time asking students to
analyze a skill (t4c, modeling). Conversely, Teacher F spent more time asking students to

analyze a skill or procedure (t4c, modeling) and less time asking them to apply a skill
(t3c, singing).
Table 4.10: Time at each Cognitive Level by Teacher
Code A B C D E F M SD
t1a 0.75 0.01 0.36 0.42 0.52 0.19 0.38 0.26
t1 b 0.05 0.00 0.00 0.00 0.00 0.00 0.01 0.02
tIc 0.18 0.11 0.00 0.00 0.10 0.00 0.06 0.08
tId 0.02 0.00 0.04 0.05 0.00 0.00 0.02 0.02
t2a 3.06 2.25 1.06 2.32 4.20 2.07 2.49 1.05
t2b 3.62 3.36 0.95 3.71 5.02 3.02 3.28 1.33
t2c 0.94 0.74 0.09 1.81 1.63 2.30 1.25 0.81
t2d 0.18 0.38 0.00 0.10 1.50 0.27 0.41 0.55
t3a 0.03 0.00 0.03 0.00 0.00 0.00 0.01 0.02
t3b 0.43 0.70 0.00 0.00 0.00 0.48 0.27 0.31
t3c 6.29 8.72 13.49 8.43 6.42 4.64 8.00 3.08
t3d 0.14 0.00 0.00 0.04 0.04 0.02 0.04 0.05
t4a 1.16 0.41 0.92 0.98 2.73 2.07 1.38 0.85
t4b 0.19 0.00 0.00 0.03 1.26 1.90 0.56 0.82
t4c 12.09 15.39 7.94 9.96 7.47 20.26 12.19 4.91
t4d 0.21 0.17 0.00 0.00 0.00 0.00 0.06 0.10
t5a 0.57 0.23 0.08 0.05 0.00 0.14 0.18 0.21
t5b 0.14 0.01 0.09 0.07 0.00 0.03 0.06 0.05
t5c 0.46 0.14 0.28 0.72 0.69 1.33 0.60 0.42
z 69.49 67.37 74.66 71.30 68.43 61.28 68.75 4.47
Note: All values are percentages.
72

73
16%
14% "
12%
I 10"/0
8% ''0
j 6%
4% :'
2%--'
0"/0- 0-_
t1a t1b t1c t1d t2a t2b t2c t2d t3a t3b t3c t3d t4a t4b t4c t4d too t5b t5c
Cognitive Level by Stage
-o Stage 1 Stage 2 0 Stage 3
Figure 4.7: Cognitive Percentages by Stage
Percentage of time at each cognitive level by row or by column is summarized in
Table 4.11. It revealed that teachers spent most of their cognitive time in procedural and
analytical thinking. Teachers spent little time asking students to remember, evaluate, or in
metacognitive skills. Strikingly, no rehearsal content was found for column 6 - create.
Table 4.12 shows the percent of time each teacher spent in the lower cognitive
levels (1-3), in the higher cognitive levels (4-6), and in noncognitive activity (z). The
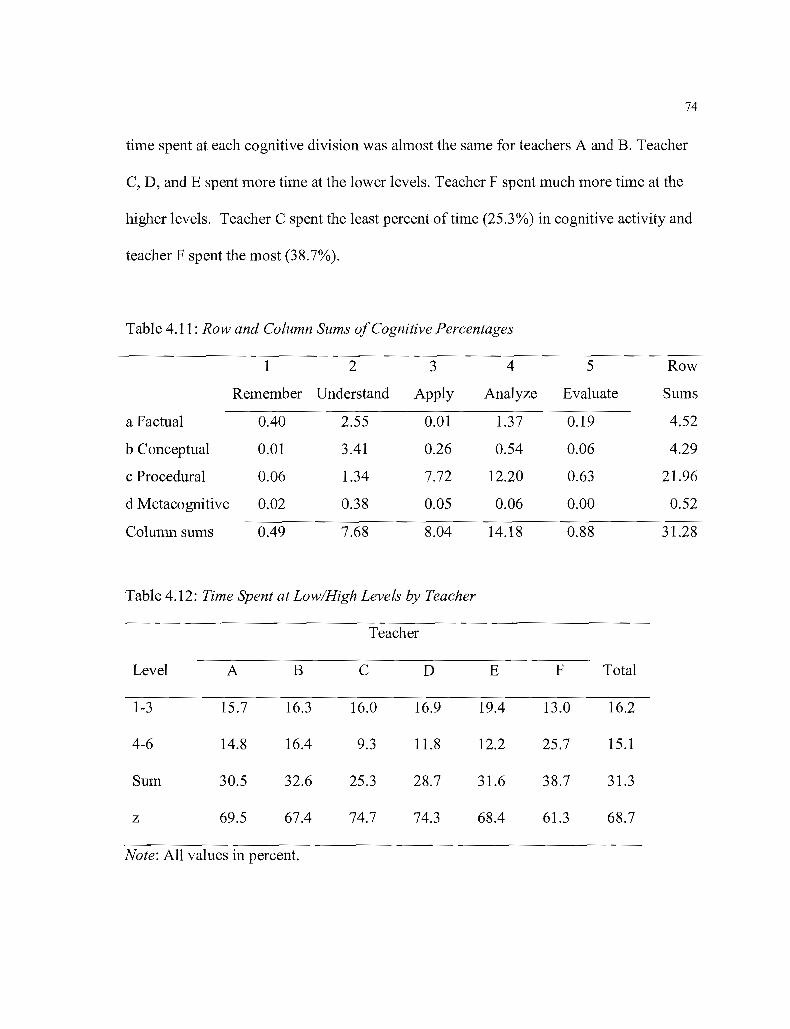
74
time spent at each cognitive division was almost the same for teachers A and B. Teacher
C, D, and E spent more time at the lower levels. Teacher F spent much more time at the
higher levels. Teacher C spent the least percent of time (25.3%) in cognitive activity and
teacher F spent the most (38.7%).
Table 4.11; Rowand Column Sums ofCognitive Percentages
1 2 3 4 5 Row
Remember Understand Apply Analyze Evaluate Sums
a Factual 0.40 2.55 0.01 1.37 0.19 4.52
b Conceptual 0.01 3.41 0.26 0.54 0.06 4.29
c Procedural 0.06 1.34 7.72 12.20 0.63 21.96
d Metacognitive 0.02 0.38 0.05 0.06 0.00 0.52
Column sums 0.49 7.68 8.04 14.18 0.88 31.28
Table 4.12: Time Spent at Low/High Levels by Teacher
Teacher
Level A B C D E F Total
1-3 15.7 16.3 16.0 16.9 19.4 13.0 16.2
4-6 14.8 16.4 9.3 11.8 12.2 25.7 15.1
Sum 30.5 32.6 25.3 28.7 31.6 38.7 31.3
z 69.5 67.4 74.7 74.3 68.4 61.3 68.7
Note: All values in percent.

75
The percentage oftime at each cognitive level and stage showed little change (see
Table 4.13). Teachers spent about the same amount of time asking students to sing (t3c)
at all three rehearsal stages. They spent the most time modeling (analyzing a skill, t4c)
and the least time in understanding a concept (t2b) at stage 2. Cognitive activities
involving understanding (t2a, t2b, and t2c) and analyzing a fact (t4a) occurred more
during stage 1. Applying a concept (t3b) only transpired in stage 1. There was a slight
increase for metacognitive understanding (t2d) during stage 3 and for evaluating a skill
(t5c) during stage 2.
Table 4.13: High/Low Cognitive Level as Percentage ofStage
Stage 1 Stage 2 Stage 3
Lower t1 a-t3d 19.26% 13.69% 15.50%
Higher t4a-t5c 14.19% 17.43% 13.17%
Total 33.45% 31.11% 28.67%
Ratio Higher/Lower 0.7 1.3 0.8
It may be helpful to put a few of these percentages into context. The stage 2
modeling (t4c) activity was 312 events and almost 39 minutes of the six hours and 11
minutes of stage time (14.4% of stage time, freq/min=0.9). The t2d activity of stage 3
represented 12 events and a 1ittle less than 2.5 minutes out ofnearly five hours oftime
(0.9% of stage time and freq/min=O.04).
76
Word Counts
Word counts were divided by total event duration to calculate teacher speaking
rates in words per minute. Table 4.14 shows the percentage of rehearsal time used for
each event, the percentage oftotal words spoken in each event, and the average rate of
speaking in words per minute. In general, the percentage of words spoken paralleled the
percentage of time used by an event. The one exception was during teacher off-task when
the quantity of words showed a decrease.
The rate of speaking was fairly steady throughout the three rehearsal stages (see
Figure 4.8). Rate decreases wcrc found in giving directions (1 d), specific approval (3vas),
non-specific disapproval (3vdn), and specific disapproval (3vds). Small rate increases
were found in teacher counting (1 c) and teacher task presentation (1m). Teacher
questioning (1q) had the largest increase in rate. Exchanges (Ie), social (1s), nonspecific
approval (3van), and specific disapproval (3vds) were at their highest rate during stage 2.
A total of68,351 words were transcribed (see Table 4.15). Of these, 41,459
(60.7%) received a cognitive code. Analyzing a skill (t4c) had the largest number of
words (n = 13,852) representing 20.3%. Applying a skill (t3c), understanding a fact (t2a)
and a concept (t2b) had word counts in the middle. Many cognitive levels had very small
word counts, with recalling a concept (t3b) having the least number of words (n = 48).

77
Table 4.14: Teacher Wordsfor each Activity
Activity Minutes Percent Word Count Word % Words/Min
1c 42.59 4.11 4228 6.19 99
1d 88.89 8.57 13112 19.18 148
Ie 14.08 1.36 1937 2.83 138
1m 273.63 26.37 31983 46.79 117
10 30.85 2.97 1607 2.35 52
1q 25.02 2.41 4993 7.30 200
Is 13.69 1.32 1422 2.08 104
2nv 20.45 1.97
2p 456.90 44.04
2v 33.75 3.25
3van 5.42 0.52 773 1.13 143
3vas 14.28 1.38 2503 3.66 175
3vdn 0.52 0.05 102 0.15 197
3vds 11.57 1.11 1980 2.90 171
s 5.85 0.56
Total 1037.50 100.00 63789 100.0 62.2

100 -r--
78
250 ~~.---~------------ ------------------ - --'~ - ---
200 ---~-------------.-
1150 J. _
ai
50,-
0--
1c 1d 1e 1m 10 1q 1s 3\.en 3\.as 3\dn 3\ds
Activity
• Stage 1 0 Stage 2 II Stage 3
Figure 4.8: Speaking Rates for Rehearsal Activity and Stage
Speaking rates (see Figure 4.9) during each cognitive level ranged from 109 wpm
(t4c) to 230 wpm (tId). The second most common level (14.6% of all words) oft3e had a
rate of 125 wpm and the third most common level (6.9%) of t2b had a rate of 134 wpm.
The average wpm for the cognitive text was 128 wpm.

79
Table 4.15: Words for each Cognitive Level by Count, Frequency, and Percent
Cognitive Count Freql Min Percent
tla 665 161 0.97
tlb 15 148 0.02
tIc 151 224 0.22
tId 48 230 0.07
t2a 4378 165 6.41
t2b 4754 134 6.96
t2c 2138 154 3.13
t2d 684 172 1.00
t3a 16 169 0.02
t3b 315 116 0.46
t3c 9987 125 14.61
t3d 85 177 0.12
t4a 2129 150 3.11
t4b 756 134 1.11
t4c 13852 109 20.27
t4d 113 168 0.17
t5a 348 178 0.51
t5b 124 191 0.18
t5c 901 138 1.32
z 26892 38 39.34
Total 68351 66 100.00

250 ------------- ----------------------- ----------
200 -'------- - -------------- ----------------------
~ 150- ----- -- --:;!
J
0-
t1a t1b t1c t1d t2a t2b t2c t2d t3a t3b t3c t3d t4a t4b t4c t4d t5a t5b t5c
Cognitive Level
Figure 4.9: Speaking Rates for each Cognitive Level
Cognitive and Activity Combined
Cognitive levels and teacher activities could be deconstructed in tenns of each
80
other. Looking at the 1m column in Table 4.16 we can see that teacher task presentation
contained mostly cognitive codes oft2a (understand a fact), t3c (apply a skill) and t4c
(analyze a skill) with lesser amounts oft2b (understand a concept), t2c (understand a
skill), and tla (recall a fact). The cognitive level t2a (understand a fact) was found in all

81
four teacher cognitive activity codes of 1m, 1q, 3vas, and 3vds whereas t3c (apply a skill)
occurred most frequently only in teacher task presentation (1m).
Table 4.16: Coding Count Composition Matrixfor each Cognitive Level and Teacher
Activity
Level 1m 1q 3vas 3vds Total
t1a 35 40 8 84
t1b 1 2 0 4
tIc 2 5 1 1 9
tId 1 5 0 0 6
t2a 148 96 84 54 382
t2b 84 28 29 17 158
t2c 47 17 24 8 96
t2d 9 21 2 0 32
t3a 2 0 0 0 2
t3b 7 0 0 0 7
t3c 769 41 21 33 864
t3d 6 0 0 7
t4a 35 112 2 4 153
t4b 14 32 0 0 46
t4c 751 61 16 49 877
t4d 2 0 0 3
t5a 4 19 1 25
t5b 0 8 0 9
t5c 13 20 5 1 39
z 0 0 0 0 7096
Total 1925 514 194 170 9899
Note: 1c=1240 events, Id=1741, 1e=631, 10=186, 1s=235, 2nv=305, 2p=1721, 2v=762,3van=137,3vdn=20, ands=118

82
The cognitive level component of teacher activities 1q, 3vas, and 3vds was
examined in terms of percentage of rehearsal time (see Figure 4.10 and Table 4.17).
These activities represented a mere 4.9% of total rehearsal time. The lower cognitive
levels 1-3 were 2.9% and levels 4-5 were 2.1 %.
/
0.6%
......
" ....
k oLD0.0%9..0 Q o{l ro
t1a t1b t1c t1d t2a . ·..... 0 0 0 ¢_ RJ_.Alt2b t2c t2d t3a . I 0 '. UJ LP
t3bt3ct3d' 0 -~Cognitive Level t4a t4b t4c t4d 0. t;} 3\.ds
t5a t5b t5c
0.5%-
0.4%
ctl-0 0.3%-.--0~0
0.2%
0.1%
Figure 4.10: 1q, 3vas, and 3vds Rehearsal Time Spent by Cognitive Level

83
Table 4.17: Cognitive Level by Cognitive Activity Percentages
Level 1m 1q 3vas 3vds
t1 a 0.216 0.148 0.032 0.004
tlb 0.003 0.004 0.003 0.000
t1 c 0.019 0.029 0.Q15 0.002
tId 0.007 0.013 0.000 0.000
t2a 1.501 0.333 0.471 0.248
t2b 2.921 0.162 0.201 0.124
t2c 1.018 0.082 0.201 0.037
t2d 0.269 0.062 0.053 0.000
t3a 0.009 0.000 0.000 0.000
t3b 0.261 0.000 0.000 0.000
t3c 7.134 0.244 0.138 0.208
t3d 0.005 0.041 0.000 0.000
Subtotal 13.363 1.117 1.114 0.622
Subsum 16.2%
t4a 0.793 0.536 0.013 0.028
t4b 0.356 0.188 0.000 0.000
t4c 11.284 0.329 0.150 0.436
t4d 0.063 0.002 0.000 0.000
t5a 0.096 0.070 0.004 0.019
t5b 0.000 0.059 0.000 0.004
t5c 0.418 0.110 0.096 0.006
Subtotal 13.010 1.294 0.262 0.493
Subsum 15.1 %
Total 26.374 2.412 1.377 1.115
Grand sum 31.3%

84
The lower cognitive levels (tl a-t3d) for teacher task presentation (lm) were
13.4% and the higher levels (t4a-t5c) were 13.0% for a total of26.4%. Applying a skill
(t3c) and analyzing a skill (t4c) made up the bulk ofthe 1m activity (see Figure 4.11).
The 1m activity occupied more than five times the rehearsal time (26.4%) compared with
activities lq, 3vas, and 3vds combined (4.9%).
10%j
8%
6"/0/
4%/
2% }.~ __-lll.-~. ~~ ~ ~ .{p/O "-~----- - -~~------~---.------ ---~-~
t1a t1b t1c t1d t2a t2b t2c t2d t3a t3b t3c t3d t4a t4b t4c t4d t53 t5b t5c
Cognitive Level
Figure 4.11: 1m Cognitive Component
By Stage
One of the research questions was about type and quantity of cognitive content
during the three rehearsal stages. This question was investigated using the deconstruction
of the cognitive levels by the teacher activities.

85
A sample comparison for activity 1m may be seen in Figure 4.12. It portrayed a
general trend of fewer 1m events from stages 1 to 3. Notice that there are very few t1a
(recall a fact) or t4a (analyze a fact) events after stage 1. Singing (t3c) and modeling (t4c)
are abundant at each stage but decrease as overall 1m stage time decreased.
350'/
3CO
250
>.CJ 200c:Q)
::I
g- 150a-
LL
100
50-
.........
Q)gnitive Level
.... -.
-.....
Figure 4.12 1m Frequency by Cognitive Level and Stage

86
Stage 1 duration percentages reflected a focus on understanding facts, concepts,
and skills (t2a, t2b and t2c), applying a skill (singing, t3c), analyzing facts (t4a), and
analyzing a skill (teacher modeling, t4c). Several other cognitive levels were present in
small amounts (see Figure 4.13).
10% ./
9%
8%
7%-r-
Q) 6%C)
ca 5%·-en "' ..- 4%-0 --- ---
~3%c:>
2%
1%
0% ......•
Cognitive Level
Figure 4. J3: Stage 1 Rehearsal Time for each Cognitive Level and Teacher Activity

87
Stage 2 percentages demonstrated a sharper teacher focus (Figure 4.14) with only
a few cognitive levels presented. These included t3c and t4c with lesser amount oft2a,
t2b, and t2c. Teacher questioning and feedback were down compared with stage 1. One
small, but notable, increase was in evaluating a skill, t5c.
-. '- ...
......_---
-----------
l ..{i, O-O-~.rl1 ED00 0 UJ-
0" 0 e .Qc:;-0% .. ~o _. QQ o Q' '~.A1
o o~ ur U"'"t1at1bt1ct1d"" -.. I.:? Q e 0 tf Q c:=r{j 1
t2at2bt2Ct2d'" OJ I::l Q Q S' 1 mt3a t3b t3c t&l t4a "'" . . ~ t::::J - "3~.!l
t4b t4c' M:'fSCognitive vel t4d t5a t5b t5c
2%
14%
12%-
10%
NQ) 8%-0)co--en 6%-0~0
4%
Figure 4.14: Stage 2 Rehearsal Time for each Cognitive Level and Teacher Activity

88
Stage 3 (Figure 4.15) showed a slight increase in the variety of cognitive levels
composing teacher task presentation (1 m) events with some emphasis on instructing
students to think about what they understand (t2d). At only 0.77% it is probably an
inconsequential amount but a large increase from previous values of 0.11 % and 0.03%
for stages 1 and 2 respectively.
12%'
1(J%
8%MQ)C)
S 6%(fJ-0~ 4%0
2%
CJ>/o
Cognitive level
Figure 4. J5: Stage 3 Rehearsal Time for each Cognitive Level and Teacher Activity

89
The second largest percentage of cognitive activity was during teacher
questioning (1 q). It was a small percentage of activity and decreased from 3.58% at stage
1, to 2.39% at stage 2, to only 0.87% at stage 3. Even though small in percentage, it is an
important teacher activity. The 1q activity was examined at each stage in terms of its
cognitive level composition. The 1q activity was by far the most diverse level for
cognitive levels as seen in Figure 4.16.
0.9% -
0.8%
0.7%-
0.6%
I 0.5%
'5 0.4%~
0.3%0
0.2%
0.1%
0.0%-/--ro..-.....
Figure 4.16: lq Activity by Cognitive Level and Stage
Percentage of rehearsal time spent in the 1q activity (teacher questioning) for each
stage was very small. The 1q activity showed a bump up in stage 2 for cognitive levels
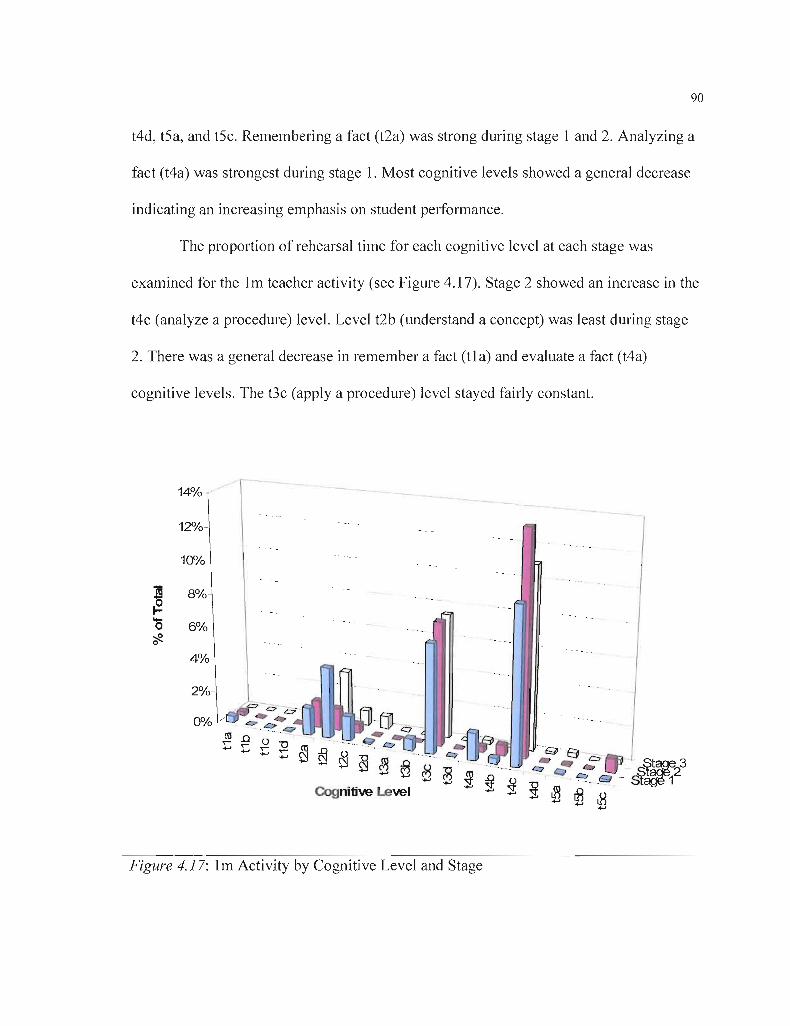
90
t4d, t5a, and t5c. Remembering a fact (t2a) was strong during stage 1 and 2. Analyzing a
fact (t4a) was strongest during stage 1. Most cognitive levels showed a general decrease
indicating an increasing emphasis on student performance.
The proportion of rehearsal time for each cognitive level at each stage was
examined for the 1m teacher activity (see Figure 4.17). Stage 2 showed an increase in the
t4c (analyze a procedure) level. Level t2b (understand a concept) was least during stage
2. There was a general decrease in remember a fact (tla) and evaluate a fact (t4a)
cognitive levels. The t3c (apply a procedure) level stayed fairly constant.
14%
12%-
10%
~8%
'0 6%~0
4%-
2%-
0%
Figure 4.17: 1m Activity by Cognitive Level and Stage

91
By Kind and Way ofThinking
The cognitive data was examined by kind of thinking (remember, understand,
apply, analyze, evaluate, and create) and way (factual, conceptual, procedural, and
metacognitive) of thinking referring to the rows and columns of the revised taxonomy
(see Table 4.9). The cognitive levels represented 31.3% of total rehearsal time. It can be
seen in Table 4.18 that procedural knowledge was the most common kind of thinking and
that analyze was the most common way of thinking. Factual and conceptual, rows a and
b, account for 8.8% of rehearsal compared with 22.5% for procedural and metacognitive,
rows c and d. Columns one, two, and three were 16.2% ofthe total rehearsal time
compared with columns four, five, and six at 15.1 %. This indicated that a larger
percentage of time was spent at the higher kinds of thinking and about the same
percentage of time was spent in the lower and higher ways of thinking.
Table 4.18: Percentage ofRehearsal by Kind and Way ofThinking
Kind % Way %
a) Factual 4.52 1) Remember 0.49
b) Conceptual 4.29 2) Understand 7.68
Subtotal 8.81 3) Apply 8.04
Subtotal 16.21
c) Procedural 21.96
d) Metacognitivc 0.52 4) Analyze 14.18
Subtotal 22.48 5) Evaluate 0.88
6) Create 0.00
Subtotal 15.06

92
Figure 4.18 explores the kind ofknowing or thinking by stage. Factual thinking
decreased. Conceptual was highest during stage 1. Procedural was at its maximum during
stage 2, with stages 1 and 3 being similar. There was a slight, but possibly
inconsequential increase in metacognitive thinking from stage I to stage 3.
Metagcognitive stage levels were all 1% or less.
/
/25"/o(
20%"
<II 15%en~eno-;;e. 1(1/0
(1/0 >/ _~'_'"..__. ~~~_=_~_::: ~~~~7abc d
Kirxls of KooNing and Stage
• Stage 10 Stage 2II Stage 3i
Figure 4.18: Kind of Knowing (row) as a Percentage of Stage Time
Note: a=factual, b=conceptual, c=procedural, and d=metacognitive.

93
Figure 4.19 graphs the way of knowing by stage. Stage 1 had the most time
asking students to understand (10%). Applying was equal in all three stages. Analyzing
was highest during stage 2 (16.2%) and represented the largest proportion of cognitive
activity for all stages. Only negligible percentages of remember and evaluate were found.
Column 6, create, was not observed at any stage.
/ -_.•.__ .__ .. _ ..-_.--._._- __ ..--
1trJ/oJ ,
16%
1Z'/o/Ql ~--------- -
g' 1(1J/o....~ trJ/o/---
/--_ ..•_-_ ....6%~ ::::~.._----.:.:
""/0/ :-:-
3 4
Ways cl KrlCM'ing and Stage
Figure 4.19: Way of Knowing (column) as a Percentage of Stage Time
5 6
Note: 1=remember, 2=understand, 3=apply, 4=analyze, 5=evaluate, and 6=create.

94
Speaking Rates and Cognitive Level
Teacher language was investigated to uncover any patterns in speaking rates and
cognitive level. Table 4.19 presents the revised taxonomy with the teacher's speaking rate
in words per minute. I expected the wpm numbers to decrease from left to right and from
top to bottom. Looking at adjacent cells, it can be seen that this is not always the case.
Table 4.19: Revised Taxonomy with Words/Minute
2 3 4 5
Remember Understand Apply Analyze Evaluate
a Factual 161 165 169 150 178
b Conceptual 148 134 116 134 191
c Procedural 224 154 125 109 138
d Metacognitive 230 172 177 168
Note: No column six (create) data present
Table 4.20 shows the words per minute for the cognitive levels grouped by
combining rows a and b into one row, and combining rows c and d into a second row.
Again, it was expected the words per minute would decrease but this only happened in
columns four and five.
Table 4.21 shows the word per minute data grouped into four quadrants of the
revised taxonomy. It was found that moving from the lower rows (a and b) to the higher
rows (c and d) resulted in slower speaking. Moving across columns it can be seen that

95
teacher speaking rates stayed about the same for the factual and conceptual language but
slowed down for procedural and metacognitive content.
Table 4.20: Words/Minute by Cognitive Level (10)
1 2 3 4 5
Remember Understand Apply Analyze Evaluate
a, b 160.3 147.7 118.0 145.3 181.2
Factual + 1.6% 22.0% 0.8% 7.0% 1.1 %
Conceptual
c, d 225.8 157.9 124.9 109.8 137.6
Procedural + 0.5% 6.8% 24.3% 33.7% 2.2%
metacognitive
Note: % refers to percentage of total cognitive words
Table 4.21: Words/Minute by Cognitive Level (4)
a, b
Factual +
Conceptual
c, d
Procedural +
metacognitive
1,2,3
Remember, understand, apply
147.2
24.4%
131.8
31.6%
4,5
Analyze, evaluate
149.4
8.1%
111.1
35.9%
Note: % refers to percentage of total cognitive words

96
Summary of Results
Six directors recorded an average of about 15 minutes of audio per rehearsal for
72 rehearsals resulting in more than 1000 minutes of data. Approximately 9000 events
were identified in the audio. Student performance made up 44% of the audio and teacher
task presentation was 26%. Teacher feedback was 3.1 %. There was more specific
feedback compared with nonspecific feedback and more approvals than disapprovals.
The ratio of task presentations to student performance events was 1.111 and the ratio of
student performance to teacher feedback was 3.3/1.
Student performance time percentage increased from stage 1 to stage 3 as teacher
talk percentages decreased. Most activity frequencies per minute decreased because
either there were less events per minute or event duration increased.
Teacher task presentation, questioning, and specific feedback comprised 31% of
the total time. The cognitive content of these events was approximately evenly divided
between lower cognitive levels and higher cognitive levels. Modeling made up 12% of
the cognitive content and tasks asking students to sing was almost 8%.
Rate of teacher talk was not the same for all activities. Questioning was spoken at
about 200 words per minute (wpm). Teacher off-task language was less than 60 wpm.
Teacher speaking rates showed various rates for cognitive content. Remembering a
concept and thinking about what was remembered showed rates greater than 220 wpm.
Applying a concept, applying a procedure, and analyzing a skill were the slowest at 125
wpm or less.
97
Creating a three dimensional graph of cognitive level percentages and teacher
activities resulted in an image resembling a landscape. This landscape represents the
cognitive topography for our teachers. It is possible that this landscape is unique to expert
teachers.

98
CHAPTER V
DISCUSSION
Purpose of the Study
:ling style of the expert teacher is an ongoing concern for
music educators anJ rehearsal language is a key ingredient. The main purpose of this
study was to examine the cognitive content of the language used by expert high school
choral directors. I hoped this analysis would help us visualize the quantitative details of
the cognitive rehearsal topography created by the directors' activities and language.
Summary of Results
Research Question 1: Can director language be effectively coded and classified into the
cognitive domain taxonomy?
I was able to code and classify director language into cognitive levels using the
methods outlined in the study. Transcribing and coding were time intensive tasks. Part of
the time was spent in refining the coding skills and the coding system. In the early phases
this required recoding data. I did not discover any technologies or methods that would
expedite the process.

99
The coding process was self-correcting and therefore effective. Any rehearsal
event that did not fit the event classification system required me to reconsider the system,
adjust it, and start over. The same was true for the cognitive coding. In general these
refinements were made early in the data coding process. The sequence coding method
was modified to handle teacher exchanges (1 e) with students that were neither off-task
nor social. The s code was added to label periods of silence that were long enough to be
an identifiable event.
I added Fourier frequency analysis to the audio annotation software to see if this
could help distinguish teacher talk from other audio. I hoped that this graphical image of
audio frequencies would facilitate the delineation of rehearsal events. It had some value
but was not effective in replacing careful listening to accurately locate rehearsal events. It
is possible that more advanced work along these lines would prove fruitful.
Research Question 2: What are the general characteristics ofthe rehearsal language of
expert high school choral directors in terms ofrehearsal activity and cognitive content?
The answer to this question laid the groundwork for the construction of a later
recognizable landscape visualizing the directors' style. The resulting topography
represented a cognitive signature for the directors. Several features stood out. The
directors, on average, spent about 15 minutes on each song in each rehearsal. The average
rehearsal length decreased from stage 1 to stage 3. Stage 3 was recorded just before the
fall concert and most of the teachers spent shorter periods rehearsing each song. They

100
would sing through the songs and spend time on stage movement and concert logistics.
This resulted in less music rehearsal time available for analysis.
The overall average duration for all events-teacher task presentations, student
responses, feedback- was 6.3s. Teacher task presentation (1m) was 26.4% of rehearsal.
Teacher talk (1 c, 1d, 1e, 1ro, 10, 1q, and 1s) accounted for 47.1 % of rehearsal time. This
result is similar to the 40% found by Pence (1999), Thurman (1977), and Witt (1986) but
larger then the 19% reported by Caldwell (1980).
Student activity (2nv, 2p, and 2v) used 49.3% of rehearsal time, with student
performance (2p) accounting for 44.0%. Teachers spent 8.6% ofrehearsal time giving
directions (1 d) and 4.1 % counting (1 c) to start the choir singing. This yielded 56% of
rehearsal as nonperformance which matches Watt (1986), Davis (1998), Gundersen and
Williams (1998), but is much higher than the 38.6% found by Watkins (1994).
Pence's teachers (1999) gave directives at a rate of 2.5 per minute. Our teachers
gave directions at an overall rate of 1.7 per minute (Tables 4.2 & 4.3, Figure 4.1). The
most frequent event was teacher task presentation at 1.9 events per minute. Choir
performance frequency was approximately 1.7 events per minute. Giving directions also
occurred at a rate of 1.7 events per minute. Teacher counting to get the group singing was
1.2 events per minute. Teacher questioning occurred only once every two minutes on
average (see Figure 4.2).
Our teachers spent little time off-task (3%) and in social activity (1.3%).
Consequently, the frequency for both of these activities was only 0.2 events per minute.
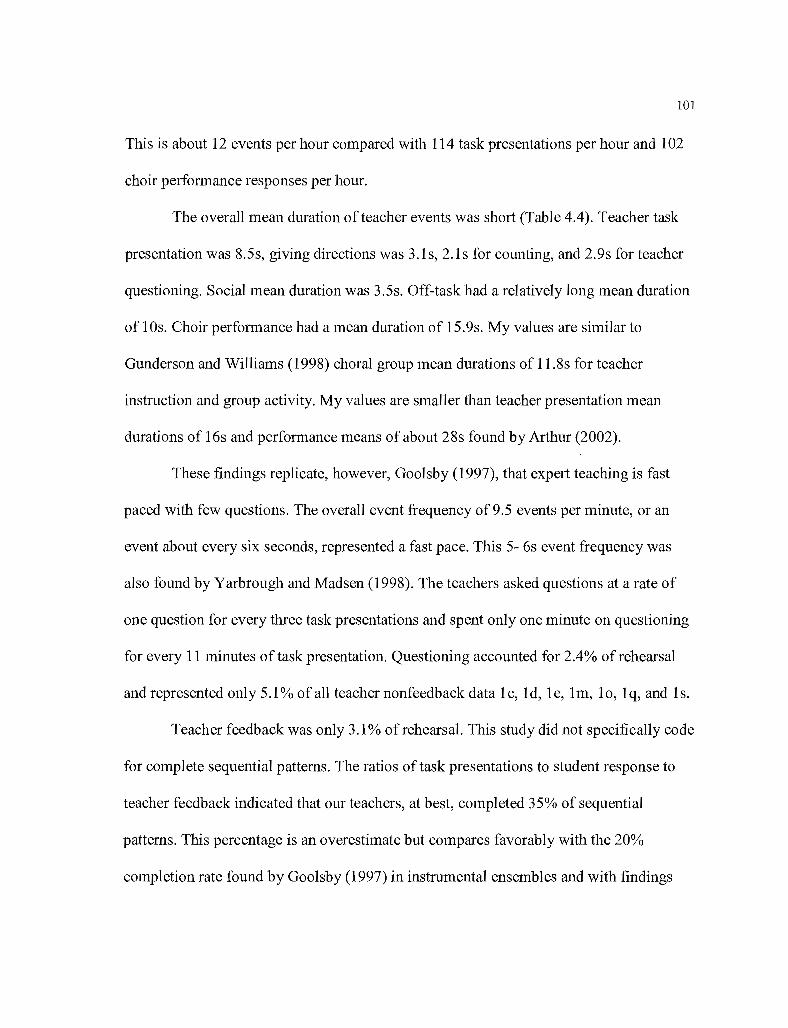
101
This is about 12 events per hour compared with 114 task presentations per hour and 102
choir performance responses per hour.
The overall mean duration of teacher events was short (Table 4.4). Teacher task
presentation was 8.5s, giving directions was 3.1s, 2.1s for counting, and 2.9s for teacher
questioning. Social mean duration was 3.5s. Off-task had a relatively long mean duration
of 10s. Choir performance had a mean duration of 15.9s. My values are similar to
Gunderson and Williams (1998) choral group mean durations of 11.8s for teacher
instruction and group activity. My values are smaller than teacher presentation mean
durations of 16s and performance means of about 28s found by Arthur (2002).
These findings replicate, however, Goolsby (1997), that expert teaching is fast
paced with few questions. The overall event frequency of 9.5 events per minute, or an
event about every six seconds, represented a fast pace. This 5- 6s event frequency was
also found by Yarbrough and Madsen (1998). The teachers asked questions at a rate of
one question for every three task presentations and spent only one minute on questioning
for every 11 minutes of task presentation. Questioning accounted for 2.4% of rehearsal
and represented only 5.1 % of all teacher nonfeedback data 1c, 1d, 1e, 1m, 10, 1q, and 1s.
Teacher feedback was only 3.1 % of rehearsal. This study did not specifically code
for complete sequential patterns. The ratios of task presentations to student response to
teacher feedback indicated that our teachers, at best, completed 35% of sequential
patterns. This percentage is an overestimate but compares favorably with the 20%
completion rate found by Goolsby (1997) in instrumental ensembles and with findings

102
that good teaching is characterized by complete sequential patterns (Price, 1992;
Yarbrough & Hendel, 1993).
Very little disapproval was nonspecific (one per hour). Teachers gave more
specific feedback (21 per hour) and the percentages of rehearsal for specific approval
(1.4%) and disapproval (1.1 %) were almost the same (see Table 4.2). Teachers gave
slightly more approval (1.9%) than disapproval (1.2%). These results are in accord with
previous studies (Price, 1983; Yarbrough, Price, & Bowers, 1991) that expert teachers
give more positive feedback. These percentages, though small, describe our teachers as
approving and specific. This might be an indication that they are carefully focused on
details throughout.
Our teachers did not speak at the same rate of words per minute (wpm) for
different activities (see Table 4.14). Teachers spokc the most words per minute during
questioning (200 wpm) and the slowest when off-task (52 wpm). It may be that when the
teacher was off-task they were distracted and trying to think as they spoke.
The reason for the fast questioning rate is puzzling. Examples of some of the
questions are "What's the word?" "So 3/4 means what?" "Do you understand this?"
"When the note goes up sing?" "Who is singing that note for me?" The fast rate may be a
result of teacher familiarity with these common questions.
I did not discern any pattern between teacher activity and speaking rates. There
does seem to be an inverse relationship between speaking rates and mean words per event
(mwpe). The four teacher activities analyzed for cognitive content, 1m, lq, 3vas, and
3vas, followed this pattern. Questioning (1 q) had the smallest mean words per event (9.7)

103
and the fastest speaking rate (200 wpm). Specific approval and disapproval were in the
middle (approximately mwpe=12, wpm=I73). Task presentation (1m) was last with the
mwpe (16.6) and the slowest speaking rate (117 wpm). The teachers' rates of speaking
stayed approximately the same during the three rehearsal stages (see Table 4.14).
It seemed more likely that teachers' rates of speaking were connected with the
cognitive content of the teacher language (see Table 4.15 and Figure 4.9). There are at
least two ways to move to higher order thinking in the revised taxonomy. Higher order
thinking can be achieved by moving down the rows or by moving across the columns of
the taxonomy. Procedural and metacognitive (row c and d) are higher order thinking than
factual and conceptual (rows a and b). Analysis and evaluation (columns four and five)
are higher than remember, understand, and apply (columns one, two, and three).
Speaking rates were slower in columns four and five, analyze and evaluate, at the
procedural and metacognitive levels compared with columns one, two, and three (see
Table 4.19). Speaking rates stayed about the same for lower and higher level thinking in
factual and conceptual language.
Thcse results might indicate that the teachers tended to speak slower when they
used higher order thinking language. It also suggests that it may be easier for the teacher
to speak at the lower kinds of knowing (factual and conceptual) compared with the higher
kinds (procedural and metacognitive).
Teachers spoke faster at the cognitive level of remember a skill (tl c) and thinking
about what is remembered (tld). Teachers spoke slower when modeling (t4c). The slower

104
modeling rate is consistent with the act of actually singing and sustaining vowels, which
in general, is slower than speaking.
Research Question 3: Does the director's use ofrehearsal time and cognitive language
content change during the stages ofsong preparation?
Our teachers spent less time talking and let the choirs sing more as the rehearsals
progressed from stage 1 to stage 3. This replicates findings by Davis (1998), Witt (1986),
and Yarbrough and Price (1989). Here student performance time increased (see Figure
4.3) through all three stages (41 %,43%, and 49%) and the mean durations (see Figure
4.6) of performance events increased (13.1, 15.7, and 21.1s). Task presentation mean
duration increased slightly (8.1 to 9.5s) across stages. Obviously, an increase in event
duration meant a general decrease in event frequency as the stages progressed.
Teacher task presentation percentages stayed about the same through the stages
(27.0%,26.4%, and 25.5%). This was accompanied by percentage decreases in other
kinds of teacher talk while, as has been noted, student performance times increased.
Teacher feedback decreased from 3.8% to 2.8%. Counting, giving directions, and
questioning decreased. This would suggest that at stage 3 the teachers still had detailed
instructions but spent less time in feedback, counting, giving directions, and questioning.
This allowed more time for the choirs to sing.
Teachers spent more time in approvals in stage 1. Disapprovals showed little
change across the stages. This might indicate that teachers were trying to establish a
positive, reinforcing rehearsal atmosphere to start the new school year and music.

105
Teachers did the most vocal modeling during stage 2 and the least during stage 1.
This might indicate that their modeling goals were less toward pitches and rhythms and
more toward expressive musical concepts of phrase shape and articulations. During stage
3 the teachers spent less time modeling. This is consistent with more choir singing time in
stage 3. It could also mean that the teachers felt the choirs were singing correctly and
would no longer benefit from more modeling.
There was a decrease in cognitive language by stage (33.5%,31.1 %, and 28.7%).
There were decreases in remember a fact (tl a), understand a fact (t2a), and analyze a fact
(t4a). Analyze a skill (t4c) was greatest during stage 1. Apply a skill (t3c) was
approximately the same for all three stages (see Figure 4.7). The greater percentage of
cognitive language in the early stages was due to focusing on learning factual infoTInation
at the remember, understand, and analyze levels.
The work on research questions three and four yielded a three-dimensional view
of the teacher (see Figures 4.10,4.12 - 4.17). The controlling factors of this view were
the cognitive content of teacher presentation, questioning, and specific feedback. This
topographic view might represent a unique cognitive signature for expert teachers.
Research Question 4: Do directors challenge students to think within the higher cognitive
levels ofanalyze, evaluate, and create?
In retrospect, there was a problem with this question. It was based on the original
Bloom's taxonomy, a one-dimensional model, and did not take into account the two
dimensional revised taxonomy.

106
The revised taxonomy (Table 1.1) presents at least three ways to define higher
order cognitive levels or thinking. First, higher-order thinking could be cognitive tasks
that go beyond remember, understand, and apply. This definition focuses on taxonomy
columns four, five, and six. This aligns with the original Bloom's taxonomy and the
wording of research question four. Second, higher order thinking can be defined as
leaving factual and conceptual thinking, and moving into procedural and metacognitive
thinking. This focuses on moving from taxonomy rows a and b toward rows c and d. And
the third combines the first two definitions by seeing higher order thinking as the lower
right comer of the taxonomy where analyze, evaluate, and create meet procedural and
metacognitive. This third view combines the first and second definitions and focuses on
the intersection of columns four, five, and six with rows c and d.
Applying definition one, the cognitive language of our directors was 31 % of all
director talk and was composed of 16.2% higher level thinking and 15.1 % lower level
(see Table 4.18). The directors did challenge students in higher cognitive levels.
Teacher modeling was identified as asking students to analyze a skill or procedure
(Hanna, 2007). Modeling is an active exchange between teacher and class. Modeling
requires the students to pay careful attention to the teacher, analyze the teacher model in
order to compare with their own techniques, and to apply changes. As such, modeling
was codcd as analyze a skill (t4c) and represented higher order thinking by all three
definitions. However, modeling could well have been placed into the category t3c (apply
a skill), dramatically changing some of the interpretation of these results, since it was the
bulk of the activity labeled analyze (see Figure 4.6). Modeling composed the largest
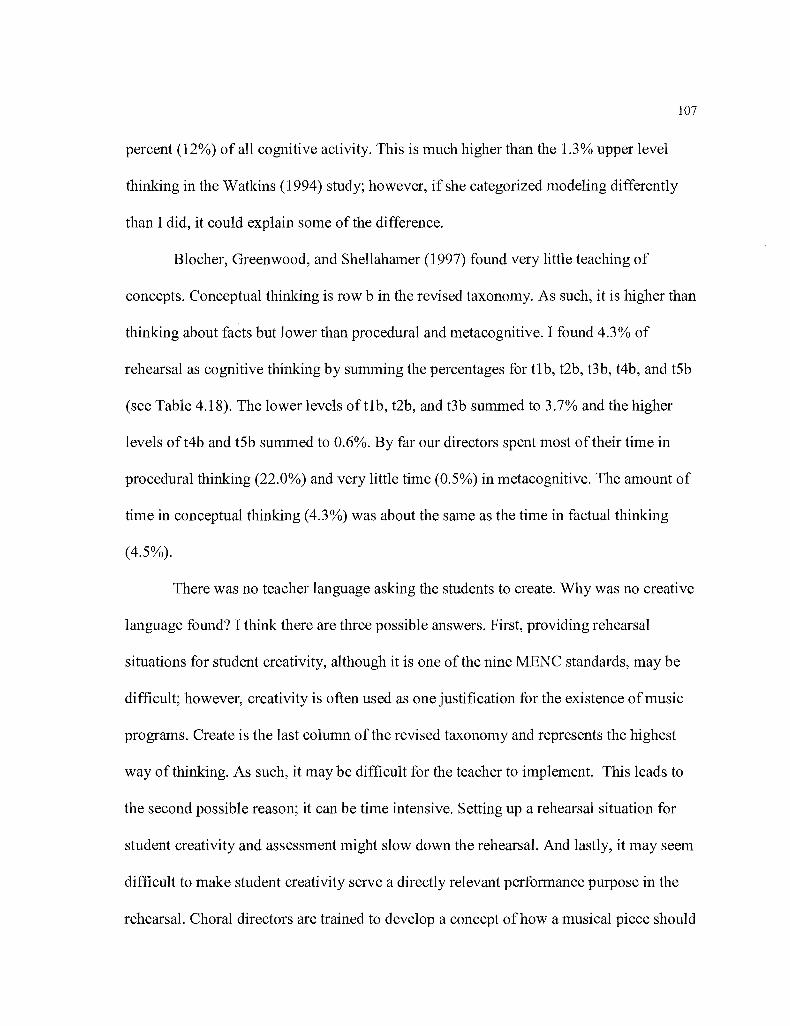
107
percent (12%) of all cognitive activity. This is much higher than the 1.3% upper level
thinking in the Watkins (1994) study; however, if she categorized modeling differently
than I did, it could explain some of the difference.
Blocher, Greenwood, and Shellahamer (1997) found very little teaching of
concepts. Conceptual thinking is row b in the revised taxonomy. As such, it is higher than
thinking about facts but lower than procedural and metacognitive. I found 4.3% of
rehearsal as cognitive thinking by summing the percentages for t1 b, t2b, t3 b, t4b, and t5b
(see Table 4.18). The lower levels oft1b, t2b, and t3b summed to 3.7% and the higher
levels oft4b and t5b summed to 0.6%. By far our directors spent most oftheir time in
procedural thinking (22.0%) and very little time (0.5%) in metacognitive. The amount of
time in conceptual thinking (4.3%) was about the same as the time in factual thinking
(4.5%).
There was no teacher language asking the students to create. Why was no creative
language found? I think there are three possible answers. First, providing rehearsal
situations for student creativity, although it is one of the nine MENC standards, may be
difficult; however, creativity is often used as one justification for the existence of music
programs. Create is the last column of the revised taxonomy and represents the highest
way of thinking. As such, it may be difficult for the teacher to implement. This leads to
the second possible reason; it can be time intensive. Setting up a rehearsal situation for
student creativity and assessment might slow down the rehearsal. And lastly, it may seem
difficult to make student creativity serve a directly relevant performance purpose in the
rehearsal. Choral directors are trained to develop a concept of how a musical piece should
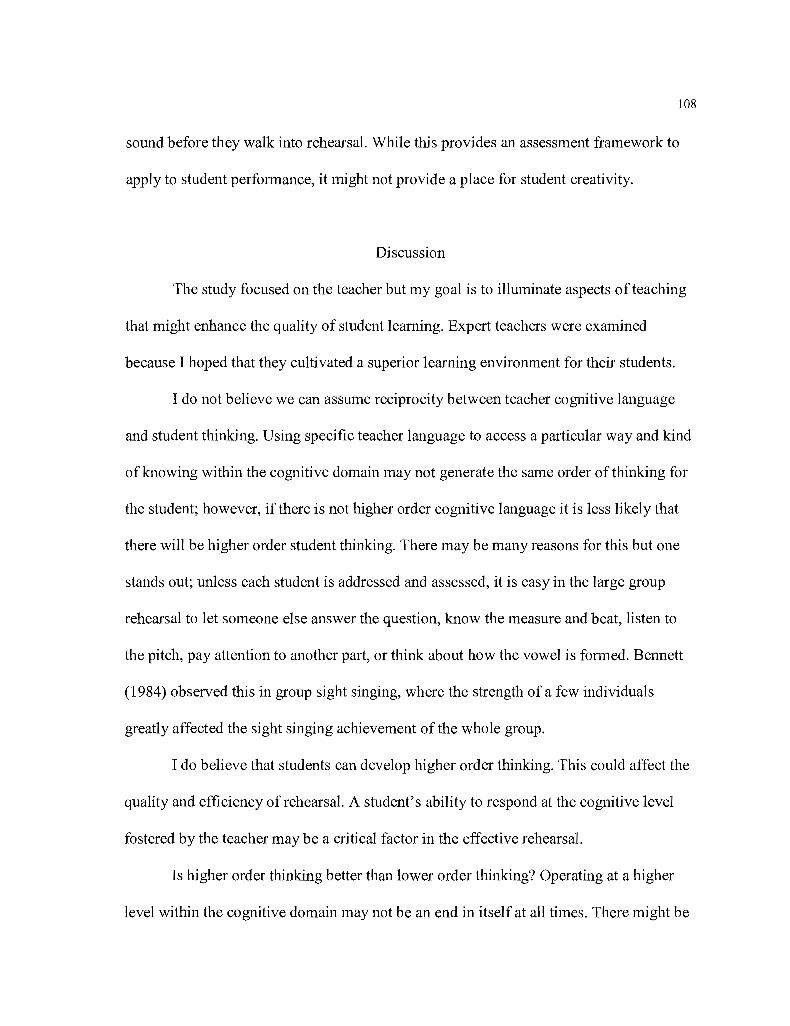
108
sound before they walk into rehearsal. While this provides an assessment framework to
apply to student performance, it might not provide a place for student creativity.
Discussion
The study focused on the teacher but my goal is to illuminate aspects of teaching
that might enhance the quality of student learning. Expert teachers were examined
because I hoped that they cultivated a superior learning environment for their students.
I do not believe we can assume reciprocity between teacher cognitive language
and student thinking. Using specific teacher language to access a particular way and kind
of knowing within the cognitive domain may not generate the same order of thinking for
the student; however, if there is not higher order cognitive language it is less likely that
there will be higher order student thinking. There may be many reasons for this but one
stands out; unless each student is addressed and assessed, it is easy in the large group
rehearsal to let someone else answer the question, know the measure and beat, listen to
the pitch, pay attention to another part, or think about how the vowel is formed. Bennett
(1984) observed this in group sight singing, where the strength of a few individuals
greatly affected the sight singing achievement of the whole group.
1do believe that students can develop higher order thinking. This could affect the
quality and efficiency of rehearsal. A student's ability to respond at the cognitive level
fostered by the teacher may be a critical factor in the effective rehearsal.
Is higher order thinking better than lower order thinking? Operating at a higher
level within the cognitive domain may not be an end in itself at all times. There might be
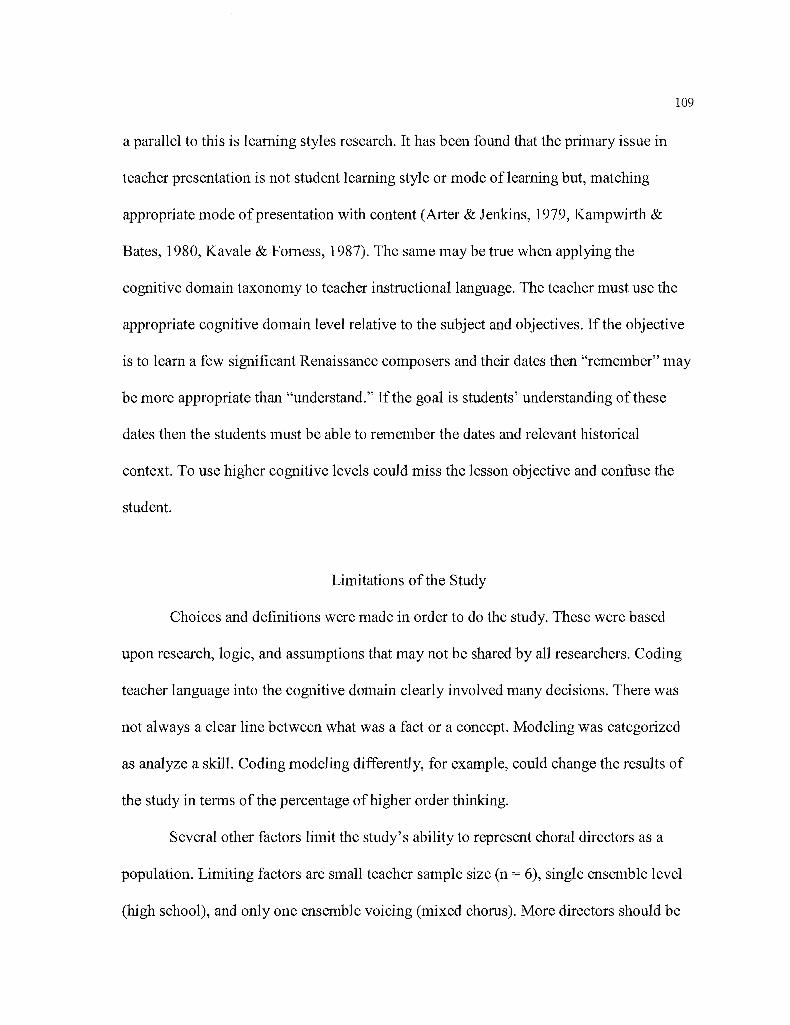
109
a parallel to this is learning styles research. It has been found that the primary issue in
teacher presentation is not student learning style or mode ofleaming but, matching
appropriate mode ofpresentation with content (Arter & Jenkins, 1979, Kampwirth &
Bates, 1980, Kavale & Forness, 1987). The same may be true when applying the
cognitive domain taxonomy to teacher instructional language. The teacher must use the
appropriate cognitive domain level relative to the subject and objectives. Ifthe objective
is to learn a few significant Renaissance composers and their dates then "remember" may
be more appropriate than "understand." If the goal is students' understanding of these
dates then the students must be able to remember the dates and relevant historical
context. To use higher cognitive levels could miss the lesson objective and confuse the
student.
Limitations of the Study
Choices and definitions were made in order to do the study. These were based
upon research, logic, and assumptions that may not be shared by all researchers. Coding
teacher language into the cognitive domain clearly involved many decisions. There was
not always a clear line between what was a fact or a concept. Modeling was categorized
as analyze a skill. Coding modeling differently, for example, could change the results of
the study in telIDS of the percentage of higher order thinking.
Several other factors limit the study's ability to represent choral directors as a
population. Limiting factors are small teacher sample size (n ::= 6), single ensemble level
(high school), and only one ensemble voicing (mixed chorus). More directors should be

110
studied with ensembles at other levels and voicings. Clearly, more research is needed to
clarify these issues.
Implications for Further Study
Many questions arise from this study. We should explore the types and quantities
of singer thinking during rehearsal and performance. More study of the teacher cognitive
signature or topography could yield data influencing teacher training and assessment. It
might be helpful to discover the cognitive signature of expert teachers and directors. A
related question would be whether there are different cognitive signatures of directors
teaching select versus nonselect choirs.
Directors make decisions about how to interpret music to create an aesthetic
performance. But, as an educator, these decisions are only the beginning. The director
must then decide how to implement these ideas into each rehearsal moment. Some
directors rehearse their ensembles until cvcry performance nuance is completely
memorized. This can create wonderful performances where conductors need only convey
simple temporal cues and interpretive reminders to ensembles. Docs memorizing nuance
mean the students understand the principles behind these interpretive choices and thus
operate at higher cognitive levels? Other ensembles could give equally expressive
performances by applying the principles and skills of expressive singing without
memorizing every nuance in advance. Future studies could help detennine how students
think during rehearsal and performance.

111
Many cognitive levels appeared in small quantities and some were not observed at
all. How many minutes of rehearsal are needed to create a cognitive signature for a
director? Was three hours per director enough? It is possible that a larger sample would
reveal the presence of more cognitive levels. Future studies could determine the
resolution needed to get reliable results. This could lead to the comparison of the
cognitive signature of expert and novice teachers. The cognitive signature could enable
novice teachers to develop language and rehearsal skills for effective teaching. Cognitive
signature analyses could provide teacher assessment tools.
How would college directors compare to our high school directors? A question
related to this would be "do select choir rehearsals look different than nonselect choirs?"
We might find that college choirs spend even less time teaching concepts and employing
higher order thinking. This could be due to directors selecting skilled singers who already
know the fundamentals and many advanced concepts and skills.
Implications for Teaching
Given the paucity of higher-order thinking found in this study, teachers should
consider ways to introduce it in rehearsals. They can challenge students to evaluate and
create. The teacher could, for example, model two ways and ask students which is better
(evaluation). The director could direct a section of a song using two dynamic
interpretations and ask students to judge which is more appropriate. Students could be
grouped in duets or trios for peer assessment and evaluation.

112
Students could be asked to create a different model. Students could lead a group
with their ideas for dynamic shape of a phrase by simply raising and lowering their hands
while the director conducted the tempo.
We should ask more questions. Teacher questioning revealed diverse cognitive
content (see Figure 4.16). Asking the question, allowing time for student response, and
giving quality feedback (sequential pattern of music instruction) may take time and slow
down the rehearsal pace, but could result in more efficient and deeper student learning
and ultimately save rehearsal time.
Ensemble directors can become overly focused on the singular product of
performing a particular work and give insufficient attention to the process and concepts.
The stage by stage analysis in chapter four indicated that we may be creatures ofhabit. It
is possible that our concept of rehearsal is limited to repeating the same rehearsal
processes with little variation. Thinking about the cognitive content of our language and
stretching ourselves to higher order thinking might invigorate us and provide our
rehearsals with more variety of activity and cognitive involvement.
Conclusion
This study has presented a view of the language of experienced choral educators.
This view created a topographic landscape of rehearsal activity and cognitive content.
More work in building and defining this cognitive topography or signature may help to
identify key characteristics of music teachers. One possible consequence of work in this
area could be a dynamic view ofkey features of a teaching style over time. This set of

113
time lapse images could expose new information. A fundamental result would reveal how
the teacher's skills and emphases change over time. These changes could be in response
to teacher training or classroom stimuli. The topographic signature could provide a
quantitative basis for comparison of teacher styles and characteristics. These results could
facilitate advances in teacher training and assessment.
It is critical to advancement in music education research that we continue to
investigate how to describe what might be good teaching. Further, results of the study
have application to teacher training and teacher assessment. This will enable educators to
speak in scientific detail about the cognitive tools applied in the choir rehearsal setting.
The teachers that participated in this study created rehearsals with almost even amounts
of task presentation and student response. Teacher task presentation, questioning, and
feedback were rich with cognitive content.

114
APPENDIX A
INFORMED CONSENT FORM
You are invited to participate in a research study conducted by Matthew Lynn Strauser,
from the University of Oregon department of Music and Dance. The purpose of this study
is to learn more about the high school choral director's use oflanguage. This study will
collect, parse, classify, and analyze the language of high school choral directors. This
process will help us to better understand what kinds of statements choir directors make
during a rehearsal. Specifically, this study will reveal into which instructional domain the
director's language fits, the kinds of knowledge being used, and the cognitive processes
that are employed. You were selected as a possible participant in this study because you
have demonstrated expert skill as a choral director as demonstrated by your participation
in at least three out of the last five years at the OSAA State Choral Championships.
If you decide to participate, you will be asked to audio record parts of your rehearsal.
Specifically you will be asked to audio record two songs from the time the songs are new
to the choir until just before the songs are performed in concert. This is approximately 30
or 40 minutes of each rehearsal. There should be no risk to you as a participant in this

115
study. However, I cannot guarantee that you personally will receive any benefits from
this research and there is no financial compensation.
Any infonnation that is obtained in connection with this study and that can be identified
with you will remain confidential and will be disclosed only with your pennission.
Subject identities will be kept confidential by coding the recorded text without reference
to the identity of the director.
Your participation is voluntary. Your decision whether or not to participate will not affect
your relationship with your school of employment or the researcher. If you decide to
participate, you are free to withdraw your consent and discontinue participation at any
time without penalty.
Participant's Consent:
I have received an adequate description of the purpose and procedures for audio
recording sessions during the course of the proposed research study. I give my consent to
be audio recorded during participation in the study, and for those audio recordings to be
listened to by persons involved in the study, as well as for other professional purposes,
including transcription of text and time durations, as described to me. I understand that all
infonnation will be kept confidential and will be reported in an anonymous fashion, and
that the audio recordings will be erased after an appropriate period of time after the

completion of the study. I further understand that I may withdraw my consent at any
time.
Print Name-----------------~-~----
Signature of participant
Date----
Do you have a masters degree: Yes No
How many years have you been teaching music?---
How many years have you taught in your current position? _
How many years has your choir gone to OSAA stage during the last five years? __
A copy of this consent fonn will be given to the participant.
If you have any questions, please feel free to contact Matthew L. Strauser, (503) 589
8167, [email protected] or his advisor: Dr. Harry E. Price, (541) 346-3777,
[email protected] of the University of Oregon School of Music and Dance.
116
If you have questions regarding your rights as a research subject, contact the Office for
Protection of Human Subjects, University of Oregon, Eugene, OR 97403, (541) 346
2510.
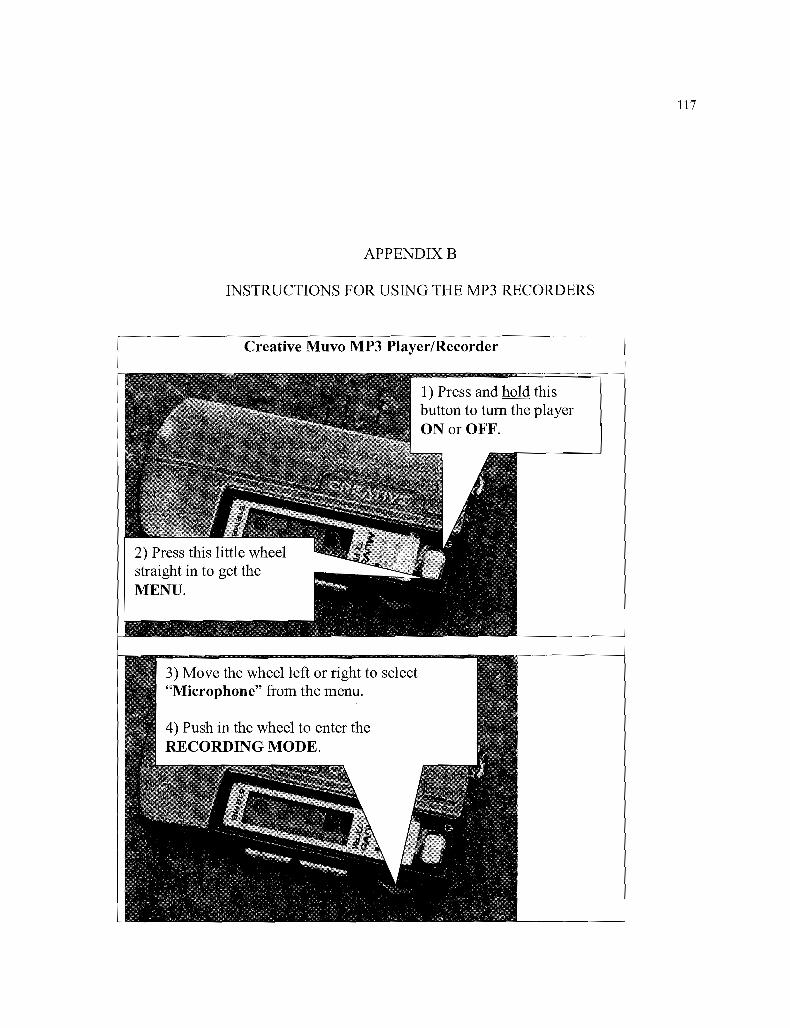
APPENDIXB
INSTRUCTIONS FOR USING THE MP3 RECORDERS
Creative Muvo MP3 Player/Recorder
117
2) Press this little wheelstraight in to get theMENU.
1) Press and hold thisbutton to turn the playerON or OFF.

5) Push this button to START or STOP recording.
6) Make sure the counter is counting. In the photo the counter shows 9seconds of a recording in progress.
118
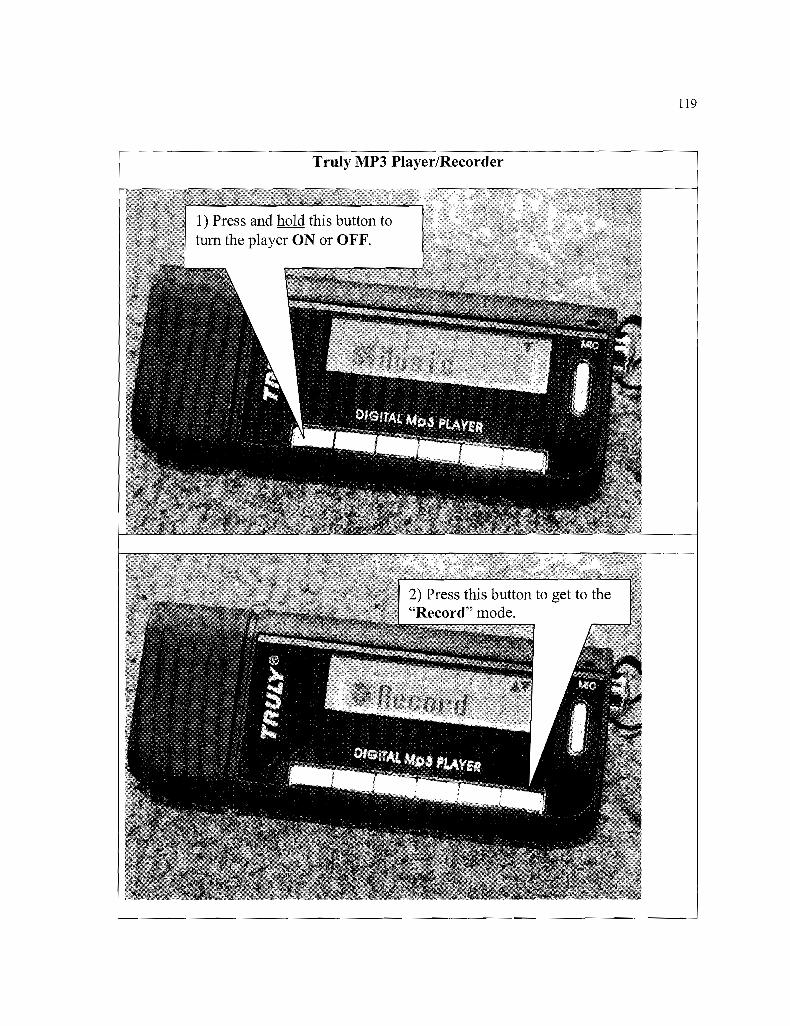
Truly MP3 Player/Recorder
119

4) Make sure the counteradvances. This shows a 26second recording inprogress.
3) Briefly press this button to STARTrecording. Press again to PAUSE or RESUMErecording.
120

Mambo MP3 Player/Recorder
121
1) Press and hold this button to tum the player ON orOFF. If the player looks like the photo in step 4, thengo to step 4.
Note: If you do not see this menu then pressingand holding this button (M) will bring you to themenu. If the player is already in the RECORDmode then you are already there and you can goto step 4.
2) If you are not in theRECORD mode thenpress this button to getto the "Record" menuselection. If you arealready in RECORDmode then skip to step 4.

4) Briefly press this button to START recording. If you briefly press itagain it will pause recording. Another briefpress will resume recording.
5) Make sure the counteradvances. This shows a 12second recording inprogress.
122

APPENDIXC
USINGR
What is R?
R (2008) is a powerful open source statistics program that runs on windows, mac, and
linux. The data was collected in an Excel spreadsheet.
Getting Data into R
The spreadsheet data was copied to the Windows clipboard and then copied to an R
dataframe using this command:
t <- read.table(" clipboard", header=TRUE)
Sample Hypothetical Data from Dataframe t
Ti Ndex N Teacher Song Rehearsal Stage Recording Time Duration B C
1 1 0 ta songa reh1 stage1 rec01 0.00 3.27 2c 1m
2 2 1 ta songa reh1 stage1 rec01 3.27 16.57 1a 1q
3 3 2 ta songa reh1 stage1 rec01 19.84 1.40 z 2v4 4 3 ta songa reh1 stage1 rec01 21.24 2.38 3c 3vas5 5 4 ta songa reh1 stage1 rec01 23.63 9.04 1a 1q
6 6 5 ta songa reh1 stage1 rec01 32.66 4.56 z 1d
7 7 6 ta songa reh1 stage1 rec01 37.22 4.92 z 2nv8 8 7 ta songa reh1 stage1 rec01 42.14 1.67 z 1d
9 9 8 ta songa reh1 stage1 rec01 43.81 21.60 z 2nv10 10 9 ta songa reh1 stage1 rec01 65.41 0.73 z 1e
11 11 10 ta songa reh1 stage1 rec01 66.14 1.46 2a 1m
123

124
Describing Data Structures in R
The str(t) command shows the structure of dataframe t (see Table AR.2).
str(t)
'data.frame': 9989 obs. of 12 variables:
$ Ti
$ Ndex
$N
: int 1 2 3 4 5 6 7 8 9 10 ...
: int 1 2 3 4 5 6 7 8 9 10 .,.
: int 0 1 2 3 4 5 6 7 8 9 ...
$ Teacher: Factor wi 61evels "ta","tb","tc",.. : 1 1 1 1 1 1 1 1 1 1 ...
$ Song : Factor wi 2 levels "songa","songb": 1 1 1 1 1 1 1 1 1 1 .. ,
$ Rehearsal: Factor wi 6 levels "reh1 ","reh2", .. : 1 1 1 1 1 1 1 1 1 1 ...
$ Stage : Factor wi 3 levels "stage I","stage2", .. : 1 1 1 1 1 1 1 1 1 1 ...
$ Recording: Factor wi 12 levels "rec01 ", "rec02", .. : 1 1 1 1 1 1 1 1 1 1 ...
$ Time : num 0.00 3.2719.8421.2423.63 .
$ Duration: num 3.27 16.57 1.40 2.38 9.04 .
$ B : Factor wi 20 levels "la","lb","lc",.. : 20 72020 11 2020202020 ...
$ C : Factor wi 15 levels "lc","ld","le", .. : 2 6 10 11 628283 ...
Working with Data in R
Using the attach(t) command made it possible to access the t dataframe structural objects
with using the "t$" access modifier. All of the following examples assume that t has been
attached to the current R session.

125
Means and sums for columns Band C by factor were calculated using:
agg.sum.t <- aggregate(Duration, list(seq=C, st=Stage, teach=Teacher), sum)
agg.mean.t <- aggregate(Duration, list(seq=C, st=Stage, teach=Teacher), mean)
These commands calculated sums and means for the durations of C events by stage and
by teacher.
Sums and means by stage for factor B were calculated using:
agg.mean.b.stage.t <- aggregate(Duration, list(seq=B, st=Stage), mean)
agg.sum.b.stage.t <- aggregate(Duration, list(seq=B, st=Stage), sum)
Overall sums and means for factor B were calculated using:
mean.b <- aggregate(Duration, list(seq=B), mean)
sum.b <- aggregate(Duration, list(seq=B), sum)
mean.st.b <- aggregate(Duration, list(seq=B, st=Stage), mean)
sum.st.b <- aggregatc(Duration, list(seq=B, st=Stage), sum)
mean.st.c <- aggregate(Duration, list(seq=C, st=Stagc), mean)
sum.st.c <- aggregate(Duration, list(seq=C, st=Stage), sum)
This command totaled the durations of each recording for each stage and teacher:
sum.st.r.t <- aggregate(Duration, list(st=Stage, r=Recording, t=Teacher), sum)

126
Descriptive statistics for each of thc factors were generated by first creating a list of the
factor's duration data and then creating five number statistics using the R summaryO
command.
Commands such as these were used to split the data into a list ofduration values the B
and C factors:
durld <- Duration[C == "Id"]
durle <- Duration[C == "Ie"]
durc1a <- Duration[B == "la"]
durc1b <- Duration[B == "Ib"]
The summaryO command generated descriptive statistics:
summary(durld)
summary(durle)
summary(durc1a)
summary(durcIb)
Variance and standard deviation then become:
var(durld)
sqrt(var(durId))
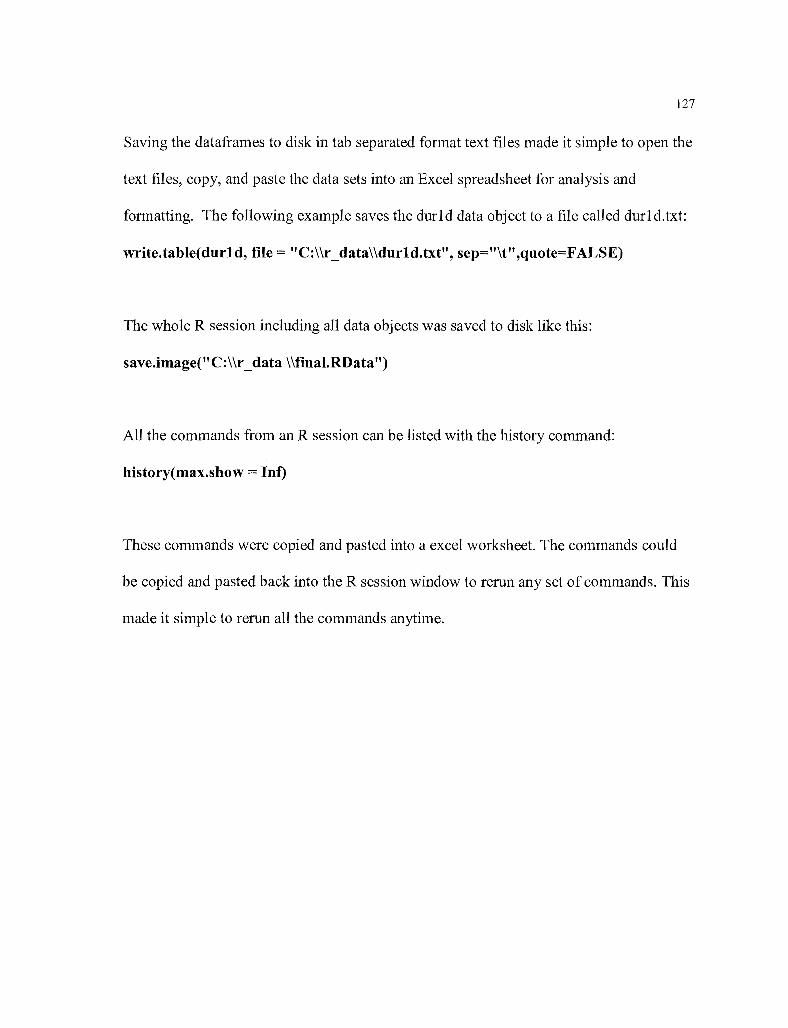
127
Saving the dataframes to disk in tab separated format text files made it simple to open the
text files, copy, and paste the data sets into an Excel spreadsheet for analysis and
formatting. The following example saves the durld data object to a file called durld.txt:
write.table(durld, file = "C:\\r_data\\durld.txt", sep="\t",quote=FALSE)
The whole R session including all data objects was saved to disk like this:
save.image("C:\\r_data \\final.RData")
All the commands from an R session can be listed with the history command:
history(max.show = Int)
These commands were copied and pasted into a excel worksheet. The commands could
be copied and pasted back into the R session window to rerun any set of commands. This
made it simple to rerun all the commands anytime.

128
REFERENCES
Adobe (2003). Audition. Adobe Systems Incorporated. San Jose, CA.http://www.adobe.com/.
Anderson, L. W., & Krathwohl, D. (2001). A Taxonomy for Learning, Teaching andAssessing: A Revision ofBloom's Taxonomy ofEducational Objectives. NewYork: Longman.
Arter, J. A. and Jenkins, 1. A. (1979). Differential diagnosis-prescriptive teaching: Acritical appraisal. Review ofEducational Research, 49, 517-555.
Authur, J. R. (2002). Experienced teachers use oftime in choral rehearsals ofbeginningand advanced choirs. Unpublished doctoral dissertation, Florida State University.Retrieved November 8, 2005 from http://etd.lib.fsu.edu/theses/available/etd03132003 -1623 09/unrestricted/01jra.pdf.
Bennett, P. (1984). Are we tricking ourselves into thinking our students are readingmusic? Indiana Musicator, 39(2), 12-13.
Blocher, L., Greenwood, R., & Shellahamer, B. (1997). Teaching behaviors of middleSchool and high school band directors in the rehearsal setting. Journal ofResearch in Music Education, 45(3),457-469.
Bloom, B. S., Engelhart, M. D., Furst, E. J., Hill, W. H., & Krathwohl, D. R. (1956).Taxonomy ofeducational objectives, handbook 1 Cognitive domain. New York:McKay.
Byo, J. (1994). Tracing the evolution of a research line: The role of sequential patterns instructuring the rehearsal. Journal ofthe World Association for Symphonic Bandsand Ensembles, 1,67-79.
Caldwell, W.M., Jr. (1980). A time analysis ofselected musical elements and leadershipbehaviors ofsuccessful high school choral conductors. Unpublished doctoraldissertation, The Florida State University, Tallahassee, Florida.
129
Creative Labs (2006). Muvo 512 MB MP3 Player/Recorder. http://us.creative.com.
Davis, A. P. (1998). Performance achievement and analysis of teaching during choralrehearsals. Journal ofResearch in Music Education, 46(4),496-509.
Duke, R. A., Prickett, C. A., & Jellison, 1. A. (1998). Empirical description of the pace ofmusic instmction. Journal ofResearch in Music Education, 46(2), 265-280.
Elliott, D. (1995). Music Matters: A New Philosophy ofMusic Education. New York:Oxford University Press.
Gonzo, C. L. (1977). Metaphoric behavior in choral conducting. The Choral Journal, 17,No.7 (March), 8-12.
Goodlad, J. (1984). A place called school: Prospects for the future. New York: McGrawHill.
Goolsby, T. W. (1996). Time use in instmmental rehearsals: A comparison ofexperienced, novice and student teachers. Journal ofResearch in MusicEducation, 44(4),286-303.
Goolsby, T. W. (1997). Verbal instruction in instrumental rehearsal: A comparison ofthree career levels and preservice teachers. Journal ofResearch in MusicEducation, 45(1),21-40.
Grimland, F. H. (2001). Characteristics ofteacher directed modeling evidenced in thepractices ofthree experienced high school choral directors. Unpublished doctoraldissertation, University of North Texas, Denton, Texas.
Gumm, A. J. (1993). The development of a model and assessment instrument of choralmusic teaching styles. Journal ofResearch in Music Education, 41(3), 181-199.
Gundersen, G. & Williams, 1. M. (1998). Rehearsal pacing of expert middle school, highschool, and university choral and instrumental conductors. Texas MusicEducators Association. 33-38. Retrieved November 9, 2005 fromhttp://www.tmea.orgl080_College/ResearchlGun1998.pdf.
Hanna, W. (2007). The new Bloom's taxonomy: Implications for music education. ArtsEducation Policy Review, 108(4),7-16.
Java (2006). Java Developers Kit. Sun Microsystems. Santa Clara, CA.http://java.sun.com!.
130
Kaiser (2006). Mambo MP3 Player. Kaiser Corporation. http://www.kasercorp.com.
Kampwirth, T. J. and Bates, M. (1980). Modality preference and teaching method. Areview of the research. Academic Therapy, 15, 597-605.
Kavale, K A. and Forness, S. R. (1987). Substance over style: Assessing the efficacy ofmodality testing and teaching. Exceptional Children, 54(3),228-239.
Kvet, E., Watkins, R. (1993). Success Attributes in Teaching Music as Perceived byElementary Education Majors. Journal ofResearch in Music Education, 41 (1),70-80.
Lindeman, Carolyn A., et al. (1998). A research agendafor music education. RetrievedOctober 23, 2006 from http://www.menc.org/information/research/agenda.html#research. MENC
Maclin, J.P. (1993). The effect of task analysis on sequential patterns on musicinstruction. Journal o.[Research in Music Education, 41(1),48-56.
Madsen, C. H., & Madsen, C. K. (1998). Teaching/Discipline (4th ed.). Boston,Massachusetts: Allyn and Bacon, Inc.
Madsen, C. K, & Duke, R. A. (1985). Perception of approval/disapproval in musiceducation. Bulletin 0.[the Councilfor Research in Music Education, 85(fall), 119130.
Madsen, C. K, & Geringer, J.M. (1989). The relationship of teacher "on task" tointensity and effective teaching. Canadian Journal 0.[Research in MusicEducation, 30,87-94.
Madsen, C. K., Standley, J. M., & Cassidy, J. W. (1989). Demonstration and recognitionof high and low contrasts in teacher intensity. Journal o.[research in musiceducation, 37(2), 85-92.
NASB. (1995). The new American standard Bible. La Habra CA: The LockmanFoundation.
MENC. (1994) The school music program: A new vision. The K-12 National Standards,PreK Standards, and What They Mean to Music Educators. Reston, VA: MusicEducators National Conference.
Moore, R. S. (1976). Effect of differential teaching techniques on achievement, attitudeand teaching skills. Journal 0.[Research in Music Education, 24(3), 129-141.

131
Pence, S. M. (1999). An Analysis of Time use in the choral rehearsals of expert, novice,and student teachers. Texas Music Educators Association. 71-78. RetrievedNovember 9,2005 from http://www.tmea.org/080_College/Research/Pen1999.pdf.
Price, H. E. (1983). Effect of Conductor Academic Task Presentation, ConductorReinforcement, and Ensemble Practice on Performers' Music Achievement,Attentiveness, and Attitude, The. Journal ofResearch in Music Education, 31(4),245-257.
Price, H. E. (1992). Sequential patterns ofmusic instruction and learning to use them.Journal ofResearch in Music Education, 40(1), 14-29.
Price, H. E., & Yarbrough, C. M. (1994). Effect of scripted sequential patterns ofinstruction in music rehearsals on teaching evaluations by college non-musicstudents. Bulletin ofthe Council for Research in Music Education, 119, 170-178.
R Development Core Team (2008). R: A language and environment for statisticalcomputing. R. Foundation for Statistical Computing, Vienna, Austria. ISBN 3900051-07-0, URL http://www.R-project.org.
Reimer, B. (1989). A Philosophy ofMusic Education. Second Edition. Englewood Cliffs,NJ: Prentice-Hall, Inc.
Risner, G., Nicholson, J. I., & Webb, B. (2000). Cognitive levels ofquestioningdemonstrated by new social studies textbooks: What the future holds forelementary students. Paper presented at the annual meeting of the Mid-southeducational research association, Bowling Green, KY, Nov. 15-17,2000. (ERICDocument Reproduction Service No. ED448108).
Risner, G., Skeel, D., & Nicholson, 1. (1992). A closer look at textbooks. Science andChildren, 1(30),42-45.
Teachout, D. J. (1997). Preservice and experienced teachers' opinions of skills andbehaviors important to successful music teaching. Journal ofResearch in MusicEducation, 45(1),41-50.
Thurman, V. L. (1977). A frequency and time description of selected rehearsal behaviorsused by five choral conductors. (Doctoral dissertation, University of Illinois,1977). Dissertation Abstracts International, 38(3135A), 765.

132
Truly (2006), Truly Digital MP3 Player. Truly Electronics Manufacturing Limited.http://www.truly.net.
Wagner, M. J., & Strul, E. P. (1979). Comparisons of beginning versus experiencedelementary music educators in the use of teaching time. Journal ofResearch inMusic Education, 27(2), 113-125.
Watkins, R. C. (1994). Nonperformance time use in high school choral rehearsals: Afollow-up study. Texas Music Educators Association. 1-6. Retrieved November 9,2005 from http://www.tmea.org/080_College/Research/Wat1994.pdf.
Witt, A. C. (1986). Use of class time and student attentiveness in secondary instrumentalrehearsals. Journal ofResearch in Music Education, 34(1),34-42.
Yarbrough, C. (1975). Effect of Magnitude of Conductor Behavior on Students inSelected Mixed Choruses. Journal ofResearch in Music Education, 23(2), 134146.
Yarbrough, c., & Hendel, C. (1993). The effect of sequential patterns on rehearsalevaluations and high school and elementary students. Journal ofResearch inMusic Education, 41(3),246-257.
Yarbrough, C., & Madsen, K. (1998). The evaluation of teaching in choral rehearsals.Journal ofResearch in Music Education, 46(4),469-481.
Yarbrough, c., & Price, H. (1989). Sequential patterns of instruction in music. Journal ofResearch in Music Education, 37(3), 179-187.
Yarbrough, c., Hendel, C., & Price, H. (1994). The effect of sequential patterns andmodes ofpresentation on the evaluation of music teacher. Bulletin ofthe Councilfor Research in Music Education, 120(spring), 33-45.
Yarbrough, C., Price, H., & Bowers, J. (1991). The effect of knowledge of research onrehearsal skills and teaching values of experienced teachers. Update: ApplicationsofResearch in Music Education, 9(2), 17-20.