the cold man of europe – 2015 - ace€¦ · the cold man of europe – 2015 ... it is the poor...
TRANSCRIPT

COLD MAN OF EUROPE 2015 UPDATE October 2015
Association for the Conservation of Energy | briefing 1
Westgate House 2a Prebend Street London N1 8PT
020 7359 8000 [email protected]
The Cold Man of Europe – 2015 How the UK’s housing performs against comparable European countries in terms of
fuel poverty and energy efficiency. Written by Pedro Guertler, Jack Carrington and
Antonia Jansz
Summary This briefing compares the state of the UK housing stock and fuel poverty levels with 15 other European
countries. It concludes that no other country of the 16 assessed performed as poorly overall as the UK
across the range of indicators. The UK has among the highest rates of fuel poverty and one of the most
energy inefficient housing stocks in Europe.
Despite the fact that it has amongst the lowest energy prices, the UK ranks very poorly in terms of the
affordability of space heating (it ranks last out of 16) and fuel poverty (ranking 14th).
It is the poor state of our housing stock that is the main cause of these problems. In terms of households
reporting that their home is in a poor state of repair, the UK ranks 12th out of 16.
In terms of energy efficiency, out of 11 countries for which data is available, the UK’s walls are ranked
7th, roofs are ranked 8th, floors are ranked 10th and windows are ranked 11th.
The key results are shown in Table 1 below. The latest official European data are used for this briefing,
and the UK’s performance compared to a previous assessment two years ago1.
1 http://www.ukace.org/2013/03/fact-file-the-cold-man-of-europe/
COLD MAN OF EUROPE 2015 UPDATE October 2015
Association for the Conservation of Energy | briefing 2
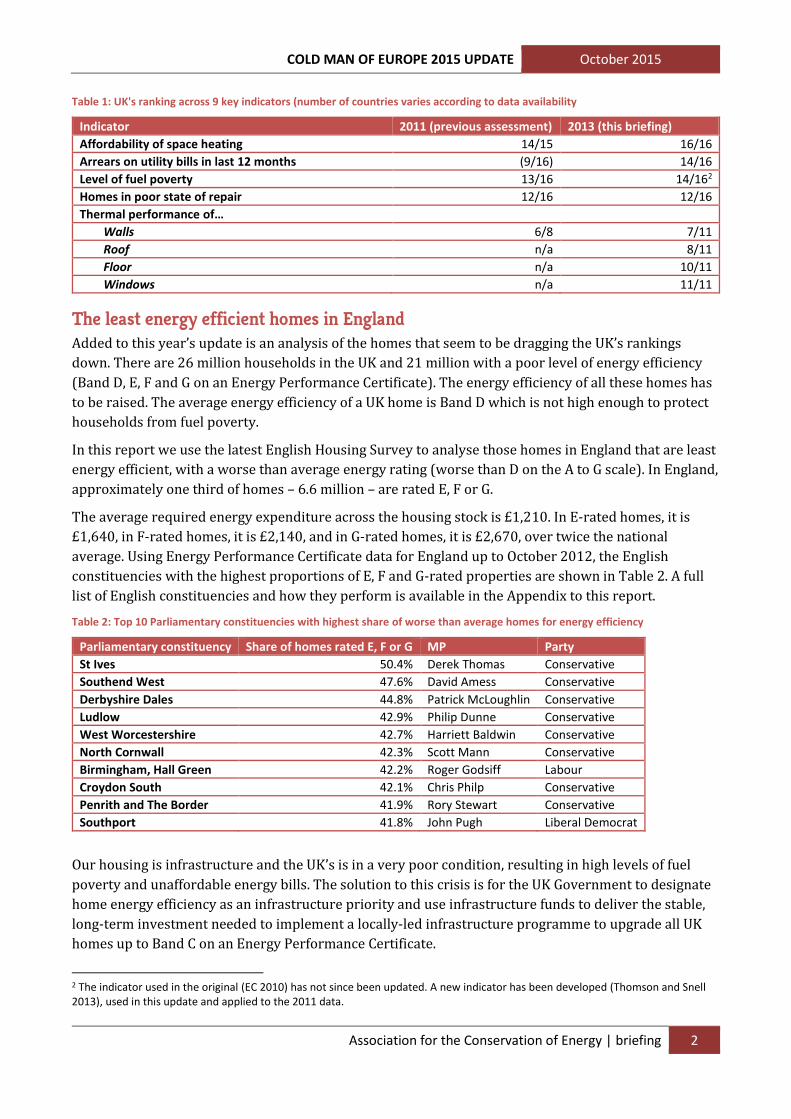
Table 1: UK's ranking across 9 key indicators (number of countries varies according to data availability
Indicator 2011 (previous assessment) 2013 (this briefing)
Affordability of space heating 14/15 16/16
Arrears on utility bills in last 12 months (9/16) 14/16
Level of fuel poverty 13/16 14/162
Homes in poor state of repair 12/16 12/16
Thermal performance of…
Walls 6/8 7/11
Roof n/a 8/11
Floor n/a 10/11
Windows n/a 11/11
The least energy efficient homes in England Added to this year’s update is an analysis of the homes that seem to be dragging the UK’s rankings
down. There are 26 million households in the UK and 21 million with a poor level of energy efficiency
(Band D, E, F and G on an Energy Performance Certificate). The energy efficiency of all these homes has
to be raised. The average energy efficiency of a UK home is Band D which is not high enough to protect
households from fuel poverty.
In this report we use the latest English Housing Survey to analyse those homes in England that are least
energy efficient, with a worse than average energy rating (worse than D on the A to G scale). In England,
approximately one third of homes – 6.6 million – are rated E, F or G.
The average required energy expenditure across the housing stock is £1,210. In E-rated homes, it is
£1,640, in F-rated homes, it is £2,140, and in G-rated homes, it is £2,670, over twice the national
average. Using Energy Performance Certificate data for England up to October 2012, the English
constituencies with the highest proportions of E, F and G-rated properties are shown in Table 2. A full
list of English constituencies and how they perform is available in the Appendix to this report.
Table 2: Top 10 Parliamentary constituencies with highest share of worse than average homes for energy efficiency
Parliamentary constituency Share of homes rated E, F or G MP Party
St Ives 50.4% Derek Thomas Conservative
Southend West 47.6% David Amess Conservative
Derbyshire Dales 44.8% Patrick McLoughlin Conservative
Ludlow 42.9% Philip Dunne Conservative
West Worcestershire 42.7% Harriett Baldwin Conservative
North Cornwall 42.3% Scott Mann Conservative
Birmingham, Hall Green 42.2% Roger Godsiff Labour
Croydon South 42.1% Chris Philp Conservative
Penrith and The Border 41.9% Rory Stewart Conservative
Southport 41.8% John Pugh Liberal Democrat
Our housing is infrastructure and the UK’s is in a very poor condition, resulting in high levels of fuel
poverty and unaffordable energy bills. The solution to this crisis is for the UK Government to designate
home energy efficiency as an infrastructure priority and use infrastructure funds to deliver the stable,
long-term investment needed to implement a locally-led infrastructure programme to upgrade all UK
homes up to Band C on an Energy Performance Certificate.
2 The indicator used in the original (EC 2010) has not since been updated. A new indicator has been developed (Thomson and Snell 2013), used in this update and applied to the 2011 data.
COLD MAN OF EUROPE 2015 UPDATE October 2015
Association for the Conservation of Energy | briefing 3
1 Introduction This briefing focuses on the position of the UK’s housing stock in comparison to other European
countries in terms of fuel poverty and energy efficiency.
On the latest available data, the housing stock was the cause of 29 per cent of our CO2 emissions3, and
27 per cent of final energy consumption4. Fuel poverty remains a serious and growing problem in the
UK: estimated at 4.5 million households in 2013, the same as in 2009 and the joint-highest level this
century5. Upgrading the housing stock to high standards of energy efficiency would capture multiple
opportunities:
Social opportunity: Making homes highly energy efficient is by far the best solution to end fuel
poverty. It can also reduce NHS costs. It is estimated that cold homes cost the NHS £1.3 billion
every year.
Economic opportunity: Recent research by Frontier Economics6 confirms that energy
efficiency can be classified as infrastructure and that based on the Government’s own economic
cost benefit data, an energy efficiency programme has comparable net economic benefits to
other infrastructure programmes such as HS2, Crossrail and roads. An energy efficiency
programme could generate economic benefits of £8.7 billion to the UK economy.
Energy security: Cambridge Econometrics estimates that bringing all UK homes up to a
reasonably high standard of energy efficiency (EPC Band C) would reduce UK gas imports by
26%, strengthening UK energy security7.
Environmental opportunity: Reducing CO2 emissions from housing is imperative to meet the
UK’s Carbon Budgets; using aggressive and ambitious energy efficiency improvement as the
core means of achieving this brings additional benefits in terms of energy security and reduced
energy imports.
3 (DECC 2015c) 4 (DECC 2015b) 5 (DECC 2015a) 6 (Frontier Economics 2015) 7 (Cambridge Econometrics and Verco 2014)

COLD MAN OF EUROPE 2015 UPDATE October 2015
Association for the Conservation of Energy | briefing 4
2 Methodology
2.1 Rationale for choice of countries to compare In order to achieve a significant degree of comparability with the original Cold Man of Europe briefing
published in 2013, we chose to retain the same countries for comparison with the UK. The countries
compared in this update are those in Europe that are fairly prosperous and have ‘full’ heating seasons
(in other words, that usually need to heat their homes throughout the winter). The purpose of this was
to avoid including countries that are either significantly less prosperous than the UK, or have warm
climates, or both. As such, the countries that we are assessing are shown in Table 3. Further detail is
provided in Appendix I.
Table 3: Countries included in original Cold Man of Europe briefing and in 2015's update
Indicator Included in comparison
Austria
Belgium
Czech Republic
Denmark
Finland
France
Germany
Iceland
Ireland
Luxembourg
Netherlands
Norway
Slovenia
Sweden
Switzerland
UK
2.2 Choice of data to compare and use of updated data The selection of data for comparison in the original briefing was based on two principles. First, the data
needed to relate to the heating of the housing stock. Second, the data needed to have been collected and
compiled authoritatively, and on a consistent basis for each country. These principles yielded four
principal sources and corresponding data, described in Table 4 below alongside the more recent data
used for this year’s update.
COLD MAN OF EUROPE 2015 UPDATE October 2015
Association for the Conservation of Energy | briefing 5
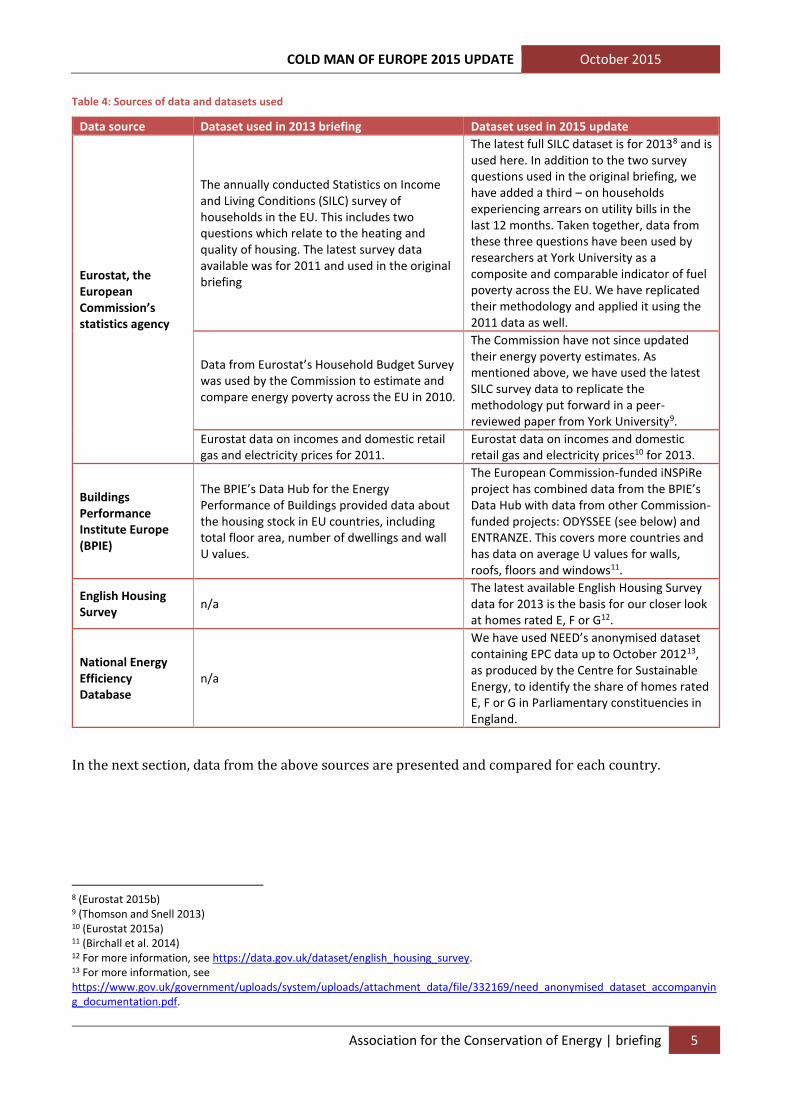
Table 4: Sources of data and datasets used
Data source Dataset used in 2013 briefing Dataset used in 2015 update
Eurostat, the European Commission’s statistics agency
The annually conducted Statistics on Income and Living Conditions (SILC) survey of households in the EU. This includes two questions which relate to the heating and quality of housing. The latest survey data available was for 2011 and used in the original briefing
The latest full SILC dataset is for 20138 and is used here. In addition to the two survey questions used in the original briefing, we have added a third – on households experiencing arrears on utility bills in the last 12 months. Taken together, data from these three questions have been used by researchers at York University as a composite and comparable indicator of fuel poverty across the EU. We have replicated their methodology and applied it using the 2011 data as well.
Data from Eurostat’s Household Budget Survey was used by the Commission to estimate and compare energy poverty across the EU in 2010.
The Commission have not since updated their energy poverty estimates. As mentioned above, we have used the latest SILC survey data to replicate the methodology put forward in a peer-reviewed paper from York University9.
Eurostat data on incomes and domestic retail gas and electricity prices for 2011.
Eurostat data on incomes and domestic retail gas and electricity prices10 for 2013.
Buildings Performance Institute Europe (BPIE)
The BPIE’s Data Hub for the Energy Performance of Buildings provided data about the housing stock in EU countries, including total floor area, number of dwellings and wall U values.
The European Commission-funded iNSPiRe project has combined data from the BPIE’s Data Hub with data from other Commission-funded projects: ODYSSEE (see below) and ENTRANZE. This covers more countries and has data on average U values for walls, roofs, floors and windows11.
English Housing Survey
n/a The latest available English Housing Survey data for 2013 is the basis for our closer look at homes rated E, F or G12.
National Energy Efficiency Database
n/a
We have used NEED’s anonymised dataset containing EPC data up to October 201213, as produced by the Centre for Sustainable Energy, to identify the share of homes rated E, F or G in Parliamentary constituencies in England.
In the next section, data from the above sources are presented and compared for each country.
8 (Eurostat 2015b) 9 (Thomson and Snell 2013) 10 (Eurostat 2015a) 11 (Birchall et al. 2014) 12 For more information, see https://data.gov.uk/dataset/english_housing_survey. 13 For more information, see https://www.gov.uk/government/uploads/system/uploads/attachment_data/file/332169/need_anonymised_dataset_accompanying_documentation.pdf.
COLD MAN OF EUROPE 2015 UPDATE October 2015
Association for the Conservation of Energy | briefing 6
3 Results from comparing countries
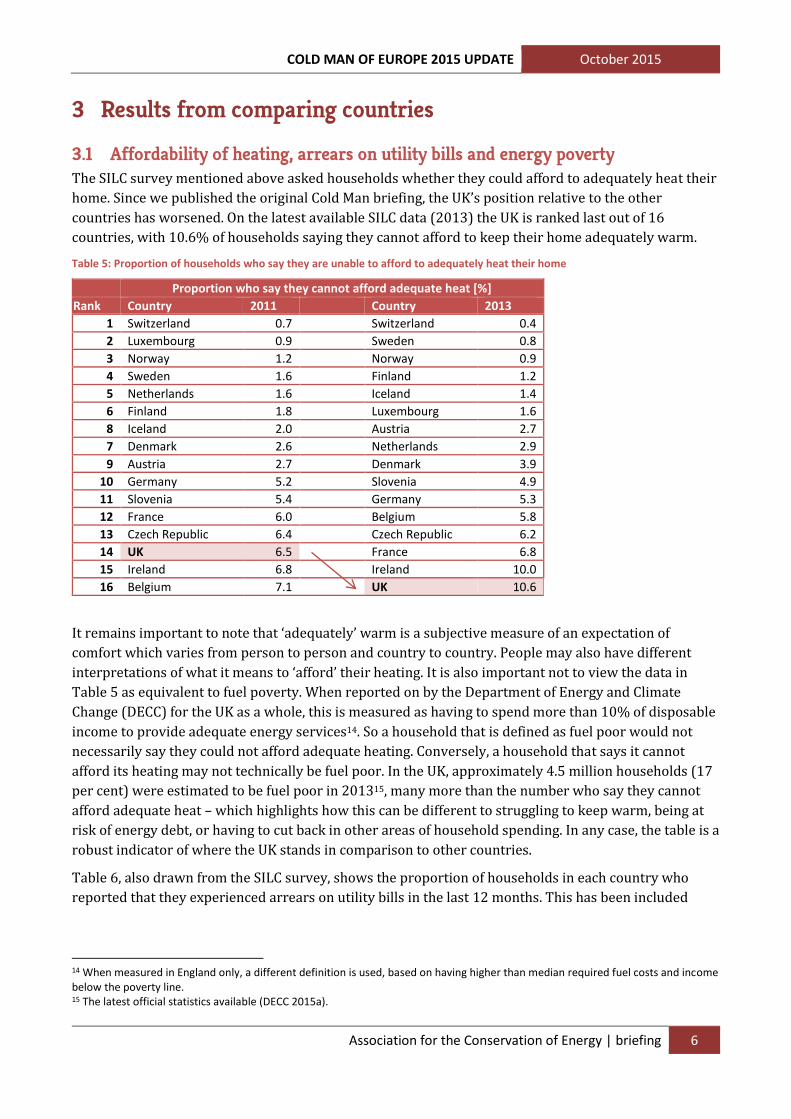
3.1 Affordability of heating, arrears on utility bills and energy poverty The SILC survey mentioned above asked households whether they could afford to adequately heat their
home. Since we published the original Cold Man briefing, the UK’s position relative to the other
countries has worsened. On the latest available SILC data (2013) the UK is ranked last out of 16
countries, with 10.6% of households saying they cannot afford to keep their home adequately warm.
Table 5: Proportion of households who say they are unable to afford to adequately heat their home
Proportion who say they cannot afford adequate heat [%]
Rank Country 2011 Country 2013
1 Switzerland 0.7 Switzerland 0.4
2 Luxembourg 0.9 Sweden 0.8
3 Norway 1.2 Norway 0.9
4 Sweden 1.6 Finland 1.2
5 Netherlands 1.6 Iceland 1.4
6 Finland 1.8 Luxembourg 1.6
8 Iceland 2.0 Austria 2.7
7 Denmark 2.6 Netherlands 2.9
9 Austria 2.7 Denmark 3.9
10 Germany 5.2 Slovenia 4.9
11 Slovenia 5.4 Germany 5.3
12 France 6.0 Belgium 5.8
13 Czech Republic 6.4 Czech Republic 6.2
14 UK 6.5 France 6.8
15 Ireland 6.8 Ireland 10.0
16 Belgium 7.1 UK 10.6
It remains important to note that ‘adequately’ warm is a subjective measure of an expectation of
comfort which varies from person to person and country to country. People may also have different
interpretations of what it means to ‘afford’ their heating. It is also important not to view the data in
Table 5 as equivalent to fuel poverty. When reported on by the Department of Energy and Climate
Change (DECC) for the UK as a whole, this is measured as having to spend more than 10% of disposable
income to provide adequate energy services14. So a household that is defined as fuel poor would not
necessarily say they could not afford adequate heating. Conversely, a household that says it cannot
afford its heating may not technically be fuel poor. In the UK, approximately 4.5 million households (17
per cent) were estimated to be fuel poor in 201315, many more than the number who say they cannot
afford adequate heat – which highlights how this can be different to struggling to keep warm, being at
risk of energy debt, or having to cut back in other areas of household spending. In any case, the table is a
robust indicator of where the UK stands in comparison to other countries.
Table 6, also drawn from the SILC survey, shows the proportion of households in each country who
reported that they experienced arrears on utility bills in the last 12 months. This has been included
14 When measured in England only, a different definition is used, based on having higher than median required fuel costs and income below the poverty line. 15 The latest official statistics available (DECC 2015a).
COLD MAN OF EUROPE 2015 UPDATE October 2015
Association for the Conservation of Energy | briefing 7
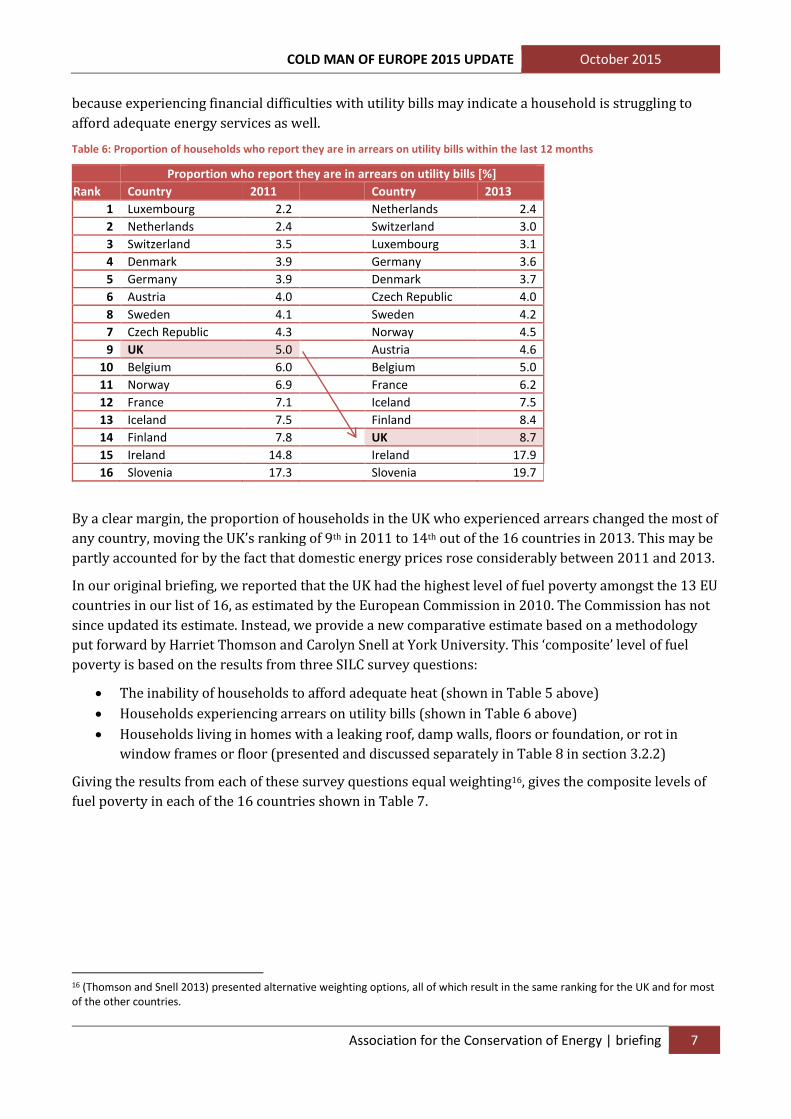
because experiencing financial difficulties with utility bills may indicate a household is struggling to
afford adequate energy services as well.
Table 6: Proportion of households who report they are in arrears on utility bills within the last 12 months
Proportion who report they are in arrears on utility bills [%]
Rank Country 2011 Country 2013
1 Luxembourg 2.2 Netherlands 2.4
2 Netherlands 2.4 Switzerland 3.0
3 Switzerland 3.5 Luxembourg 3.1
4 Denmark 3.9 Germany 3.6
5 Germany 3.9 Denmark 3.7
6 Austria 4.0 Czech Republic 4.0
8 Sweden 4.1 Sweden 4.2
7 Czech Republic 4.3 Norway 4.5
9 UK 5.0 Austria 4.6
10 Belgium 6.0 Belgium 5.0
11 Norway 6.9 France 6.2
12 France 7.1 Iceland 7.5
13 Iceland 7.5 Finland 8.4
14 Finland 7.8 UK 8.7
15 Ireland 14.8 Ireland 17.9
16 Slovenia 17.3 Slovenia 19.7
By a clear margin, the proportion of households in the UK who experienced arrears changed the most of
any country, moving the UK’s ranking of 9th in 2011 to 14th out of the 16 countries in 2013. This may be
partly accounted for by the fact that domestic energy prices rose considerably between 2011 and 2013.
In our original briefing, we reported that the UK had the highest level of fuel poverty amongst the 13 EU
countries in our list of 16, as estimated by the European Commission in 2010. The Commission has not
since updated its estimate. Instead, we provide a new comparative estimate based on a methodology
put forward by Harriet Thomson and Carolyn Snell at York University. This ‘composite’ level of fuel
poverty is based on the results from three SILC survey questions:
The inability of households to afford adequate heat (shown in Table 5 above)
Households experiencing arrears on utility bills (shown in Table 6 above)
Households living in homes with a leaking roof, damp walls, floors or foundation, or rot in
window frames or floor (presented and discussed separately in Table 8 in section 3.2.2)
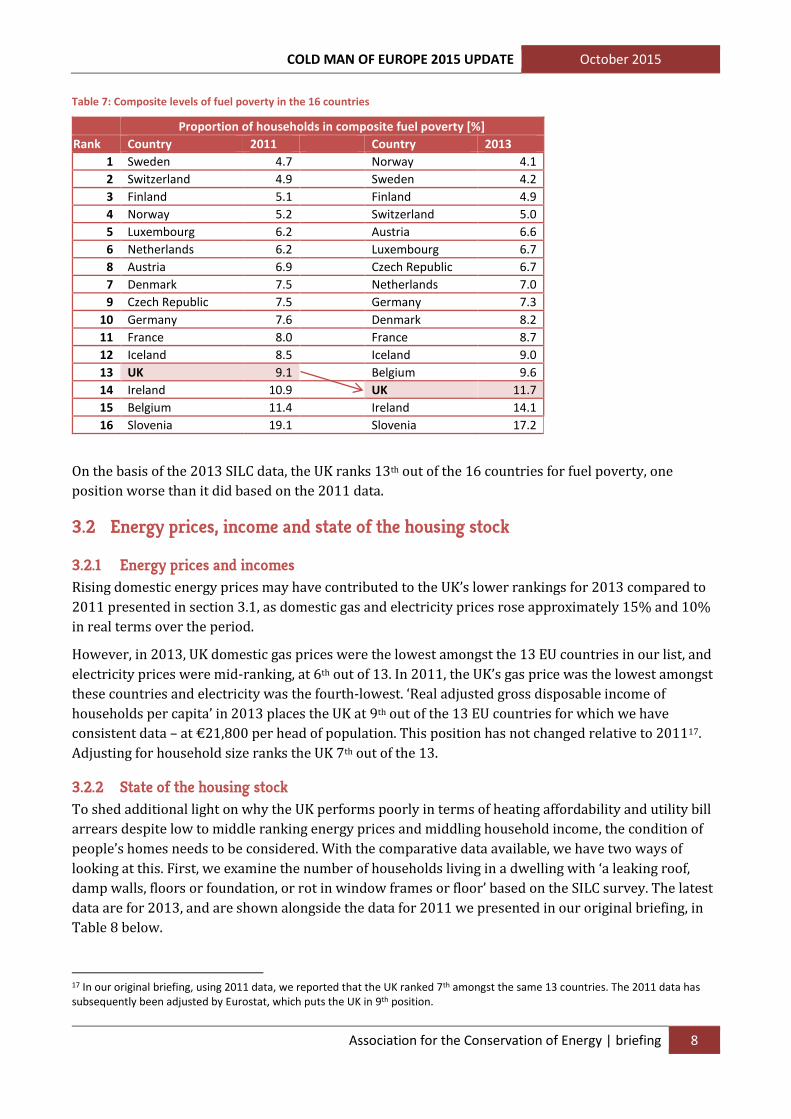
Giving the results from each of these survey questions equal weighting16, gives the composite levels of
fuel poverty in each of the 16 countries shown in Table 7.
16 (Thomson and Snell 2013) presented alternative weighting options, all of which result in the same ranking for the UK and for most of the other countries.
COLD MAN OF EUROPE 2015 UPDATE October 2015
Association for the Conservation of Energy | briefing 8
Table 7: Composite levels of fuel poverty in the 16 countries
Proportion of households in composite fuel poverty [%]
Rank Country 2011 Country 2013
1 Sweden 4.7 Norway 4.1
2 Switzerland 4.9 Sweden 4.2
3 Finland 5.1 Finland 4.9
4 Norway 5.2 Switzerland 5.0
5 Luxembourg 6.2 Austria 6.6
6 Netherlands 6.2 Luxembourg 6.7
8 Austria 6.9 Czech Republic 6.7
7 Denmark 7.5 Netherlands 7.0
9 Czech Republic 7.5 Germany 7.3
10 Germany 7.6 Denmark 8.2
11 France 8.0 France 8.7
12 Iceland 8.5 Iceland 9.0
13 UK 9.1 Belgium 9.6
14 Ireland 10.9 UK 11.7
15 Belgium 11.4 Ireland 14.1
16 Slovenia 19.1 Slovenia 17.2
On the basis of the 2013 SILC data, the UK ranks 13th out of the 16 countries for fuel poverty, one
position worse than it did based on the 2011 data.
3.2 Energy prices, income and state of the housing stock
3.2.1 Energy prices and incomes Rising domestic energy prices may have contributed to the UK’s lower rankings for 2013 compared to
2011 presented in section 3.1, as domestic gas and electricity prices rose approximately 15% and 10%
in real terms over the period.
However, in 2013, UK domestic gas prices were the lowest amongst the 13 EU countries in our list, and
electricity prices were mid-ranking, at 6th out of 13. In 2011, the UK’s gas price was the lowest amongst
these countries and electricity was the fourth-lowest. ‘Real adjusted gross disposable income of
households per capita’ in 2013 places the UK at 9th out of the 13 EU countries for which we have
consistent data – at €21,800 per head of population. This position has not changed relative to 201117.
Adjusting for household size ranks the UK 7th out of the 13.
3.2.2 State of the housing stock To shed additional light on why the UK performs poorly in terms of heating affordability and utility bill
arrears despite low to middle ranking energy prices and middling household income, the condition of
people’s homes needs to be considered. With the comparative data available, we have two ways of
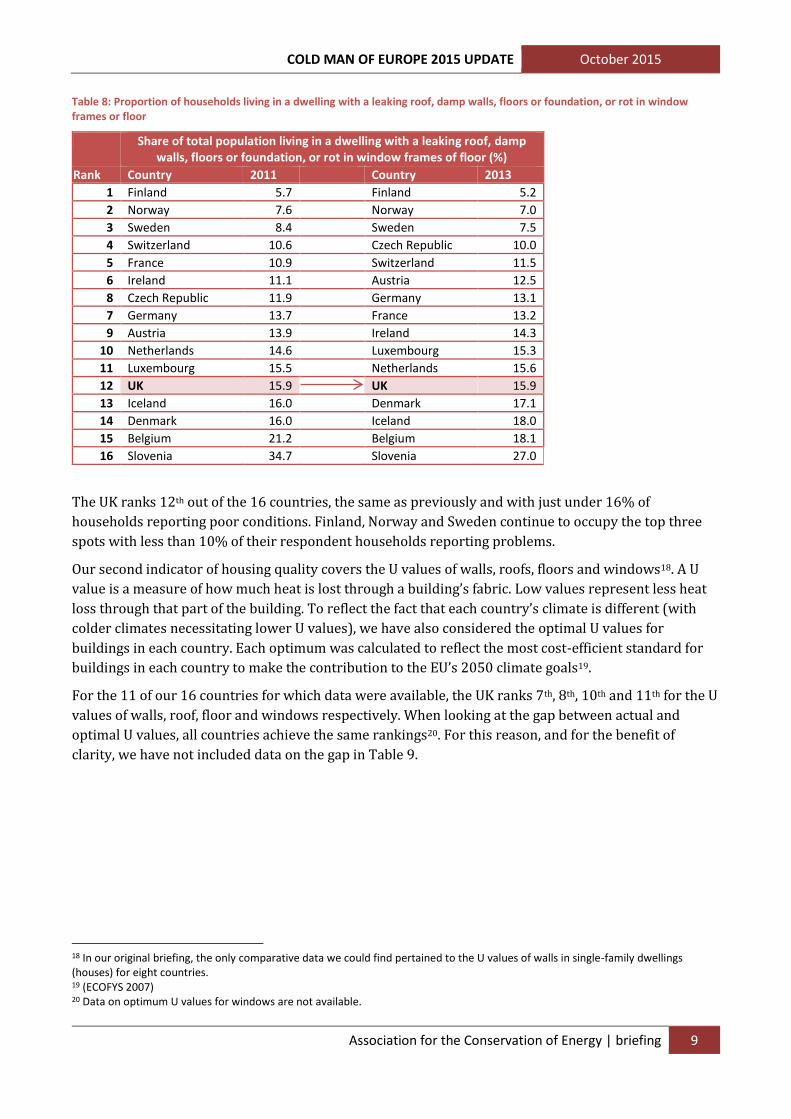
looking at this. First, we examine the number of households living in a dwelling with ‘a leaking roof,
damp walls, floors or foundation, or rot in window frames or floor’ based on the SILC survey. The latest
data are for 2013, and are shown alongside the data for 2011 we presented in our original briefing, in
Table 8 below.
17 In our original briefing, using 2011 data, we reported that the UK ranked 7th amongst the same 13 countries. The 2011 data has subsequently been adjusted by Eurostat, which puts the UK in 9th position.
COLD MAN OF EUROPE 2015 UPDATE October 2015
Association for the Conservation of Energy | briefing 9
Table 8: Proportion of households living in a dwelling with a leaking roof, damp walls, floors or foundation, or rot in window frames or floor
Share of total population living in a dwelling with a leaking roof, damp
walls, floors or foundation, or rot in window frames of floor (%)
Rank Country 2011 Country 2013
1 Finland 5.7 Finland 5.2
2 Norway 7.6 Norway 7.0
3 Sweden 8.4 Sweden 7.5
4 Switzerland 10.6 Czech Republic 10.0
5 France 10.9 Switzerland 11.5
6 Ireland 11.1 Austria 12.5
8 Czech Republic 11.9 Germany 13.1
7 Germany 13.7 France 13.2
9 Austria 13.9 Ireland 14.3
10 Netherlands 14.6 Luxembourg 15.3
11 Luxembourg 15.5 Netherlands 15.6
12 UK 15.9 UK 15.9
13 Iceland 16.0 Denmark 17.1
14 Denmark 16.0 Iceland 18.0
15 Belgium 21.2 Belgium 18.1
16 Slovenia 34.7 Slovenia 27.0
The UK ranks 12th out of the 16 countries, the same as previously and with just under 16% of
households reporting poor conditions. Finland, Norway and Sweden continue to occupy the top three
spots with less than 10% of their respondent households reporting problems.
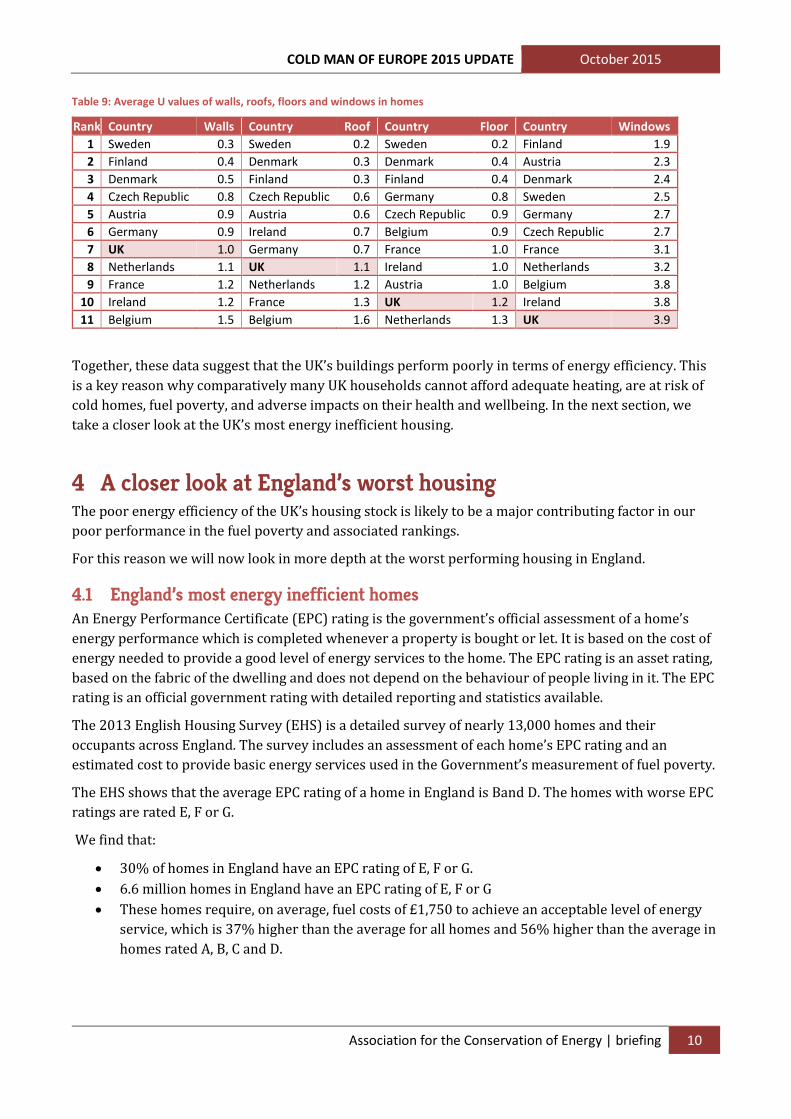
Our second indicator of housing quality covers the U values of walls, roofs, floors and windows18. A U
value is a measure of how much heat is lost through a building’s fabric. Low values represent less heat
loss through that part of the building. To reflect the fact that each country’s climate is different (with
colder climates necessitating lower U values), we have also considered the optimal U values for
buildings in each country. Each optimum was calculated to reflect the most cost-efficient standard for
buildings in each country to make the contribution to the EU’s 2050 climate goals19.
For the 11 of our 16 countries for which data were available, the UK ranks 7th, 8th, 10th and 11th for the U
values of walls, roof, floor and windows respectively. When looking at the gap between actual and
optimal U values, all countries achieve the same rankings20. For this reason, and for the benefit of
clarity, we have not included data on the gap in Table 9.
18 In our original briefing, the only comparative data we could find pertained to the U values of walls in single-family dwellings (houses) for eight countries. 19 (ECOFYS 2007) 20 Data on optimum U values for windows are not available.
COLD MAN OF EUROPE 2015 UPDATE October 2015
Association for the Conservation of Energy | briefing 10
Table 9: Average U values of walls, roofs, floors and windows in homes
Rank Country Walls Country Roof Country Floor Country Windows
1 Sweden 0.3 Sweden 0.2 Sweden 0.2 Finland 1.9
2 Finland 0.4 Denmark 0.3 Denmark 0.4 Austria 2.3
3 Denmark 0.5 Finland 0.3 Finland 0.4 Denmark 2.4
4 Czech Republic 0.8 Czech Republic 0.6 Germany 0.8 Sweden 2.5
5 Austria 0.9 Austria 0.6 Czech Republic 0.9 Germany 2.7
6 Germany 0.9 Ireland 0.7 Belgium 0.9 Czech Republic 2.7
7 UK 1.0 Germany 0.7 France 1.0 France 3.1
8 Netherlands 1.1 UK 1.1 Ireland 1.0 Netherlands 3.2
9 France 1.2 Netherlands 1.2 Austria 1.0 Belgium 3.8
10 Ireland 1.2 France 1.3 UK 1.2 Ireland 3.8
11 Belgium 1.5 Belgium 1.6 Netherlands 1.3 UK 3.9
Together, these data suggest that the UK’s buildings perform poorly in terms of energy efficiency. This
is a key reason why comparatively many UK households cannot afford adequate heating, are at risk of
cold homes, fuel poverty, and adverse impacts on their health and wellbeing. In the next section, we
take a closer look at the UK’s most energy inefficient housing.
4 A closer look at England’s worst housing The poor energy efficiency of the UK’s housing stock is likely to be a major contributing factor in our
poor performance in the fuel poverty and associated rankings.
For this reason we will now look in more depth at the worst performing housing in England.
4.1 England’s most energy inefficient homes An Energy Performance Certificate (EPC) rating is the government’s official assessment of a home’s
energy performance which is completed whenever a property is bought or let. It is based on the cost of
energy needed to provide a good level of energy services to the home. The EPC rating is an asset rating,
based on the fabric of the dwelling and does not depend on the behaviour of people living in it. The EPC
rating is an official government rating with detailed reporting and statistics available.
The 2013 English Housing Survey (EHS) is a detailed survey of nearly 13,000 homes and their
occupants across England. The survey includes an assessment of each home’s EPC rating and an
estimated cost to provide basic energy services used in the Government’s measurement of fuel poverty.
The EHS shows that the average EPC rating of a home in England is Band D. The homes with worse EPC
ratings are rated E, F or G.
We find that:
30% of homes in England have an EPC rating of E, F or G.
6.6 million homes in England have an EPC rating of E, F or G
These homes require, on average, fuel costs of £1,750 to achieve an acceptable level of energy
service, which is 37% higher than the average for all homes and 56% higher than the average in
homes rated A, B, C and D.
COLD MAN OF EUROPE 2015 UPDATE October 2015
Association for the Conservation of Energy | briefing 11
4.2 Finding the most energy inefficient homes The most energy inefficient homes are found all across England but there are some areas in which they
are more common which can provide some insight into the problems of poor housing infrastructure
faced across the UK.
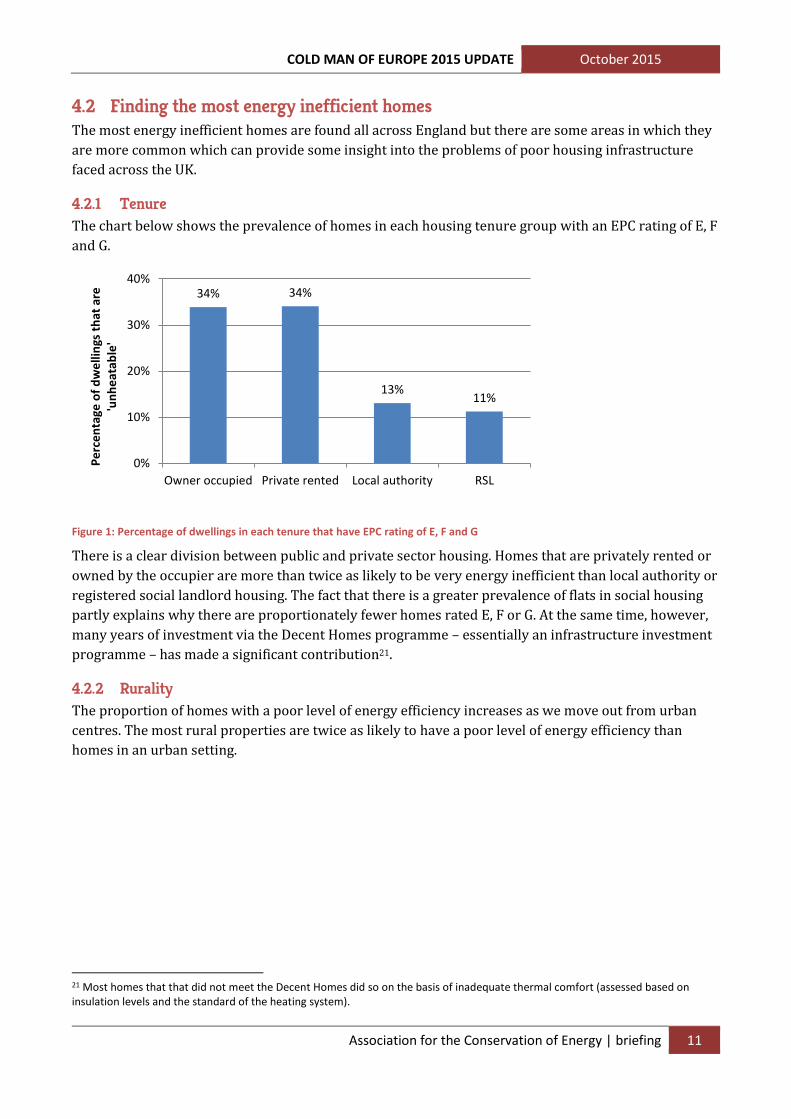
4.2.1 Tenure The chart below shows the prevalence of homes in each housing tenure group with an EPC rating of E, F
and G.
Figure 1: Percentage of dwellings in each tenure that have EPC rating of E, F and G
There is a clear division between public and private sector housing. Homes that are privately rented or
owned by the occupier are more than twice as likely to be very energy inefficient than local authority or
registered social landlord housing. The fact that there is a greater prevalence of flats in social housing
partly explains why there are proportionately fewer homes rated E, F or G. At the same time, however,
many years of investment via the Decent Homes programme – essentially an infrastructure investment
programme – has made a significant contribution21.
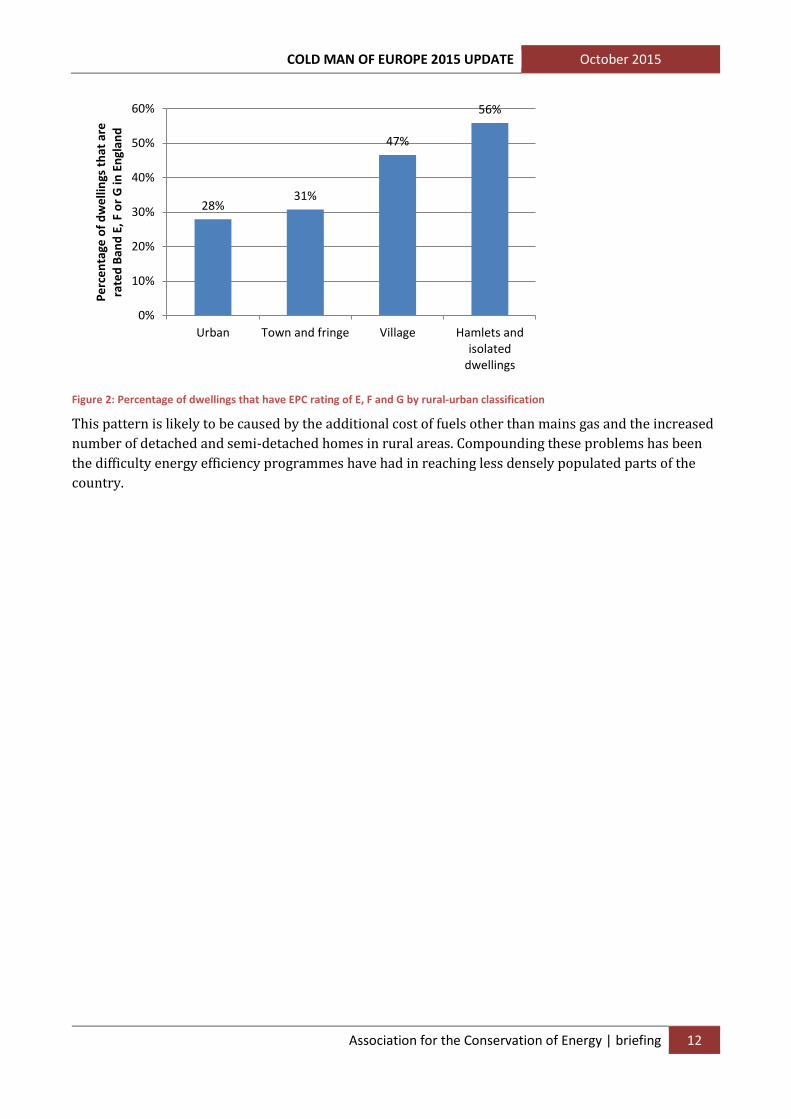
4.2.2 Rurality The proportion of homes with a poor level of energy efficiency increases as we move out from urban
centres. The most rural properties are twice as likely to have a poor level of energy efficiency than
homes in an urban setting.
21 Most homes that that did not meet the Decent Homes did so on the basis of inadequate thermal comfort (assessed based on insulation levels and the standard of the heating system).
34% 34%
13%11%
0%
10%
20%
30%
40%
Owner occupied Private rented Local authority RSL
Pe
rce
nta
ge o
f d
we
llin
gs t
hat
are
'u
nh
eat
able
'
COLD MAN OF EUROPE 2015 UPDATE October 2015
Association for the Conservation of Energy | briefing 12
Figure 2: Percentage of dwellings that have EPC rating of E, F and G by rural-urban classification
This pattern is likely to be caused by the additional cost of fuels other than mains gas and the increased
number of detached and semi-detached homes in rural areas. Compounding these problems has been
the difficulty energy efficiency programmes have had in reaching less densely populated parts of the
country.
28%31%
47%
56%
0%
10%
20%
30%
40%
50%
60%
Urban Town and fringe Village Hamlets andisolated
dwellings
Pe
rce
nta
ge o
f d
we
llin
gs t
hat
are
rate
d B
and
E, F
or
G in
En
glan
d
COLD MAN OF EUROPE 2015 UPDATE October 2015
Association for the Conservation of Energy | briefing 13
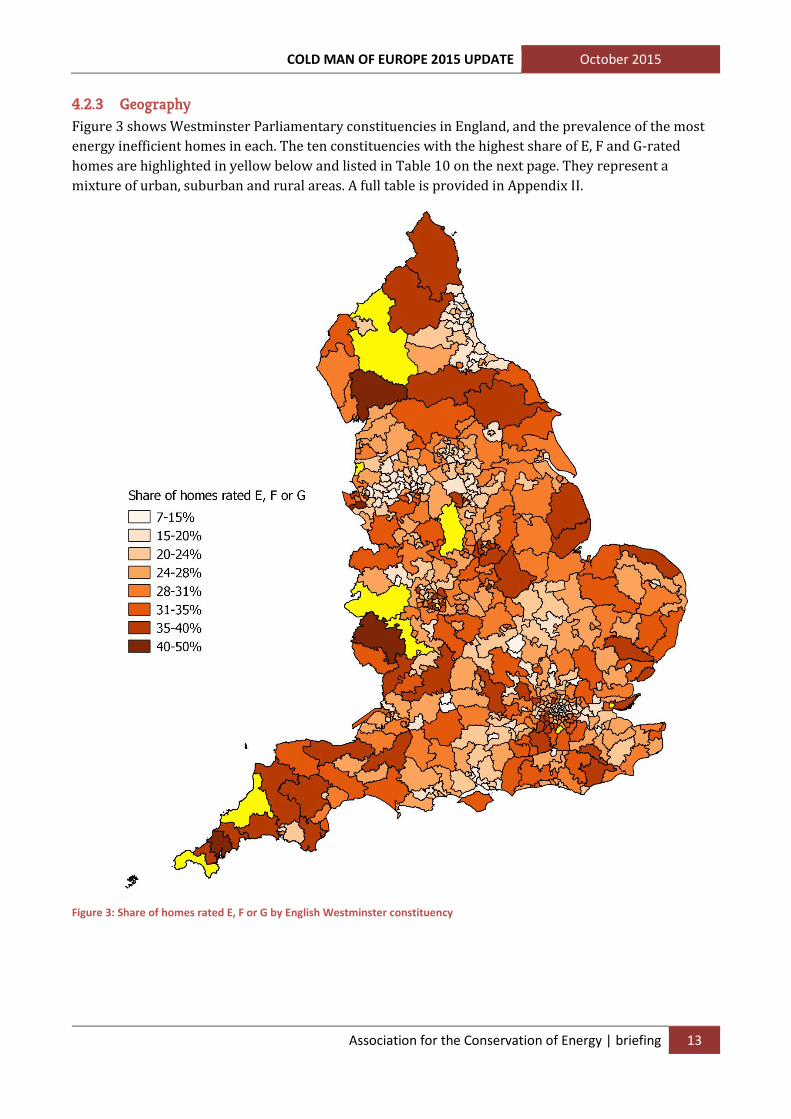
4.2.3 Geography Figure 3 shows Westminster Parliamentary constituencies in England, and the prevalence of the most
energy inefficient homes in each. The ten constituencies with the highest share of E, F and G-rated
homes are highlighted in yellow below and listed in Table 10 on the next page. They represent a
mixture of urban, suburban and rural areas. A full table is provided in Appendix II.
Figure 3: Share of homes rated E, F or G by English Westminster constituency

COLD MAN OF EUROPE 2015 UPDATE October 2015
Association for the Conservation of Energy | briefing 14
Table 10: Top 10 Parliamentary constituencies with highest share of worse than average homes for energy efficiency
Parliamentary constituency Share of homes rated E, F or G MP Party
St Ives 50.4% Derek Thomas Conservative
Southend West 47.6% David Amess Conservative
Derbyshire Dales 44.8% Patrick McLoughlin Conservative
Ludlow 42.9% Philip Dunne Conservative
West Worcestershire 42.7% Harriett Baldwin Conservative
North Cornwall 42.3% Scott Mann Conservative
Birmingham, Hall Green 42.2% Roger Godsiff Labour
Croydon South 42.1% Chris Philp Conservative
Penrith and The Border 41.9% Rory Stewart Conservative
Southport 41.8% John Pugh Liberal Democrat
5 Conclusions A comparison of European countries with similar levels of prosperity and heating need show that the
UK has one of the highest levels of fuel poverty. The main cause of this high level of fuel poverty is the
fact the UK has one of the least energy efficient housing stocks in Western Europe.
The UK has 21 million homes in the UK with an inadequate level of energy efficiency, rating Band D, E, F
and G.
In England the average UK home has a rating of Band D. There are 6.6 million UK homes that are the
most energy inefficient, with a rating of Band E, F and G. The majority of these homes are privately
rented or owned and households in rural areas are twice as likely to be to the most energy inefficient.
The solution to this crisis is for the UK Government to designate home energy efficiency as an
infrastructure priority and use infrastructure funds to deliver the stable, long-term investment needed
to implement a local authority led infrastructure programme to upgrade all UK homes to at least Band C
on an Energy Performance Certificate.
COLD MAN OF EUROPE 2015 UPDATE October 2015
Association for the Conservation of Energy | briefing 15
Bibliography Birchall, Sarah, Ian Wallis, David Churcher, Simon Pezzutto, Roberto Fedrizzi, and Emmanuelle Causse.
2014. “Survey on the Energy Needs and Architectural Features of the EU Building Stock.” Berkshire: BSRIA. http://www.inspirefp7.eu/wp-content/uploads/2014/08/WP2_D2.1a_20140523_P18_Survey-on-the-energy-needs-and-architectural-features.pdf.
Cambridge Econometrics, and Verco. 2014. “Building the Future: The Economic and Fiscal Impacts of Making Homes Energy Efficient.” London: E3G. http://www.energybillrevolution.org/wp-content/uploads/2014/10/Building-the-Future-The-Economic-and-Fiscal-impacts-of-making-homes-energy-efficient.pdf.
DECC. 2015a. “Annual Fuel Poverty Statistics Report, 2015.” London: Department of Energy and Climate Change. https://www.gov.uk/government/uploads/system/uploads/attachment_data/file/468011/Fuel_Poverty_Report_2015.pdf.
———. 2015b. “Energy Consumption in the UK (2015) - Chapter 1: Overall Energy Consumption in the UK since 1970.” London: Department of Energy & Climate Change. https://www.gov.uk/government/uploads/system/uploads/attachment_data/file/449102/ECUK_Chapter_1_-_Overall_factsheet.pdf.
———. 2015c. “Final UK Greenhouse Gas Emissions National Statistics: 1990-2013.” London: Department of Energy & Climate Change. https://www.gov.uk/government/statistics/final-uk-emissions-estimates.
EC. 2010. “Commission Staff Working Paper: An Energy Policy for Consumers.” Brussels: European Commission. https://ec.europa.eu/energy/sites/ener/files/documents/sec(2010)1407_0.pdf.
ECOFYS. 2007. “U-Values for Better Energy Performance of Buildings - Annexes.” Brussels: EURIMA. http://www.eurima.org/uploads/ModuleXtender/Publications/13/EURIMA-ECOFYS_VII_report_p66-104_ANNEXES1.pdf.
Eurostat. 2015a. “Energy - Main Tables.” Brussels: European Commission. http://ec.europa.eu/eurostat/web/energy/data/main-tables.
———. 2015b. “Income and Living Conditions Database.” Brussels: European Commission. http://ec.europa.eu/eurostat/web/income-and-living-conditions/data/database.
Frontier Economics. 2015. “Energy Efficiency: An Infrastructure Priority.” London: Frontier Economics Ltd. http://www.energybillrevolution.org/wp-content/uploads/2015/09/Frontier-Economics-Energy-Efficiency-an-Infrastructure-Priority.pdf.
Guertler, Pedro, and Sarah Royston. 2013. “Fact-File: The Cold Man of Europe.” London: Association for the Conservation of Energy.
Laustsen, Jens. 2008. “Energy Efficiency Requirements in Building Codes, Energy Efficiency Policies for New Buildings.” Paris: International Energy Agency. http://www.iea.org/efficiency/CD-EnergyEfficiencyPolicy2009/2-Buildings/2-Building%20Codes%20for%20COP%202009.pdf.
Legatum Institute. 2012. “2012 Legatum Prosperity Index.” http://www.prosperity.com/.
Thomson, Harriet, and Carolyn Snell. 2013. “Quantifying the Prevalence of Fuel Poverty across the European Union.” Energy Policy, Special Section: Transition Pathways to a Low Carbon Economy, 52 (January): 563–72. doi:10.1016/j.enpol.2012.10.009.
COLD MAN OF EUROPE 2015 UPDATE October 2015
Association for the Conservation of Energy | briefing 16
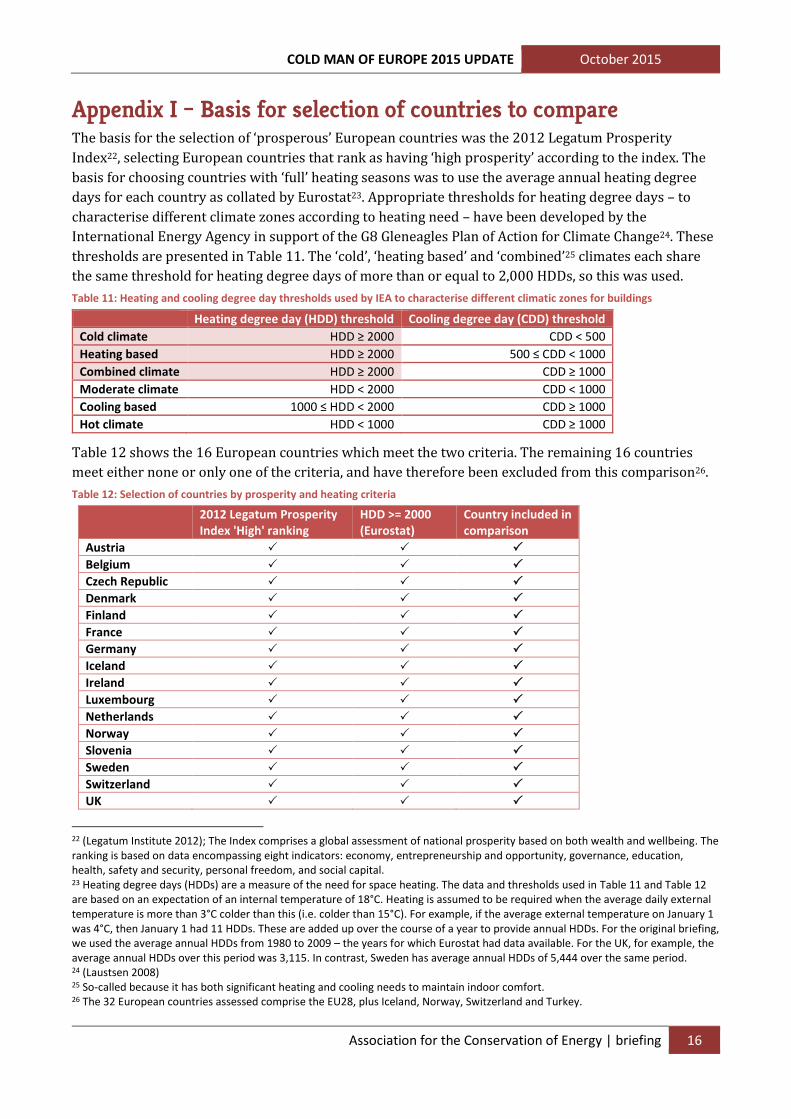
Appendix I – Basis for selection of countries to compare The basis for the selection of ‘prosperous’ European countries was the 2012 Legatum Prosperity
Index22, selecting European countries that rank as having ‘high prosperity’ according to the index. The
basis for choosing countries with ‘full’ heating seasons was to use the average annual heating degree
days for each country as collated by Eurostat23. Appropriate thresholds for heating degree days – to
characterise different climate zones according to heating need – have been developed by the
International Energy Agency in support of the G8 Gleneagles Plan of Action for Climate Change24. These
thresholds are presented in Table 11. The ‘cold’, ‘heating based’ and ‘combined’25 climates each share
the same threshold for heating degree days of more than or equal to 2,000 HDDs, so this was used.
Table 11: Heating and cooling degree day thresholds used by IEA to characterise different climatic zones for buildings
Heating degree day (HDD) threshold Cooling degree day (CDD) threshold
Cold climate HDD ≥ 2000 CDD < 500
Heating based HDD ≥ 2000 500 ≤ CDD < 1000
Combined climate HDD ≥ 2000 CDD ≥ 1000
Moderate climate HDD < 2000 CDD < 1000
Cooling based 1000 ≤ HDD < 2000 CDD ≥ 1000
Hot climate HDD < 1000 CDD ≥ 1000
Table 12 shows the 16 European countries which meet the two criteria. The remaining 16 countries
meet either none or only one of the criteria, and have therefore been excluded from this comparison26.
Table 12: Selection of countries by prosperity and heating criteria
2012 Legatum Prosperity Index 'High' ranking
HDD >= 2000 (Eurostat)
Country included in comparison
Austria Belgium Czech Republic Denmark Finland France Germany Iceland Ireland Luxembourg Netherlands Norway Slovenia Sweden Switzerland UK
22 (Legatum Institute 2012); The Index comprises a global assessment of national prosperity based on both wealth and wellbeing. The ranking is based on data encompassing eight indicators: economy, entrepreneurship and opportunity, governance, education, health, safety and security, personal freedom, and social capital. 23 Heating degree days (HDDs) are a measure of the need for space heating. The data and thresholds used in Table 11 and Table 12 are based on an expectation of an internal temperature of 18°C. Heating is assumed to be required when the average daily external temperature is more than 3°C colder than this (i.e. colder than 15°C). For example, if the average external temperature on January 1 was 4°C, then January 1 had 11 HDDs. These are added up over the course of a year to provide annual HDDs. For the original briefing, we used the average annual HDDs from 1980 to 2009 – the years for which Eurostat had data available. For the UK, for example, the average annual HDDs over this period was 3,115. In contrast, Sweden has average annual HDDs of 5,444 over the same period. 24 (Laustsen 2008) 25 So-called because it has both significant heating and cooling needs to maintain indoor comfort. 26 The 32 European countries assessed comprise the EU28, plus Iceland, Norway, Switzerland and Turkey.
COLD MAN OF EUROPE 2015 UPDATE October 2015
Association for the Conservation of Energy | briefing 17
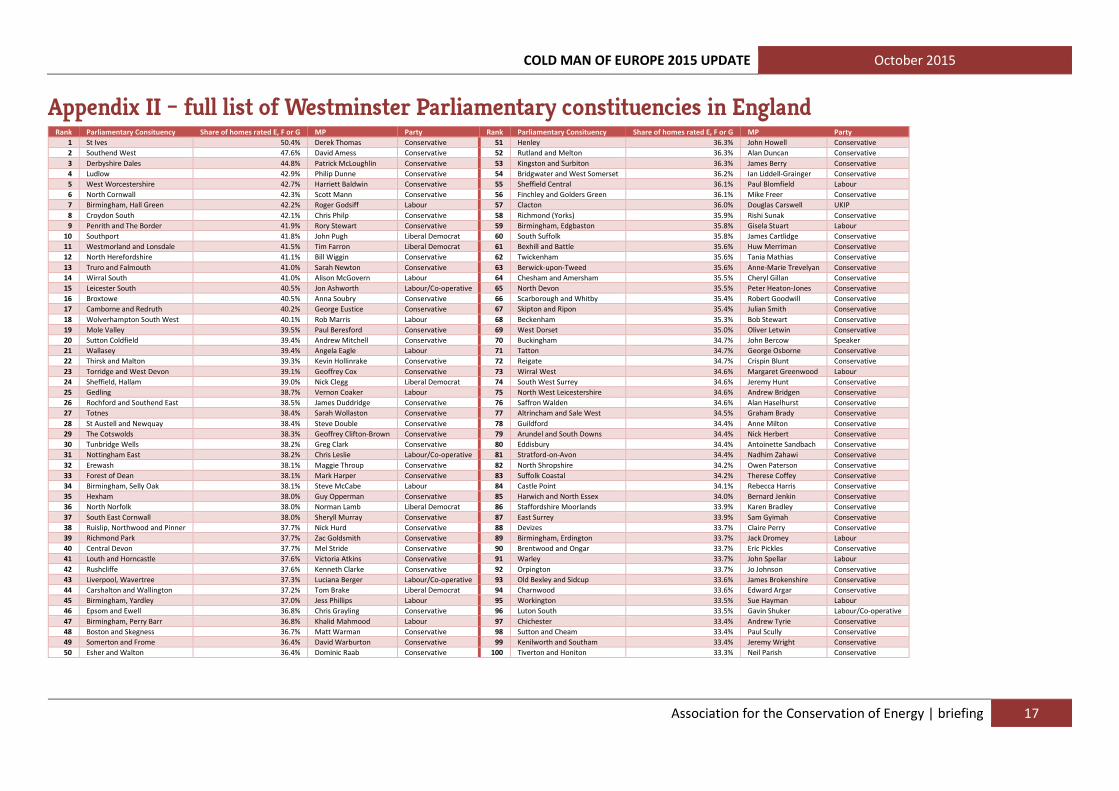
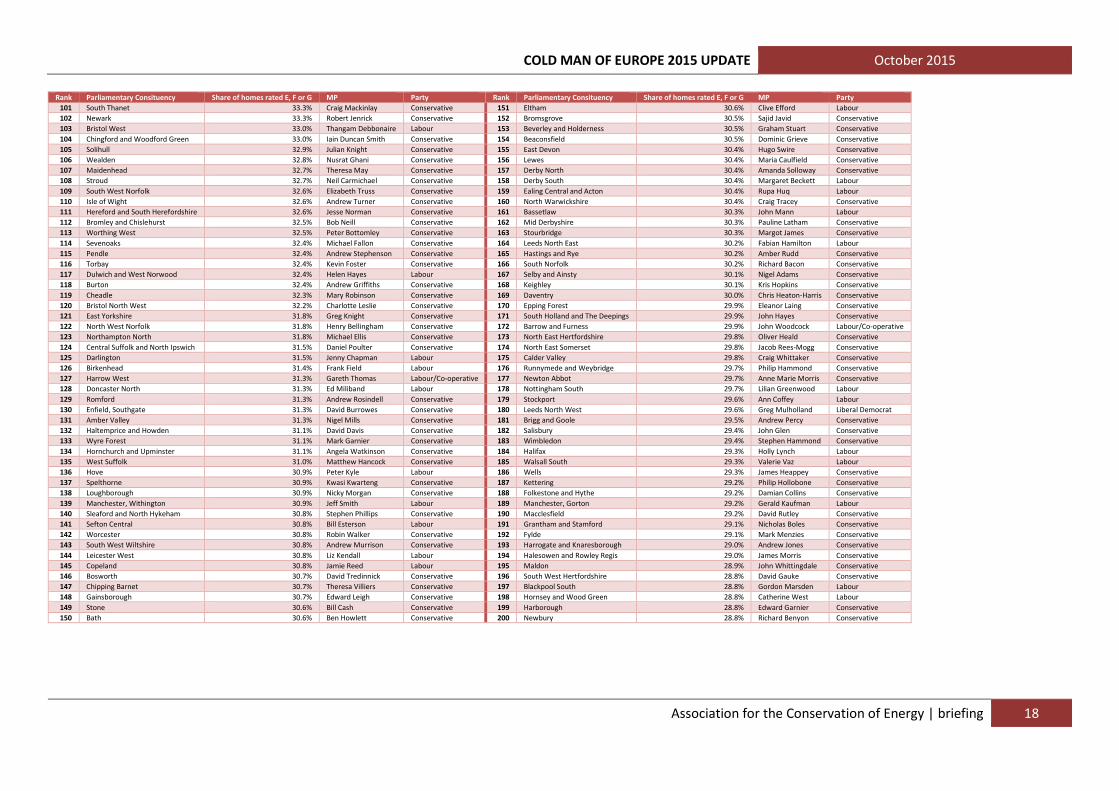
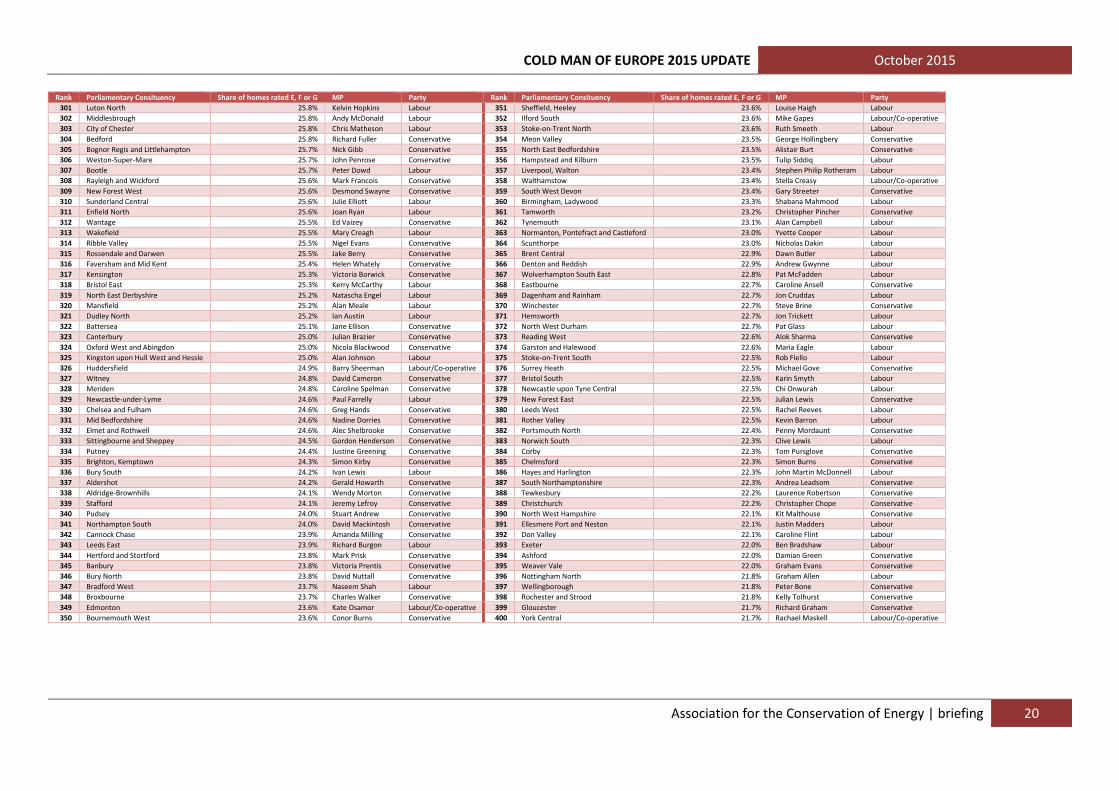
Appendix II – full list of Westminster Parliamentary constituencies in England Rank Parliamentary Consituency Share of homes rated E, F or G MP Party Rank Parliamentary Consituency Share of homes rated E, F or G MP Party
1 St Ives 50.4% Derek Thomas Conservative 51 Henley 36.3% John Howell Conservative
2 Southend West 47.6% David Amess Conservative 52 Rutland and Melton 36.3% Alan Duncan Conservative
3 Derbyshire Dales 44.8% Patrick McLoughlin Conservative 53 Kingston and Surbiton 36.3% James Berry Conservative
4 Ludlow 42.9% Philip Dunne Conservative 54 Bridgwater and West Somerset 36.2% Ian Liddell-Grainger Conservative
5 West Worcestershire 42.7% Harriett Baldwin Conservative 55 Sheffield Central 36.1% Paul Blomfield Labour
6 North Cornwall 42.3% Scott Mann Conservative 56 Finchley and Golders Green 36.1% Mike Freer Conservative
7 Birmingham, Hall Green 42.2% Roger Godsiff Labour 57 Clacton 36.0% Douglas Carswell UKIP
8 Croydon South 42.1% Chris Philp Conservative 58 Richmond (Yorks) 35.9% Rishi Sunak Conservative
9 Penrith and The Border 41.9% Rory Stewart Conservative 59 Birmingham, Edgbaston 35.8% Gisela Stuart Labour
10 Southport 41.8% John Pugh Liberal Democrat 60 South Suffolk 35.8% James Cartlidge Conservative
11 Westmorland and Lonsdale 41.5% Tim Farron Liberal Democrat 61 Bexhill and Battle 35.6% Huw Merriman Conservative
12 North Herefordshire 41.1% Bill Wiggin Conservative 62 Twickenham 35.6% Tania Mathias Conservative
13 Truro and Falmouth 41.0% Sarah Newton Conservative 63 Berwick-upon-Tweed 35.6% Anne-Marie Trevelyan Conservative
14 Wirral South 41.0% Alison McGovern Labour 64 Chesham and Amersham 35.5% Cheryl Gillan Conservative
15 Leicester South 40.5% Jon Ashworth Labour/Co-operative 65 North Devon 35.5% Peter Heaton-Jones Conservative
16 Broxtowe 40.5% Anna Soubry Conservative 66 Scarborough and Whitby 35.4% Robert Goodwill Conservative
17 Camborne and Redruth 40.2% George Eustice Conservative 67 Skipton and Ripon 35.4% Julian Smith Conservative
18 Wolverhampton South West 40.1% Rob Marris Labour 68 Beckenham 35.3% Bob Stewart Conservative
19 Mole Valley 39.5% Paul Beresford Conservative 69 West Dorset 35.0% Oliver Letwin Conservative
20 Sutton Coldfield 39.4% Andrew Mitchell Conservative 70 Buckingham 34.7% John Bercow Speaker
21 Wallasey 39.4% Angela Eagle Labour 71 Tatton 34.7% George Osborne Conservative
22 Thirsk and Malton 39.3% Kevin Hollinrake Conservative 72 Reigate 34.7% Crispin Blunt Conservative
23 Torridge and West Devon 39.1% Geoffrey Cox Conservative 73 Wirral West 34.6% Margaret Greenwood Labour
24 Sheffield, Hallam 39.0% Nick Clegg Liberal Democrat 74 South West Surrey 34.6% Jeremy Hunt Conservative
25 Gedling 38.7% Vernon Coaker Labour 75 North West Leicestershire 34.6% Andrew Bridgen Conservative
26 Rochford and Southend East 38.5% James Duddridge Conservative 76 Saffron Walden 34.6% Alan Haselhurst Conservative
27 Totnes 38.4% Sarah Wollaston Conservative 77 Altrincham and Sale West 34.5% Graham Brady Conservative
28 St Austell and Newquay 38.4% Steve Double Conservative 78 Guildford 34.4% Anne Milton Conservative
29 The Cotswolds 38.3% Geoffrey Clifton-Brown Conservative 79 Arundel and South Downs 34.4% Nick Herbert Conservative
30 Tunbridge Wells 38.2% Greg Clark Conservative 80 Eddisbury 34.4% Antoinette Sandbach Conservative
31 Nottingham East 38.2% Chris Leslie Labour/Co-operative 81 Stratford-on-Avon 34.4% Nadhim Zahawi Conservative
32 Erewash 38.1% Maggie Throup Conservative 82 North Shropshire 34.2% Owen Paterson Conservative
33 Forest of Dean 38.1% Mark Harper Conservative 83 Suffolk Coastal 34.2% Therese Coffey Conservative
34 Birmingham, Selly Oak 38.1% Steve McCabe Labour 84 Castle Point 34.1% Rebecca Harris Conservative
35 Hexham 38.0% Guy Opperman Conservative 85 Harwich and North Essex 34.0% Bernard Jenkin Conservative
36 North Norfolk 38.0% Norman Lamb Liberal Democrat 86 Staffordshire Moorlands 33.9% Karen Bradley Conservative
37 South East Cornwall 38.0% Sheryll Murray Conservative 87 East Surrey 33.9% Sam Gyimah Conservative
38 Ruislip, Northwood and Pinner 37.7% Nick Hurd Conservative 88 Devizes 33.7% Claire Perry Conservative
39 Richmond Park 37.7% Zac Goldsmith Conservative 89 Birmingham, Erdington 33.7% Jack Dromey Labour
40 Central Devon 37.7% Mel Stride Conservative 90 Brentwood and Ongar 33.7% Eric Pickles Conservative
41 Louth and Horncastle 37.6% Victoria Atkins Conservative 91 Warley 33.7% John Spellar Labour
42 Rushcliffe 37.6% Kenneth Clarke Conservative 92 Orpington 33.7% Jo Johnson Conservative
43 Liverpool, Wavertree 37.3% Luciana Berger Labour/Co-operative 93 Old Bexley and Sidcup 33.6% James Brokenshire Conservative
44 Carshalton and Wallington 37.2% Tom Brake Liberal Democrat 94 Charnwood 33.6% Edward Argar Conservative
45 Birmingham, Yardley 37.0% Jess Phillips Labour 95 Workington 33.5% Sue Hayman Labour
46 Epsom and Ewell 36.8% Chris Grayling Conservative 96 Luton South 33.5% Gavin Shuker Labour/Co-operative
47 Birmingham, Perry Barr 36.8% Khalid Mahmood Labour 97 Chichester 33.4% Andrew Tyrie Conservative
48 Boston and Skegness 36.7% Matt Warman Conservative 98 Sutton and Cheam 33.4% Paul Scully Conservative
49 Somerton and Frome 36.4% David Warburton Conservative 99 Kenilworth and Southam 33.4% Jeremy Wright Conservative
50 Esher and Walton 36.4% Dominic Raab Conservative 100 Tiverton and Honiton 33.3% Neil Parish Conservative
COLD MAN OF EUROPE 2015 UPDATE October 2015
Association for the Conservation of Energy | briefing 18
Rank Parliamentary Consituency Share of homes rated E, F or G MP Party Rank Parliamentary Consituency Share of homes rated E, F or G MP Party
101 South Thanet 33.3% Craig Mackinlay Conservative 151 Eltham 30.6% Clive Efford Labour
102 Newark 33.3% Robert Jenrick Conservative 152 Bromsgrove 30.5% Sajid Javid Conservative
103 Bristol West 33.0% Thangam Debbonaire Labour 153 Beverley and Holderness 30.5% Graham Stuart Conservative
104 Chingford and Woodford Green 33.0% Iain Duncan Smith Conservative 154 Beaconsfield 30.5% Dominic Grieve Conservative
105 Solihull 32.9% Julian Knight Conservative 155 East Devon 30.4% Hugo Swire Conservative
106 Wealden 32.8% Nusrat Ghani Conservative 156 Lewes 30.4% Maria Caulfield Conservative
107 Maidenhead 32.7% Theresa May Conservative 157 Derby North 30.4% Amanda Solloway Conservative
108 Stroud 32.7% Neil Carmichael Conservative 158 Derby South 30.4% Margaret Beckett Labour
109 South West Norfolk 32.6% Elizabeth Truss Conservative 159 Ealing Central and Acton 30.4% Rupa Huq Labour
110 Isle of Wight 32.6% Andrew Turner Conservative 160 North Warwickshire 30.4% Craig Tracey Conservative
111 Hereford and South Herefordshire 32.6% Jesse Norman Conservative 161 Bassetlaw 30.3% John Mann Labour
112 Bromley and Chislehurst 32.5% Bob Neill Conservative 162 Mid Derbyshire 30.3% Pauline Latham Conservative
113 Worthing West 32.5% Peter Bottomley Conservative 163 Stourbridge 30.3% Margot James Conservative
114 Sevenoaks 32.4% Michael Fallon Conservative 164 Leeds North East 30.2% Fabian Hamilton Labour
115 Pendle 32.4% Andrew Stephenson Conservative 165 Hastings and Rye 30.2% Amber Rudd Conservative
116 Torbay 32.4% Kevin Foster Conservative 166 South Norfolk 30.2% Richard Bacon Conservative
117 Dulwich and West Norwood 32.4% Helen Hayes Labour 167 Selby and Ainsty 30.1% Nigel Adams Conservative
118 Burton 32.4% Andrew Griffiths Conservative 168 Keighley 30.1% Kris Hopkins Conservative
119 Cheadle 32.3% Mary Robinson Conservative 169 Daventry 30.0% Chris Heaton-Harris Conservative
120 Bristol North West 32.2% Charlotte Leslie Conservative 170 Epping Forest 29.9% Eleanor Laing Conservative
121 East Yorkshire 31.8% Greg Knight Conservative 171 South Holland and The Deepings 29.9% John Hayes Conservative
122 North West Norfolk 31.8% Henry Bellingham Conservative 172 Barrow and Furness 29.9% John Woodcock Labour/Co-operative
123 Northampton North 31.8% Michael Ellis Conservative 173 North East Hertfordshire 29.8% Oliver Heald Conservative
124 Central Suffolk and North Ipswich 31.5% Daniel Poulter Conservative 174 North East Somerset 29.8% Jacob Rees-Mogg Conservative
125 Darlington 31.5% Jenny Chapman Labour 175 Calder Valley 29.8% Craig Whittaker Conservative
126 Birkenhead 31.4% Frank Field Labour 176 Runnymede and Weybridge 29.7% Philip Hammond Conservative
127 Harrow West 31.3% Gareth Thomas Labour/Co-operative 177 Newton Abbot 29.7% Anne Marie Morris Conservative
128 Doncaster North 31.3% Ed Miliband Labour 178 Nottingham South 29.7% Lilian Greenwood Labour
129 Romford 31.3% Andrew Rosindell Conservative 179 Stockport 29.6% Ann Coffey Labour
130 Enfield, Southgate 31.3% David Burrowes Conservative 180 Leeds North West 29.6% Greg Mulholland Liberal Democrat
131 Amber Valley 31.3% Nigel Mills Conservative 181 Brigg and Goole 29.5% Andrew Percy Conservative
132 Haltemprice and Howden 31.1% David Davis Conservative 182 Salisbury 29.4% John Glen Conservative
133 Wyre Forest 31.1% Mark Garnier Conservative 183 Wimbledon 29.4% Stephen Hammond Conservative
134 Hornchurch and Upminster 31.1% Angela Watkinson Conservative 184 Halifax 29.3% Holly Lynch Labour
135 West Suffolk 31.0% Matthew Hancock Conservative 185 Walsall South 29.3% Valerie Vaz Labour
136 Hove 30.9% Peter Kyle Labour 186 Wells 29.3% James Heappey Conservative
137 Spelthorne 30.9% Kwasi Kwarteng Conservative 187 Kettering 29.2% Philip Hollobone Conservative
138 Loughborough 30.9% Nicky Morgan Conservative 188 Folkestone and Hythe 29.2% Damian Collins Conservative
139 Manchester, Withington 30.9% Jeff Smith Labour 189 Manchester, Gorton 29.2% Gerald Kaufman Labour
140 Sleaford and North Hykeham 30.8% Stephen Phillips Conservative 190 Macclesfield 29.2% David Rutley Conservative
141 Sefton Central 30.8% Bill Esterson Labour 191 Grantham and Stamford 29.1% Nicholas Boles Conservative
142 Worcester 30.8% Robin Walker Conservative 192 Fylde 29.1% Mark Menzies Conservative
143 South West Wiltshire 30.8% Andrew Murrison Conservative 193 Harrogate and Knaresborough 29.0% Andrew Jones Conservative
144 Leicester West 30.8% Liz Kendall Labour 194 Halesowen and Rowley Regis 29.0% James Morris Conservative
145 Copeland 30.8% Jamie Reed Labour 195 Maldon 28.9% John Whittingdale Conservative
146 Bosworth 30.7% David Tredinnick Conservative 196 South West Hertfordshire 28.8% David Gauke Conservative
147 Chipping Barnet 30.7% Theresa Villiers Conservative 197 Blackpool South 28.8% Gordon Marsden Labour
148 Gainsborough 30.7% Edward Leigh Conservative 198 Hornsey and Wood Green 28.8% Catherine West Labour
149 Stone 30.6% Bill Cash Conservative 199 Harborough 28.8% Edward Garnier Conservative
150 Bath 30.6% Ben Howlett Conservative 200 Newbury 28.8% Richard Benyon Conservative

COLD MAN OF EUROPE 2015 UPDATE October 2015
Association for the Conservation of Energy | briefing 19
Rank Parliamentary Consituency Share of homes rated E, F or G MP Party Rank Parliamentary Consituency Share of homes rated E, F or G MP Party
201 North Thanet 28.8% Roger Gale Conservative 251 South Staffordshire 26.9% Gavin Williamson Conservative
202 Plymouth, Sutton and Devonport 28.7% Oliver Colvile Conservative 252 Leyton and Wanstead 26.8% John Cryer Labour
203 Great Grimsby 28.7% Melanie Onn Labour 253 Croydon Central 26.8% Gavin Barwell Conservative
204 Coventry North West 28.7% Geoffrey Robinson Labour 254 Dover 26.7% Charlie Elphicke Conservative
205 Windsor 28.7% Adam Afriyie Conservative 255 Blackpool North and Cleveleys 26.7% Paul Maynard Conservative
206 Coventry South 28.7% Jim Cunningham Labour 256 South Leicestershire 26.7% Alberto Costa Conservative
207 Brentford and Isleworth 28.6% Ruth Cadbury Labour 257 West Bromwich East 26.7% Tom Watson Labour
208 Ilford North 28.6% Wes Streeting Labour 258 Sherwood 26.6% Mark Spencer Conservative
209 Croydon North 28.5% Steve Reed Labour/Co-operative 259 Newcastle upon Tyne East 26.6% Nick Brown Labour
210 Brent North 28.5% Barry Gardiner Labour 260 Rugby 26.6% Mark Pawsey Conservative
211 South Dorset 28.4% Richard Drax Conservative 261 Cambridge 26.6% Daniel Zeichner Labour
212 Shipley 28.4% Philip Davies Conservative 262 Stretford and Urmston 26.6% Kate Green Labour
213 Doncaster Central 28.3% Rosie Winterton Labour 263 Hazel Grove 26.6% William Wragg Conservative
214 Mid Norfolk 28.3% George Freeman Conservative 264 Liverpool, Riverside 26.6% Louise Ellman Labour/Co-operative
215 St Albans 28.2% Anne Main Conservative 265 Leicester East 26.6% Keith Vaz Labour
216 Broadland 28.2% Keith Simpson Conservative 266 Lewisham West and Penge 26.6% Jim Dowd Labour
217 Lancaster and Fleetwood 28.1% Cat Smith Labour 267 Hyndburn 26.6% Graham Jones Labour
218 Mid Worcestershire 28.1% Nigel Huddleston Conservative 268 North Somerset 26.5% Liam Fox Conservative
219 South Cambridgeshire 28.0% Heidi Allen Conservative 269 Romsey and Southampton North 26.5% Caroline Nokes Conservative
220 Harrow East 28.0% Bob Blackman Conservative 270 Ipswich 26.5% Ben Gummer Conservative
221 Yeovil 28.0% Marcus Fysh Conservative 271 South East Cambridgeshire 26.5% Lucy Frazer Conservative
222 Shrewsbury and Atcham 27.9% Daniel Kawczynski Conservative 272 Burnley 26.4% Julie Cooper Labour
223 East Worthing and Shoreham 27.9% Tim Loughton Conservative 273 Watford 26.3% Richard Harrington Conservative
224 Bishop Auckland 27.9% Helen Goodman Labour 274 Braintree 26.3% James Cleverly Conservative
225 Waveney 27.8% Peter Aldous Conservative 275 Witham 26.3% Priti Patel Conservative
226 Bournemouth East 27.8% Tobias Ellwood Conservative 276 Birmingham, Northfield 26.3% Richard Burden Labour
227 High Peak 27.8% Andrew Bingham Conservative 277 Lincoln 26.3% Karl McCartney Conservative
228 Warwick and Leamington 27.8% Chris White Conservative 278 Morecambe and Lunesdale 26.3% David Morris Conservative
229 North Wiltshire 27.8% James Gray Conservative 279 Coventry North East 26.3% Colleen Fletcher Labour
230 Hitchin and Harpenden 27.8% Peter Lilley Conservative 280 Gravesham 26.3% Adam Holloway Conservative
231 Birmingham, Hodge Hill 27.7% Liam Byrne Labour 281 Reading East 26.3% Rob Wilson Conservative
232 Dudley South 27.7% Mike Wood Conservative 282 Tooting 26.3% Sadiq Khan Labour
233 Brighton, Pavilion 27.6% Caroline Lucas Green 283 Horsham 26.2% Jeremy Quin Conservative
234 Taunton Deane 27.6% Rebecca Pow Conservative 284 Congleton 26.2% Fiona Bruce Conservative
235 Bexleyheath and Crayford 27.4% David Evennett Conservative 285 Cleethorpes 26.2% Martin Vickers Conservative
236 Tonbridge and Malling 27.4% Thomas Tugendhat Conservative 286 Oxford East 26.1% Andrew Smith Labour
237 Cheltenham 27.4% Alex Chalk Conservative 287 Colne Valley 26.1% Jason McCartney Conservative
238 Maidstone and The Weald 27.3% Helen Grant Conservative 288 Woking 26.1% Jonathan Lord Conservative
239 Uxbridge and South Ruislip 27.3% Boris Johnson Conservative 289 Bury St Edmunds 26.1% Jo Churchill Conservative
240 Ashfield 27.3% Gloria De Piero Labour 290 South Derbyshire 26.1% Heather Wheeler Conservative
241 Stoke-on-Trent Central 27.2% Tristram Hunt Labour 291 Great Yarmouth 26.0% Brandon Lewis Conservative
242 Bolsover 27.2% Dennis Skinner Labour 292 Lewisham East 26.0% Heidi Alexander Labour
243 Streatham 27.2% Chuka Umunna Labour 293 Lichfield 26.0% Michael Fabricant Conservative
244 North Dorset 27.1% Simon Hoare Conservative 294 Kingston upon Hull North 26.0% Diana R. Johnson Labour
245 Wycombe 27.0% Steven Baker Conservative 295 Mid Sussex 25.9% Nicholas Soames Conservative
246 North East Cambridgeshire 27.0% Stephen Barclay Conservative 296 West Lancashire 25.9% Rosie Cooper Labour
247 Thornbury and Yate 27.0% Luke Hall Conservative 297 Gillingham and Rainham 25.8% Rehman Chishti Conservative
248 Crewe and Nantwich 27.0% Edward Timpson Conservative 298 Hendon 25.8% Matthew Offord Conservative
249 Nuneaton 27.0% Marcus Jones Conservative 299 Hertsmere 25.8% Oliver Dowden Conservative
250 East Hampshire 27.0% Damian Hinds Conservative 300 Wyre and Preston North 25.8% Ben Wallace Conservative
COLD MAN OF EUROPE 2015 UPDATE October 2015
Association for the Conservation of Energy | briefing 20
Rank Parliamentary Consituency Share of homes rated E, F or G MP Party Rank Parliamentary Consituency Share of homes rated E, F or G MP Party
301 Luton North 25.8% Kelvin Hopkins Labour 351 Sheffield, Heeley 23.6% Louise Haigh Labour
302 Middlesbrough 25.8% Andy McDonald Labour 352 Ilford South 23.6% Mike Gapes Labour/Co-operative
303 City of Chester 25.8% Chris Matheson Labour 353 Stoke-on-Trent North 23.6% Ruth Smeeth Labour
304 Bedford 25.8% Richard Fuller Conservative 354 Meon Valley 23.5% George Hollingbery Conservative
305 Bognor Regis and Littlehampton 25.7% Nick Gibb Conservative 355 North East Bedfordshire 23.5% Alistair Burt Conservative
306 Weston-Super-Mare 25.7% John Penrose Conservative 356 Hampstead and Kilburn 23.5% Tulip Siddiq Labour
307 Bootle 25.7% Peter Dowd Labour 357 Liverpool, Walton 23.4% Stephen Philip Rotheram Labour
308 Rayleigh and Wickford 25.6% Mark Francois Conservative 358 Walthamstow 23.4% Stella Creasy Labour/Co-operative
309 New Forest West 25.6% Desmond Swayne Conservative 359 South West Devon 23.4% Gary Streeter Conservative
310 Sunderland Central 25.6% Julie Elliott Labour 360 Birmingham, Ladywood 23.3% Shabana Mahmood Labour
311 Enfield North 25.6% Joan Ryan Labour 361 Tamworth 23.2% Christopher Pincher Conservative
312 Wantage 25.5% Ed Vaizey Conservative 362 Tynemouth 23.1% Alan Campbell Labour
313 Wakefield 25.5% Mary Creagh Labour 363 Normanton, Pontefract and Castleford 23.0% Yvette Cooper Labour
314 Ribble Valley 25.5% Nigel Evans Conservative 364 Scunthorpe 23.0% Nicholas Dakin Labour
315 Rossendale and Darwen 25.5% Jake Berry Conservative 365 Brent Central 22.9% Dawn Butler Labour
316 Faversham and Mid Kent 25.4% Helen Whately Conservative 366 Denton and Reddish 22.9% Andrew Gwynne Labour
317 Kensington 25.3% Victoria Borwick Conservative 367 Wolverhampton South East 22.8% Pat McFadden Labour
318 Bristol East 25.3% Kerry McCarthy Labour 368 Eastbourne 22.7% Caroline Ansell Conservative
319 North East Derbyshire 25.2% Natascha Engel Labour 369 Dagenham and Rainham 22.7% Jon Cruddas Labour
320 Mansfield 25.2% Alan Meale Labour 370 Winchester 22.7% Steve Brine Conservative
321 Dudley North 25.2% Ian Austin Labour 371 Hemsworth 22.7% Jon Trickett Labour
322 Battersea 25.1% Jane Ellison Conservative 372 North West Durham 22.7% Pat Glass Labour
323 Canterbury 25.0% Julian Brazier Conservative 373 Reading West 22.6% Alok Sharma Conservative
324 Oxford West and Abingdon 25.0% Nicola Blackwood Conservative 374 Garston and Halewood 22.6% Maria Eagle Labour
325 Kingston upon Hull West and Hessle 25.0% Alan Johnson Labour 375 Stoke-on-Trent South 22.5% Rob Flello Labour
326 Huddersfield 24.9% Barry Sheerman Labour/Co-operative 376 Surrey Heath 22.5% Michael Gove Conservative
327 Witney 24.8% David Cameron Conservative 377 Bristol South 22.5% Karin Smyth Labour
328 Meriden 24.8% Caroline Spelman Conservative 378 Newcastle upon Tyne Central 22.5% Chi Onwurah Labour
329 Newcastle-under-Lyme 24.6% Paul Farrelly Labour 379 New Forest East 22.5% Julian Lewis Conservative
330 Chelsea and Fulham 24.6% Greg Hands Conservative 380 Leeds West 22.5% Rachel Reeves Labour
331 Mid Bedfordshire 24.6% Nadine Dorries Conservative 381 Rother Valley 22.5% Kevin Barron Labour
332 Elmet and Rothwell 24.6% Alec Shelbrooke Conservative 382 Portsmouth North 22.4% Penny Mordaunt Conservative
333 Sittingbourne and Sheppey 24.5% Gordon Henderson Conservative 383 Norwich South 22.3% Clive Lewis Labour
334 Putney 24.4% Justine Greening Conservative 384 Corby 22.3% Tom Pursglove Conservative
335 Brighton, Kemptown 24.3% Simon Kirby Conservative 385 Chelmsford 22.3% Simon Burns Conservative
336 Bury South 24.2% Ivan Lewis Labour 386 Hayes and Harlington 22.3% John Martin McDonnell Labour
337 Aldershot 24.2% Gerald Howarth Conservative 387 South Northamptonshire 22.3% Andrea Leadsom Conservative
338 Aldridge-Brownhills 24.1% Wendy Morton Conservative 388 Tewkesbury 22.2% Laurence Robertson Conservative
339 Stafford 24.1% Jeremy Lefroy Conservative 389 Christchurch 22.2% Christopher Chope Conservative
340 Pudsey 24.0% Stuart Andrew Conservative 390 North West Hampshire 22.1% Kit Malthouse Conservative
341 Northampton South 24.0% David Mackintosh Conservative 391 Ellesmere Port and Neston 22.1% Justin Madders Labour
342 Cannock Chase 23.9% Amanda Milling Conservative 392 Don Valley 22.1% Caroline Flint Labour
343 Leeds East 23.9% Richard Burgon Labour 393 Exeter 22.0% Ben Bradshaw Labour
344 Hertford and Stortford 23.8% Mark Prisk Conservative 394 Ashford 22.0% Damian Green Conservative
345 Banbury 23.8% Victoria Prentis Conservative 395 Weaver Vale 22.0% Graham Evans Conservative
346 Bury North 23.8% David Nuttall Conservative 396 Nottingham North 21.8% Graham Allen Labour
347 Bradford West 23.7% Naseem Shah Labour 397 Wellingborough 21.8% Peter Bone Conservative
348 Broxbourne 23.7% Charles Walker Conservative 398 Rochester and Strood 21.8% Kelly Tolhurst Conservative
349 Edmonton 23.6% Kate Osamor Labour/Co-operative 399 Gloucester 21.7% Richard Graham Conservative
350 Bournemouth West 23.6% Conor Burns Conservative 400 York Central 21.7% Rachael Maskell Labour/Co-operative

COLD MAN OF EUROPE 2015 UPDATE October 2015
Association for the Conservation of Energy | briefing 21
Rank Parliamentary Consituency Share of homes rated E, F or G MP Party Rank Parliamentary Consituency Share of homes rated E, F or G MP Party
401 Walsall North 21.6% David Winnick Labour 451 Morley and Outwood 19.2% Andrea Jenkyns Conservative
402 Ealing North 21.6% Steve Pound Labour 452 Stalybridge and Hyde 19.1% Jonathan Reynolds Labour/Co-operative
403 Poole 21.6% Robert Syms Conservative 453 Rotherham 19.1% Sarah Champion Labour
404 Portsmouth South 21.5% Flick Drummond Conservative 454 Mitcham and Morden 19.1% Siobhain McDonagh Labour
405 East Ham 21.5% Stephen Timms Labour 455 Greenwich and Woolwich 19.1% Matthew Pennycook Labour
406 Liverpool, West Derby 21.5% Stephen Twigg Labour/Co-operative 456 South Basildon and East Thurrock 19.1% Stephen Metcalfe Conservative
407 South Ribble 21.4% Seema Kennedy Conservative 457 Chesterfield 19.0% Toby Perkins Labour
408 Peterborough 21.4% Stewart Jackson Conservative 458 Norwich North 18.9% Chloe Smith Conservative
409 Sheffield, Brightside and Hillsborough 21.3% Harry Harpham Labour 459 Cities of London and Westminster 18.8% Mark Field Conservative
410 North West Cambridgeshire 21.3% Shailesh Vara Conservative 460 St Helens North 18.8% Conor McGinn Labour
411 Oldham East and Saddleworth 21.3% Debbie Abrahams Labour 461 West Bromwich West 18.7% Adrian Bailey Labour/Co-operative
412 Southampton, Test 21.2% Alan Whitehead Labour 462 Mid Dorset and North Poole 18.7% Michael Tomlinson Conservative
413 Carlisle 21.1% John Stevenson Conservative 463 South Shields 18.6% Emma Lewell-Buck Labour
414 City of Durham 21.1% Roberta Blackman-Woods Labour 464 York Outer 18.5% Julian Sturdy Conservative
415 Ealing, Southall 21.0% Virendra Sharma Labour 465 Vauxhall 18.5% Kate Hoey Labour
416 North East Hampshire 21.0% Ranil Jayawardena Conservative 466 Houghton and Sunderland South 18.5% Bridget Phillipson Labour
417 Bradford South 20.8% Judith Cummins Labour 467 Wansbeck 18.4% Ian Lavery Labour
418 Kingswood 20.8% Chris Skidmore Conservative 468 Chatham and Aylesford 18.4% Tracey Crouch Conservative
419 Dewsbury 20.7% Paula Sherriff Labour 469 Makerfield 18.4% Yvonne Fovargue Labour
420 Barnsley Central 20.6% Dan Jarvis Labour 470 Blaydon 18.3% David Anderson Labour
421 Redcar 20.6% Anna Turley Labour/Co-operative 471 Preston 18.1% Mark Hendrick Labour/Co-operative
422 Wokingham 20.5% John Redwood Conservative 472 The Wrekin 18.1% Mark Pritchard Conservative
423 Filton and Bradley Stoke 20.3% Jack Lopresti Conservative 473 Barking 18.1% Margaret Hodge Labour
424 Colchester 20.3% Will Quince Conservative 474 Chorley 18.1% Lindsay Hoyle Labour
425 Redditch 20.2% Karen Lumley Conservative 475 Slough 18.1% Fiona Mactaggart Labour
426 Aylesbury 20.2% David Lidington Conservative 476 Stockton South 18.1% James Wharton Conservative
427 Wigan 20.2% Lisa Nandy Labour 477 St Helens South and Whiston 18.0% Marie Rimmer Labour
428 Sedgefield 20.2% Phil Wilson Labour 478 Salford and Eccles 17.9% Rebecca Long-Bailey Labour
429 Batley and Spen 20.2% Jo Cox Labour 479 Camberwell and Peckham 17.9% Harriet Harman Labour
430 Lewisham, Deptford 20.1% Vicky Foxcroft Labour 480 Gateshead 17.8% Ian Mearns Labour
431 Ashton-under-Lyne 20.0% Angela Rayner Labour 481 Wythenshawe and Sale East 17.8% Mike Kane Labour
432 Middlesbrough South and East Cleveland 20.0% Tom Blenkinsop Labour 482 Islington North 17.8% Jeremy Corbyn Labour
433 Hammersmith 19.9% Andrew Slaughter Labour 483 Hackney North and Stoke Newington 17.7% Diane Abbott Labour
434 Feltham and Heston 19.9% Seema Malhotra Labour/Co-operative 484 Basildon and Billericay 17.7% John Baron Conservative
435 Warrington South 19.9% David Mowat Conservative 485 Holborn and St Pancras 17.6% Keir Starmer Labour
436 Huntingdon 19.8% Jonathan Djanogly Conservative 486 Hemel Hempstead 17.5% Mike Penning Conservative
437 Barnsley East 19.8% Michael Dugher Labour 487 Leigh 17.5% Andy Burnham Labour
438 South West Bedfordshire 19.7% Andrew Selous Conservative 488 Welwyn Hatfield 17.5% Grant Shapps Conservative
439 Penistone and Stocksbridge 19.7% Angela Smith Labour 489 Westminster North 17.4% Karen Buck Labour
440 Bradford East 19.7% Imran Hussain Labour 490 Blackburn 17.4% Kate Hollern Labour
441 Bolton West 19.6% Chris Green Conservative 491 Halton 17.4% Derek Twigg Labour
442 Havant 19.5% Alan Mak Conservative 492 Kingston upon Hull East 17.4% Karl Turner Labour
443 Wolverhampton North East 19.4% Emma Reynolds Labour 493 Bolton North East 17.2% David Crausby Labour
444 Hartlepool 19.4% Iain Wright Labour 494 Thurrock 16.9% Jackie Doyle-Price Conservative
445 Dartford 19.3% Gareth Johnson Conservative 495 Erith and Thamesmead 16.8% Teresa Pearce Labour
446 Wentworth and Dearne 19.3% John Healey Labour 496 Jarrow 16.7% Stephen Hepburn Labour
447 Chippenham 19.3% Michelle Donelan Conservative 497 Tottenham 16.7% David Lammy Labour
448 Newcastle upon Tyne North 19.2% Catherine McKinnell Labour 498 Sheffield South East 16.7% Clive Betts Labour
449 Leeds Central 19.2% Hilary Benn Labour 499 Oldham West and Royton 16.6% Michael Meacher Labour
450 Southampton, Itchen 19.2% Royston Smith Conservative 500 Fareham 16.4% Suella Fernandes Conservative

COLD MAN OF EUROPE 2015 UPDATE October 2015
Association for the Conservation of Energy | briefing 22
Rank Parliamentary Consituency Share of homes rated E, F or G MP Party
501 Heywood and Middleton 16.4% Liz McInnes Labour
502 North Durham 16.0% Kevan Jones Labour
503 West Ham 16.0% Lyn Brown Labour
504 Plymouth, Moor View 15.9% Johnny Mercer Conservative
505 Rochdale 15.8% Simon Danczuk Labour
506 Bracknell 15.6% Phillip Lee Conservative
507 Easington 15.5% Grahame Morris Labour
508 Harlow 15.4% Robert Halfon Conservative
509 Blackley and Broughton 15.4% Graham Stringer Labour
510 Stevenage 15.4% Stephen McPartland Conservative
511 Gosport 15.3% Caroline Dinenage Conservative
512 South Swindon 15.1% Robert Buckland Conservative
513 Warrington North 14.8% Helen Jones Labour
514 Islington South and Finsbury 14.7% Emily Thornberry Labour
515 Stockton North 14.7% Alex Cunningham Labour
516 Bolton South East 14.3% Yasmin Qureshi Labour
517 Worsley and Eccles South 14.2% Barbara Keeley Labour
518 Hackney South and Shoreditch 14.1% Meg Hillier Labour/Co-operative
519 Milton Keynes North 14.1% Mark Lancaster Conservative
520 Eastleigh 14.0% Mims Davies Conservative
521 Blyth Valley 14.0% Ronnie Campbell Labour
522 Bethnal Green and Bow 13.7% Rushanara Ali Labour
523 North Tyneside 13.6% Mary Glindon Labour
524 Manchester Central 12.6% Lucy Powell Labour/Co-operative
525 Telford 12.3% Lucy Allan Conservative
526 Knowsley 12.3% George Howarth Labour
527 Washington and Sunderland West 11.9% Sharon Hodgson Labour
528 Crawley 11.4% Henry Smith Conservative
529 North Swindon 10.7% Justin Tomlinson Conservative
530 Bermondsey and Old Southwark 10.6% Neil Coyle Labour
531 Milton Keynes South 10.4% Iain Stewart Conservative
532 Basingstoke 9.1% Maria Miller Conservative
533 Poplar and Limehouse 7.3% Jim Fitzpatrick Labour