the college persistence questionnaire ...libres.uncg.edu/ir/asu/f/lindheimer,...
TRANSCRIPT

THE COLLEGE PERSISTENCE QUESTIONNAIRE: DEVELOPING SCALES TO ASSESS STUDENT RETENTION AND INSTITUTIONAL EFFECTIVENESS
A Thesis by
JACOB BENJAMIN LINDHEIMER III
Submitted to the Graduate School Appalachian State University
in partial fulfillment of the requirements for the degree of MASTER OF ARTS
August 2011 Department of Psychology

THE COLLEGE PERSISTENCE QUESTIONNAIRE: DEVELOPING SCALES TO ASSESS STUDENT RETENTION AND INSTITUTIONAL EFFECTIVENESS
A Thesis
by JACOB BENJAMIN LINDHEIMER III
August 2011 APPROVED BY: _____________________________________ Hall P. Beck Chair, Thesis Committee _____________________________________ Christopher A. Dickinson Member, Thesis Committee _____________________________________ Todd McElroy Member, Thesis Committee _____________________________________ James C. Denniston Chair, Department of Psychology _____________________________________ Edelma D. Huntley Dean, Research and Graduate Studies

Copyright by Jacob Benjamin Lindheimer III All Rights Reserved
Permission is hereby granted to the Appalachian State University Belk Library and to the
Department of Psychology to display and provide access to this thesis for appropriate academic and research purposes.

Foreword
This thesis is written in accordance with the style of the Publication Manual of the American Psychological Association (6th Edition) as required by the Department of
Psychology at Appalachian State University
Abstract The current study extends previous research using the College Persistence Questionnaire (CPQ), an instrument designed to predict whether college freshman return for their sophomore years (Davidson, Beck, & Milligan, 2009). Between 6 to 12 weeks into their first semester, participants from three southeastern colleges and universities took the Student Experience Form of the questionnaire online. A principal component analysis was performed to determine if the Student Experience Form of the CPQ could be enhanced by a set of test questions. Two binary logistic regressions established the predictive validity of the CPQ and revealed that the additional items improved the utility of the instrument. The three most salient predictors of return status were Institutional Commitment, Academic Integration, and Scholastic Conscientiousness. A second principal component analysis used a majority of the same items and yielded an Institutional Effectiveness scale that could be used to assess a variety of campus objectives. Keywords: retention, institutional effectiveness, persistence, attrition, College Persistence Questionnaire
v.

Dedication
I wish to dedicate this thesis to my family, Thom, Carmen, and Alex. I could not have possibly accomplished this feat without their unwavering encouragement.
vi.

Acknowledgments
I would like to thank my thesis chair and mentor, Dr. Hall “Skip” Beck, whose fervor for producing scholarly research is rivaled only by a proclivity for helping his students. I owe
Dr. Beck my deepest gratitude for allowing me the opportunity to participate in his research laboratory. I will never forget the invaluable lessons he bestowed upon me. I
would also like to thank my thesis committee, Dr. Dickinson and Dr. McElroy, who have provided me with support and guidance through this entire process.
vii.

Running head: COLLEGE PERSISTENCE QUESTIONNAIRE 1
The College Persistence Questionnaire: Developing Scales to Assess
Student Retention and Institutional Effectiveness
Jacob Benjamin Lindheimer III
Appalachian State University

COLLEGE PERSISTENCE QUESTIONNAIRE 2
The College Persistence Questionnaire: Developing Scales to Assess
Student Retention and Institutional Effectiveness
Nearly half of all students who matriculate at American colleges and universities do
not graduate within seven years (National Center for Public Policy and Higher Education,
2002). Although there has been a long history of efforts by colleges and universities to
curtail attrition rates, several factors have recently prompted schools to increase their
efforts to identify at-risk students.
The ability of the United States (U.S.) to compete in a global market is threatened
by the loss of skilled workers. By 2012, the number of jobs requiring advanced skills will
grow at twice the rate of those requiring basic skills (Hecker, 2004; U.S. Department of
Labor, 2000). Each person who drops out of college adds to an already overcrowded
unskilled and semi-skilled work force. A second fact that stimulates interest in retention
is that our nation’s higher education budgets and resources are dwindling. Colleges and
universities lose precious funds when students do not complete their education. A third
pressing matter concerns the financial ramifications that individuals encounter when they
drop out of college. Many students who discontinue their educations are sacrificing an
overall quality of life and must come to terms with the death of a personal dream.
One of the greatest challenges in retention research is identifying variables that
have a prominent effect on persistence decisions. Davidson, Beck, and Milligan (2009)
reviewed the retention literature on higher education and identified the following eight
themes: institutional and degree commitment, social and academic integration, support
services satisfaction, personality and psychological adjustment, academic orientation, and
financial strain.

COLLEGE PERSISTENCE QUESTIONNAIRE 3
Institutional commitment is the degree that students identify with their current
school. When students become displeased with their present college or university, they
may seek to transfer to a new school or dropout altogether. One strategy for retaining at-
risk individuals is to build mentoring and support groups into the curriculum. A number
of studies have established that institutional commitment is a robust predictor of
persistence decisions (Mangold, Bean, Adams, Schwab, & Lynch, 2003; Padgett & Reid,
2003).
Degree commitment refers to the value that a student places on obtaining a college
education. Davidson et al. (2009) proposed that degree commitment should be
distinguished from institutional commitment. For instance, a student can believe in the
value of obtaining a degree, but may be dissatisfied with his or her current school.
Conversely, students can be happy with their present school but may find obtaining a
college degree to be nugatory. Students who have high degree commitment tend to be
more likely to persist than students who see little value in a college degree (Cofer &
Summers, 2000).
Social integration measures a student’s sense of belonging, shared values, and
similarity to others in the college environment (Davidson et al., 2009). According to
Tinto (1993), students who develop satisfying relationships with peers tend to earn better
grades and are more inclined to remain in college than less socially integrated students.
Kennedy, Sheckley, and Kehrhahn (2000) provided support for this proposition. They
found that students with low academic performance are more likely to persist if they
identified with other students. A study conducted by Nicpon et al. (2007) also indicated
that a student’s friends strongly influence academic persistence decisions. Furthermore,
COLLEGE PERSISTENCE QUESTIONNAIRE 4
freshmen seminar programs may play a critical role. Hendel (2006) found that students
who were enrolled in a first year seminar were more likely to report that they had
experienced a sense of community during their first year than students not enrolled in
freshman seminar.
Academic integration reflects a student’s perception of how well a school’s
curriculum and instruction contribute to personal goals. Academic integration is
influenced by such variables as class discussions, quality of instruction, and feelings of
intellectual growth (Davidson et al., 2009). Although academic integration is often
recognized as impacting student retention, many institutions need to develop more
effective programs for increasing involvement with the scholastic environment (Tinto,
2006). One possible remedy is for professors to become more involved with their
students outside of the classroom context. Pascarella and Terenzini (1998) found that
frequent informal contacts with faculty members augmented academic integration.
The impact of social support services is yet another common theme given
prominent attention in the retention literature. For example, students who feel well
advised report being more aware of important university information (Davidson et al.,
2009). Past research has demonstrated that students who rated their advising as good or
excellent were more likely to interact with faculty, perceive their institutional
environment as supportive, and report relatively higher levels of satisfaction with their
college experience (The National Survey of Student Engagement, 2004). Freshmen
seminar programs have been shown to promote positive student-advisor relationships.
Hendel (2006) found that students in freshmen seminar programs had higher levels of
satisfaction with their academic advising than those who were not enrolled in the course.
COLLEGE PERSISTENCE QUESTIONNAIRE 5
Personality and adjustment variables measure how well a student can cope with
various types of stress in the college environment. Some personality and adjustment
variables related to student retention include self-efficacy (Bandura, 1997), coping
strategies (Aldwin, 2007), and personal control (Perry, 2003). Bray, Braxton, and
Sullivan (1999) determined that positive and negative coping strategies were associated
with integration and commitment to institutions.
Academic orientation deals with student perceptions of the collegiate environment
and has traditionally been viewed as consisting of two elements. Learning-oriented
students focus on accumulating new knowledge and demonstrate adeptness for study
skills, abstract reasoning, and self motivation (Eison, Pollio & Milton, 1982). Grade-
oriented students are primarily concerned with attaining a course grade. In comparison to
their learning-oriented counterparts, grade-oriented undergraduates possess poor study
skills, higher test anxiety, lower grade point averages, and below average Scholastic
Aptitude Test scores (Eison et al., 1982).
Davidson, Beck, and Silver (1999) contend that student perceptions of the academic
environment involved more than learning and grade orientation. The authors developed
and validated a short questionnaire called the Survey of Academic Orientation (SAO),
which consists of the following factors: Structure Dependence, Creative Expression,
Reading for Pleasure, Academic Efficacy, Academic Apathy, and Mistrust of Instructors.
The SAO has been correlated with a number of important educational indices including
first semester grades (Beck & Davidson, 2001), stress and coping processes (Davidson &
Beck, 2006), self-actualization (Davidson, Bromfield, & Beck, 2007), and retention
(Davidson & Beck, 2006).

COLLEGE PERSISTENCE QUESTIONNAIRE 6
An individual’s financial situation can also affect persistence decisions. Financially
strained students tend to report high levels of worry about living within their current
means, difficulty of covering college costs, and feelings of inadequacy in regard to other
students’ financial situations (Davidson et al., 2009). Ishitani and DesJardins (2002)
found that students who received financial aid generally had lower drop-out rates than
non-aided students of similar financial circumstances. A six-year longitudinal study by
the National Center for Education Statistics (2003) found that 56% of high-income
students earned a bachelor’s degree within six years while only 25 % of low-income
students did.
Development of the College Persistence Questionnaire
After reviewing the previously mentioned themes, Davidson et al. (2009) composed
a series of questions which reflected variables associated with retention at one or more
institutions. The authors named this instrument the College Persistence Questionnaire
(CPQ). The purpose of the CPQ was to provide college personnel with the means to:
(a) identify students at-risk of dropping out, (b) discover why a given student is
likely to discontinue his or her education, and (c) determine the variables that
best distinguish undergraduates who will persist from those who will not persist
at their institutions. (p. 2)
Davidson et al. (2009) conducted a series of exploratory factor analyses. The final
analysis resulted in a six-factor solution consisting of 36 items generated by a direct
oblimin rotation. These items composed the Student Experiences Form of the CPQ. All
retained factors yielded eigenvalues greater than 1.4. The following factor labels were

COLLEGE PERSISTENCE QUESTIONNAIRE 7
assigned: Academic Integration, Social Integration, Support Services Satisfaction, Degree
Commitment, Institutional Commitment, and Academic Conscientiousness.
Davidson et al. (2009) also sought to determine how well the CPQ predicted
whether freshmen would return for their sophomore year. Participants were 283 students
enrolled in a freshman seminar program at a small southwestern university. Davidson et
al. (2009) posited that a series of individual specific experiences occurred in the first six
to eight weeks following matriculation which impacted a freshman student’s persistence
decisions, a view that has strong support in the higher education literature (Pascarella &
Terenzini, 1991; Tinto, 1993; Upcraft & Gardner, 1989). Because of this theory, the test
was administered between the seventh and eleventh weeks of the first semester rather
than during freshman orientation.
Validity was measured using the six CPQ factors as predictors and retention as the
outcome variable (Davidson et al., 2009). The result was statistically significant,
Nagelerke R! = .19, and 66% of respondents were correctly classified using .43 as the
cutoff point. The three most salient factors in predicting retention were Institutional
Commitment, Academic Conscientiousness, and Academic Integration. Support Services
Satisfaction, Degree Commitment, and Social Integration factors did not produce a
statistically significant increase in explained variance.
The incremental validity of the CPQ was assessed to determine if the Student
Experience scales enhanced prediction of retention after taking high school rank and
standardized test scores into account (Davidson et al., 2009). When entered as a block
into a logistic regression equation, high school rank and standardized test scores
successfully classified 59% of students, Nagelerke R! = .09. When the six CPQ factors

COLLEGE PERSISTENCE QUESTIONNAIRE 8
were added, the overall correct classification of students was improved to 68%,
Nagelerke R! = .23.
Although the utility of the CPQ was established, the authors noted that several
important themes in the retention literature were not assessed by the original version of
the instrument. Also, Davidson et al. (2009) proposed that some of the original six factors
could benefit from additional items. These considerations led to the development of the
College Persistence Questionnaire Version 2 (CPQ-V2).
The CPQ-V2 consisted of 36 items from the original CPQ plus 47 test items. Data
were collected from 2,584 undergraduates at four institutions. A principal component
analysis yielded the six scales similar to the original factors and four new scales. The
factors of the CPQ-V2 were labeled: Academic Integration, Social Integration, Degree
Commitment, Institutional Commitment, Academic Conscientiousness, Academic
Efficacy, Academic Motivation, Collegiate Stress, Advising, and Financial Strain.
Purpose
Like any good psychometric instrument, the CPQ is continually being reassessed
and improved. The objective of the first study of this thesis was to determine if the
Student Experience Form could benefit from additional test items. Initially, all items in
the pool were correlated with retention. Next, a subset of those items yielding the highest
correlations was subjected to an exploratory factor analysis. Finally, a binary logistic
regression was run on the resultant components to determine the predictive validity of the
Student Experience Form.
Beck and Davidson (H.P. Beck, personal communication, March 15, 2008) have
proposed that the Student Experience scales of CPQ-V2 provide psychometrically

COLLEGE PERSISTENCE QUESTIONNAIRE 9
validated measures that can be useful in assessing a college or university’s institutional
effectiveness (IE). For example, apart from its effect on retention, a school might be
interested in promoting social integration, or an institution might be concerned with
bolstering scholastic conscientiousness in its own right.
A scale designed to identify at-risk students will likely have much in common with
a scale intended to assess IE. On the other hand, college retention and IE are different
constructs, and are best evaluated by different item sets. For instance, an item could be a
good predictor of retention, but not load on a scale measuring IE. Likewise, an item may
load on the IE scale (e.g. Social Integration) and have little or no correlation with
retention. Therefore, a second exploratory factor analysis was conducted using all
potential CPQ-V2 items regardless of their association with attrition. The results of the
second exploratory factor analysis yielded a series of scales that may be useful in
evaluating institutional effectiveness.
Method
Participants
Eight hundred and seventy four freshman from Appalachian State University
( n = 491), Catawba College ( n = 216), and Tusculum College ( n = 167) participated in
the study during the fall of 2008. Appalachian State students were recruited from various
sections of Introductory Psychology and received research credit for their participation.
Catawba College and Tusculum College undergraduates took the questionnaire as part of
a freshman seminar course.
The demographics of the sample were: 51% females, 49% males; 12.1% African-
Americans, 1.3% Asians, 80.1% Caucasians, 3.2% Hispanics, 0.5% Native Americans,

COLLEGE PERSISTENCE QUESTIONNAIRE 10
and 2.9% Other. All participants were treated in accord with the American Psychological
Association Guidelines for Ethical Conduct (American Psychological Association, 2002)
and approval to administer the test was obtained from the Appalachian State University
Institutional Review Board (see Appendix A).
Materials
The two main components of the CPQ-V2 are the Student Background Form and
the Student Experience Form. The present investigation is concerned with the Student
Experience Form rather than the Student Background Form. The Student Experience
Form assesses a student’s attitudes regarding the academic and social environments at his
or her school. The set of items used in this study consists of 54 questions from the
CPQ-V2 and 21 test questions. The instrument will be called the College Persistence
Questionnaire Test Version 3 (CPQ-TV3). Permission for use of CPQ items was granted
by Hall P. Beck (see Appendix B).
Questions were answered on a 5-point Likert scale, with a sixth option, not
applicable, available to students who thought the item did not apply to them. Verbal
labels for the response scales depended on the wording of the question. For example, a
question which asked, “How likely is it that you will earn a degree from here,” used a
response scale ranging from very likely to very unlikely (see Appendix C). Answers were
later converted to “favorability” scores based on whether the response indicated
something positive or negative about the student’s college experience (-2 = very
unfavorable to +2 = very favorable).

COLLEGE PERSISTENCE QUESTIONNAIRE 11
Procedure
Students signed a consent form (see Appendix D) allowing the investigators to
determine if they returned to their respective schools the following fall semester.
Respondents were told that the purpose of the investigation was to assess their views
about many aspects of college life and were assured that their answers would remain
confidential.
The CPQ-TV3 was administered online between the sixth and twelfth week of the
first semester of the freshman year. Appalachian State students responded in groups of 2
to 14 at a computer lab on campus. All remaining respondents answered online at their
convenience. Most of the sample completed the CPQ-TV3 in less than 30 minutes. A
screen then appeared on a computer monitor thanking them for their participation.
Results
Student Experience Scale
Answers on the Student Experience Form were converted to favorability scores.
Data were then screened for univariate and multivariate outliers employing procedures
suggested by Tabachnick and Fidell (2007). Next, each of the items was correlated with
retention (whether or not a student returned for his or her sophomore year). Fifty-one
items that displayed a statistically significant correlation with retention (p < .05, two-
tailed) were then subjected to a principal component analysis using a direct oblimin
rotation. An oblique method allowed for correlations between components.
The solution yielded nine components with eigenvalues greater than 1.0. Forty-five
items had loadings of .40 or higher. The components were assigned the following labels
after a review of the constituent items: Academic Integration, Financial Strain,

COLLEGE PERSISTENCE QUESTIONNAIRE 12
Institutional Commitment, Degree Commitment, Academic Motivation, Social
Integration, Collegiate Strain, Scholastic Conscientiousness, and Academic Efficacy (see
Table 1 for retention items by factor).
A second principal component analysis was then conducted using only those items
with pattern coefficient loadings of .40 or greater. This was done to ensure that item
deletion did not significantly impact the pattern coefficients. The results were similar to
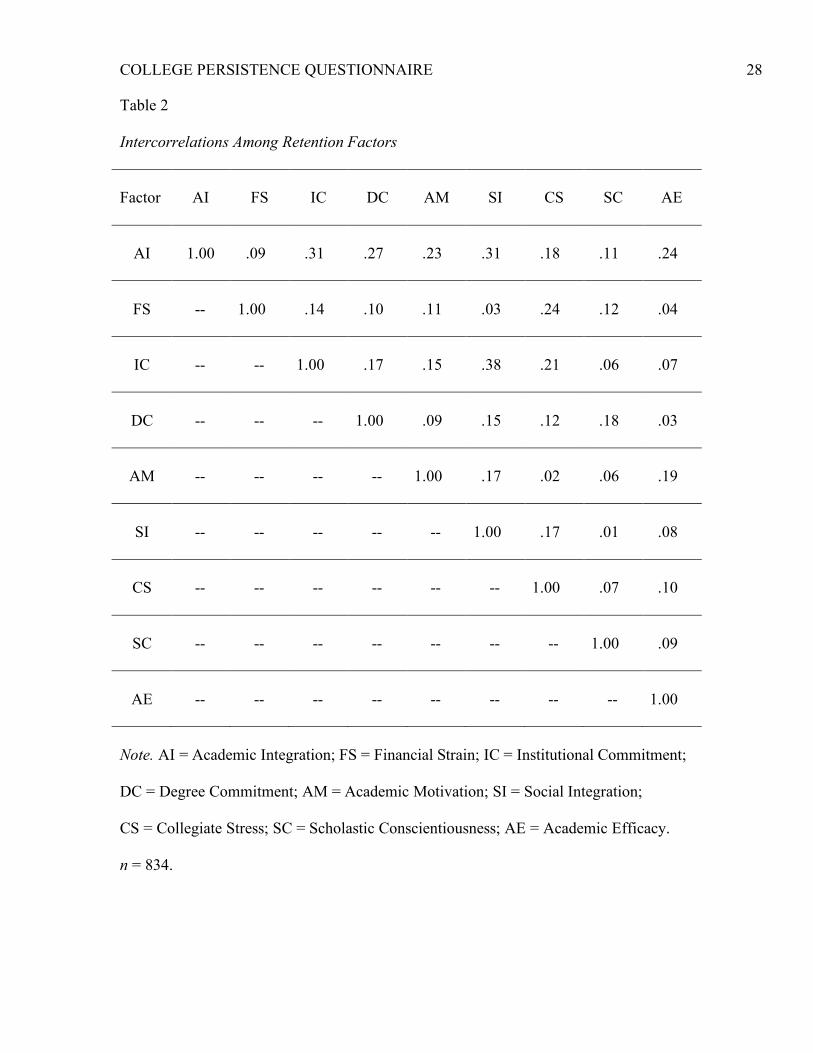
the initial analysis. The 9 factors yielded eigenvalues of 9.32, 3.40, 3.20, 2.02, 1.67, 1.60,
1.55, 1.23, and 1.07, respectively, after rotation, explaining 54% of the variance. All
correlations between components were less than .40 (see Table 2).
Two binary logistic regressions were performed to assess the validity of the
CPQ-TV3. Retention was used as the outcome variable and the means of the nine
CPQ-TV3 component scores were predictors. Component scores were obtained by
summing the favorability scores of the items comprising a particular component.
Retention was regressed upon the nine components entered as a block. Results indicated
that the nine components significantly predicted freshmen student return status,
"2 (9, 834) = 188.49, p < .001, Nagelkerke R2 = .33. Eighty-five percent of freshmen
were successfully classified as returning or non-returning students employing .5 as a
cutoff point. See Table 3 for regression coefficients, Wald Statistics, and odds ratios for
each predictor.
An alternative method for assessing validity is to regress retention upon each
individual item that was statistically correlated with the student’s returned status. The
results showed that all 51 items significantly predicted freshmen student return status,
COLLEGE PERSISTENCE QUESTIONNAIRE 13
"2 (51, 834) = 234.09, p < .001, Nagelkerke R2 = .39. Eighty-six percent of freshmen were
successfully classified using .5 as a cutoff point.
Institutional Effectiveness Scale An exploratory factor analysis was conducted on all 75 items regardless of their correlation with retention. Like the proceeding analysis, a principal component analysis with a direct oblimin rotation was performed. The solution yielded nine components with eigenvalues greater than 1.0. Intercorrelations between components were all less than or equal to .30 (see Table 4). Fifty-seven items had loadings of .40 or higher. The first eight components retained their assigned label from the CPQ-TV3 retention scale. The ninth component was named Academic Advising rather than Academic Efficacy due to the content of the items that loaded on the pattern matrix (see Table 5 for IE items by factor). .
Discussion One of the objectives of this thesis was to determine if the Student Experience form
of the CPQ-TV3 could benefit from additional items. The CPQ-TV3 item pool consisted
of 54 questions from CPQ-V2 plus 21 test questions. Of the test items, 11 loaded (greater
than .40) on the retention scale and 14 loaded on the IE scale. Thus, including additional
test questions was beneficial.
The second objective of this thesis was to develop scales for measuring retention
and IE. As expected, many of the retention scale items (38) loaded on the IE scale.
Nineteen items were unique to the IE scale and seven items were unique to the retention
scale.
Eight of nine retention scale labels were retained on the IE scale. The main
difference between these scales was that several items that loaded on the IE scale were

COLLEGE PERSISTENCE QUESTIONNAIRE 14
not correlated with retention and, thus, were not tested for inclusion on the retention
scale. The other significant difference between the two scales was in the ninth factor
items. Items pertaining to Academic Efficacy loaded on the retention scale but not the IE
scale. On the other hand, Academic Advising items loaded on the IE scale and not the
retention scale.
The third purpose of this project was to examine the predictive validity of the
retention scale. Two binary logistic regressions were performed to assess the validity of
the CPQ-TV3 as a retention instrument. Using return status for the sophomore year as the
dependent variable, the nine scale scores produced statistically significant results,
Nagelkerke R2 = .33, p < .001. The second analysis regressed retention upon each
individual item that correlated with retention. Not surprisingly, a higher percentage of the
variance was accounted for, Nagelkerke R2 = .39, p < .001, when individual items rather
than scale items were used as predictors. The results of both analyses provided support
for using the CPQ-TV3 to identify at-risk students.
The predictive validity of the IE scale was not assessed due to the complexity of the
construct. IE is a very broad construct and encompasses many of the objectives a school
may have for the student body. For instance, a student’s performance, persistence
decisions, and the values he or she internalizes are considered to be aspects of IE. Many
of the scales of the Student Experience form from the CPQ (e.g., Social Integration,
Institutional Commitment) can be viewed as partial measures of a school’s effectiveness.
The components of the IE scale that a school decides to use should be based on the
current objectives of the institution.

COLLEGE PERSISTENCE QUESTIONNAIRE 15
Limitations
One focus of the present study was to identify the group of variables related to
retention. However, no two colleges or universities provide identical academic and social
environments. Nor are any two student bodies exactly the same. Therefore, it is important
to note that we cannot predict with certainty which variables will be the most critical
determinants of retention before the CPQ-TV3 is administered at a given institution. For
instance, at one school degree commitment may be a powerful predictor but have little
impact on persistence decisions at another college.
The findings of this study are based on responses from three southeastern colleges.
The external validity of the retention and IE indices could be enhanced by including a
wider variety of institutions in the sample. Another limitation is that the sample was
solely comprised of freshmen. Students’ feelings about college are subject to change
across time as they become acclimated to their environment. Therefore, college personnel
should exercise caution when generalizing the results to upperclassmen.
Internal consistency measures for four of the retention scales and two of the IE
scales were below .70 and could be improved. In general, the low alpha levels were not
so much due to the low correlation between items as to the few items composing each
factor. Several scales could benefit from additional items. However, it would be a
challenge to do so without significantly lengthening the instrument.
The ethnic distribution of the sample also needs to be considered. Eighty-one
percent of the current sample was Caucasian. Future research should focus on
administering the CPQ-TV3 to a larger sample of African American, Hispanic, and

COLLEGE PERSISTENCE QUESTIONNAIRE 16
Pacific Islander/Asian students to better understand persistence decisions specific to these
ethnic groups.
Applications of the CPQ-TV3
Few colleges have sufficient resources to provide a great deal of individual
attention to all of their students. Consequently, some students are deprived of the
personable relationship they need to maintain an interest in returning to school. The
CPQ-TV3 allows advisors, faculty members, and counselors to identify those students
who are most in need of their services.
Once these at-risk students are recognized, college personnel may begin to
investigate the origin of the problem. There are many reasons why students feel no sense
of attachment to their schools. For example, one student may be at-risk because she feels
that she has little in common with her classmates, a second because of an inability to
meet financial means, and a third because he lacks a sense of connectedness with the
faculty and staff. Information from the CPQ-TV3 could allow advisors to tailor
interventions to meet each student’s particular needs.
Advisors need not solely rely on scale scores to understand why a student persists
or fails. Individual items provide important information that supplements scale scores.
For instance, two students at-risk of dropping out due to a deficiency in Scholastic
Conscientiousness may have given very different responses on the Student Experience
form. The former could have had trouble meeting class attendance requirements whereas
the latter might have frequently missed class assignment deadlines.
Administrators responsible for large groups of students have related but somewhat
different informational requirements than personnel working with individuals. With
COLLEGE PERSISTENCE QUESTIONNAIRE 17
respect to retention, the CPQ-TV3 permits policy makers to determine the variables that
have the greatest impact at their school. For example, if a given institution notices
significantly high levels of financial strain, development of campus employment
opportunities for students with little or no income might help to attenuate the problem.
Unfortunately, bivariate correlations do not take the interrelations among predictors
into account. Retention appears to be affected by a constellation of interrelated variables
with direct and indirect effects. One possible approach to delineating the relationships
between predictors is to develop a structural equation model. A structural equation model
could help officials determine the specific variables they need to manipulate in order to
maximize the effectiveness of their intervention program.
The use of the IE scale will vary depending on the values an institution wishes to
emphasize. One school may determine that resources should be concentrated toward
academic advising whereas another is more concerned with enhancing social integration.
A particular benefit would be to assess an IE scale before and after a program
intervention is implemented. For instance, if the IE scale indicates that a student’s
scholastic conscientiousness is bolstered after attending a seminar on time management,
there would be evidence suggesting that the program was successful.
Conclusions
The CPQ-TV3 provided a strong argument for identifying the variables related to
student retention. Individual item and component analyses corroborated the retention
scale as a valid index for predicting student return status. A measure of institutional
effectiveness was also developed to understand student experiences non-specific to
retention. The retention and IE scales yielded auspicious results but could also benefit

COLLEGE PERSISTENCE QUESTIONNAIRE 18
from additional test items. Future research will seek to test the CPQ-TV3 on a more
diverse sample to confirm the predictive validity of the instrument.
Enrolling in college in today’s society is just as much an investment as it is an
educational experience. Therefore, students deserve the best chance they can afford to
keep their dream of attaining a college degree alive. A system that distinguishes at-risk
students may be the next step for ensuring America’s stature amongst the upper echelon
of higher education systems in the world. College personnel who recognize the complex
nature of attrition should begin to adopt a data driven model like the CPQ-TV3.

COLLEGE PERSISTENCE QUESTIONNAIRE 19
References
Aldwin, C. M. (2007). Stress, coping and development. New York, NY: Guilford.
American Psychological Association. (2002). Ethical principles of psychologists and
code of conduct. Retrieved from http://www.apa.org/ethics/code/index.aspx
Bandura, A. (1997). Self-efficacy: The exercise of control. New York, NY: W. H.
Freeman.
Beck, H. P., & Davidson, W. B. (2001). Establishing an early warning system: Predicting
low grades in college students from the Survey of Academic Orientations scores.
Research in Higher Education, 42, 709-723. doi:10.1023/A:1012253527960
Bray, N. J., Braxton, J. M., & Sullivan, A. S. (1999). The influence of stress related
coping strategies on college student departure decisions. Journal of College
Student Development, 40, 645-657.
Cofer, J., & Summers, P. (2000). Within-year persistence of students at two-year
colleges. Community College Journal of Research and Practice, 24, 785-807.
Davidson, W. B., & Beck, H. P. (2006). Survey of Academic Orientations scores and
persistence in college freshmen. Journal of College Student Retention: Research,
Theory and Practice, 8, 297-305. doi:10.2190/H18T-6850-77LH-0063
Davidson, W. B., Beck, H., & Milligan, M. (2009). The College Persistence
Questionnaire: Development and validation of an instrument that predicts student
attrition. Journal of College Student Development, 50, 373-390.
doi:10.1353/csd.0.0079

COLLEGE PERSISTENCE QUESTIONNAIRE 20
Davidson, W. B., Beck, H. P., & Silver, N. C. (1999). Development and validation of
scores on a measure of academic orientations in college students' levels.
Educational and Psychological Measurement, 59, 678-693.
doi:10.1177/00131649921970107
Davidson, W. B., Bromfield, J. M., & Beck, H. P. (2007). Beneficial academic
orientations and self-actualization among college students. Psychological Reports,
100, 604-612. doi: 10.2466/PR0.100.2.604-612
Eison, J. A., Pollio, H. R., & Milton, O. (1982). LOGO II: A user’s manual. Knoxville, TN: University of Tennessee Learning Research Center. Hecker, D. E. (2004). Occupational employment projections to 2012. Monthly Labor Review, 127, 80-105. Hendel, D. D. (2006). Efficacy of participating in a first-year seminar on student satisfaction and retention. Journal of College Student Retention, 8, 413-423. Ishitani, T., & DesJardins, S. (2002). A longitudinal investigation of dropout from college in the United States. Journal of College Student Retention: Research, Theory & Practice, 4, 173-201. Kennedy, P. D., Sheckley, B. G., & Kehrhahn, M. T. (2000, May). The dynamic nature of student persistence: Influence of interactions between student attachment, academic adaptation, and social adaptation. Paper presented at the Annual Meeting of the Association for Institutional Research, Cincinnati, OH. Mangold, W. D., Bean, L. G., Adams, D. J., Schwab, W. A., & Lynch, S. M. (2003). Who goes who stays: An assessment of the effect of a freshman mentoring and unit registration program on college persistence. Journal of College Student Retention: Research, Theory & Practice, 4, 95-122.

COLLEGE PERSISTENCE QUESTIONNAIRE 21
National Center for Education Statistics. (2003). The condition of education 2003.
Washington, DC: Government Printing Office.
National Center for Public Policy and Higher Education. (2002). Measuring up 2002: The
state-by-state report card for higher education. Retrieved from
http://measuringup.highereducation.org/
National Survey of Student Engagement. (2004). NSSE 2004 Overview. Bloomington,
IN: Indiana University Center for Postsecondary Research and Planning.
Nicpon, M. F., Huser, L., Blanks, E. V., Sollenberger, S., Befort, C., & Kurpius, S. E.
(2007). The relationship of loneliness and social support with college freshmen's
academic performance and persistence. Journal of College Student Retention:
Research, Theory & Practice, 8, 345-358. doi:10.2190/A465-356M-7652-783R
Padgett, V. R., & Reid, J. F. (2003). Five year evaluation of the student diversity
program: A retrospective quasi-experiment. Journal of College Student Retention:
Research, Theory & Practice, 4, 135-145.
Pascarella, E. T., & Terenzini, P. T. (1991). How college affects students: Findings and
insights from twenty years of research. San Francisco, CA: Josey-Bass.
Pascarella, E. T., & Terenzini, P. T. (1998). Studying college students in the 21st century:
Meeting new challenges. The Review for Higher Education, 21, 151-165.
Perry, R. (2003). Perceived (academic) control and causal thinking in achievement
settings. Canadian Psychological Review, 44, 312-331.
Tabachnick, B. G., & Fidell, L. S. (2007). Using multivariate statistics (5th ed.). Boston,
MA: Pearson.

COLLEGE PERSISTENCE QUESTIONNAIRE 22
Tinto, V. (1993). Leaving college: Rethinking the cause and cures of student attrition.
Chicago, IL: University of Chicago.
Tinto, V. (2006). Research and practice of student retention: What next? College Student
Retention: Research, Theory & Practice, 8, 1-19. doi:10.2190/4YNU-4TMB-
22DJ-AN4W
Upcraft, M. L., & Gardner, J. (1989). The freshman year experience. San Francisco, CA:
Josey-Bass Publishers.
U.S. Department of Labor. (2000). The outlook for college graduates, 1998-2000. In Getting Ready Pays Off! Washington, DC: U.S. Department of Labor, Bureau of Labor Statistics.

COLLEGE PERSISTENCE QUESTIONNAIRE 23
Table 1 Retention Items by Factor Factor 1: Academic Integration 1. On average across all your courses, how interested are you in the things that are being said during class discussions? 13. In general, how satisfied are you with the quality of instruction you are receiving here? 20. How well do you understand the thinking of your instructors when they lecture or ask students to answer questions in class? 43. How concerned about your intellectual growth are the faculty here? 57. How would you rate the quality of the instruction you are receiving here? 63. During the first class session, many instructors present students with an overview of the course. In general, how accurate have these previews been in forecasting what you actually experienced in these courses? 64. How much do the instructors and the courses make you feel like you can do the work successfully? 66. In general, when you receive evaluative feedback from instructors, how useful has it been in figuring out how to improve? 71. How fair are the tests at this school? 75. Relative to what you expected when beginning college, how interesting have you found class sessions to be?

COLLEGE PERSISTENCE QUESTIONNAIRE 24
Factor 2: Financial Strain 15. How difficult is it for you or your family to be able to handle college costs? 29. When considering the financial costs of being in college, how often do you feel unable to do things that other students here can afford to do? 46. How much of a financial strain is it for you to purchase the essential resources you need for courses such as books and supplies? 61. How much does the cost of courses limit how many you take? 65. Based on your current financial situation, how inclined are you to work more hours per week than you want in order to pay bills? Factor 3: Institutional Commitment 8. How confident are you that this is the right college or university for you? 22. How much thought have you given to stopping your education here (perhaps transferring to another college, going to work, or leaving for other reasons)? 59. How likely is it that you will reenroll here next semester? 60. How likely is it you will earn a degree from here? 62. When you think about the advantages and disadvantages of attending this school, how much do you think the advantages outweigh the disadvantages, or vice versa? 76. How much loyalty do you feel to this college, based on your experiences here?

COLLEGE PERSISTENCE QUESTIONNAIRE 25
Factor 4: Degree Commitment 3. How supportive is your family of your pursuit of a college degree, in terms of their encouragement and expectations? 17. At this moment in time, how strong would you say your commitment is to earning a college degree, here or elsewhere?
27. When you think of the people who mean the most to you (friends and family), how disappointed do you think they would be if you quit school? 32. There are so many things that can interfere with students making progress toward a degree; feelings of uncertainty about finishing are likely to occur along the way. At this moment in time, how certain are you that you will earn a college degree? 41. After beginning college, students sometimes discover that a college degree is not quite as important to them as it once was. How strong is your intention to persist in your pursuit of the degree, here or elsewhere? Factor 5: Academic Motivation 6. In general, how enthused are you about doing academic tasks? 11. Some courses seem to take a lot more time than others. How much extra time are you willing to devote to your studies in those courses? 53. How much time do you spend proofreading writing assignments before submitting them?
COLLEGE PERSISTENCE QUESTIONNAIRE 26
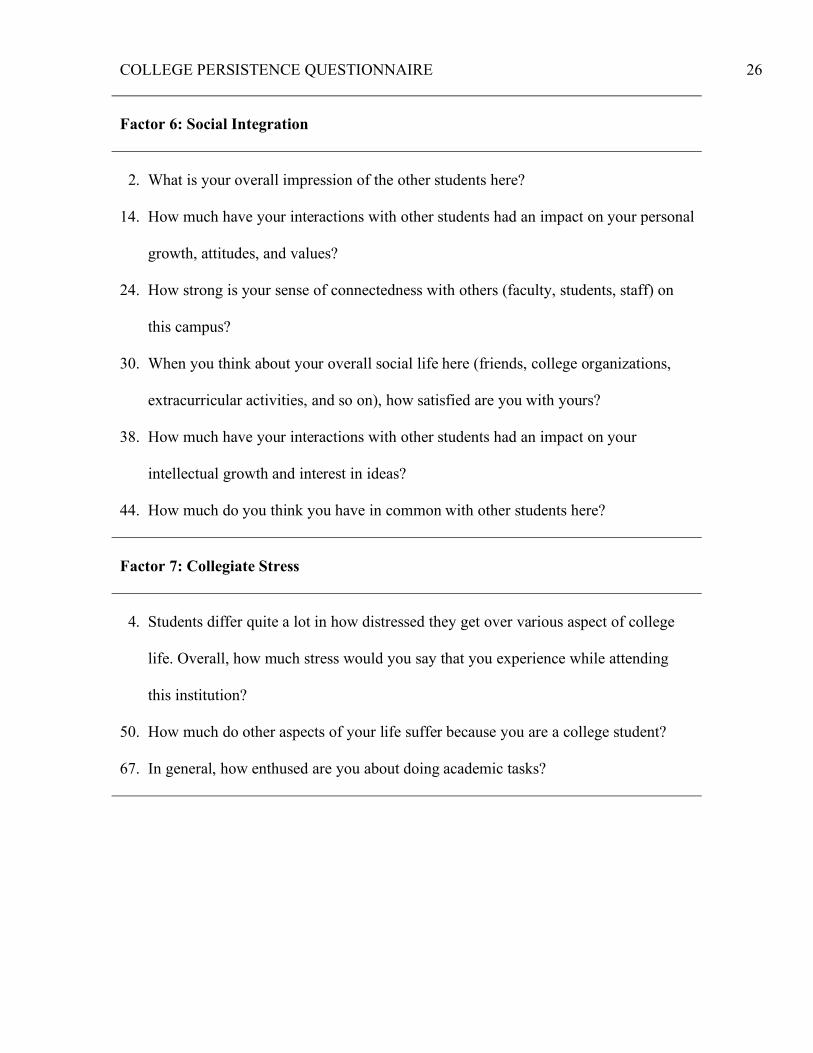
Factor 6: Social Integration 2. What is your overall impression of the other students here? 14. How much have your interactions with other students had an impact on your personal growth, attitudes, and values? 24. How strong is your sense of connectedness with others (faculty, students, staff) on this campus? 30. When you think about your overall social life here (friends, college organizations, extracurricular activities, and so on), how satisfied are you with yours? 38. How much have your interactions with other students had an impact on your intellectual growth and interest in ideas? 44. How much do you think you have in common with other students here? Factor 7: Collegiate Stress
4. Students differ quite a lot in how distressed they get over various aspect of college life. Overall, how much stress would you say that you experience while attending this institution? 50. How much do other aspects of your life suffer because you are a college student? 67. In general, how enthused are you about doing academic tasks?

COLLEGE PERSISTENCE QUESTIONNAIRE 27
Factor 8: Scholastic Conscientiousness 7. College students have many academic responsibilities. How often do you forget those that you regard as important? 21. How often do you turn in assignments past the due date?
37. How often do you miss class for reasons other than illness or participation in school-related activities? Factor 9: Academic Efficacy
10. How confident are you that you can get the grades you want?
40. How much doubt do you have about being able to make the grades that you want? 54. When you consider the techniques you use to study, how effective do you think your study skills are? 79. How good is your school performance relative to the expectations of your parents or others who are important to you? Note. Factors are presented according to their eigenvalues. Item numbers correspond to those on the original questionnaire. Only items with loadings of .40 or greater are listed.
COLLEGE PERSISTENCE QUESTIONNAIRE 28
Table 2 Intercorrelations Among Retention Factors Factor
AI
FS
IC
DC
AM
SI
CS
SC
AE
AI
1.00
.09
.31
.27
.23
.31
.18
.11
.24
FS
--
1.00
.14
.10
.11
.03
.24
.12
.04
IC
--
--
1.00
.17
.15
.38
.21
.06
.07
DC
--
--
--
1.00
.09
.15
.12
.18
.03
AM
--
--
--
--
1.00
.17
.02
.06
.19
SI
--
--
--
--
--
1.00
.17
.01
.08
CS
--
--
--
--
--
--
1.00
.07
.10
SC
--
--
--
--
--
--
--
1.00
.09
AE
--
--
--
--
--
--
--
--
1.00
Note. AI = Academic Integration; FS = Financial Strain; IC = Institutional Commitment; DC = Degree Commitment; AM = Academic Motivation; SI = Social Integration; CS = Collegiate Stress; SC = Scholastic Conscientiousness; AE = Academic Efficacy. n = 834.

COLLEGE PERSISTENCE QUESTIONNAIRE 29
Table 3 Regression of Retention on Student Experience Scales
Note. Code for retention variables was 0 = did not return, 1 = did return. S.E. = Standard Error; df = Degrees of Freedom; Sig = Significance. n = 834.
Retention Variables B S.E. Wald df Sig Odds Ratio
Scholastic Conscientiousness .246 .166 2.194 1 .139 1.279 Academic Efficacy .161 .183 .772 1 .380 1.175 Social Integration -.105 .171 .377 1 .539 .900 Collegiate Stress .091 .149 .370 1 .543 1.095 Academic Motivation .060 .184 .106 1 .744 1.062 Degree Commitment .317 .232 1.871 1 .171 1.373 Institutional Commitment 1.302 .137 90.347 1 .001 3.765 Financial Strain .127 .112 1.296 1 .255 1.136 Academic Integration -.417 .257 2.632 1 .105 .659 Constant -.033 .339 .009 1 .923 .968

COLLEGE PERSISTENCE QUESTIONNAIRE 30
Table 4 Intercorrelations Among Institutional Effectiveness Factors
AI
FS
IC
CS
AM
SC
DC
SI
AA
AI
1.00
.02
.14
.21
.17
.15
.19
.25
.29
FS
--
1.00
.13
.22
.03
.12
.03
.01
.05
IC
--
--
1.00
.10
.01
.11
.12
.30
.24
CS
--
--
--
1.00
.06
.15
.09
.13
.11
AM
--
--
--
--
1.00
.14
.02
.15
.08
SC
--
--
--
--
--
1.00
.16
.05
.17
DC
--
--
--
--
--
--
1.00
.11
.20
SI
--
--
--
--
--
--
--
1.00
.28
AA
--
--
--
--
--
--
--
--
1.00
Note. AI = Academic Integration; FS = Financial Strain; IC = Institutional Commitment; CS = Collegiate Stress; AM = Academic Motivation; SC = Scholastic Conscientiousness; DC = Degree Commitment; SI = Social Integration; AA = Academic Advising. n = 834.

COLLEGE PERSISTENCE QUESTIONNAIRE 31
Table 5 Institutional Effectiveness Items by Factor Factor 1: Academic Integration
1. On average across all your courses, how interested are you in the things that are being said during class discussions? 13. In general, how satisfied are you with the quality of instruction you are receiving here? 20. How well do you understand the thinking of your instructors when they lecture or ask students to answer questions in class? 57. How would you rate the quality of the instruction you are receiving here? 71. How fair are the tests at this school? 75. Relative to what you expected when beginning college, how interesting have you found class sessions to be?

COLLEGE PERSISTENCE QUESTIONNAIRE 32
Factor 2: Financial Strain 9. How often do you worry about having enough money to meet your needs? 15. How difficult is it for you or your family to be able to handle college costs? 29. When considering the financial costs of being in college, how often do you feel unable to do things that other students here can afford to do? 46. How much of a financial strain is it for you to purchase the essential resources you need for courses such as books and supplies? 61. How much does the cost of courses limit how many you take? 65. Based on your current financial situation, how inclined are you to work more hours per week than you want in order to pay bills? 80. If the costs of attending college rise in upcoming semesters, how much strain would that place on your personal budget?

COLLEGE PERSISTENCE QUESTIONNAIRE 33
Factor 3: Institutional Commitment 8. How confident are you that this is the right college or university for you? 22. How much thought have you given to stopping your education here (perhaps transferring to another college, going to work, or leaving for other reasons)? 59. How likely is it that you will reenroll here next semester? 60. How likely is it you will earn a degree from here? 62. When you think about the advantages and disadvantages of attending this school, how much do you think the advantages outweigh the disadvantages, or vice versa? 72. The life of a college student typically has both positive and negative aspects. At this time, would you say that the positives outweigh the negatives, or vice versa? 76. How much loyalty do you feel to this college, based on your experiences here?

COLLEGE PERSISTENCE QUESTIONNAIRE 34
Factor 4: Collegiate Stress 4. Students differ quite a lot in how distressed they get over various aspect of college life. Overall, how much stress would you say that you experience while attending this institution? 18. How much pressure do you feel when trying to meet deadlines for course assignments? 33. How often do you feel overwhelmed by the academic workload here? 50. How much do other aspects of your life suffer because you are a college student? 54. How much doubt do you have about being able to make the grades you want? 67. On a typical day, how preoccupied are you with personal troubles? 70. Compared to what you anticipated just before entering college, how much work has been involved in the courses? 74. On a typical day, how much do you worry about getting your work done on time? 77. How often do you encounter course work that makes you wonder whether you can do it successfully?

COLLEGE PERSISTENCE QUESTIONNAIRE 35
Factor 5: Academic Motivation 6. In general, how enthused are you about doing academic tasks? 11. Some courses seem to take a lot more time than others. How much extra time are you willing to devote to your studies in those courses? 16. How inclined are you to do most of your studying within 24 hours of a test rather than earlier? 23. How often do you read educationally-related material not assigned in courses? 31. Students vary widely in their view of what constitutes a good course, including the notion that the best course is one that asks students to do very little. In your own view, how much work would be asked of students in a really good course? 45. This semester, how much time do you spend studying each week relative to the number of credit hours you are taking? Assume each credit hour equals one hour of studying per week. 53. How much time do you spend proofreading writing assignments before submitting them? 78. If you are supposed to complete a reading assignment before the next class session, how likely are you to actually do it?

COLLEGE PERSISTENCE QUESTIONNAIRE 36
Factor 6: Scholastic Conscientiousness 7. College students have many academic responsibilities. How often do you forget those that you regard as important? 21. How often do you turn in assignments past the due date? 37. How often do you miss class for reasons other than illness or participation in school- related activities? 52. How often do you arrive late for classes, meetings, and other college events? 81. How organized are you in terms of keeping track of upcoming assignments and tests? Factor 7: Degree Commitment 3. How supportive is your family of your pursuit of a college degree, in terms of their encouragement and expectations? 17. At this moment in time, how strong would you say your commitment is to earning a college degree, here or elsewhere? 27. When you think of the people who mean the most to you (friends and family), how disappointed do you think they would be if you quit school? 32. There are so many things that can interfere with students making progress toward a degree; feelings of uncertainty about finishing are likely to occur along the way. At this moment in time, how certain are you that you will earn a college degree? 41. After beginning college, students sometimes discover that a college degree is not quite as important to them as it once was. How strong is your intention to persist in your pursuit of the degree, here or elsewhere?

COLLEGE PERSISTENCE QUESTIONNAIRE 37
Factor 8: Social Integration 2. What is your overall impression of the other students here? 14. How much have your interactions with other students had an impact on your personal growth, attitudes, and values? 24. How strong is your sense of connectedness with others (faculty, students, staff) on this campus? 30. When you think about your overall social life here (friends, college organizations, extracurricular activities, and so on), how satisfied are you with yours? 38. How much have your interactions with other students had an impact on your intellectual growth and interest in ideas? 44. How much do you think you have in common with other students here?

COLLEGE PERSISTENCE QUESTIONNAIRE 38
Factor 9: Academic Advising 5. How easy is it to get answers to your questions about things related to your education here? 19. How satisfied are you with the academic advising you receive here? 34. How well does this institution communicate important information to students such as academic rules, degree requirements, individual course requirements, campus news and events, extracurricular activities, tuition costs, financial aid and scholarship opportunities? 56. How would you rate the academic advisement you receive here? Note. Factors are presented according to their eigenvalues. Item numbers correspond to those on the original questionnaire. Only items with loadings of .40 or greater are listed.

COLLEGE PERSISTENCE QUESTIONNAIRE 39
Appendix A: IRB Approval Form

COLLEGE PERSISTENCE QUESTIONNAIRE 40
Appendix B: Permission for use of the College Persistence Questionnaire
College of Arts and Sciences Dr. Wiley F. Smith
Department of Psychology ASU Box 32109
Boone, KC 28608-2109 (828) 262-2272
Fax: (828) 262-2974
March 15, 2008
To Whom it May Concern: As owner of the copyright, I hereby grant Mr. Jacob Lindheimer permission to use the College Persistence Questionnaire for the purpose of conducting his thesis.
Sincerely,
Hall P. Beck, Ph.D. Professor of Psychology
A M E MB E R 11\ S TIT U TION OF "! HE UNIVERSITY OF NORTH G .\ROLIN A .\N F.Q AI. OI'POR TU !I: ITY EMPLOYER

COLLEGE PERSISTENCE QUESTIONNAIRE 41
Appendix C: College Persistence Questionnaire Test Version 3
College Persistence Questionnaire
Student Experience Form Instructions: Students differ a great deal from one another in how they feel about their college experiences. This questionnaire asks you about your reactions to many aspects of your life here at this college. Please consider each of the questions carefully, and indicate the answer that best represents your thoughts. There are no "right or wrong" answers, so mark your real impressions. There are only 81 questions, and it is very important that you answer all of them. This should take you about 30-35 minutes. Your answers will be treated as confidential information. Please circle your response to the following items. Be sure to answer each question. 1. On average across all your courses, how interested are you in the things that are being
said during class discussions? Very interested Somewhat interested Neutral Somewhat disinterested Very disinterested Not applicable
2. What is your overall impression of the other students here?
Very favorable Somewhat favorable Neutral Somewhat unfavorable Very unfavorable Not applicable
3. How supportive is your family of your pursuit of a college degree, in terms of their
encouragement and expectations? Very supportive Somewhat supportive Neutral Somewhat unsupportive Very unsupportive Not applicable

COLLEGE PERSISTENCE QUESTIONNAIRE 42
4. Students differ quite a lot in how distressed they get over various aspect of college life. Overall, how much stress would you say that you experience while attending this institution? Very much stress Much stress Some stress A little stress Very little stress / not applicable
5. How easy is it to get answers to your questions about things related to your education
here? Very easy Somewhat easy Neutral Somewhat hard Very hard Not applicable
6. In general, how enthused are you about doing academic tasks?
Very enthusiastic Somewhat enthusiastic Neutral Somewhat unenthusiastic Very unenthusiastic Not applicable
7. College students have many academic responsibilities. How often do you forget those
that you regard as important? Very often Somewhat often Sometimes Rarely Very rarely Not applicable
8. How confident are you that this is the right college or university for you? Very confident Somewhat confident Neutral Somewhat unconfident Very unconfident Not applicable

COLLEGE PERSISTENCE QUESTIONNAIRE 43
9. How often do you worry about having enough money to meet your needs? Very often Somewhat often Sometimes Rarely Very rarely Not applicable
10. How confident are you that you can get the grades you want? Very confident Somewhat confident Neutral Somewhat unconfident Very unconfident Not applicable
11. Some courses seem to take a lot more time than others. How much extra time are you willing to devote to your studies in those courses? Very much extra time Much extra time Some extra time A little extra time Very little extra time Not applicable
12. When interacting with disagreeable people, how often are you courteous to them? Always Usually Sometimes Rarely Never Not applicable
13. In general, how satisfied are you with the quality of instruction you are receiving here? Very satisfied Somewhat satisfied Neutral Somewhat dissatisfied Very dissatisfied Not applicable

COLLEGE PERSISTENCE QUESTIONNAIRE 44
14. How much have your interactions with other students had an impact on your personal growth, attitudes, and values? Very much Much Some Little Very little Not applicable
15. How difficult is it for you or your family to be able to handle college costs? Very difficult Somewhat difficult Neutral Somewhat easy Very easy Not applicable
16. How inclined are you to do most of your studying within 24 hours of a test rather than earlier? Very inclined Somewhat inclined A little inclined Not very inclined Not at all inclined Not applicable
17. At this moment in time, how strong would you say your commitment is to earning a college degree, here or elsewhere? Very strong Somewhat strong Neutral Somewhat weak Very weak Not applicable
18. How much pressure do you feel when trying to meet deadlines for course assignments? Extreme pressure Much pressure Some pressure A little pressure Hardly any pressure at all Not applicable

COLLEGE PERSISTENCE QUESTIONNAIRE 45
19. How satisfied are you with the academic advising you receive here? Very satisfied Somewhat satisfied Neutral Somewhat dissatisfied Very dissatisfied Not applicable
20. How well do you understand the thinking of your instructors when they lecture or ask students to answer questions in class? Very well Well Neutral Not well Not at all well Not applicable
21. How often do you turn in assignments past the due date? Very often Somewhat often Sometimes Rarely Very rarely Not applicable
22. How much thought have you given to stopping your education here (perhaps transferring to another college, going to work, or leaving for other reasons)? A lot of thought Some thought Neutral Little thought Very little thought Not applicable
23. How often do you read educationally-related material not assigned in courses? Very often Somewhat often Sometimes Rarely Very rarely Not applicable

COLLEGE PERSISTENCE QUESTIONNAIRE 46
24. How strong is your sense of connectedness with others (faculty, students, staff) on this campus? Very strong Somewhat strong Neutral Somewhat weak Very weak Not applicable
25. How good are you at correctly anticipating what will be on tests beforehand? Very good Somewhat good Neutral Somewhat bad Very bad Not applicable
26. How frequently do you become jealous of the good fortune of others? Never Rarely Sometimes Usually Always Not applicable
27. When you think of the people who mean the most to you (friends and family), how disappointed do you think they would be if you quit school? Very disappointed Somewhat disappointed Neutral Not very disappointed Not at all disappointed Not applicable
28. How satisfied are you with the extent of your intellectual growth and interest in ideas since coming here? Very satisfied Somewhat satisfied Neutral Somewhat dissatisfied Very dissatisfied Not applicable
COLLEGE PERSISTENCE QUESTIONNAIRE 47
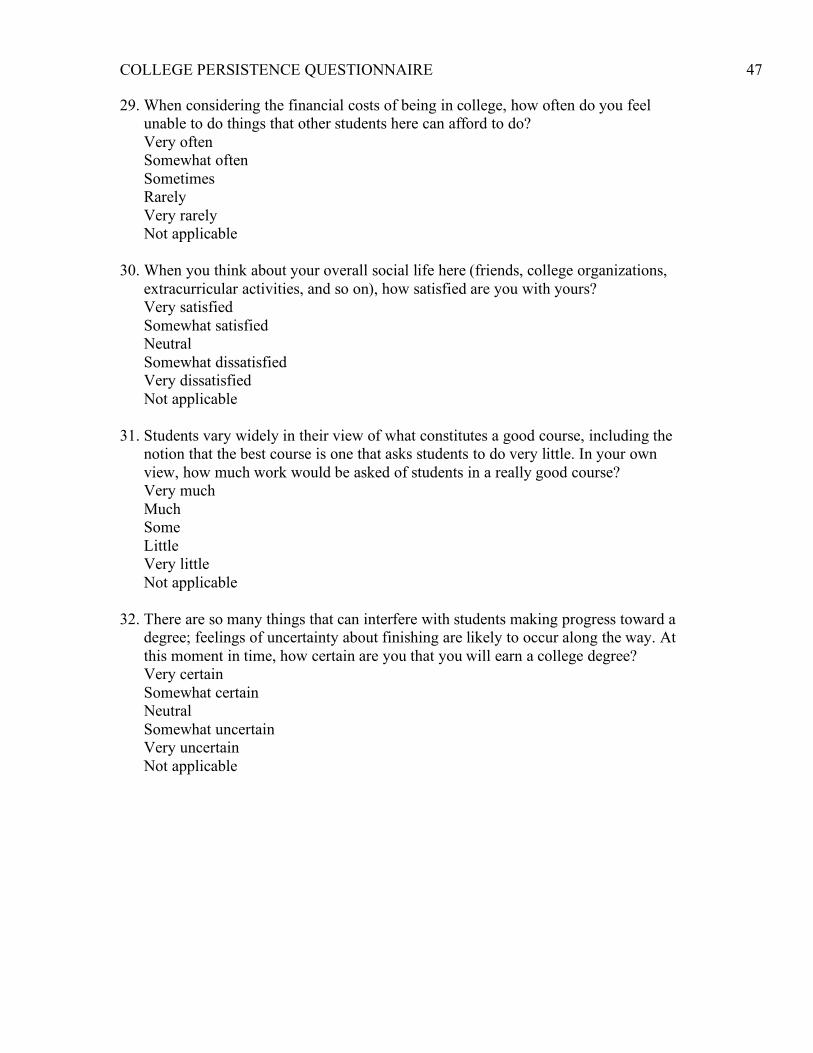
29. When considering the financial costs of being in college, how often do you feel unable to do things that other students here can afford to do? Very often Somewhat often Sometimes Rarely Very rarely Not applicable
30. When you think about your overall social life here (friends, college organizations, extracurricular activities, and so on), how satisfied are you with yours? Very satisfied Somewhat satisfied Neutral Somewhat dissatisfied Very dissatisfied Not applicable
31. Students vary widely in their view of what constitutes a good course, including the notion that the best course is one that asks students to do very little. In your own view, how much work would be asked of students in a really good course? Very much Much Some Little Very little Not applicable
32. There are so many things that can interfere with students making progress toward a degree; feelings of uncertainty about finishing are likely to occur along the way. At this moment in time, how certain are you that you will earn a college degree? Very certain Somewhat certain Neutral Somewhat uncertain Very uncertain Not applicable
COLLEGE PERSISTENCE QUESTIONNAIRE 48
33. How often do you feel overwhelmed by the academic workload here? Very often Somewhat often Sometimes Rarely Very rarely Not applicable
34. How well does this institution communicate important information to students such as academic rules, degree requirements, individual course requirements, campus news and events, extracurricular activities, tuition costs, financial aid and scholarship opportunities? Very well Well Neutral Not well Not at all well Not applicable
35. When you do not get your own way, how often do you feel resentful? Always Usually Sometimes Rarely Never Not applicable
36. How much of a connection do you see between what you are learning here and your future career possibilities? Very much Much Some Little Very little Not applicable
37. How often do you miss class for reasons other than illness or participation in school-related activities? Very often Somewhat often Sometimes Rarely Very rarely Not applicable

COLLEGE PERSISTENCE QUESTIONNAIRE 49
38. How much have your interactions with other students had an impact on your intellectual growth and interest in ideas? Very much Much Some Little Very little Not applicable
39. How often do you encounter course assignments that are actually enjoyable to do? Very often Somewhat often Sometimes Rarely Very rarely Not applicable
40. When you consider the techniques you use to study, how effective do you think your study skills are? Very effective Somewhat effective Neutral Somewhat ineffective Very ineffective Not applicable
41. After beginning college, students sometimes discover that a college degree is not quite as important to them as it once was. How strong is your intention to persist in your pursuit of the degree, here or elsewhere? Very strong Somewhat strong Neutral Somewhat weak Very weak Not applicable
42. How frequently are you irritated when people ask you for a favor? Never Rarely Sometimes Usually Always Not applicable

COLLEGE PERSISTENCE QUESTIONNAIRE 50
43. How concerned about your intellectual growth are the faculty here? Very concerned Somewhat concerned Neutral Somewhat unconcerned Very unconcerned Not applicable
44. How much do you think you have in common with other students here? Very much Much Some Little Very little Not applicable
45. This semester, how much time do you spend studying each week relative to the number of credit hours you are taking? Assume each credit hour equals one hour of studying per week. Many more hours studying than the credit hours A few more hours studying than the credit hours The same number of hours studying as the credit hours A few less hours studying than the credit hours A lot less hours studying than the credit hours Not applicable
46. How much of a financial strain is it for you to purchase the essential resources you need for courses such as books and supplies? Very large strain Somewhat of a strain Neutral A little strain Hardly any strain at all Not applicable
47. When you are waiting for a submitted assignment to be graded, how assured do you feel that the work you have done is acceptable? Very assured Somewhat assured Neutral Somewhat unassured Very unassured Not applicable
COLLEGE PERSISTENCE QUESTIONNAIRE 51
48. How much input do you think you can have on the decision-making process here (on matters such as course offerings, rules and regulations, and registration procedures)? Very much Much Some Little Very little Not applicable
49. All of us make mistakes in our interactions with other people. If you realize your mistake, how often do you apologize? Always Usually Sometimes Rarely Never Not applicable
50. How much do other aspects of your life suffer because you are a college student? Very much Much Some Little Very little Not applicable
51. How often do you wear clothing with this college's emblems? Very often Somewhat often Sometimes Rarely Very rarely Not applicable
52. How often do you arrive late for classes, meetings, and other college events? Very often Somewhat often Sometimes Rarely Very rarely Not applicable

COLLEGE PERSISTENCE QUESTIONNAIRE 52
53. How much time do you spend proofreading writing assignments before submitting them? A lot Some Little Very little None Not applicable
54. How much doubt do you have about being able to make the grades you want? Very much doubt Much doubt Some doubt Little doubt Very little doubt Not applicable
55. Often parents or other people whose opinions are important have unrealistic expectations about how students should perform in college. Thus far, how do you think that those important people would assess your performance? Far below the level they expected Below the level they expected About the level they expected Better than they expected Much better than they expected Not applicable
56. How would you rate the academic advisement you receive here? Excellent Good Fair Poor Very poor Not applicable
57. How would you rate the quality of the instruction you are receiving here? Excellent Good Fair Poor Very poor Not applicable
COLLEGE PERSISTENCE QUESTIONNAIRE 53
58. When you consider the benefits of having a college degree and the costs of earning it, how much would you say that the benefits outweigh the costs, if at all? Benefits far outweigh the costs Benefits somewhat outweigh the costs Benefits and costs are equal Costs somewhat outweigh the benefits Costs far outweigh the benefits Not applicable
59. How likely is it that you will reenroll here next semester? Very likely Somewhat likely Neutral Somewhat unlikely Very unlikely Not applicable
60. How likely is it you will earn a degree from here? Very likely Somewhat likely Neutral Somewhat unlikely Very unlikely Not applicable
61. How much does the cost of courses limit how many you take? Very much Much Some Little Very little Not applicable
62. When you think about the advantages and disadvantages of attending this school, how much do you think the advantages outweigh the disadvantages, or vice versa? Disadvantages far outweigh the advantages Disadvantages somewhat outweigh the advantages Disadvantages and advantages are equal Advantages somewhat outweigh the disadvantages Advantages far outweigh the disadvantages Not applicable
COLLEGE PERSISTENCE QUESTIONNAIRE 54
63. During the first class session, many instructors present students with an overview of the course. In general, how accurate have these previews been in forecasting what you actually experienced in these courses? Very accurate Somewhat accurate Neutral Somewhat inaccurate Very inaccurate Not applicable
64. How much do the instructors and the courses make you feel like you can do the work successfully? Very much Much Some Little Very little Not applicable
65. Based on your current financial situation, how inclined are you to work more hours per week than you want in order to pay bills? Very inclined Somewhat inclined A little inclined Not very inclined Not at all inclined Not applicable
66. In general, when you receive evaluative feedback from instructors, how useful has it been in figuring out how to improve? Very useful Somewhat useful Neutral Not very useful Not at all useful Not applicable
67. On a typical day, how preoccupied are you with personal troubles? Very preoccupied Somewhat preoccupied A little preoccupied Not very preoccupied Not at all preoccupied Not applicable

COLLEGE PERSISTENCE QUESTIONNAIRE 55
68. How much do the faculty at this school care about you? Very little Little Some Much Very much Not applicable
69. How much do you think class attendance should count in grading? Very much Much Some Very little Not at all Not applicable
70. Compared to what you anticipated just before entering college, how much work has been involved in the courses? Much less than expected Less than expected About the same as expected More than expected Much more than expected Not applicable
71. How fair are the tests at this school? Very unfair Somewhat unfair Neutral Somewhat fair Very fair Not applicable
72. The life of a college student typically has both positive and negative aspects. At this time, would you say that the positives outweigh the negatives, or vice versa? Positives far outweigh the negatives Positives somewhat outweigh the negatives Positives and negatives are equal Negatives somewhat outweigh the positives Negatives far outweigh the positives Not applicable

COLLEGE PERSISTENCE QUESTIONNAIRE 56
73. How clear have the instructors and syllabi usually been in detailing what you need to do in order to be successful in courses? Very unclear Somewhat unclear Neutral Somewhat clear Very clear Not applicable
74. On a typical day, how much do you worry about getting your work done on time? Very much Much Some A little Very little Not applicable
75. Relative to what you expected when beginning college, how interesting have you found class sessions to be? Much less interesting Less interesting About as interesting as expected More interesting Much more interesting Not applicable
76. How much loyalty do you feel to this college, based on your experiences here? Very much loyalty Much loyalty Some loyalty Little loyalty Very little loyalty Not applicable
77. How often do you encounter course work that makes you wonder whether you can do it successfully? Very often Somewhat often Sometimes Rarely Very rarely Not applicable

COLLEGE PERSISTENCE QUESTIONNAIRE 57
78. If you are supposed to complete a reading assignment before the next class session, how likely are you to actually do it? Very likely Somewhat likely Neutral Somewhat unlikely Very unlikely Not applicable
79. How good is your school performance relative to the expectations of your parents or others who are important to you? Far below their expectations Below their expectations About what they expected Better than they expected Much better than they expected Not applicable
80. If the costs of attending college rise in upcoming semesters, how much strain would that place on your personal budget? A very large strain Somewhat of a strain Neutral A little strain Hardly any strain at all Not applicable
81. How organized are you in terms of keeping track of upcoming assignments and tests? Very organized Somewhat organized Neutral Somewhat disorganized Very disorganized Not applicable

COLLEGE PERSISTENCE QUESTIONNAIRE 58
Appendix D: Consent Form
Informed Consent for Participants in Research Projects Involving Human Subjects
Title of Project: The relationship of scores on the College Persistence Questionnaire to retention Investigator(s): Hall P. Beck, Jake Lindheimer I. Purpose of this Research/Project
The purpose is to examine the correlation between attitudes about academia and college retention rates.
II. Procedures
This investigative session involves completing a questionnaire about the college experience and my feelings about the academic environment. It will take no longer than forty-five (45) minutes of my time. I understand that I will respond to two forms. The first, the Student Information Sheet, asks my name, age, sex, and some questions about my educational background. If I choose not to answer any items on the Student Information Sheet I will still receive credit for participating in this study. An item on the Student Information Sheet asks for my student identification number. My student identification number will allow investigators to obtain information from my student record to be used for research purposes. I recognize that I do not need to grant permission to use information from my student records to gain participation credit. The second form is called the College Persistence Questionnaire. It inquires as to my opinion regarding a number of issues concerning university life.
III. Risks
It is extremely unlikely that I will incur psychological, legal, or social harm from my participation in this study. If I feel uncomfortable then I may withdraw at any time without penalty. In addition, I may consult the professors conducting this experiment.
IV. Benefits
My participation in this study will benefit me in that it is one means of satisfying a research requirement in Introductory Psychology courses, could result in credit for an upper level psychology course, and is a way for me to see psychology at work. Not only will I study scientific research in the classroom, I will be able to actively learn about it in the laboratory. Society will benefit in that the results of this study may help psychologists understand why people leave college and thus give insight on how to intervene before it is too late.

COLLEGE PERSISTENCE QUESTIONNAIRE 59
V. Extent of Anonymity and Confidentiality
My answers will be saved on a data file. My name will be recorded in a separate place from the file. My name will be saved in case I need to verify my involvement in the study at a later date. This consent form is stored in a separate place from my data.
VI. Compensation
I will receive 45 minutes of research credit (if applicable).
VII. Freedom to Withdraw
I am free to leave/withdraw from the investigation at any time without penalty.
VIII. Approval of Research
This research project has been approved, as required, by the Institutional Review Board of Appalachian State University
01-28-2011 (Reference #) 09-0146 01-27-2012
IRB Approval Date Approval Expiration Date
IX. Participant’s Responsibilities
I voluntarily agree to participate in this study and complete the questionnaire given to me and provide the researcher with my student identification number. By signing this form, I confirm that I am at least 18 years of age.
X. Participant’s Permission
I have read and understand the Informed Consent and conditions of this project. I have had all my questions answered. I hereby acknowledge the above and give my voluntary consent.
Date Participant’s Signature
Should I have any questions about this research or its conduct, I may contact:
Hall P. Beck, Ph.D. (828) 262-2725 [email protected] Investigator Telephone/E-mail
Timothy D. Ludwig, Ph.D. (828) 262-2712 [email protected] Administrator, IRB Telephone/E-mail Graduate Studies and Research Appalachian State University Boone, NC 28608
COLLEGE PERSISTENCE QUESTIONNAIRE 60
Vita Jacob Benjamin Lindheimer III was born in Greensboro, North Carolina. He received his Bachelor of Science degree in Psychology at Appalachian State University in May 2009. In the fall of 2009, he accepted a research assistantship in Psychology at Appalachian State University and began study toward a Master of Arts degree. The Master of Arts degree was awarded in August 2011. Mr. Lindheimer currently resides in Athens, Georgia where he is pursuing his Ph.D. in Exercise Psychology at the University of Georgia.