the color of the surface of venus ... - planetary.brown.edu · the half-power bandwidths are...
TRANSCRIPT
The Color of the Surface of VenusAuthor(s): C. M. Pieters, J. W. Head, W. Patterson, S. Pratt, J. Garvin, V. L. Barsukov, A. T.Basilevsky, I. L. Khodakovsky, A. S. Selivanov, A. S. Panfilov, Yu. M. Gektin, Y. M. NarayevaSource: Science, New Series, Vol. 234, No. 4782 (Dec. 12, 1986), pp. 1379-1383Published by: American Association for the Advancement of ScienceStable URL: http://www.jstor.org/stable/1698199Accessed: 29/01/2009 14:38
Your use of the JSTOR archive indicates your acceptance of JSTOR's Terms and Conditions of Use, available athttp://www.jstor.org/page/info/about/policies/terms.jsp. JSTOR's Terms and Conditions of Use provides, in part, that unlessyou have obtained prior permission, you may not download an entire issue of a journal or multiple copies of articles, and youmay use content in the JSTOR archive only for your personal, non-commercial use.
Please contact the publisher regarding any further use of this work. Publisher contact information may be obtained athttp://www.jstor.org/action/showPublisher?publisherCode=aaas.
Each copy of any part of a JSTOR transmission must contain the same copyright notice that appears on the screen or printedpage of such transmission.
JSTOR is a not-for-profit organization founded in 1995 to build trusted digital archives for scholarship. We work with thescholarly community to preserve their work and the materials they rely upon, and to build a common research platform thatpromotes the discovery and use of these resources. For more information about JSTOR, please contact [email protected].
American Association for the Advancement of Science is collaborating with JSTOR to digitize, preserve andextend access to Science.
http://www.jstor.org

The Color of the Surface of Venus
C. M. PIETERS, J. W. HEAD, W. PAITERSON, S. PRATT, J. GARVIN, V. L. BARSUKOV, A. T. BASILEVSKY, 1. L. KHODAKOVSKY, A. S. SELIVANOV, A. S. PANFILOV, Yu. M. GEKTIN, Y. M. NARAYEVA
Multispectral images of the basaltic surface of Venus obtained by Venera 13 were processed to remove the effects of orange-colored incident radiation resulting from interactions with the thick Venusian atmosphere. At visible wavelengths the surface of Venus appears dark and without significant color. High-temperature laboratory reflectance spectra of basaltic materials indicate that these results are consistent with mineral assemblages bearing either ferric or ferrous iron. A high reflectance in the near-infrared region observed at neighboring Venera 9 and 10 sites, however, suggests that the basaltic surface material contains ferric minerals and thus may be relatively oxidized.
T HIS REPORT FOCUSES ON INFORMA- tion about the oxidation state of the Venusian surface that can be ob-
tained from spectral reflectance measure- ments in the visible and near-infrared re- gions of the spectrum. Determination of the oxidation state of the surface of Venus, which is strongly dependent on the redox condition of the lower atmosphere, would help resolve broader questions concerning the current surface environment and buffer reactions that may occur between atmo- sphere and surface. In particular, an oxidized surface could act as the required sink for oxygen associated with the hypothesized early high abundance of water on Venus (1).
The redox conditions for the surface of Venus, however, are not well constrained. The data for the chemistry of the lower atmosphere provide different estimates for the near-surface partial pressures of 02 and CO. Estimates have been made from extrap- olation of the apparent nonequilibrium mix- tures of 02 and CO detected above the 30- km level by the Venera 13 and 14 gas chromatographs (2) and the Pioneer Venus mass spectrometer (3). On the basis of the kinetics of reactions with surface material, however, these nonequilibrium estimates are not expected to be stable in the near-surface environment (4). On the other hand, the "Kontrast" experiment on the Venera 13 and 14 landers provided evidence of a CO- bearing, reducing environment (5). It is currently unknown which of these condi- tions accurately describes the surface of Ve- nus.
From the Venera x-ray spectrometer data (6) the surface at the Venera 13, Venera 14, and VEGA 2 sites is known to be basaltic in general composition. Oxide abundances were estimated to be as follows: FeO, 8.8 to
9.3%; SiO2, 45.1 to 48.7%; MgO, 8.1 to 11.5%; A1203, 15.8 to 17.9%; CaO, 7.1 to 10.3%; TiO2, 0.2 to 1.6%; and SO3, 0.9 to 4.7%. The mineralogy of surface material should be influenced by the local redox conditions; conversely, the oxidation-reduc- tion conditions of the surface environment can be determined indirectly if the surface mineralogy can be identified. The discussion below focuses on the distinction between the oxidized ferric and the relatively reduced ferrous compounds commonly found in ba- saltic material. Their spectral properties in the visible and near-infrared distinguish these compounds.
Ferric oxides have the following spectral characteristics (7, 8): (i) very low reflectance (-5%) from the ultraviolet into the visible; (ii) a relatively sharp absorption edge be- tween 0.5 and 0.6 pxm with a strong increase in reflectance toward longer wavelengths (for example, for hematite, <5% reflectance at 0.5 pxm, 30% at 0.75 urm, and up to 80% at 1.2 rtm); and (iii) weaker absorption bands near 0.64 and 0.85 Vxm. The absorp- tion edge characteristic of the ferric oxides is attributed to strong charge transfer transi- tions in the ultraviolet between overlapping orbitals of iron and oxygen as well as crystal- field electronic transition bands of ferric iron (8, 9). These features of ferric oxides account for their distinct red coloration and can be seen (Fig. IA) in the spectrum for the ferric oxide hematite and spectra of altered or weathered basaltic material ("maroon" and "red" cinders). Identification of a ferric com- ponent in martian soils, for example, is based on such an absorption edge that is observed in remotely obtained spectra (10). Ferrous minerals, on the other hand, are either opaque throughout the visible (for example, magnetite and ilmenite) or exhibit
a more gradual increase in reflectance from the ultraviolet through the visible (for exam- ple, most iron-bearing silicates such as py- roxenes and olivines). These characteristics can be seen in the Fig. IA spectra of unal- tered basalt and "black" cinders.
The spectral properties of ferrous and ferric minerals have been studied by numer- ous investigators because iron-bearing com- pounds are among the most common miner- als encountered in terrestrial, lunar, and meteoritic materials. Although the charac- teristics of the surface of Venus (which contains about 9% FeO) would be expected to be sensitive to the iron-bearing com- pounds present, inferences based on this assumption must be used with caution. Cur- rently no evidence is available for or against unusual or perhaps unique compounds ex- isting on the Venusian surface.
Two types of spectrophotometric data are available for the surface of Venus: (i) multi- spectral images obtained for three channels in the visible by the Venera 13 and 14 landers (11); and (ii) wide-angle photom- eter measurements for five channels through the visible to about 1.0 pxm obtained by Venera 9 and 10 (12). Although both types are discussed here, initial analyses concen- trated on the multispectral images because they contain spatial information that would allow the relations between different materi- als on the surface to be examined. This information is particularly important if metastable chemical weathering phases were to occur as rinds or varnishes on rock sur- faces. It was suspected that if ferric oxides are present on the surface of Venus in material roughly similar to oxidized terres- trial basalts, the primary absorption edge of ferric oxides should be readily detectable in the Venera 13 and 14 multispectral images, and the surface rocks would appear distinct- ly red.
The Venera 13 and 14 landers each had two scanning cameras located on opposite sides of the spacecraft (11). In an imaging sequence the camera scanned from horizon to center (near vertical) to horizon. Each camera was capable of obtaining images in a blue (B), a green (G), and a red (R) channel;
C. M. Pieters, J. W. Head, S. Pratt, Department of Geological Sciences, Brown University, Providence, RI 02912. W. Patterson, Department of Engineering, Brown Uni- versity, Providence, RI 02912. J. Garvin, Goddard Space Flight Center, National Aero- nautics and Space Administration, Greenbelt, MD 20771. V. L. Barsukov, A. T. Basilevskv, I. L. Khodakovskv, Vernadsky Institute of Geochemistry and Analytical Chemistry, U.S.S.R. Academy of Sciences, Moscow, U.S.S.R. A. S. Selivanov, A. S. Panfilov, Yu. M. Gektin, Y. M. Narayeva, State Center for the Study of Natural Re- sources, State Meteorological Committee, 123376 Mos- cow, U.S.S.R.
12 DECEMBER 1986 REPORTS I379

the half-power bandwidths are centered ap- proximately at 0.44, 0.54, and 0.63 Izm, respectively, with a bandwidth of about 80 nm, although atmospheric absorption af- fects the effective wavelength appreciably. Radiation that reaches the surface in the visible wavelengths is diffuse. No useful signal was detected by the blue channel because of the efficient removal of blue and ultraviolet radiation by the atmosphere. Data were obtained successfully from all cameras, and results of the imaging experi- ment have been published (11).
A version of the first color panorama images produced from the raw data for the Venera 13 site (11) is shown in Fig. 2 (upper panel). Almost no signal was record- ed in the blue channel for all cameras. The distinctive orange hue of the diffuse radia- tion present at the surface of Venus (11) dominates the resulting color image in Fig.
2 (upper panel) and masks the true color of surface materials in the scene. In order to examine the color of rocks and soil, correc- tions must be made for the spectral character of the incident radiation.
The digital image data were analyzed fur- ther to extract spectral information from the lander panorama and to produce color pic- tures of the scene as it would appear with "white-light" illumination. Four steps re- quired for this calibration are summarized here and will be described elsewhere (13). First, the raw data were transformed from an approximately logarithmic brightness scale to a linear scale by using the published average instrument response curve for the detectors (11). Second, spectral calibration used brightness values of test charts and color chips included within the field of view of each camera. The spectral characteristics of the color chips measured before the mis-
sion in the laboratory at 500?C were found to be significantly different from room-tem- perature measurements (11). The "gray" chips included in the color chart and on the spacecraft, however, were still gray at high temperature (equal reflectance in the red and green channels). This information was used to calibrate the red and green channels of the color image data by scaling the green image data so that values for the gray chip are equal in the red and green channels. Third, to achieve color balance in the resulting color image, an artificial channel of blue data was created by linear extrapolation from the red and green channels (B = 2G - R), and again was scaled to keep the intensities for the gray chip equal. For this procedure it is assumed that the effective wavelengths of the red, green, and blue channels of the reproducing systems (film or color mon- itor) are separated by approximately equal
6.0 i, , I I' I ' I , I
A H 5.0 -
? | \ / MC -
ao
C4 1 3.0 / /
- ') BC B
1.0 ..- _. ...........
. 0.56 M
0 I , I , ,
0.4 0.6 0.8 1.0 1.2 1.4 1.6
40
30 -
0
0 co 20 -
4) 4-)
0 0.4
Wavelength (gm)
0.5 0.6 0.7 0.8 0.9 1.0
Wavelength (gnm)
i Bandpass (half-height)
x Venera 10
? Venera 9
5 -
n + , Vene I __- I
0.4 0.6
1.0-
nra 13,14 bandpasses i i i i 0. 0.8 1.0 1.2 0.4
Wavelength (gm)
Fig. 1. (A) Laboratory rcflectance spectra (0.4 to 1.6 nm) of typical basaltic materials at 25?C. The hematite (H), red cinder (RC), and maroon cinder (MC) exhibit the characteristic absorption edge near 0.55 UIm due to ferric iron. All spectra are scaled to unity at the effective wavelength of the Venera 13 green channel (0.56 pm) to facilitate spectral comparisons. Basalt, B; black cinder, BC; magnetite, M. (B) Reflectance properties of the Venusian surface at the Venera 9 and 10 landing sites (12). Horizontal bars indicate
1380
0.5 0.6 0.7 0.8 0.9 1.0
Wavelength (g m)
the width at half-height of the Venera filters. (C) Laboratory reflectance spectra (0.4 to 0.8 .im) of the ferric oxide hematite at temperatures ranging from room temperature to 500?C. These observed spectral effects are frilly reversible for pure hematite. (D) Laboratory reflectance measurements at 500?C of the basaltic materials in (A) compared to the Venera surface measurements (scaled to 0.56 ,um). Filter widths are indicated only for the Venera 10 data.
SCIENCE, VOL. 234
B
20 -
6.0
5.0
15 0
. - 10
4) 0 c
4) 0
<)
4.0
3.0
2.0 I -
v

amounts, which is about the same as the red to green separation of the Venera cameras. Fourth, a regular but anomalous gradient in the green channel from lower to upper picture elements (pixels) was removed em- pirically.
This process produces the color image of Fig. 2 (lower panel), which should represent the color of the surface of Venus as if it were seen under "white light" illumination. This image is consistent with what is known independently about the properties of the scene. The red chip is red (a R/G ratio of 1.8 ? 0.3), a diffuse shadow of about the right magnitude surrounds the lander, and the rocks and soil are very dark. The color of the surface in this image is distinctly gray. These data, including the red coloration of the "teeth" surrounding the base of the spacecraft, are also in agreement with the results of recent, more detailed analyses of the lander color cameras (14). A minor shift toward blue wavelengths is observed along the far horizons, consistent with an atmo- spheric scattering component. Although the horizon for a perfectly smooth spherical surface is about 3.5 km from the lander, the foreshortening of the camera perspective is extreme. The region of blue coloration in the images is calculated to begin about 20 to 60 m from the lander; this distance is proba- bly suggestive of the scale at which local atmospheric scattering for visible light be- comes comparable to the amount of light scattered from the surface.
The numerical data in Fig. 2 show that the rocks and soil at the Venera 13 landing site are essentially gray, or without strong color (0.90 - R/G < 1.10), in the visible part of the spectrum. The magnitude of all color differences is small and could be ac- counted for either by physical properties of the material (for example, particle size or compaction), although minor composition- al differences are not precluded, or by a residual artifact of camera calibrations. The precision of the data available does not allow for detailed comparisons between rocks and soil. Taken at face value, the distinct gray color and lack of an absorption edge in the visible would perhaps imply that Earth-like ferric oxides are not likely to be present in significant amounts. The Venusian surface, however, has its own unique environment and resulting characteristics. These observed spectral characteristics of the Venusian sur- face in the visible part of the spectrum are to be expected for either oxidized or reduced basaltic surfaces.
Shown in Fig. IB is a composite spectrum for the surface of Venus derived from the wide-angle photometer data of Venera 9 and 10 (12). The half-power bandwidths (half-height bandpass) of the green and red
I2 DECEMBER I986
filters used for the Venera 13 and 14 imag- ing experiments are shown at the bottom of Fig. lB. Error bars and data for Venera 9 and 10 photometers are from Ekonomov et al. (12). Half-power bandwidths of the fil- ters used are shown as horizontal bars.
Although the color images of Fig. 2 and the spectral data of Fig. 1B refer to different areas, they can be considered to represent common bulk spectral properties. A basaltic composition is in accord with the data for all these sites (6), although the earlier geo- chemical data for Venera 9 and 10 are more limited than those for Venera 13 and 14. All four lander areas are in generally similar surface environments. Venera 9 landed on the flanks of the Beta Regio volcanic com- plex (at 2.2 km above the 6051-km refer- ence surface), whereas Venera 10, 13, and 14 touched down in the adjacent upland rolling plains (at 1.3 km above the reference point) (15). These regions have been inter- preted as volcanic plains in varying states of degradation (15, 16). Measurements of the physical and electrical properties at the sur- face of these sites (17) suggest that weather- ing and perhaps alteration involving the concentration or production of highly con- ductive phases may have taken place.
The color of the Venera 13 surface de- rived from the multispectral images is con- sistent with the spectroscopic data of Fig. IB for Venera 9 and 10. Throughout the visible part of the spectrum the surface of Venus is very dark and not strongly colored. At wavelengths longer than 0.7 Ixm, howev- er, an increase in reflectance (by a factor of 2 to 3) is seen in the independent spectroscop- ic measurements for the Venera 9 and 10 sites, with the Venera 10 measurements exhibiting the sharpest increase. This distin- guishing characteristic depends heavily on the albedo measurements made with the last filter near 0.9 pm.
No terrestrial or meteoritic basaltic mate- rial previously measured in the laboratory exhibits this type of spectral character (7, 18, 19), although there are substantial varia- tions in spectral characteristics from changes in temperature. Similarly, no lunar material, with the exception of the dark recrystallized pyroclastic glass of Apollo 17, exhibits the spectral properties observed at the Venera 9 and 10 sites. The unusual ilmenite-olivine- glass black beads (sample 74001) of the Apollo 17 titanium-rich pyroclastic soil from Shorty Crater are the only known basaltic assemblage that exhibits such a strong band near 0.65 pxm, which is associ- ated with ilmenite (20). In a normal basaltic assemblage, ilmenite is opaque and spectral- ly flat; the 0.65-[xm band that is observed for the Apollo 17 black spheres is attributed to the unusual structure of the ilmenite,
which occurs as thin plates set in a non- opaque silicate matrix (20). For Venus, not only is the overall composition at the Venera 13 and 14 sites unlikely to produce major amounts of ilmenite (about 9% FeO and 1.5% TiO2 for Venus compared with 22% FeO and 8% TiO2 for sample 74001), but the unusual petrographic circumstances (fine-grained glassy spheres) required for normally opaque materials to become trans- lucent are inconsistent with the surface mor- phology observed from the images.
At least three possible causes can, individ- ually or combined, account for the unusual Venusian spectrum (dark and flat through- out the visible with an increase in reflectance at longer wavelengths). Listed in what is believed to be increasing likelihood, these include instrumental error, presence of un- usual compounds, or the effects of the Ve- nusian environment on the measured spec- tral properties of basaltic materials.
Instrument and environmental measure- ment errors for the spectra in Fig. IB were considered by Economov et al. (12). The combined error in the albedo measurements was estimated to be 25 to 30% and involved a variety of instrument calibrations and processing procedures (12). The error bars of Fig. 1B represent this value. Estimations of surface thermal emission at 0.9 tim ac- count for only about 5% of the flux at the surface. No additional instrument error is suspected.
Although ferric oxides are perhaps the most common type of mineral species in altered basalts with an absorption edge (that occurs in the visible), other less abundant minerals also display sharp absorption edges at different wavelengths. A variety of less common sulfur compounds, for example, exhibit absorption edges in the visible and near-infrared; stibnite (Sb2S3) has an edge near 0.7 ,um (21). Consideration of relative- ly rare species as the source of the absorp- tion edge in the spectrum of the Venusian surface should not be ignored, but such minerals are considered less likely than min- erals more common to known basalts of the solar system.
The spectral properties of many rock- forming minerals are affected by the ambient temperature and pressure of their environ- ment. Pressure effects do not appear to be significant until about a few kilobars (22) and thus are not of importance for the surface of Venus. Temperature, on the other hand, is known to affect the spectral proper- ties of some materials (23-25) and may play a considerable role in the determination of the spectral properties of Venusian surface material.
To understand the effects of temperature on the spectral properties of Venusian sur-
REPORTS I38I
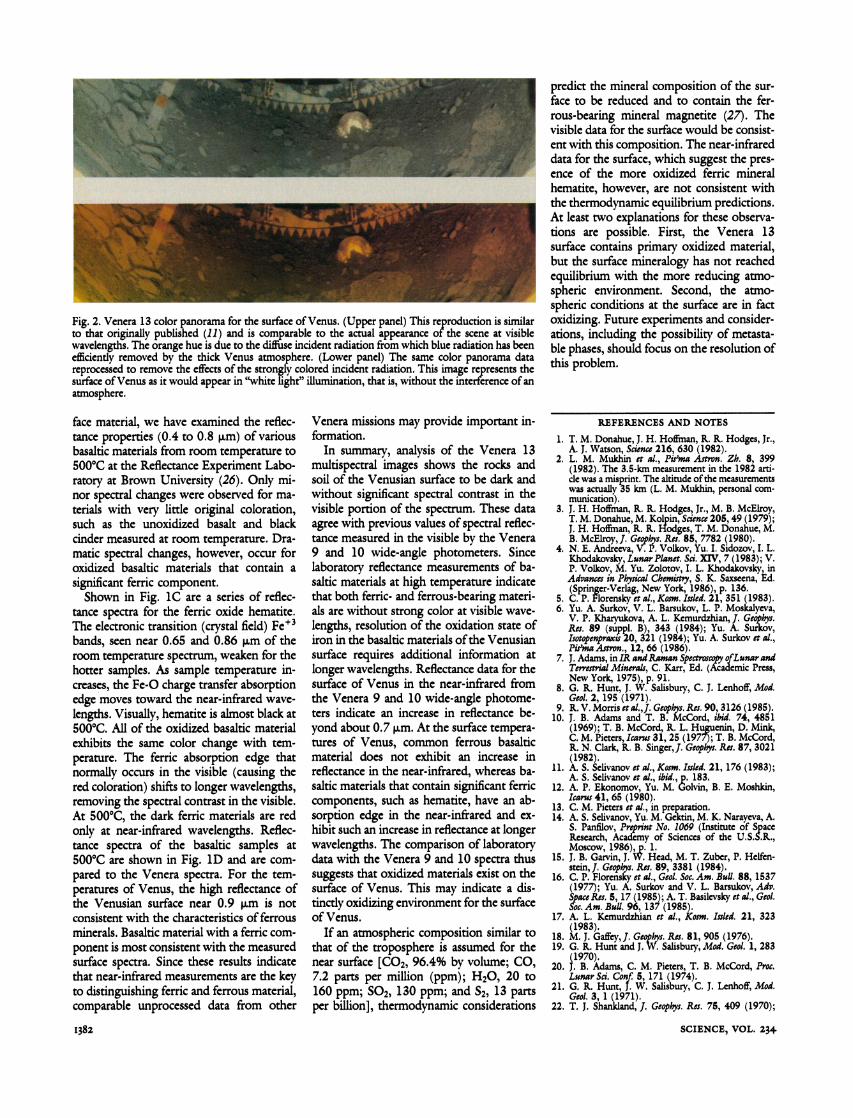
Fig. 2. Venera 13 color panorama for the surface of Venus. (Upper panel) This reproduction is similar to that originally published (11) and is comparable to the actual appearance of the scene at visible wavelengths. The orange hue is due to the diffuse incident radiation from which blue radiation has been efficiently removed by the thick Venus atmosphere. (Lower panel) The same color panorama data reprocessed to remove the effects of the strongly colored incident radiation. This image represents the surface of Venus as it would appear in "white light" illumination, that is, without the interference of an atmosphere.
predict the mineral composition of the sur- face to be reduced and to contain the fer- rous-bearing mineral magnetite (27). The visible data for the surface would be consist- ent with this composition. The near-infrared data for the surface, which suggest the pres- ence of the more oxidized ferric mineral hematite, however, are not consistent with the thermodynamic equilibrium predictions. At least two explanations for these observa- tions are possible. First, the Venera 13 surface contains primary oxidized material, but the surface mineralogy has not reached equilibrium with the more reducing atmo- spheric environment. Second, the atmo- spheric conditions at the surface are in fact oxidizing. Future experiments and consider- ations, including the possibility of metasta- ble phases, should focus on the resolution of this problem.
face material, we have examined the reflec- tance properties (0.4 to 0.8 Vim) of various basaltic materials from room temperature to 500?C at the Reflectance Experiment Labo- ratory at Brown University (26). Only mi- nor spectral changes were observed for ma- terials with very little original coloration, such as the unoxidized basalt and black cinder measured at room temperature. Dra- matic spectral changes, however, occur for oxidized basaltic materials that contain a significant ferric component.
Shown in Fig. 1C are a series of reflec- tance spectra for the ferric oxide hematite. The electronic transition (crystal field) Fe+3 bands, seen near 0.65 and 0.86 jIm of the room temperature spectrum, weaken for the hotter samples. As sample temperature in- creases, the Fe-O charge transfer absorption edge moves toward the near-infrared wave- lengths. Visually, hematite is almost black at 500?C. All of the oxidized basaltic material exhibits the same color change with tem- perature. The ferric absorption edge that normally occurs in the visible (causing the red coloration) shifts to longer wavelengths, removing the spectral contrast in the visible. At 500?C, the dark ferric materials are red only at near-infrared wavelengths. Reflec- tance spectra of the basaltic samples at 500C are shown in Fig. 1D and are com- pared to the Venera spectra. For the tem- peratures of Venus, the high reflectance of the Venusian surface near 0.9 jm is not consistent with the characteristics of ferrous minerals. Basaltic material with a ferric com- ponent is most consistent with the measured surface spectra. Since these results indicate that near-infrared measurements are the key to distinguishing ferric and ferrous material, comparable unprocessed data from other
1382
Venera missions may provide important in- formation.
In summary, analysis of the Venera 13 multispectral images shows the rocks and soil of the Venusian surface to be dark and without significant spectral contrast in the visible portion of the spectrum. These data agree with previous values of spectral reflec- tance measured in the visible by the Venera 9 and 10 wide-angle photometers. Since laboratory reflectance measurements of ba- saltic materials at high temperature indicate that both ferric- and ferrous-bearing materi- als are without strong color at visible wave- lengths, resolution of the oxidation state of iron in the basaltic materials of the Venusian surface requires additional information at longer wavelengths. Reflectance data for the surface of Venus in the near-infrared from the Venera 9 and 10 wide-angle photome- ters indicate an increase in reflectance be- yond about 0.7 Ijm. At the surface tempera- tures of Venus, common ferrous basaltic material does not exhibit an increase in reflectance in the near-infrared, whereas ba- saltic materials that contain significant ferric components, such as hematite, have an ab- sorption edge in the near-infrared and ex- hibit such an increase in reflectance at longer wavelengths. The comparison of laboratory data with the Venera 9 and 10 spectra thus suggests that oxidized materials exist on the surface of Venus. This may indicate a dis- tinctly oxidizing environment for the surface of Venus.
If an atmospheric composition similar to that of the troposphere is assumed for the near surface [CO2, 96.4% by volume; CO, 7.2 parts per million (ppm); H20, 20 to 160 ppm; SO2, 130 ppm; and S2, 13 parts per billion], thermodynamic considerations
REFERENCES AND NOTES
1. T. M. Donahue, J. H. Hoffman, R. R. Hodges, Jr., A. J. Watson, Science 216, 630 (1982).
2. L. M. Mukhin et al., Pis'ma Astron. Zh. 8, 399 (1982). The 3.5-km measurement in the 1982 arti- cle was a misprint. The altitude of the measurements was actually 35 km (L. M. Mukhin, personal com- munication).
3. J. H. Hoffman, R. R. Hodges, Jr., M. B. McElroy, T. M. Donahue, M. Kolpin, Science 205, 49 (1979); J. H. Hoffman, R. R. Hodges, T. M. Donahue, M. B. McElroy,J. Geophys. Res. 85, 7782 (1980).
4. N. E. Andreeva, V. P. Volkov, Yu. I. Sidozov, I. L. Khodakovsky, Lunar Planet. Sci. XIV, 7 (1983); V. P. Volkov, M. Yu. Zolotov, I. L. Khodakovsky, in Advances in Physical Chemistry, S. K. Saxseena, Ed. (Springer-Verlag, New York, 1986), p. 136.
5. C. P. Florensky et al., Kosm. Issled. 21, 351 (1983). 6. Yu. A. Surkov, V. L. Barsukov, L. P. Moskalyeva,
V. P. Kharvukova, A. L. Kemurdzhian, J. Geophys. Res. 89 (suppl. B), 343 (1984); Yu. A. Surkov, Isotopenpraxis 20, 321 (1984); Yu. A. Surkov et al., Pis'ma Astron., 12, 66 (1986).
7. J. Adams, in IR and Raman Spectroscopy of Lunar and Terrestrial Minerals, C. Karr, Ed. (Academic Press, New York, 1975), p. 91.
8. G. R. Hunt, J. W. Salisbury, C. J. Lenhoff, Mod. Geol. 2, 195 (1971).
9. R. V. Morris etal.,J. Geophys. Res. 90, 3126 (1985). 10. J. B. Adams and T. B. McCord, ibid. 74, 4851
(1969); T. B. McCord, R. L. Huguenin, D. Mink, C. M. Pieters, Icarus 31, 25 (1977); T. B. McCord, R. N. Clark, R. B. Singer, J. Geophys. Res. 87, 3021 (1982).
11. A. S. Selivanov et al., Kosm. Issled. 21, 176 (1983); A. S. Selivanov et al., ibid., p. 183.
12. A. P. Ekonomov, Yu. M. Golvin, B. E. Moshkin, Icarus 41, 65 (1980).
13. C. M. Pieters et al., in preparation. 14. A. S. Selivanov, Yu. M. Gektin, M. K. Narayeva, A.
S. Panfilov, Preprint No. 1069 (Institute of Space Research, Academy of Sciences of the U.S.S.R., Moscow, 1986), p. 1.
15. J. B. Garvin, J. W. Head, M. T. Zuber, P. Helfen- stein, J. Geophys. Res. 89, 3381 (1984).
16. C. P. Florensky et al., Geol. Soc. Am. Bull. 88, 1537 (1977); Yu. A. Surkov and V. L. Barsukov, Adv. Space Res. 5, 17 (1985); A. T. Basilevsky et al., Geol. Soc. Am. Bull. 96, 137 (1985).
17. A. L. Kemurdzhian et al., Kosm. Issled. 21, 323 (1983).
18. M. J. Gaffey, J. Geophys. Res. 81, 905 (1976). 19. G. R. Hunt and J. W. Salisbury, Mod. Geol. 1, 283
(1970). 20. J. B. Adams, C. M. Pieters, T. B. McCord, Proc.
Lunar Sci. Conf. 5, 171 (1974). 21. G. R. Hunt, J. W. Salisbury, C. J. Lenhoff, Mod.
Geol. 3, 1 (1971). 22. T. J. Shankland, J. Geophys. Res. 75, 409 (1970);
SCIENCE, VOL. 234

(17,. A. G. Duba, A. Woronow, ibid. 79, 3273 (1974).
23. Y. Fukao, H. Mizutani, S. Uyeda, Phys. Earth Planet. Inter. 1, 57 (1968).
24. R. B. Singer and T. L. Roush, J. Geophys. Res. 90, 12434 (1985).
25. M. D. Osborne, K. M. Parkin, R. G. Burns, Proc. Lunar Planet. Sci. Conf. 9, 2949 (1978).
26. C. M. Pieters,J. Geophys. Res. 88, 9534 (1983). 27. V. L. Barsukov, V. P. Volkov, I. L. Khodakovsky,
ibid. 87 (suppl., part 1), A3 (1982); V. L. Barsukov et al., Lunar Planet. Sci. XVII, (abstr.) 28 (1986).
28. We thank the U.S.S.R. Academy of Sciences for providing the Venera digital images for analysis. This research is a result of interactions made possible through a V. I. Vernadsky Institute-Brown Univer- sity agreement. Discussions concerning Venera 9 and 10 data with I. V. Moroz and A. P. Ekonomov of the Space Research Institute (IKI) were most helpful. We appreciate NASA funding to C.M.P. (NAGW-28 and NAGW-748) and to J.W.H. (NAGW-713) for these studies.
7 July 1986; accepted 10 October 1986
Climatic Consequences of Very High Carbon Dioxide Levels in the Earth's Early Atmosphere Climatic Consequences of Very High Carbon Dioxide Levels in the Earth's Early Atmosphere
JAMES F. KASTING AND THOMAS P. ACKERMAN JAMES F. KASTING AND THOMAS P. ACKERMAN
The possible consequences of very high carbon dioxide concentrations in the earth's early atmosphere have been investigated with a radiative-convective climate model. The early atmosphere would apparently have been stable against the onset of a runaway greenhouse (that is, the complete evaporation of the oceans) for carbon dioxide pressures up to at least 100 bars. A 10- to 20-bar carbon dioxide atmosphere, such as may have existed during the first several hundred million years of the earth's history, would have had a surface temperature of approximately 85? to 110?C. The early stratosphere should have been dry, thereby precluding the possibility of an oxygenic prebiotic atmosphere caused by photodissociation of water vapor followed by escape of hydrogen to space. Earth's present atmosphere also appears to be stable against a carbon dioxide-induced runaway greenhouse.
The possible consequences of very high carbon dioxide concentrations in the earth's early atmosphere have been investigated with a radiative-convective climate model. The early atmosphere would apparently have been stable against the onset of a runaway greenhouse (that is, the complete evaporation of the oceans) for carbon dioxide pressures up to at least 100 bars. A 10- to 20-bar carbon dioxide atmosphere, such as may have existed during the first several hundred million years of the earth's history, would have had a surface temperature of approximately 85? to 110?C. The early stratosphere should have been dry, thereby precluding the possibility of an oxygenic prebiotic atmosphere caused by photodissociation of water vapor followed by escape of hydrogen to space. Earth's present atmosphere also appears to be stable against a carbon dioxide-induced runaway greenhouse.
E ARTH HAS APPROXIMATELY 60 BARS of carbon dioxide tied up in carbon- ate rocks, roughly two-thirds the
amount present in the atmosphere of Venus (1, 2). This carbon, along with other volatile elements, was presumably brought to the earth during accretion as a component of infalling planetesimals. A substantial frac- tion of these volatile compounds should have been released upon impact (3-5). Car- bon may have been degassed as CO2 or as some more reduced gas (CO or CH4), de- pending on the oxidation state of the infall- ing material and of the upper mantle. Once in the atmosphere, however, any reduced carbon species should have been oxidized to CO2 by OH radicals produced from water vapor photolysis (6). Consequently, the ear- liest atmosphere may have contained large amounts of CO2-up to one-third of the earth's total inventory, or 20 bars, according to Holland's estimate (3). If the fraction of the earth's surface occupied by continents was initially small, carbonate formation would have been inhibited and sea-floor carbonate sediments would have been rapid- ly recycled; thus, a dense (approximately 10 bar) CO2 atmosphere could conceivably have persisted for several hundred million years (7).
To explore the possible climatic conse- quences of high CO2 concentrations in the early atmosphere, we made a series of calcu-
lations using a one-dimensional radiative- convective climate model. The primary goal of these calculations was to determine whether a runaway greenhouse could have occurred on the early earth. A runaway greenhouse is here defined as an atmosphere in which water is present entirely as steam or clouds; no oceans or lakes are present at the surface. We concern ourselves only with times subsequent to the accretion period, when the earth was heated solely by absorp- tion of solar radiation. The possibility of a runaway greenhouse during accretion will be considered elsewhere. A second purpose of this study was to determine the stability of a high CO2 primitive atmosphere against water loss through photodissociation of wa- ter vapor followed by escape of hydrogen to space. An understanding of this latter ques- tion is needed in order to estimate the earth's initial water inventory and to predict the oxidation state of the early atmosphere. An interesting by-product of our calculation is an estimate of the stability of the earth's current atmosphere to large CO2 increases.
The radiative-convective model employed here is based on one used in previous studies of the earth's climate system (8, 9). It has, however, been updated to include new ab- sorption coefficients for H20 and CO2 (10) along with a self-consistent calculation of solar energy deposition (11). The band model coefficients used to define gaseous
12 DECEMBER 1986 12 DECEMBER 1986
absorption were derived for pressures of 0.1 and 1 bar; calculated transmission functions are not expected to be accurate at higher pressures. This should have little effect on our results, since the dominant mode of energy transport at these higher pressures is convection.
The most important physical assumptions made in the model are related to our treat- ment of tropospheric lapse rate, relative humidity, and clouds. The lapse rate was set equal to its moist adiabatic value, following Ingersoll's formulation (12), which is valid for large water vapor amounts. The use of the moist adiabatic lapse rate causes the surface temperature Ts to increase much more slowly with increasing CO2 than it would in a fixed lapse-rate model (8, 13, 14) because the temperature of the upper tropo- sphere increases more rapidly than does Ts.
Relative humidity cannot be calculated self-consistently with a one-dimensional model because it is determined by three- dimensional dynamical processes. Since our primary goal is to calculate upper limits on surface temperature, we wish to ensure that the troposphere is nearly saturated with water vapor at high CO2 concentrations. At low CO2 concentrations, however, we want the troposphere to revert to its present unsaturated state. To effect such a transition the tropospheric relative humidity was as- sumed to increase as the fractional amount of water vapor at the surface increased (15). This assumption is consistent with the idea that the behavior of atmospheric water va- por is related to its mixing ratio (12). Our parameterization has no rigorous theoretical justification, however, and may be regarded simply as an artifice for connecting unsatu- rated low Ts solutions to nearly saturated high Ts solutions.
The stratospheric water vapor content was estimated by allowing relative humidity to increase to unity above the convective region, provided that the H20 volume mix- ing ratio, f(H20), did not increase with altitude. This approximate cold-trapping mechanism tends to overestimate the H20 content of the stratosphere because it ig- nores latitudinal variations in tropopause temperature. This is acceptable for our pur- poses because we wish to derive upper limits on surface temperature and hydrogen escape rate.
Clouds were not included explicitly in our model because we do not know how they would vary as a function of CO2 concentra- tion. Their effect on climate was included implicitly by adopting a high surface albedo (As = 0.22). This value of As was chosen
absorption were derived for pressures of 0.1 and 1 bar; calculated transmission functions are not expected to be accurate at higher pressures. This should have little effect on our results, since the dominant mode of energy transport at these higher pressures is convection.
The most important physical assumptions made in the model are related to our treat- ment of tropospheric lapse rate, relative humidity, and clouds. The lapse rate was set equal to its moist adiabatic value, following Ingersoll's formulation (12), which is valid for large water vapor amounts. The use of the moist adiabatic lapse rate causes the surface temperature Ts to increase much more slowly with increasing CO2 than it would in a fixed lapse-rate model (8, 13, 14) because the temperature of the upper tropo- sphere increases more rapidly than does Ts.
Relative humidity cannot be calculated self-consistently with a one-dimensional model because it is determined by three- dimensional dynamical processes. Since our primary goal is to calculate upper limits on surface temperature, we wish to ensure that the troposphere is nearly saturated with water vapor at high CO2 concentrations. At low CO2 concentrations, however, we want the troposphere to revert to its present unsaturated state. To effect such a transition the tropospheric relative humidity was as- sumed to increase as the fractional amount of water vapor at the surface increased (15). This assumption is consistent with the idea that the behavior of atmospheric water va- por is related to its mixing ratio (12). Our parameterization has no rigorous theoretical justification, however, and may be regarded simply as an artifice for connecting unsatu- rated low Ts solutions to nearly saturated high Ts solutions.
The stratospheric water vapor content was estimated by allowing relative humidity to increase to unity above the convective region, provided that the H20 volume mix- ing ratio, f(H20), did not increase with altitude. This approximate cold-trapping mechanism tends to overestimate the H20 content of the stratosphere because it ig- nores latitudinal variations in tropopause temperature. This is acceptable for our pur- poses because we wish to derive upper limits on surface temperature and hydrogen escape rate.
Clouds were not included explicitly in our model because we do not know how they would vary as a function of CO2 concentra- tion. Their effect on climate was included implicitly by adopting a high surface albedo (As = 0.22). This value of As was chosen because it allows the model to reproduce the
Space Science Division, NASA Ames Research Center, Moffett Field, CA 94035.
REPORTS 1383
because it allows the model to reproduce the
Space Science Division, NASA Ames Research Center, Moffett Field, CA 94035.
REPORTS 1383