the colorado talent pipeline report
TRANSCRIPT

1
THE COLORADO TALENT PIPELINE REPORTPRESENTED TO THE COLORADO STATE LEGISLATURE JANUARY 2, 2015

2 3
EXECUTIVE SUMMARY
The Colorado Workforce Development Council is a powerful industry led coalition of state agencies and their local system partners, collaborating to align the work of economic development, workforce development, education and training to meet the needs of Colorado’s students, jobseekers and businesses.
THE COLORADO TALENT PIPELINE REPORT
PRESENTED TO THE COLORADO STATE LEGISLATURE JANUARY 2, 2015
For legislative questions or requests related to this report, please contact:Patrick Teegarden, Director of Policy and LegislationOffice of Government, Policy and Public Relations, Colorado Dept. of Labor & EmploymentP 303.318.8019 | C 303-908-0866 | [email protected]
All other inquires may be directed to:Stephanie Steffens, Director, Colorado Workforce Development CouncilP 303.318.8235 | C 719.588.2373 | [email protected]
Or
Lauren E. Victor, Ph.D., Talent Development Research and Policy AnalystColorado Workforce Development Council and Colorado Department of Higher EducationP 303.866.2363 | [email protected]
In accordance with 24-46.3-103 C.R.S., this Talent Pipeline report was prepared by the Colorado Workforce Development Council (CWDC) in partnership with the Department of Higher Education, the Department of Education, the Department of Labor and Employment, and the Office of Economic Development and International Trade, with support from the Office of State Planning and Budgeting and the State Demography Office at the Department of Local Affairs. This report provides an overview of the state’s educational attainment and educational pipeline data, occupations with positive outlooks, in-demand skills by occupations concentrated in our state’s Key Industry Networks, and education/training strategies currently being enacted. As this is the first annual report, it also discusses perceived data limitations when analyzing our education and workforce systems.
Colorado has a reputation for meeting its workforce needs in part by importing a large share of highly educated workers; the state must also ensure that the education and training pipelines within the state are adequately preparing youth and adults for the workforce and are aligned with the needs of the economy. Our conventional talent pipeline—as measured by the number of 9th graders that complete a Colorado public high school degree, directly enter college, and earn a degree on-time—accounts for about 23 of every 100 9th graders. We know that other education and training opportunities exist and that many of the other 77 out of 100 students follow equally successful alternate paths, but we have limited data on most of these alternative pipelines. A significant challenge identified in this report is to increase our understanding and data about these other pathways.
This report also explores Colorado jobs that have high projected growth rates and openings, and typically offer a living wage. Many of the occupations on this list are in healthcare, information technology, construction and extraction, and business and finance. The vast majority of the jobs on this list expect some level of formalized postsecondary training/education. When we examine skills requirements of occupations concentrated in our Key Industries, skills that frequently appear across industries include active listening, complex problem solving and critical thinking, among others.
A final section provides next steps and recommendations for the CWDC and its partner agencies for improving our talent pipeline. While our state already has a number of strong data linkages across agency that allow us to follow aggregate trends, there still remain various transition points in data along the talent pipeline that we must continue to work toward closing. Through our experiences in preparing this report, we believe that better alignment of skills terms and definitions across entities would more clearly communicate the intersections and expectations for successful employment in Colorado. As we continue to use the career pathways model to align education, training and work based learning, it is integral that we provide accessible information that increases Coloradans’ understanding of good career opportunities and the multiple pathways into them.
In accordance with 24-46.3-103 C.R.S. as amended by SB14-205, this Talent Pipeline report was prepared by the Colorado Workforce Development Council (CWDC) in partnership with the Department of Higher Education, the Department of Education, the Department of Labor and Employment, and the Office of Economic Development and International Trade, with support from the Office of State Planning and Budgetingand the State Demography Office at the Department of Local Affairs.

4 5
INTRODUCTIONTABLE OF CONTENTS
Colorado is recognized as having a strong economy, a low unemployment rate and a highly educated workforce. At the same time, our regional economies and educational attainment levels vary greatly. Supporting the economic success of Coloradans and Colorado businesses requires us to better understand and promote a thriving talent pipeline throughout our state. As the economy continues to grow and flourish, we must execute multiple strategies to meet our workforce needs, including supporting the success of our own “home grown” students and workers while continuing to attract workers from outside the state. While we have a reputation for importing educated workers to our state with relative ease, we must also support the growth of our own residents.
Pursuant to statute (C.R.S. §24-46.3-103), this first annual Talent Report will:
• Provide an overview of Colorado’s populace in terms of migration, education and demographic patterns that impact our potential workforce pool;• Discuss our state’s top jobs, analyzing the opportunities and challenges they present; • Analyze skill sets required for occupations in Colorado’s Key Industries;• Present a progress report on current career pathway efforts; and• Share recommendations to advance Colorado’s talent pipeline, career pathways and data-related practices/opportunities.
COLORADO’S TALENT PIPELINE: PAST, PRESENT AND FUTUREColorado has one of the most highly educated populations in the nation, with 68 percent of our adult population having some level of college training or credential.1 Nearly 46 percent of our adult population has an associate’s degree or higher (U.S. Census Bureau, 2013).
1 This includes individuals who fall into the “some college, no degree” category.
What is a Talent Pipeline?
Our use of the term “talent pipeline” refers to the pool of potential workers to fill positions requiring various skills, knowledge and abilities in our state. In this case, we are focusing on the development of Coloradans through our secondary and postsecondary educational and training systems into the workforce.
13.7%Graduate or professional degree
9.6%Less than high school
22.0%High school graduate
22.8%Some college, no degree
8.3% Associate's degree
23.6%Bachelor's degree
Figure 1: Colorado Educational Attainment, Adults 25 Years and Older
Source: U.S. Census Bureau; 2011-2013 American Community Survey, 3-year estimates
Introduction .............................................................................................................................................................................................. 5
Colorado’s Talent Pipeline: Past, Present and Future ......................................................................................................................6Educational Attainment Levels by Place of Birth ....................................................................................................................7The Racial/Ethnic Educational Attainment Gap .....................................................................................................................8Today’s Talent Pipeline .................................................................................................................................................................9
Why Should Colorado Care about “Leaks” in the Pipeline? .............................................................................................. 12
Colorado’s Top Jobs ............................................................................................................................................................................. 13
Critical Skills across Colorado’s Key Industries .............................................................................................................................. 15
Top Rated O*NET Skills by Key Industry............................................................................................................................... 15
Policy & Practice Linked to the Colorado Talent Development System ................................................................................... 18
The Colorado Blueprint & the Key Industry Initiative: Setting the Stage ...................................................................... 18
Sectors Strategies: Collaborating to Align Education and Training to Meet the Needs of Colorado’s Economy ......................................................................................................................... 19
Colorado and the Workforce Innovation and Opportunity Act ....................................................................................... 23
Next Steps ............................................................................................................................................................................................. 24
Measures across Agency: Creating the Colorado Talent Development Dashboard .................................................... 24
Recommendations................................................................................................................................................................................ 25
Appendix A: Complete List of Top Jobs ....................................................................................................................................... A – 1
Appendix B: O*NET Skills Scores by Key Industry Network ................................................................................................... B – 1
Appendix C: O*NET Skills Definitions ......................................................................................................................................... C – 1

6 7
COLORADO’S TALENT PIPELINE: PAST, PRESENT AND FUTURECOLORADO’S TALENT PIPELINE: PAST, PRESENT AND FUTURE
Educational Attainment Levels by Place of Birth
A large share of our adult population with postsecondary education can be attributed to the significant influx of people from other states who have been drawn to Colorado’s positive economic prospects, moderate cost of living and attractive lifestyle. We have long been importing talent from other states to meet the needs of our growing economy.
Figure 2: Colorado Population Growth, 1970-2016
Figure 3: Colorado Postsecondary Education by Residency
Source: Colorado Department of Local Affairs, State Demography Office
Figure 4: Educational Attainment Levels by Residency
Source: U.S. Census Bureau; 2011-2013 American Community Survey, 3-year estimates
Source: U.S. Census Bureau; 2011-2013 American Community Survey, 3-year estimates
72.7%Born outside of Colorado31.5%
Does not have postsecondary education
68.5%Has postsecondary education
27.3%Colorado native
Understanding the degree to which individuals born outside of the state account for Colorado’s highly educated populace is challenging. Figure 2, which relates educational attainment data with place of birth, provides some insight into the number of individuals going through our state’s educational systems. However, there are limitations to this data; for example, there are students not born in our state who are enrolled in our K-12 education system.
The data summarized above has led policy-makers to consider our talent pipeline and the degree to which we are or are not preparing our own students to meet workforce needs. Some considerations include:
• While we have consistently been able to attract qualified talent from outside of the state, will we continue to do so as demographics shift across the nation and we compete with other states to replace retiring skilled workers?
• Does the quality of our education systems that also educate the children of skilled workers who move to Colorado for employment measure up to their demands? Will we remain attractive to out-of-state, in-demand talent and remain competitive in the inter-state and global job market?
• What is the impact of Colorado’s ethnic educational attainment gap—that is, the college attainment rates of the Hispanic as compared to the non-Hispanic white population—on our overall educational attainment levels and goals?
We must keep two additional factors in mind in considering the degree to which individuals coming from other states contribute to our high educational attainment. First, Colorado currently ranks sixth in having the largest share of residents who were not born in-state. Seventy percent of Colorado residents were not born in Colorado; across the United States, the average share of adults not born in the state in which they reside is 50 percent (U.S. Census Bureau, 2013). Second, the same data show that people with higher levels of educational attainment have higher geographic mobility rates. So, while we tend to import workers from other states with high educational attainment levels, likewise, many native Coloradans with high levels of education leave the state in pursuit of opportunities elsewhere. In fact, Colorado appears to be doing relatively well retaining native Coloradans with postsecondary education, as compared to the nation-at-large, as depicted in the following chart.
Colorado–Born in Colorado and residing in CO
United States–Born in state of residence
United States overall educational attainment
9%11%
14%
28%
33%
28%
35%31%
29%
19%16%
18%
8% 8%11%
Less than high school graduate
High school graduate (or equivalency)
Some college or associate’s degree
Bachelor’s degree Graduate or professional degree

8 9
COLORADO’S TALENT PIPELINE: PAST, PRESENT AND FUTURECOLORADO’S TALENT PIPELINE: PAST, PRESENT AND FUTURE
Talent development can follow several trajectories. We are most able to obtain data on students who follow the “traditional” pathway of completing high school on-time, directly enrolling in college and then immediately entering the workforce. But there are many other routes—some with successful outcomes, some not. Increasing our understanding of these pathways to employment is integral to identifying the education and training needs of our state and how to build a comprehensive talent development system to meet them. The primary goal is to ensure we are applying resources effectively to provide every Coloradan with the tools to develop adequate skills to succeed in life and the labor market.
The Racial/Ethnic Educational Attainment Gap
While our state’s overall educational attainment levels are quite high, there is variance in education levels for different subsets of our population, most notably between the Hispanic and non-Hispanic white segments of our population. Just 19 percent of Hispanic adults over 25 years old hold a college degree, as compared to 52 percent of non-Hispanic white adults (see Figure 5, below).
71%61%
54% 52%
<18
18 to 24
25 to 44
45 to 64
65 +
35%34%42% 44%
19%
40% 39%29%
63% 62%52%
Enrollment Rates from Higch School District College
Graduation Rates from College (degree earned within 150% of standard program time)
Percent of Adults with Postsecondary Degree
Source: Colorado Department of Higher Education; U.S. Census Bureau
Figure 6: Hispanic Share of Colorado Population by Age Group
Figure 5: Educational Attainment Behavior by Race/Ethnicity
Source: Colorado Department of Local Affairs, State Demography Office
Figure 7: The Colorado Talent Pipeline (see next two pages)
We also know that the ethnic composition of our state is changing, with the young Hispanic population being the fastest growing segment of the state’s population (see Figure 6, below). Yet, postsecondary enrollment and completion rates still lag significantly for our Hispanic, and overall underserved minority, population (Figure 5). By 2040, the non-white share of our primary working adult population (ages 25 to 64) is projected to be 43 percent (in 2010 it was 26 percent). With such a large and growing minority population, it is essential that this population has access to and finds success in educational and career pathways, if we are to continue to nurture a thriving state economy.
0% 5% 10% 15% 20% 25% 30% 35% 40% 45% 50%
Today’s Talent Pipeline
We estimate that for every 100 Colorado 9th graders, approximately 23 complete the traditional, or conventional, education pipeline of graduating from a public high school in four years, immediately entering a public or private college or university that fall, and completing a postsecondary credential within 150% of the standard program time. Of the 23 students who obtain a postsecondary credential, approximately 18 are found in the Colorado workforce the year following graduation, as some students continue their education and delay workforce entry or pursue opportunities outside of Colorado.
We know that we have too many leaks in this pipeline, and we know that some of our underserved populations experience those leaks more than others. Colorado is expected to have the third highest share of jobs that demand postsecondary training/education among all states by 2020 (Carnevale, Smith & Strohl, 2013), so we cannot remain comfortable with the status quo.
While we know leaks exist, as noted above, there are multiple pathways to education, training and success in the workforce. Students graduate from high school and then take a year off before enrolling in postsecondary education; some pursue an apprenticeship to develop specialized skills; others complete a postsecondary credential and then find employment in another state. These and various other alternative paths should not be viewed negatively or as leaks. We need to increase our understanding of what is happening to Coloradans who pursue alternative pathways to employment, and how we can support the development and continual upgrading of skills that are demanded of our workforce throughout our economy.
The following illustration outlines some of the variations affecting our state’s talent pipeline, also depicting where we may have some gaps in our knowledge. Table 1 then outlines some of the data points we currently rely on, as well as some of the data limitations that we face.
Asian Non-Hispanic Black Hispanic American Indian Non-Hispanic White
31%
22%
25%
13%
10%
45%
41%
36%
26%
19%
2010
2040

10 11

12 13
COLORADO’S TALENT PIPELINE: PAST, PRESENT AND FUTURECOLORADO’S TALENT PIPELINE: PAST, PRESENT AND FUTURE
What we know What we know we don’t know
Colorado public high school graduates linked to Colorado public and three private postsecondary institutions so that we understand performance outcomes at the postsecondary level (CDE, CDHE)
Colorado high school graduates linked directly to Colorado labor data, to better understand aggregate trends in our H.S. graduates’ employment outcomes.
Public postsecondary institution graduates linked to Colorado wage data to understand aggregate earning trends on the Colorado labor market (CDHE, CDLE)
Postsecondary institution graduates linked to other states’ labor data to understand migration and earning trends, and which types of graduates may be attracted to employment opportunities out-of-state and why. We are also unable to track graduate e arnings by occupation.
Public community college and four year college/university data (plus three private non-profits) (CDHE)
Detailed student-level information from private colleges and occupational schools, which leaves us unable to provide any information on aggregate employment/earning trends on the job market. We also cannot follow our H.S. graduates into these schools.
Occupational forecasts for Colorado (CDLE) Registered Apprenticeship outcomes by apprenticeship type, or statewide, centralized data on informal apprenticeship opportunities.
Unemployment rates by educational attainment level (CPS, ACS)
Current labor supply by qualifications/occupations. Some tools provide insights to the number of individuals seeking employment in specific occupations, but we do not know the number of people not employed in their field of study or expertise.
Colorado migration trends, levels of education by state native v. non-native (ACS)
Information on a living wage in Colorado
O*NET occupational information, such as skills scores
Table 1: Education and Labor Data in Colorado Table 2: Colorado Unemployment and Earnings by Education Level
Source: U.S. Census Bureau; 2013 American Community Survey, 1-year estimates; Current Population Survey
Note: There may be additional components that we are not aware of as gaps in knowledge/accessibility.
Why Should Colorado Care about “Leaks” in the Pipeline?
What happens to those Coloradans who do not obtain adequate preparation and training to pursue a passion, technical specialization or advance through a career path? Studies have shown that those with lower levels of education typically have higher unemployment rates, less stable and lucrative job prospects, less opportunities for mobility, lower levels of health and lower earning potential. All of these potential roadblocks are not just burdens on the individual—when we leave a Coloradan behind, we are setting up ourselves as a society to fiscally bear increased costs in social services, while reducing the opportunity for our state to receive more tax monies from those lost earnings and productivity.
Opportunity Youth
Research on opportunity youth (also known as disconnected youth—youth ages 16-24 who may have dropped out of high school or college and also have trouble securing stable attachment to the labor market) describes significant social and financial burdens through lost output/wages and lost taxes, above average levels of criminal involvement and high use of social services. Minorities and males disproportionately represent opportunity youth. For more information, visit: The Economic Value of Opportunity Youth
Educational Attainment Unemployment Rate Median Earnings ($)
Less than high school graduate 8.9% 21,624
High School graduate 4.7% 30,011
Some college or associate’s degree 4.4% 33,594
Bachelor’s degree3.1%
46,891
Graduate or professional degree 61,730
The youth unemployment rate (ages 16 to 19) still remains higher than what it was immediately prior to the recession (Current Population Survey). In addition, the long-term unemployed (individuals out of work for 26+ weeks, or those exhausting unemployment benefits) face a unique combination of social, emotional and skill deficiencies caused by the duration of their unemployment that require intensive “wraparound” services to address these issues effectively, while rapidly moving individuals to paid work experience and reemployment. As of November 2014, there were 47,200 individuals considered long-term unemployed. The long-term unemployed currently make up about one-third of all unemployed persons.
Colorado is a great place to live, and we are fortunate that individuals chose to move to and stay in Colorado for a variety of reasons. We have a strong economy that requires workers at every skill level. Data show that even as Colorado continues to grow following the Great Recession, we still have educational attainment gaps and/or additional challenges along the way to employment for various subsets of our population. To meet the needs of our residents and Colorado’s businesses, we must consider every asset available to fill the Talent Pipeline to ensure sustainable economic vitality. We must empower our students, jobseekers, unemployed and underemployed with good information and support systems to assist in career path choices that will work for their individual needs, as well as be responsive to industry demand.
COLORADO’S TOP JOBSHaving briefly analyzed Colorado’s talent pipeline, we now turn to “top jobs” in Colorado. This report uses labor market data from Colorado’s Office of Labor Market Information to identify jobs that meet three criteria: projected high openings, above average growth rates and typically offering a living wage for the average family size. This is not an exhaustive list of occupations that offer opportunities for Coloradans; rather, it offers a glimpse into some promising industries in our state overall and can thereby help guide our directed efforts in developing our state’s workforce talent in various sectors. Also, many occupations that do not exist today may be in high demand in the near future, so we look to this list to provide us with a sense of fields where we can anticipate burgeoning opportunity. Further analysis of these jobs will be conducted in the Department of Higher Education’s forthcoming annual Skills for Jobs Legislative Report.
Following is a sampling of some occupations found in this list by field. The complete list can be found in Appendix A.

14 15
COLORADO’S TOP JOBS CRITICAL SKILLS ACROSS COLORADO’S KEY INDUSTRIES
Skilled Trades Finance
CarpentersElectriciansIndustrial Machinery MechanicsPlumbers, Pipefitters, Steamfitters
Accountants and AuditorsCredit AnalystsFinancial AnalystsPersonal Financial Advisors
Healthcare Information Technology
Dental HygienistsOccupational TherapistsPharmacistsPhysician AssistantsRegistered Nurses
Computer Network ArchitectsComputer User Support SpecialistsSoftware DevelopersWeb Developers
Table 3: Selection of Occupations from Top Jobs List
Of note, 81 percent of job openings in this list are for occupations that typically require some level of postsecondary education for entry, whether it is an apprenticeship, certificate or degree (see Figure 8, below).
45%Bachelor’s
11%Associate’s
9%Non-degree/Some college
7%Apprenticeship
2%Long OJT
9%Moderate OJT
4%Short OJT
4%HS/Experience
6%Doctorate/Professional
3%Master’s
Technology is increasingly impacting our economy and our lives, and many occupations in this list are often defined as requiring high levels of competency in one or more STEM (Science, Technology, Engineering and Math) areas. According to the Brookings Institution’s definition of STEM occupations,2 55 percent of the jobs on this list are considered STEM, while about 20 percent of occupations across our state’s workforce overall are classified as STEM. Since this list includes high representation from finance, IT and healthcare occupations, most of which Brookings defines as STEM, it is appro-priate that so many jobs on this list fall under this classification. According to the Bureau of Labor Statistics definition of STEM occupations, 38 percent of jobs in this list are STEM, while out of all occupations in Colorado, about 14 percent are STEM by this definition. The STEM occupations listed here are also jobs that are more likely to expect some level of postsecondary education than that of non-STEM occupations.
2 The Brookings Institution uses O*NET scores to establish occupations that require above average knowledge in one or multiple STEM categories.
Figure 8: Where are the "Top Job" Openings by Typical Entry Level Education?
We now turn to the skills required for the most highly concentrated occupations within each of Colorado’s Key Industries using O*NET skills scores as assigned to each occupation.3 While a worker can be expected to exhibit a skill that does not appear on a list, the skills listed here are considered the most vital demanded of skilled workers employed in these occupations. We also explore where K-12 student indicators and O*NET skills intersect.Across industry, as measured by O*NET scores, the most in-demand skills include critical thinking, active listening, reading comprehension, speaking, judgment and decision making, and complex problem solving. While we relied on O*NET skills scores to conduct this analysis, we believe it would be a worthwhile exercise to validate the rankings of these skill sets through sector partnerships and other business organizations.
3 The Occupational Information Network (O*NET) program is the national source of occupational information under the direction of USDOL/ETA. O*NET skills scores are derived from surveys of workers from each occupation.
O*NET Skill Definitions
Active Listening — Giving full attention to what other people are saying, taking time to understand the points being made, asking questions as appropriate, and not interrupting at inappropriate times.
Critical Thinking — Using logic and reasoning to identify the strengths and weaknesses of alternative solutions, conclusions or approaches to problems.
Complex Problem Solving — Identifying complex problems and reviewing related information to develop and evaluate options and implement solutions.
Judgment and Decision Making — Considering the relative costs and benefits of potential actions to choose the most appropriate one.
Reading Comprehension — Understanding written sentences and paragraphs in work related documents.
Speaking — Talking to others to convey information effectively.
For more information, visit: O•NET Online
K-12 Student Outcomes
Academic Competencies — math skills, literacy skills, and critical thinking skills
Professional Competencies — ability to manage time, collaborate with others, and independently learn new things
Entrepreneurial Competencies — the ability to manage professional risk, make interesting connections, and learn from failure
Personal Competencies — deep knowledge of self that students can use to make good decisions that play on their strengths
Civic Competencies — drive to contribute as a member of the community and the workforce

16 17
CRITICAL SKILLS ACROSS COLORADO’S KEY INDUSTRIES
Understanding where in-demand skills exist in the workforce directly relates to Colorado’s Graduation Guidelines, which are intended to assist students in gaining work-ready skills while in high school. At the secondary level, the goal is for all students to understand and articulate their individual skill-set, how they relate to potential careers and jobs, and graduate with these in-demand skills from high school. Colorado industry representatives are clear that students who graduate from high school and seek to work in Colorado need in-demand skills that meet business,
industry, and higher education standards. Graduation guidelines are a roadmap to help students and their families plan for success after high school by demonstratingtheir knowledge, skills and abilities to enter the workforce, military or higher education without significant training or remediation.
The Council of Chief State School Officers recently released a series of recommendations for K-12 public schools to best prepare students for college and/or career readiness. Recommendations include heightened responsiveness to the labor market by collaborating with the employer community, and greater emphasis on career pathways and preparation.
States Announce Actions to Close the Skills Gap for All Students
A national survey was conducted of recent H.S. graduates to assess the areas in which they feel most and least prepared for work or further education following H.S.
Rising to the Challenge PowerPoint
Competencies & Skills
Academic Professional Personal Entrepreneurial Civic
Active Listening x x
Complex Problem Solving
x x
Critical Thinking x
Judgment and Decisions
x x
Reading Comprehension
x
Speaking x
Table 4: Intersections between High Ranking Occupational Skills & K-12 Student Outcomes
Table 5: Top Ten ONET Skills Scores by Key Industry Network
Top Rated O*NET Skills by Key Industry
The following table shows how skills rank across skilled professions in our state’s Key Industries. A score of 50 or greater indicates that the skill is typically needed in order to perform the duties of an occupation; the higher the score, the greater the level of skill proficiency required for the occupation. This proficiency can be developed through training and/or experience. This table includes the top ten skills that had an average score that met or exceeded 50 by each key industry network. The actual average scores are also included to understand how some industries, on average, may have higher or lower requirements of proficiency levels. An asterisk next to a score signifies that this score exceeds the average score for all occupations. Top skills score lists by key industry, as well as a complete list of the definitions for all O*NET skills, can be found in Appendices B and C.
Key Industry Network
Active Learning
Active Listening
Complex Problem Solving
Coordination
Critical Thinking
Judgment and Decision Making
Monitoring
Operation and Control
Operation Monitoring
Reading Comprehension
Service Orientation
Social Perceptiveness
Speaking
Systems Analysis
Time Management
Writing
Advanced Manufacturing
3, 59.96, 55.3*
9, 52.11, 61.3
7, 54.95, 57.8*
2, 60.34, 58.0
8, 52.310, 50.0
Aerospace9, 54.9*
3, 65.6*5, 62.7*
9, 54.9*1, 68.3*
6, 60.7*7, 58.3*
2, 67.3*4, 63.0
8, 57.9*
Bioscience9, 54.1*
3, 65.15, 59.1*
2, 65.3*6, 58.5*
7, 57.61, 65.8*
4, 62.010, 53.5*
8, 57.3*
Creative Industries1, 67.5*
7, 57.8*10, 54.9*
4, 64.0*5, 58.2*
8, 56.62, 65.5*
3, 64.4*9, 54.9*
6, 57.9*
Electronics3, 66.1*
5, 61.3*10, 54.6*
2, 66.5*6, 60.1*
8, 57.01, 68.4*
4, 63.8*9, 54.7*
7, 58.8*
Energy & N
atural Resources2, 59.3
8, 54.29, 53.3
1, 61.26, 55.7
3, 57.67, 54.9*
5, 56.24, 57.5
10, 53.0
Financial Services10, 55.4*
1, 72.6*7, 59.2*
4, 67.6*6, 62.6*
3, 68.6*8, 59.0*
2, 71.3*9, 56.9*
5, 63.6*
Food & A
griculture1, 55.8
6, 52.92, 55.6
9. 50.05, 53.6
7, 51.4*4, 53.9*
3, 54.88, 50.1
Health &
Wellness
10, 59.1*1, 74.0*
3, 68.3*8, 61.6*
7, 64.0*4, 68.2*
6, 65.6*5, 68.0*
2, 72.1*9, 61.4*
Infrastructure Engineering10, 52.7*
2, 62.76, 57.1*
8, 55.1*1, 64.4*
5, 57.1*7, 56.6
3, 62.0*4, 60.1
9, 64.3*
Technology & Inform
ation10, 54.6*
3, 65.15, 61.6*
1, 67.6*6, 58.6*
8, 56.22, 66.7*
4, 61.79, 55.5*
7, 56.7*
Tourism &
Outdoor Recreation
2, 67.9*5, 60.5*
6, 60.39, 56.7
7, 60.1*8, 57.4
4, 62.7*3, 63.2*
1, 69.6*10, 55.6*
Transportation & Logistics
2, 62.110, 52.6
6, 54.7*3, 59.3
9, 53.55, 57.4
4, 58.17, 54.5
1, 62.38, 54.1*
For the complete list of O
NET skills, see A
ppendix C or onetonline.org. This table only includes skills that were the highest scoring for occupations in these KIN
.
The first number signifies w
here the highest scores rank (1-10) for that KIN.
The second number (50+) signifies the average score across top skilled occupations for that KIN
. The higher the number, the higher the level of proficiency typically required.
An asterisk (*) signifies that the score exceeds the average skill score for all occupations.

18 19
POLICY & PRACTICE LINKED TO THE COLORADO TALENT DEVELOPMENT SYSTEMPOLICY & PRACTICE LINKED TO THE COLORADO TALENT DEVELOPMENT SYSTEM
In recent years, Colorado has taken a number of steps and implemented practices to anticipate and address the workforce demands of our state’s economy. The Colorado Blueprint, described in more detail below, helped prioritize the direction of our state’s economic development, while cross-agency collaboration and the Sector Strategies framework have contributed to progress in developing partnerships and career pathways that support the development of talent to better align with key industry demand.
The Colorado Blueprint & the Key Industry Initiative: Setting the Stage
One of the first tasks that Governor Hickenlooper embarked on when he took office in 2011 was to create a bottom-up economic development strategy—the Colorado Blueprint—which is the policy framework that guides Colorado’s work toward economic vitality. The Office of Economic Development and International Trade (OEDIT) led the effort to identify six core objectives described in the Colorado Blueprint. The Colorado Workforce Development Council (CWDC), together with its strategic state agency and regional partners, leads the efforts toward meeting Core Objective V, to Educate and Train the Workforce of the Future.
The Colorado Blueprint Core Objectives
I. Build a Business-Friendly Environment II. Retain, Grow & Recruit Companies III. Increase Access to Capital IV. Create & Market a Stronger Colorado Brand V. Educate & Train the Workforce of the Future VI. Cultivate Innovation & Technology
Colorado’s 14 Key Industries
Advanced ManufacturingAerospaceBioscienceCreative IndustriesDefense & Homeland SecurityElectronicsEnergy & Natural ResourcesFinancial ServicesFood & AgricultureHealth & WellnessInfrastructure EngineeringTechnology & InformationTourism & Outdoor RecreationTransportation & Logistics
Composition of the CWDC
The CWDC is composed of representatives from across the state that represent industries critical to Colorado’s economy: Cabinet-level positions that impact workforce, education, and economic development, elected officials (including the Governor, state legislators, and county commis-sioners), appointed workforce and education leaders, representatives from community-based organizations, and organized labor.
Watch a video overview of how sector partnerships and career pathways are filling Colorado’s talent pipeline.
CWDC commissioned the Woolsey Group, LLC to complete a report on work experiences in Colorado, as creating opportunities for more work experiences and internships continues to be a top priority of industry partners. See the report here.
Using the Blueprint and labor market data, OEDIT then identified fourteen “Key Industries” as critical to Colorado’s economy. Business leaders from each of the Key Industries developed a strategic business plan focused on the needs of their respective industries statewide. The input from the business community led to several universal themes relatedto education and training:
1. Improve the perception and awareness of career paths (i.e., what it means to work in different industries).
2. Increase opportunities for hands-on work experience (e.g., internships, on-the-job training, etc.).
3. Identify career and education pathways within particular industries.
4. Provide training opportunities for staff who work with students and job seekers (i.e., teachers, counselors, workforce center staff) to learn about careers and career pathways so that they are able to share this knowledge with students.
As reflected in this report, Colorado’s talent pipeline is complex, and we have begun to develop and build from a foundation of best practices to address talent development for our unique labor force needs. Coordinated by the CWDC, a coalition of state agencies, local partners and industry is working to ensure that Colorado’s workforce development, education and training efforts are aligned to meet the needs of Colorado’s economy, focusing in particular on sector partnerships and career pathways.
Sectors Strategies: Collaborating to Align Education and Training to Meet the Needs of Colorado’s Economy
Colorado has declared a statewide priority to develop industry-led career pathways for thriving industries within the state’s regional economies. A career pathway is a series of connected education and training programs, work experiences and student support services that enable individuals to secure a job or advance in an industry
or occupation. The vehicle for creating such pathways is sector partnerships—regional, industry-led partnerships of private and public partners, in a specific region, for a specific industry. The goal of sector partnerships is for private and public partners to coordinate and collaborate around the opportunities and requirements for the industry to grow in their region. Active sector
partnerships have the ability to help drive the development of career pathways with education partners, so as to better meet their workforce needs.
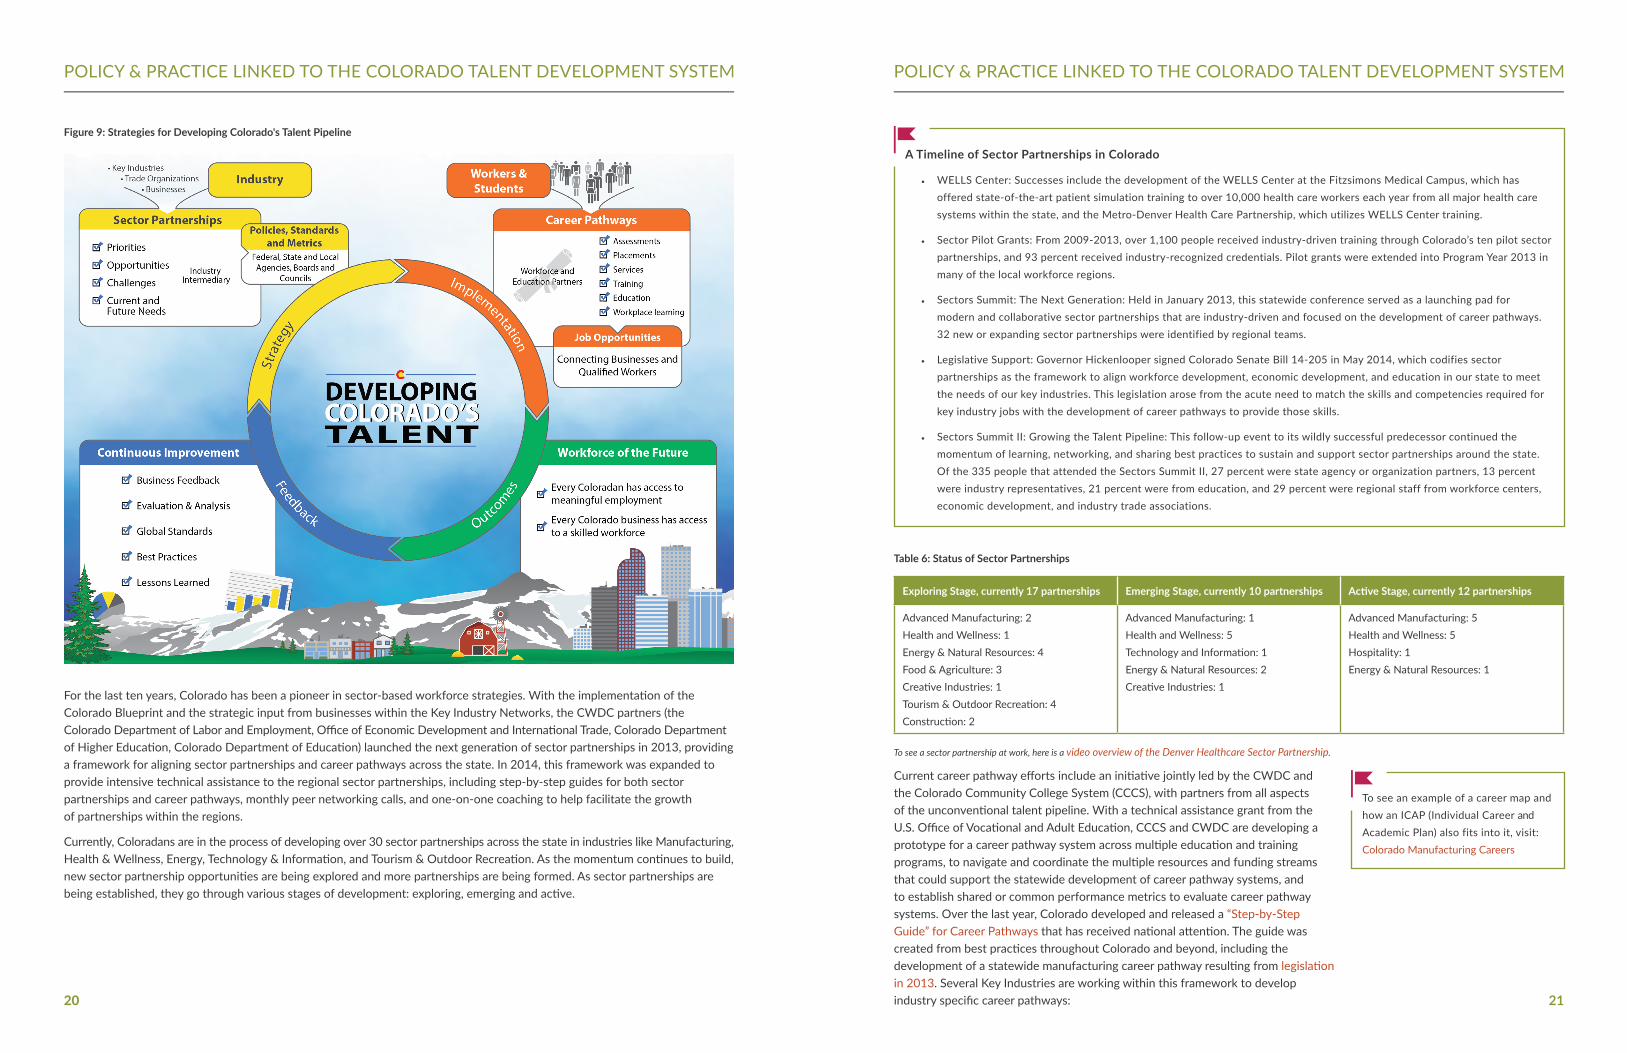
The following infographic (Figure 9) and narrative describe how this vision is translated into action, through the strategies of Sector Partnerships and Career Pathways.
For more information on Colorado‘s public workforce system, sector partnerships, and career pathways, please see our most recent annual report published here.
20 21
For the last ten years, Colorado has been a pioneer in sector-based workforce strategies. With the implementation of the Colorado Blueprint and the strategic input from businesses within the Key Industry Networks, the CWDC partners (the Colorado Department of Labor and Employment, Office of Economic Development and International Trade, Colorado Department of Higher Education, Colorado Department of Education) launched the next generation of sector partnerships in 2013, providing a framework for aligning sector partnerships and career pathways across the state. In 2014, this framework was expanded to provide intensive technical assistance to the regional sector partnerships, including step-by-step guides for both sector partnerships and career pathways, monthly peer networking calls, and one-on-one coaching to help facilitate the growth of partnerships within the regions.
Currently, Coloradans are in the process of developing over 30 sector partnerships across the state in industries like Manufacturing, Health & Wellness, Energy, Technology & Information, and Tourism & Outdoor Recreation. As the momentum continues to build, new sector partnership opportunities are being explored and more partnerships are being formed. As sector partnerships are being established, they go through various stages of development: exploring, emerging and active.
A Timeline of Sector Partnerships in Colorado
• WELLS Center: Successes include the development of the WELLS Center at the Fitzsimons Medical Campus, which has offered state-of-the-art patient simulation training to over 10,000 health care workers each year from all major health care systems within the state, and the Metro-Denver Health Care Partnership, which utilizes WELLS Center training.
• Sector Pilot Grants: From 2009-2013, over 1,100 people received industry-driven training through Colorado’s ten pilot sector partnerships, and 93 percent received industry-recognized credentials. Pilot grants were extended into Program Year 2013 in many of the local workforce regions.
• Sectors Summit: The Next Generation: Held in January 2013, this statewide conference served as a launching pad for modern and collaborative sector partnerships that are industry-driven and focused on the development of career pathways. 32 new or expanding sector partnerships were identified by regional teams.
• Legislative Support: Governor Hickenlooper signed Colorado Senate Bill 14-205 in May 2014, which codifies sector partnerships as the framework to align workforce development, economic development, and education in our state to meet the needs of our key industries. This legislation arose from the acute need to match the skills and competencies required for key industry jobs with the development of career pathways to provide those skills.
• Sectors Summit II: Growing the Talent Pipeline: This follow-up event to its wildly successful predecessor continued the momentum of learning, networking, and sharing best practices to sustain and support sector partnerships around the state. Of the 335 people that attended the Sectors Summit II, 27 percent were state agency or organization partners, 13 percent were industry representatives, 21 percent were from education, and 29 percent were regional staff from workforce centers, economic development, and industry trade associations.
Exploring Stage, currently 17 partnerships Emerging Stage, currently 10 partnerships Active Stage, currently 12 partnerships
Advanced Manufacturing: 2Health and Wellness: 1Energy & Natural Resources: 4Food & Agriculture: 3Creative Industries: 1Tourism & Outdoor Recreation: 4Construction: 2
Advanced Manufacturing: 1Health and Wellness: 5Technology and Information: 1Energy & Natural Resources: 2Creative Industries: 1
Advanced Manufacturing: 5Health and Wellness: 5Hospitality: 1Energy & Natural Resources: 1
Table 6: Status of Sector Partnerships
Current career pathway efforts include an initiative jointly led by the CWDC and the Colorado Community College System (CCCS), with partners from all aspects of the unconventional talent pipeline. With a technical assistance grant from the U.S. Office of Vocational and Adult Education, CCCS and CWDC are developing a prototype for a career pathway system across multiple education and training programs, to navigate and coordinate the multiple resources and funding streams that could support the statewide development of career pathway systems, and to establish shared or common performance metrics to evaluate career pathway systems. Over the last year, Colorado developed and released a “Step-by-Step Guide” for Career Pathways that has received national attention. The guide was created from best practices throughout Colorado and beyond, including the development of a statewide manufacturing career pathway resulting from legislation in 2013. Several Key Industries are working within this framework to develop industry specific career pathways:
To see an example of a career map and how an ICAP (Individual Career and Academic Plan) also fits into it, visit: Colorado Manufacturing Careers
POLICY & PRACTICE LINKED TO THE COLORADO TALENT DEVELOPMENT SYSTEMPOLICY & PRACTICE LINKED TO THE COLORADO TALENT DEVELOPMENT SYSTEM
Figure 9: Strategies for Developing Colorado's Talent Pipeline
To see a sector partnership at work, here is a video overview of the Denver Healthcare Sector Partnership.

22 23
how well our education system is preparing students for career success. Additionally, as mentioned above, OEDIT has established the alignment of systems to Educate and Train the Workforce of the Future as one of six core objectives in the economic development plan for Colorado. By leveraging the collaboration of agencies through the CWDC, the implementation of this objective is “owned” by all system partners.
Colorado and the Workforce Innovation and Opportunity Act
Colorado’s strategy for aligning and integrating sector strategies and career pathways provides a sustainable framework for continuing this important work into the future, and positions Colorado well for implementation of the Workforce Innovation and Opportunity Act (WIOA). As we look to the next evolution of the workforce system envisioned by WIOA, Colorado is poised to become a model for the nation. The new act mandates the use of sector partnerships, which are already the standard way of doing business in Colorado. WIOA also calls for standardized performance metrics across multiple programs, which include the effectiveness of serving employers. Improving our understanding of the talent pipeline lays the groundwork for understanding how to best meet the current and future needs of employers. Following this model will move the state’s economy forward, ensure that Coloradans are ready to fill new roles, and lead the nation in business-driven talent development.
• Manufacturing: The five active manufacturing sector partnerships and statewide organizations, such as Manufacturer’s Edge and the Colorado Advanced Manufacturing Alliance, are collaborating around a variety of resources to build out regional and statewide career pathways.
• Healthcare: The five active healthcare sector partnerships have each identified workforce as a critical issue and are leveraging existing work in healthcare career pathways, along with a recent NGA Policy Academy on Healthcare Work force to increase the awareness and expand opportunities for individuals to succeed in these careers.
• Information Technology: The Colorado Technology Association is convening an effort to launch an IT Sector Partnership, and has partnered with the Colorado Urban Workforce Alliance to work with public partners in the Metro-Denver area to capitalize on some recent grants as well as their own foundation focused on developing the Technology Talent Pipeline.
• Additionally, conversations have begun with statewide and regional business organizations and public partners for Con struction, Energy & Natural Resources, Hospitality, and Finance.
In the spring of 2013, the Colorado General Assembly addressed this need with the passage of House Bill 13-1165, which authorized the creation of Manufacturing Career Pathways. Advanced Manufacturing is a growing sector in many regions in Colorado and, at present, the state has determined that it is not producing the quantity or quality of workers necessary to support existing manufacturing or meet the future needs of this sector. The goal of HB13-1165 is to work with advanced manufacturing employers to identify the top occupations and job-specific needs within the sector.
In addition to HB13-1165, Colorado was awarded a Colorado Helps Advanced Manufacturing Program/Trade Adjustment Assistance Community College and Career Training (CHAMP/TAACCCT) grant to support the development of career pathways in the advanced manufacturing sector. This grant is meant to foster deeper partnerships between community colleges, community partners and employers. Colorado sector partnerships are working together with CHAMP grant recipients to ensure alignment of this work and ongoing efforts around building industry-driven career pathways. This additional and substantial resource is a huge benefit to this work in Colorado. The following links provide more information on Manufacturing Career Pathways and the CHAMP/TAACCCT grant: http://cocareeractiontools.com/ http://www.doleta.gov/taaccct
The sector partnerships and career pathways as described in this section could not be successful without increased collaboration among Colorado state agencies and other partners. Colorado has made great progress with its alignment efforts. State agencies overseeing education, workforce and economic development are maintaining an unprecedented level of communication, data-sharing and collaboration. A willingness to explore innovative solutions, proactively expand proven practices, and share data has strengthened partnerships and trust across state-level organizations. For example, the Department of Education and the Department of Higher Education have made great strides in ensuring that secondary students are prepared to enter postsec-ondary education, which began with the passage of the 2008 Colorado Achievement Plan for Kids. Similarly, a new data-sharing agreement between DHE and the Department of Labor and Employment allows Colorado to track college graduates into the workforce, providing insights to how well our postsecondary system is meeting the state’s workforce needs, and simultaneously
The Northern Colorado Manufacturing Partnership was launched in 2013 and is led by manufacturers in Larimer and Weld counties with a focus on supply chain and networking, rebranding the image of manufacturing, and vocational and technical education. Their rebranding effort is engaging youth and getting them excited about manu-facturing careers. In the past few months, the Northern Colorado Manufacturing Partnership has sponsored more than 60 high school students in tours of six manufacturing facilities. The partnership is working with its local school districts and its industry partners to create career pathways for manufacturing. The partnership is currently in the process of hosting skills panels to identify the KSAs (knowledge, skills and abilities) of the critical occupations in manufacturing in their region.
State and Federal Legislation support this Framework
This report is required by SB14-205 (24-46.3-103 C.R.S.) in addition to this report this legislation provides the framework for career pathway development by industry for Colorado, including a mechanism to receive and invest funds in industry specific career pathways; and the means to coordinate the work across agencies and partners for a more effective and efficient Talent Development System for Colorado.
Read the Colorado Advanced Manufacturing Career Paths Report
POLICY & PRACTICE LINKED TO THE COLORADO TALENT DEVELOPMENT SYSTEMPOLICY & PRACTICE LINKED TO THE COLORADO TALENT DEVELOPMENT SYSTEM

2524
NEXT STEPSNEXT STEPS
We believe that Colorado has gained momentum toward aligning our education, workforce and economic development systems to meet the needs of Colorado’s economy today and in the future. We must continue to maintain Colorado’s reputation as a great place to live, work and play, thereby attracting talent, while also focusing our resources on improving our ability to educate and train Coloradans for the jobs of today and tomorrow. Yet, this also requires cross-agency collaboration, ensuring that each agency is contributing to a more unified talent development system that will meet our workforce needs and support the growth of our economy. Convened and coordinated by the CWDC, the Departments of Education, Higher Education, Labor and Em-ployment, and the Office of Economic Development and International Trade, along with other state, regional and local organiza-tions, will continue to collaborate to address the challenges and opportunities identified in this report, and continue to develop integrated approaches to address them.
While we still have progress to make in better aligning the development of a skilled workforce to meet the demands of our state’s economy, we must continue to build upon the successes we have experienced and the structures we have established.
Vision: We recognize that the State must first have a unified vision. The guiding documents informing this vision are in place in Colorado: the Colorado Blueprint, the state’s economic development plan; CDE’s Performance Plan; Colorado Competes, the state’s Master Plan for higher education; and the Workforce Investment Act Five Year State Plan. Together, these documents lay the path for improving the economic vitality of the state and for developing a system that will continue to prepare all Colora-dans to succeed in the economy. A myriad of other documents inform and guide the many programs, policies and initiatives. The CWDC will coordinate an effort to distill the key components of these documents into a single statewide talent agenda.
Data: Colorado’s state agencies are making great strides in connecting student data from K-12 through completion of post-secondary education and into the workforce, enabling education and policymakers to address policy questions and gauge the effectiveness of programs and initiatives designed to improve student success. Like most states, we are challenged by various data limitations that preclude us from achieving certain levels of analysis that we desire.
Partnerships: Colorado has earned trust across local, regional, state and private partners and is recognized nationally for its public-private and regional-state partnerships; we must continue to strengthen this asset through commitment to bottom-up economic development. Our challenge is to institutionalize these partnerships beyond individual relationships and into the fabric of Colorado’s administration to ensure that the framework is strong enough to withstand leadership changes. Additionally, local partnerships in Colorado are more driven by local needs, strong local leadership, and a shared desire to work together in ad hoc ways to advance immediate needs. This bottom-up approach is core to what makes Colorado uniquely strong. Using trusted partnerships we must identify the best means for formalizing partnerships through modifying and codifying new uses of resources and formalizing shared goals.
Resources and Incentives: Colorado is strong because of its locally-based infrastructure. We are successful when we embrace this reality and focus on bottom-up approaches that are supported by leadership at the highest levels of the state. This approach both requires and leads to the elements described above— a unified vision supported by data and implemented through strong partnerships. These three elements in turn enable resources and incentives to become tools to empower further action. With further progress on a unified vision, shared data and strong partnerships, Colorado will be positioned to reassess how funding streams and incentives can be realigned to improve the talent development system.
Action: The CWDC will host an economic vitality dialogue co-chaired by the Executive Directors of the above agencies to be held in the first quarter of 2015, to formalize shared goals and develop an action plan for Colorado’s Talent Pipeline.
Action: The results of this dialogue will be formalized and published by May 1, 2015.
Measures across Agency: Creating the Colorado Talent Development Dashboard
Colorado has excelled in many areas identified above, and yet as much as we have aligned across agencies and sectors, we are still working to weave these new groups into an efficient network of informed collaboration. We realize that we are missing a singular tool that measures effectiveness, eliminates inefficiencies, and assists us with guiding resources and incentives in our education and training systems.
A focus point to continue to align efforts is the work required to create a Talent Development Dashboard that accurately reflects progress made toward meeting the economy’s need for an appropriately skilled workforce, and the effectiveness of Colorado’s Talent Development System to ensure that Coloradans have the education and training needed to compete for today and tomorrow’s jobs.
The very act of creating this dashboard will assist us with identification of shared goals, unifying metrics, and tools for tracking progress on various fronts. Furthermore, the development of this dashboard will hold us all accountable to a strategic direction toward the creation of a unified talent development system that addresses the challenges identified in this report.
We will utilize resources such as SB14-205 (Colorado Talent Pipeline), HB14-1384 (the Colorado Opportunity Scholarship Initiative), and other related legislation and policy along with a recent award from the National Governors Association to create a Talent Development Dashboard and manage the processes required to develop it.
Action: Led by the CWDC, state agencies in partnership with local system operators will create this dashboard by the end of November 2015.
RECOMMENDATIONS
In preparing this report the agencies identified areas in which they jointly recommend further exploration. The CWDC will con-tinue to coordinate the collaboration between CDE, CDHE, CDLE, and OEDIT, as well as other agencies and system partners, to ensure that these recommendations are addressed over the next several years as resources are available. Much of this work has started and agencies will continue to work toward the recommendations outlined below. Our hope is that future resources can be targeted toward these priority areas of expanding our understanding of the needs of employers, students, and job seekers and the state and system partners’ ability to meet them.
• As identified in this report, multiple transition points in the talent pipeline lack continuity of data that will allow tracking and reporting on the current and future state of Colorado’s Talent Pipeline (such as the ability to identify how many students directly enter the workforce following high school). Develop policies and mechanisms to collect and use data in a way that provides critical information needed for better decision making while committing to the strongest possible standards of data privacy and protection of personal information.
• The skills outlined by industry, workforce, education, higher education, and economic development are similar. An alignment of skills terms and definitions would more clearly communicate the intersections and expectations for successful employment in Colorado.
• Continue to utilize the career pathways model to align education, training and work based learning so students and potential employees have a clear picture of what education and experience is necessary and the steps to pursue a specific career for top jobs.
• Create a collaborative structure to support and incentivize career exposure and work based learning, such as job shadowing, internships, on-the-job training and apprenticeship, throughout the talent development system, simplifying access for individuals and employers.
• Work with industry to create marketing and outreach campaigns so Coloradans have a better understanding and appreciation of good careers and the multiple pathways into them.
• Develop policies that support expansion of services to underserved populations to ensure access to career pathways to employment (e.g., underserved minorities, veterans, youth, long-term unemployed, ex-offenders), including education, training, work exposure and experience, as well as wraparound services need for success.
• Lastly, we recommend the alignment work between state agencies that occurred in the preparation and development of this report continue so as to best coordinate state efforts and our talent pipeline. Through this collaboration agencies will jointly prioritize the work, addressing issues over time, with current and new resources.

A – 2A – 1
APPENDIX A: COMPLETE LIST OF TOP JOBS
This list was created using Colorado LMI ten year (2013 to 2023) projections for the state. Occupations made this list by having a median wage at or above a sustainable living wage ($17.88 an hour) for a family of three in Colorado (pulled from livingwage.mit.edu), above average projected growth for all occupations (at the time of this report, 23.74 percent), and at or above 40 annual average openings.
Occupation Code OccupationMedian Annual
Wage
Total Percent
Change
Total Annual
Average Openings
Entry Education
LevelAdditional Training Level
11-1021
General and Operations
Managers $100,444 26.79 1,906 Bachelor's degree None
11-2021
Marketing
Managers $128,515 25.96 123 Bachelor's degree None
11-3021
Computer and Informa-
tion Systems Managers $132,917 28.13 267 Bachelor's degree None
11-3031 Financial Managers $127,375 28.20 270 Bachelor's degree None
11-3121
Human Resources
Managers $117,739 35.06 89 Bachelor's degree None
11-9021 Construction Managers $85,377 27.26 413 Bachelor's degree
Moderate-term
on-the-job training
11-9031
Education Adminis-
trators, Preschool and
Childcare Center/Pro-
gram $44,133 29.64 42 Bachelor's degree None
11-9033
Education Administra-
tors, Postsecondary $78,874 24.21 122 Master's degree None
11-9111
Medical and Health
Services Managers $98,109 31.84 219 Bachelor's degree None
11-9141
Property, Real Estate,
and Community Associa-
tion Managers $67,334 30.07 177
High school diploma
or equivalent None
11-9151
Social and Community
Service Managers $65,387 25.18 71 Bachelor's degree None
13-1022
Wholesale and Retail
Buyers, Except Farm
Products $44,321 24.36 93
High school diploma
or equivalent
Long-term
on-the-job training
13-1051 Cost Estimators $58,343 42.61 403 Bachelor's degree None
13-1081 Logisticians $71,851 46.83 158 Bachelor's degree None
13-1111 Management Analysts $75,025 36.31 575 Bachelor's degree None
13-1121
Meeting, Convention,
and Event Planners $41,492 39.36 167 Bachelor's degree None
13-1151
Training and Develop-
ment Specialists $59,984 29.36 243 Bachelor's degree None
13-2011
Accountants and
Auditors $65,393 30.04 2,116 Bachelor's degree None
13-2041 Credit Analysts $59,466 32.92 74 Bachelor's degree None
13-2051 Financial Analysts $73,125 30.69 233 Bachelor's degree None
13-2052
Personal Financial
Advisors $70,637 27.74 159 Bachelor's degree None
Occupation Code OccupationMedian Annual
Wage
Total Percent
Change
Total Annual
Average Openings
Entry Education
LevelAdditional Training Level
13-2082 Tax Preparers $44,913 24.59 93
High school diploma
or equivalent
Moderate-term
on-the-job training
15-1121
Computer Systems
Analysts $84,779 39.31 623 Bachelor's degree None
15-1122
Information Security
Analysts $83,140 59.29 116 Bachelor's degree None
15-1132
Software Developers,
Applications $92,975 36.61 1,118 Bachelor's degree None
15-1133
Software Developers,
Systems Software $100,404 40.93 611 Bachelor's degree None
15-1134 Web Developers $64,572 37.32 195 Associate's degree None
15-1141 Database Administrators $93,541 29.18 123 Bachelor's degree None
15-1142
Network and Computer
Systems Administrators $77,122 25.51 435 Bachelor's degree None
15-1143
Computer Network
Architects $98,215 24.79 157 Bachelor's degree None
15-1151
Computer User Support
Specialists $50,782 33.79 636
Some college, no
degree
Moderate-term
on-the-job training
15-2031
Operations Research
Analysts $85,644 42.89 52 Bachelor's degree None
17-1011
Architects, Except Land-
scape and Naval $70,192 32.78 183 Bachelor's degree Internship/residency
17-1012 Landscape Architects $69,456 26.19 47 Bachelor's degree Internship/residency
17-1022 Surveyors $58,866 25.72 52 Bachelor's degree None
17-2051 Civil Engineers $79,854 32.56 386 Bachelor's degree None
17-2061
Computer Hardware
Engineers $101,896 28.68 203 Bachelor's degree None
17-2071 Electrical Engineers $87,000 26.85 183 Bachelor's degree None
17-2081 Environmental Engineers $81,100 40.95 172 Bachelor's degree None
17-2171 Petroleum Engineers $130,961 73.49 172 Bachelor's degree None
17-3012
Electrical and Electronics
Drafters $59,951 35.70 40 Associate's degree None
17-3031
Surveying and Mapping
Technicians $48,888 28.90 78
High school diploma
or equivalent
Moderate-term
on-the-job training
19-2021
Atmospheric and Space
Scientists $92,484 31.55 103 Bachelor's degree None
19-2041
Environmental Scientists
and Specialists, Including
Health $73,586 29.22 183 Bachelor's degree None
19-2042
Geoscientists, Except
Hydrologists and Geog-
raphers $100,296 43.65 191 Bachelor's degree None
19-4031 Chemical Technicians $43,559 33.02 43 Associate's degree
Moderate-term
on-the-job training
19-4041
Geological and Petro-
leum Technicians $56,455 52.49 54 Associate's degree
Moderate-term
on-the-job training
19-4091
Environmental Science
and Protection Techni-
cians, Including Health $45,191 39.42 88 Associate's degree None

A – 4A – 3
Occupation Code OccupationMedian Annual
Wage
Total Percent
Change
Total Annual
Average Openings
Entry Education
LevelAdditional Training Level
21-1011
Substance Abuse and
Behavioral Disorder
Counselors $39,094 32.95 85
High school diploma
or equivalent
Moderate-term
on-the-job training
21-1014 Mental Health Counselors $40,048 32.17 209 Master's degree Internship/residency
21-1021
Child, Family, and School
Social Workers $42,026 24.72 268 Bachelor's degree None
21-1022 Healthcare Social Workers $50,401 33.73 119 Master's degree None
21-1023
Mental Health and
Substance Abuse Social
Workers $39,620 28.36 95 Bachelor's degree None
21-1091 Health Educators $52,694 29.67 43 Bachelor's degree None
23-1011 Lawyers $115,367 24.61 649
Doctoral or profes-
sional degree None
23-2011
Paralegals and Legal
Assistants $50,513 32.85 269 Associate's degree None
25-1071
Health Specialties Teach-
ers, Postsecondary $107,224 47.36 253
Doctoral or profes-
sional degree None
25-1072
Nursing Instructors and
Teachers, Postsecondary $59,817 46.68 53
Doctoral or profes-
sional degree None
25-1121
Art, Drama, and Music
Teachers, Postsecondary $51,939 25.05 81
Doctoral or profes-
sional degree None
27-1025 Interior Designers $44,127 30.19 85 Bachelor's degree None
27-3042 Technical Writers $65,659 28.46 88 Bachelor's degree
Short-term
on-the-job training
27-3091
Interpreters and Trans-
lators $47,642 69.75 122 Bachelor's degree
Short-term
on-the-job training
27-4011
Audio and Video Equip-
ment Technicians $47,188 26.77 57
Postsecondary
non-degree award
Short-term
on-the-job training
29-1031
Dietitians and Nutri-
tionists $54,622 30.40 47 Bachelor's degree Internship/residency
29-1051 Pharmacists $119,883 27.52 226
Doctoral or profes-
sional degree None
29-1067 Surgeons $187,369 24.12 53
Doctoral or profes-
sional degree Internship/residency
29-1071 Physician Assistants $89,379 42.09 126 Master's degree None
29-1122 Occupational Therapists $76,746 33.64 129 Master's degree None
29-1123 Physical Therapists $72,824 40.19 313
Doctoral or profes-
sional degree None
29-1126 Respiratory Therapists $57,112 32.08 77 Associate's degree None
29-1129 Therapists, All Other $58,984 29.35 54 Bachelor's degree None
29-1131 Veterinarians $78,124 26.06 127
Doctoral or profes-
sional degree None
29-1141 Registered Nurses $68,083 30.79 2,172 Associate's degree None
29-1171 Nurse Practitioners $95,250 37.75 124 Master's degree None
29-2021 Dental Hygienists $80,793 29.74 224 Associate's degree None
29-2032
Diagnostic Medical
Sonographers $75,912 56.39 58 Associate's degree None
29-2034
Radiologic Technologists
and Technicians $57,932 29.92 137 Associate's degree None
Occupation Code OccupationMedian Annual
Wage
Total Percent
Change
Total Annual
Average Openings
Entry Education
LevelAdditional Training Level
29-2055 Surgical Technologists $49,551 39.85 85
Postsecondary
non-degree award None
29-2061
Licensed Practical and
Licensed Vocational
Nurses $44,996 28.58 310
Postsecondary
non-degree award None
29-2071
Medical Records and
Health Information
Technicians $42,269 30.52 138
Postsecondary
non-degree award None
29-2099
Health Technologists and
Technicians, All Other $37,305 32.92 98
High school diploma
or equivalent None
29-9011
Occupational Health and
Safety Specialists $73,914 26.64 71 Bachelor's degree
Short-term
on-the-job training
31-2021
Physical Therapist
Assistants $48,157 41.44 54 Associate's degree None
37-1012
First-Line Supervisors of
Landscaping, Lawn Ser-
vice, and Groundskeep-
ing Workers $46,593 24.70 152
High school diploma
or equivalent None
41-3099
Sales Representatives,
Services, All Other $50,658 27.71 1,053
High school diploma
or equivalent
Short-term
on-the-job training
41-9021 Real Estate Brokers $43,942 25.58 111
High school diploma
or equivalent None
43-3051
Payroll and Timekeeping
Clerks $42,135 28.79 124
High school diploma
or equivalent
Moderate-term
on-the-job training
43-5032
Dispatchers, Except Po-
lice, Fire, and Ambulance $40,384 26.14 156
High school diploma
or equivalent
Moderate-term
on-the-job training
47-1011
First-Line Supervisors of
Construction Trades and
Extraction Work $63,568 40.99 671
High school diploma
or equivalent None
47-2021
Brickmasons and Block-
masons $44,454 60.85 86
High school diploma
or equivalent Apprenticeship
47-2031 Carpenters $39,094 36.40 862
High school diploma
or equivalent Apprenticeship
47-2044 Tile and Marble Setters $37,361 32.21 40 Less than high school
Long-term
on-the-job training
47-2071
Paving, Surfacing, and
Tamping Equipment
Operators $38,490 37.70 83
High school diploma
or equivalent
Moderate-term
on-the-job training
47-2073
Operating Engineers
and Other Construction
Equipment Operators $42,349 37.72 483
High school diploma
or equivalent
Moderate-term
on-the-job training
47-2111 Electricians $48,043 42.30 909
High school diploma
or equivalent Apprenticeship
47-2121 Glaziers $42,952 38.16 83
High school diploma
or equivalent Apprenticeship
47-2152
Plumbers, Pipefitters,
and Steamfitters $48,049 42.38 483 Less than high school
Moderate-term
on-the-job training
47-2181 Roofers $37,405 29.40 185 Less than high school
Moderate-term
on-the-job training

B – 1A – 5
APPENDIX B: O*NET SKILLS SCORES BY KEY INDUSTRY NETWORKOccupation Code Occupation
Median Annual
Wage
Total Percent
Change
Total Annual
Average Openings
Entry Education
LevelAdditional Training Level
47-2211 Sheet Metal Workers $43,316 36.48 143
High school diploma
or equivalent Apprenticeship
47-2221
Structural Iron and Steel
Workers $39,674 40.09 63
High school diploma
or equivalent Apprenticeship
47-4099
Construction and Related
Workers, All Other $37,276 37.38 48
High school diploma
or equivalent
Moderate-term
on-the-job training
47-5011
Derrick Operators, Oil
and Gas $49,693 52.18 66 Less than high school
Short-term
on-the-job training
47-5012
Rotary Drill Operators,
Oil and Gas $55,577 52.04 84 Less than high school
Moderate-term
on-the-job training
47-5013
Service Unit Operators,
Oil, Gas, and Mining $43,450 56.56 353 Less than high school
Moderate-term
on-the-job training
47-5071 Roustabouts, Oil and Gas $37,075 52.95 252 Less than high school
Moderate-term
on-the-job training
49-3042
Mobile Heavy Equipment
Mechanics, Except
Engines $47,841 25.27 148
High school diploma
or equivalent
Long-term
on-the-job training
49-9021
Heating, Air Condition-
ing, and Refrigeration
Mechanics and Installers $46,158 39.49 261
Postsecondary
non-degree award-7
Long-term
on-the-job training
49-9041
Industrial Machinery
Mechanics $50,591 38.48 366
High school diploma
or equivalent
Long-term
on-the-job training
49-9062
Medical Equipment
Repairers $43,592 38.86 87 Associate's degree
Moderate-term
on-the-job training
51-4011
Computer-Controlled
Machine Tool Operators,
Metal and Plastic $40,211 27.28 59
High school diploma
or equivalent
Moderate-term
on-the-job training
51-9012
Separating, Filtering,
Clarifying, Precipitating,
and Still Machine Setters,
Operators, and Tenders $51,822 28.97 57
High school diploma
or equivalent
Moderate-term
on-the-job training
53-2011
Airline Pilots, Copilots,
and Flight Engineers $106,168 37.45 182 Bachelor's degree
Moderate-term
on-the-job training
53-2031 Flight Attendants $38,643 38.55 134
High school diploma
or equivalent
Moderate-term
on-the-job training
53-3032
Heavy and Tractor-Trailer
Truck Drivers $42,078 32.27 1,202
Postsecondary
non-degree award
Short-term
on-the-job training
53-7021
Crane and Tower
Operators $55,283 52.53 50
High school diploma
or equivalent
Moderate-term
on-the-job training
53-7073 Wellhead Pumpers $53,161 60.83 77 Less than high school
Moderate-term
on-the-job training
Advanced Manufacturing1. Critical thinking 61.32. Reading comprehension 60.33. Active listening 59.94. Speaking 58.05. Monitoring* 57.86. Complex problem solving* 55.37. Judgment and decision making 54.98. Time management 52.39. Coordination 52.110. Writing 50.0
Aerospace1. Critical thinking* 68.32. Reading comprehension* 67.33. Active listening* 65.64. Speaking 63.05. Complex problem solving* 62.76. Judgment and decision making* 60.77. Monitoring* 58.38. Writing* 57.99. Active learning* 54.910. Coordination* 54.9
Bioscience1. Reading comprehension* 65.82. Critical thinking* 65.33. Active listening 65.14. Speaking 62.05. Complex problem solving* 59.16. Judgment and decision making* 58.57. Monitoring 57.68. Writing* 57.39. Active learning* 54.110. Time management* 53.5
Creative Industries1. Active listening* 67.52. Reading comprehension* 65.53. Speaking* 64.44. Critical thinking* 64.05. Judgment and decision making* 58.26. Writing* 57.9
7. Complex problem solving* 57.88. Monitoring 56.69. Time management* 54.910. Coordination* 54.9
Defense & Homeland SecurityNo available data
Electronics1. Reading comprehension* 68.42. Critical thinking* 66.53. Active listening* 66.14. Speaking* 63.85. Complex problem solving* 61.36. Judgment and decision making* 60.17. Writing* 58.88. Monitoring 57.09. Time management* 54.710. Coordination* 54.6
Energy & Natural Resources1. Critical thinking 61.22. Active listening 59.33. Monitoring 57.64. Speaking 57.55. Reading comprehension 56.26. Judgment and decision making 55.77. Operation monitoring* 54.98. Complex problem solving 54.29. Coordination 53.310. Time management 53.0
Financial Services1. Active listening* 72.62. Speaking* 71.33. Reading comprehension* 68.64. Critical thinking* 67.65. Writing* 63.66. Judgment and decision making* 62.67. Complex problem solving* 59.28. Social perceptiveness* 59.09. Time management* 56.910. Active learning* 55.4
Our O*NET skill scores are based on the staffing pattern for each Key Industry Network (KIN). By KIN, we then isolated the skilled occupations that had the highest concentration of workers, a total number that comprised at least half of the workers in the KIN. Based on the skills scores for these select occupations, we then established one score for each skill in each KIN. Below are the top ten ranked scores for each key industry; scores that exceed the average score for all occupations is denoted with an asterisk.

C – 1B – 2
APPENDIX C: O*NET SKILLS DEFINITIONSAPPENDIX B: O*NET SKILLS SCORES BY KEY INDUSTRY NETWORK
Food & Agriculture1. Active listening 55.82. Critical thinking 55.63. Speaking 54.84. Operation monitoring* 53.95. Monitoring 53.66. Coordination 52.97. Operation and control* 51.48. Time management 50.19. Judgment and decision making 50.0
Health & Wellness1. Active listening* 74.02. Speaking* 72.13. Critical thinking* 68.34. Reading comprehension* 68.25. Social perceptiveness* 68.06. Service orientation* 65.67. Monitoring* 64.08. Judgment and decision making* 61.69. Writing* 61.410. Active learning* 59.1
Infrastructure Engineering1. Critical thinking* 64.42. Active listening 62.73. Reading comprehension* 62.04. Speaking 60.15. Judgment and decision making* 57.16. Complex problem solving* 57.17. Monitoring 56.68. Coordination* 55.19. Time management* 64.310. Active learning* 52.7
Technology & Information1. Critical thinking* 67.62. Reading comprehension* 66.73. Active listening 65.14. Speaking 61.75. Complex problem solving* 61.66. Judgment and decision making* 58.67. Writing* 56.78. Monitoring 56.29. Systems analysis* 55.510. Active learning* 54.6
Tourism & Outdoor Recreation1. Speaking* 69.62. Active listening* 67.93. Social perceptiveness* 63.24. Service orientation* 62.75. Coordination* 60.56. Critical thinking 60.37. Monitoring* 60.18. Reading comprehension 57.49. Judgment and decision making 56.710. Time management* 55.6
Transportation & Logistics1. Speaking 62.32. Active listening 62.13. Critical thinking 59.34. Reading comprehension 58.15. Monitoring 57.46. Coordination* 54.77. Social perceptiveness 54.58. Time management* 54.19. Judgment and decision making 53.510. Complex problem solving 52.6
Basic SkillsDeveloped capacities that facilitate learning or the more rapid acquisition of knowledge
□ Active Learning — Understanding the implications of new information for both current and future problem-solving and decision-making.
□ Active Listening — Giving full attention to what other people are saying, taking time to understand the points being made, asking questions as appropriate, and not interrupting at inappropriate times.
□ Critical Thinking — Using logic and reasoning to identify the strengths and weaknesses of alternative solutions, conclusions or approaches to problems.
□ Learning Strategies — Selecting and using training/instructional methods and procedures appropriate for the situation when learning or teaching new things.
□ Mathematics — Using mathematics to solve problems.
□ Monitoring — Monitoring/Assessing performance of yourself, other individuals, or organizations to make improvements or take corrective action.
□ Reading Comprehension — Understanding written sentences and paragraphs in work related documents.
□ Science — Using scientific rules and methods to solve problems.
□ Speaking — Talking to others to convey information effectively.
□ Writing — Communicating effectively in writing as appropriate for the needs of the audience.
Complex Problem Solving SkillsDeveloped capacities used to solve novel, ill-defined problems in complex, real-world settings
□ Complex Problem Solving — Identifying complex problems and reviewing related information to develop and evaluate options and implement solutions.
Resource Management SkillsDeveloped capacities used to allocate resources efficiently
□ Management of Financial Resources — Determining how money will be spent to get the work done, and accounting for these expenditures.
□ Management of Material Resources — Obtaining and seeing to the appropriate use of equipment, facilities, and materials needed to do certain work.
□ Management of Personnel Resources — Motivating, developing, and directing people as they work, identifying the best people for the job.
□ Time Management — Managing one's own time and the time of others.
Social SkillsDeveloped capacities used to work with people to achieve goals
□ Coordination — Adjusting actions in relation to others' actions.
□ Instructing — Teaching others how to do something.
□ Negotiation — Bringing others together and trying to reconcile differences.
□ Persuasion — Persuading others to change their minds or behavior.
□ Service Orientation — Actively looking for ways to help people.
□ Social Perceptiveness — Being aware of others' reactions and understanding why they react as they do.
For more information, visit: onetonline.org

C – 2
APPENDIX C: O*NET SKILLS DEFINITIONS
Systems SkillsDeveloped capacities used to understand, monitor, and improve socio-technical systems
□ Judgment and Decision Making — Considering the relative costs and benefits of potential actions to choose the most appropriate one.
□ Systems Analysis — Determining how a system should work and how changes in conditions, operations, and the environment will affect outcomes.
□ Systems Evaluation — Identifying measures or indicators of system performance and the actions needed to improve or correct performance, relative to the goals of the system.
Technical Skills
Developed capacities used to design, set-up, operate, and correct malfunctions involving application of machines or technological systems
□ Equipment Maintenance — Performing routine maintenance on equipment and determining when and what kind of maintenance is needed.
□ Equipment Selection — Determining the kind of tools and equipment needed to do a job.
□ Installation — Installing equipment, machines, wiring, or programs to meet specifications.
□ Operation and Control — Controlling operations of equipment or systems.
□ Operation Monitoring — Watching gauges, dials, or other indicators to make sure a machine is working properly.
□ Operations Analysis — Analyzing needs and product requirements to create a design.
□ Programming — Writing computer programs for various purposes.
□ Quality Control Analysis — Conducting tests and inspections of products, services, or processes to evaluate quality or performance.
□ Repairing — Repairing machines or systems using the needed tools.
□ Technology Design — Generating or adapting equipment and technology to serve user needs.
□ Troubleshooting — Determining causes of operating errors and deciding what to do about it.