the comparison of r&d investment policies between …
TRANSCRIPT

Süleyman Demirel Üniversitesi İktisadi ve İdari Bilimler Fakültesi Dergisi Y.2018, C.23, S.2, s.669-682.
Suleyman Demirel University The Journal of Faculty of Economics
and Administrative Sciences Y.2018, Vol.23, No.2, pp.669-682.
669
THE COMPARISON OF R&D INVESTMENT POLICIES BETWEEN
TURKEY AND OECD MEDITERRANEAN COUNTRIES
TÜRKİYE VE OECD AKDENİZ ÜLKELERİNİN R&D YATIRIM
POLİTİKALARININ KARŞILAŞTIRMASI
Dr. Orkun YILDIZ*
* Gazi University, The Faculty of Business Administration, Business Department, [email protected],
https://orcid.org/0000-0002-6773-5859
ABSTRACT
Countries have different categories depending on their economic development. It is essential to use
important indicators to classify countries as developed, developing and under developed, and prepare
reports on these countries’ economy. In this vein, research and development (R&D) is a significant
indicator. This study aims to explore Turkey’s deficiencies in R&D investment policy. A further step is to
clarify constructive similarities and differences regarding R&D investment policy between Turkey and
OECD Mediterranean countries. Hence, the paper covers constructive comparisons about four categories
that are gross domestic expenditure on R&D, governments funding on R&D, foreign investors funding on
R&D, and private sector funding on R&D. The study utilizes the data set drawn from OECD science,
technology and innovation outlook 2016 covering the period 2006-2014. Therefore, while Turkey
maintains a good position in gross domestic expenditure and government direct funds on R&D among
OECD Mediterranean countries, it does not have adequate financing level of business enterprise
expenditure, and foreign investment on R&D. The study has implications for Turkey’s investment policy
in R&D, OECD Mediterranean countries’ investment policy in R&D, and the development of new
strategies to overcome deficiencies in Turkey’s R&D policy compared to other OECD Mediterranean
countries. This paper helps understand the differences in R&D investment management between Turkey
and OECD Mediterranean countries.
Keywords: Investment Policies on R&D, Turkey, Mediterranean Countries in OECD
Jel Codes: M15, M21.
ÖZ
Ülkeler ekonomik gelişmişlik düzeylerine göre farklı kategorilere sahiptirler. Ülkelerin gelişmiş,
gelişmekte olan ve az gelişmiş olarak sınıflandırılmasında ve bu ülkelerin ekonomik düzeyleri üzerine
raporların hazırlanmasında önemli göstergelerin kullanılması gerekmektedir. Bu sebepten, araştırma ve
geliştirme (R&D) önemli bir göstergedir. Bu çalışmanın amacı Türkiye’nin R&D yatırım politikalarındaki
eksiklerin keşfedilmesidir. Ayrıca, Türkiye ve OECD Akdeniz ülkeleri arasındaki R&D yatırım
politikasına ilişkin yapısal benzerlik ve farklılıkları belirlemektir. Böylece, bu çalışma R&D’ye yönelik
gayri safi yurtiçi harcama, hükümetlerin fonlaması, yabancı yatırımcıların yatırımları ve özel sektörün
fonlamalarını içeren dört farklı kategoride yapısal karşılaştırmaları içermektedir. Bu çalışmada, 2006-
2014 periyodunu kapsayan OECD bilim, teknoloji ve yenilik görünümü 2016 veri seti kullanılmıştır. Buna
göre, Türkiye OECD Akdeniz ülkeleri arasında R&D’ye yönelik gayri safi yurt içi harcama ve hükümetin
direk fonlaması bakımından iyi bir pozisyona sahipken, özel sektör ve yabancı yatırımcıların R&D
yatırımları bakımından yeterli düzeyde finansal seviyeye sahip değildir. Bu çalışma Türkiye’nin ve OECD
Akdeniz ülkelerinin R&D’ye yönelik yatırım politikalarının etkileri içermektedir. Ayrıca, Türkiye’nin
diğer OECD Akdeniz ülkeleri ile karşılaştırıldığında R&D politikalarına yönelik tespit edilen eksiklerinin
giderilmesi için yeni stratejilerin geliştirilmesine de etki edecektir. Bu çalışma, Türkiye ile OECD Akdeniz
ülkeleri arasındaki R&D yatırım yönetimi farklılıklarının anlaşılmasına yardımcı olmaktadır.
Anahtar Kelimeler: R&D’ye Yönelik Yatırım Politikaları, Türkiye, OECD Üyesi Akdeniz Ülkeleri
Jel Kodları: M15, M21

YILDIZ
670
2018
INTRODUCTION
Research and Development (R&D) policy is
one of the most important aspects of the
innovation and technology management
literature. There are many studies with
different perspectives and focusing on
research topics of R&D in the literature.
Among these topics are R&D investment
and cross boarding, cross-border merger and
acquisitions, R&D spill over productivity,
location matters, economic growth, and
R&D public expenditures. Studies
conducted on these topics provide different
perspective on R&D.
R&D investment and cross boarding have
been dealt with in a number of studies
(Abdulrab, 2011; Blomstrom, 1991; Carlin
& Mayer, 2003; Coccia, 2009; Goel & Ram,
2001; Meliciani, 2000; Romain &
Pottelsberghe de la Potterie, 2003; Wang,
2010). Most of these studies used data sets
drawn from the OECD countries. While
some researchers supported the idea that
investment impacts economic growth and
R&D activities (Blomstrom, 1991; Carlin &
Mayer, 2003; Meliciani, 2000; Wang, 2010),
others claimed that states’ economic
intervention do not impact R&D activities
(Coccia, 2009; Romain & Pottelsberghe de
la Potterie, 2003). Wang (2010) suggested
that R&D investments at national level
influence the roles of patent rights
protectioned international technology
transfer. In the OECD countries where R&D
activities are widespread, the positive
impacts of these R&D activities on tertiary
education and scientific research can be
observed. On the other hand, while foreign
technology inflow affects negatively
domestic R&D development, patent rights
protection and the income growth rate
impacts positively on R&D investments. For
instance, Meliciani (2000) examined
whether research and investment activities
influence patent production across countries
or not. According to the results of this study,
there were two important findings
suggesting that research expenditure has
much more impact on generating patents in
the science-based industries, and investors
prefer to make investment in supplier
dominated and production intensive
industries. Furthermore, Carlin and Mayer
(2003) found strong relationship between
countries’ financial systems structure,
industry characteristics and industrial
investment growth. Also, Blomstrom (1991)
provided information about the countries,
which have the host country concept and the
impact of this concept on spill over benefits
and their various forms and discussed the
effects of country policy on technology
import and diffusion in the host economies.
Cross – border merger and acquisition on
R&D is another interesting research topic in
the R&D literature. Many researchers
provided different perspectives on this topic
(Bertrand & Zuniga, 2006; Falk, 2006;
Reddy, 1997). Bertrand and Zuniga (2006)
concluded that merger and acquisition waves
do not have any significant impact on the
R&D activities, and they just contributed to
increasing R&D investments in some
specific sectors. On the other hand, they
suggested that merger and acquisitions’
effect on R&D investment is not the same
for domestic and cross countries’ activities.
In other words, domestic merger and
acquisition activities diminish international
collaborations and investments on R&D
activities among corporations in medium
technology intensive industries. The reason
is that these local corporations fear about
foreign takeovers and their negative impact
on their local R&D activities. Falk (2006)
dealt with this subject in his study on tax
incentives. According to Falk, tax incentives
that the government provide may have a
positive impact on businesses’ R&D
spending regardless sector. In addition,
universities’ investments on the
development of infrastructures for R&D
activities may have a significant effect on the
expenditures of business enterprise sector on
R&D activities. Moreover, the direct R&D
subsidies and high tech export share that the
governments provide may have a positive
relation with business sector R&D activities,
but their effects seem to be fleeting in the
short run.
Another interesting issue in the literature is
R&D spill over productivity. There are many

The Comparison of R&D Investment Policies Between Turkey and OECD Mediterranean Countries
671
C.23, S.2
studies on this topic (Abdulrab, 2011;
Bertrand & Zuniga, 2006; Coe & Helpman,
1995; Engelbrecht, 1997; Fracasso &
Marzetti, 2015; Hejazi & Safarian, 1999;
Kinoshita, 2000; Le Bas & Sierra, 2002; Lin
& Kwan, 2016; Park, 1995). A general trend
in these studies is that R&D spill over
influence the growth of domestic research
activities, foreign productivity, foreign trade
and channel and international transmission.
Coe and Helpman (1995), Kinoshita, (2000),
Le Bas and Sierra (2002) and Park (1995)
provided information about the R&D
spillovers’ positive effects on domestic and
international private research and
productivity. On the other hand, Fracasso
and Marzetti (2015) and Lin and Kwan
(2016) suggested that R&D spillovers have
positive impact on international knowledge
transmission. Therefore, local firms may
have skills to help them to compete with
their rivals in international markets.
Furthermore, Hejazi and Safarian (1999)
concluded that trade and foreign direct
investment increasingly affect R&D
channels. According to the results of the
study, both foreign direct investment and
trade are effective factors increasing R&D
channels, but foreign direct investment has a
higher power than trade to for affecting the
development of R&D channel.
The location matter is also an interesting
research topic. Numerous researchers have
taken on this topic in their studies
(Blomstrom, 1991; Le Bas & Sierra, 2002;
Porter & Stern, 2001). Overall, these studies
suggested that the location play an
increasingly significant role in creating and
commercialization thanks to globalization
day by day. Only focusing on internal factors
would not produce fruitful results for firms
to finish their R&D activities successfully.
Instead, firms should host their R&D
activities in the right location by considering
external factors. These external factors are
strong university-industry relations , large
pools of trained scientists and engineers,
various specific clusters for innovation
environment, beneficial public policies for
innovation activities and protection of
intellectual property, tax-based incentives
for innovation, innovation-based
competition, and openness of economy to
trade and investment (Porter & Stern, 2001).
In addition, the location in knowledge
transmission and R&D spillover are crucial
issues for investors while making decisions
on R&D investments (Le Bas & Sierra,
2002). Furthermore, investors may have
evaluation criteria on host country
depending on affiliates’ technology imports
and the diffusion of their technology
(Blomstrom, 1991). The host country should
be evaluated according to foreign investment
and spillovers such as size of spillover, intra
and inter industry spillovers.
Finally, economic growth is a popular topic
in the literature. There are many studies
conducted t on this topic (Bassanini,
Scarpetta, & Visco, 2000; Temple, 2002;
Wang, 2007). Bassanini et al. (2000)
provided information about the
developments in labour productivity
relations with human capital accumulation,
multifactor productivity, and changes in the
composition fixed capital. According to their
results, there is a strong relationship between
improvements in multifactor productivity
and accumulation knowledge and some
tentative policy considerations. Moreover,
Temple (2002) concluded that education has
benefits for social capital.
Inshort, R&D is a topic that offers various
perspectives to researchers. These are cross-
border investment, cross-border merger and
acquisition, R&D spillover productivity,
location matters, and economic growth. This
study aims to provide comparisons regarding
R&D investment policies between OECD
Mediterranean countries and Turkey in the
period of 2006 -2014.To this aim, various
investment and expenditure data obtained
from OECD 2014 outlook dataset were
used.. Therefore, this study may contribute
to forming a better understanding of
Turkey’s position in R&D investment policy
among OECD Mediterranean countries.
Moreover, it provides information about the
deficiencies in Turkey’s R&D policy when
compared to OECD Mediterranean
countries.

YILDIZ
672
2018
1. GROSS DOMESTIC EXPENDITURE
ON R&D
Gross domestic expenditure is an important
factor in order to understand countries’ R&D
policy. Direct and indirect funding tools are
the general classifications in gross domestic
expenditure on R&D. Direct funding tools
consist of competitive grants, repayable
advances, debt finance, and equity finance.
There are various kinds of the direct funding
tool. More funding tool means that countries
support R&D activities and these support
tools are significant indicators of the
development level of countries. In other
words, if one country provides various
support for R&D activities, this country may
be viewed as a good destination for start-up
firms, innovative entrepreneurs to make
investment. Table 1 shows the amounts of
gross domestic expenditure in OECD
Mediterranean countries in the period from
2006 to 2014.
Table 1. Gross Domestic Expenditure on R&D in OECD Mediterranean Countries
(Million constant USD PPPs)
France Greece Israel Italy Slovenia Spain Turkey
2006 $47.029 $1.942 $8.928 $25.150 $991 $20.326 $8.456
2007 $47.545 $2.061 $8.613 $24.947 $1.021 $20.110 $9.412
2008 $48.524 $2.358 $8.663 $25.406 $1.170 $20.087 $10.079
2009 $50.565 $2.133 $9.279 $25.276 $1.388 $19.525 $11.213
2010 $50.765 $1.929 $9.834 $25.802 $1.434 $18.421 $12.224
2011 $52.191 $1.968 $10.224 $26.091 $1.421 $17.835 $13.040
2012 $52.203 $1.899 $10.701 $26.826 $1.343 $17.608 $14.427
2013 $53.894 $2.135 $11.164 $27.055 $1.274 $17.980 $15.673
2014 $54.297 $2.218 $11.558 $26.188 $1.198 $18.049 $16.673
(Source: OECD, 2017c)
France, Italy, Spain, Turkey have more
amounts of expenditure than other countries,
respectively. As a general trend, the amount
of expenditure on R&D increased steadily
for all countries in 2008. This increasing
amount of expenditure on R&D continued in
countries except for Greece and Spain. The
amount of R&D expenditure decreased
slightly, and there were a steady fluctuation
in expenditures of Greece and Spain. In
2008, the amount of expenditures was $2
billion 258 million in Greece, and nearly $20
million 87 thousand in Spain, while it was
only around 2 billion 133 million for Greece,
and nearly 18 billion for Spain. Namely, the
amount of R&D expenditures were nearly at
the same level after six years period in both
Greece and Spain. On the other hand, there
was a gradual growth in the amount of gross
domestic expenditure on R&D in France,
Israel, Italy, and Turkey in the period
between 2006 and 2014. France had the
highest amount of gross domestic
expenditure on R&D among these countries
during this period. In 2006, the amount of
expenditure on R&D was nearly $ 47
million, while the expenditure peaked
around $54 million in 2014. Finally, the
R&D expenditure amount steadily grew in
Turkey during 8 years. In 2006, Turkey had
the lowest level of expenditure on R&D with
nearly $ 8.5 billion, while the expenditure on
R&D amount was at the highest level with
nearly $ 16.5 billion in 2016. In the first
year, the amount of expenditure in Turkey
was less than Israel, and Turkey ranked the
fourth among OECD Mediterranean
countries. However, the rank of Turkey
raised one row by leaving Israel behind by
being the third country in 2007 with $ 9
billion 412 million. Turkey maintained this
ranking after years with the difference
between Italy and Spain getting smaller.
Chart 1 provides information about the
comparison between Turkey’s expenditure

The Comparison of R&D Investment Policies Between Turkey and OECD Mediterranean Countries
673
C.23, S.2
on R&D policy and other OECD countries’
average of expenditure on R&D policy. This
chart may help to understand Turkey’s
expenditure policy by years.
Chart 1. The Comparison between Turkey and Other OECD Mediterranean
Countries regarding Gross Domestic Expenditure on R&D
The chart covers the average variations
between Turkey’s expenditure amount on
R&D and OECD Mediterranean countries’
average amount on R&D in the period from
2006 to 2014.
As a general trend, Turkey’s expenditure
amount on R&D steadily increased between
2006 and 2014. In 2006, the amount of
expenditure was the lowest with nearly 8
billion dollars, and it was almost half of
OECD Mediterranean countries’ the amount
of average expenditure on R&D. On the
other hand, the amount of expenditure rose
gradually in 2007 with nearly 9.5 billion
dollars, and Turkey’s expenditure amount on
R&D peaked in 2014 with nearly 18 billion
dollars. This was the closest amount to the
average in 2014.
The red colour bar indicates the average
expenditure of OECD Mediterranean
countries on R&D. Overall, there was
gradually growth between 2006 and 2014. In
2006, the total amount was nearly 16 billion
dollars and the amount of average
expenditure on R&D rose slightly to 16
billion 264 million dollars in 2007. The
average expenditure amount peaked in 2014
with nearly 18 billion 500 million dollars.
In general, there was a gradual growth in
average expenditures of both Turkey and
OECD Mediterranean countries during eight
years. In earlier periods, the amount of
expenditures on R&D was at a low level and
was not sufficient when compared to other
Mediterranean countries. However, the
variation trend in the amount of gross
domestic expenditure on R&D steadily
changed in Turkey. The amount of
expenditure nearly doubled from 2006 to
2014. On the other hand, Turkey still lagged
behind Italy and Spain for dividing share of
gross domestic expenditure on R&D.
YILDIZ
674
2018
2. Governments’ Direct Funding for R&D
According to OECD countries self-
assessment index (2014), Turkish
government provides many different
supporting tools to fund R&D business
works. On one of these supporting tools is
direct funding tools. These are competitive
grants, repayable advances, and debt
finance. Furthermore, these funding tools
offer more amount than OECD countries’
mean. In addition, equity finance and
technology consult supports have as much
amount as OECD countries’ mean.
Therefore, it can said that Turkish
government has various direct supporting
tools to help develop R&D practices and
innovative entrepreneurs.
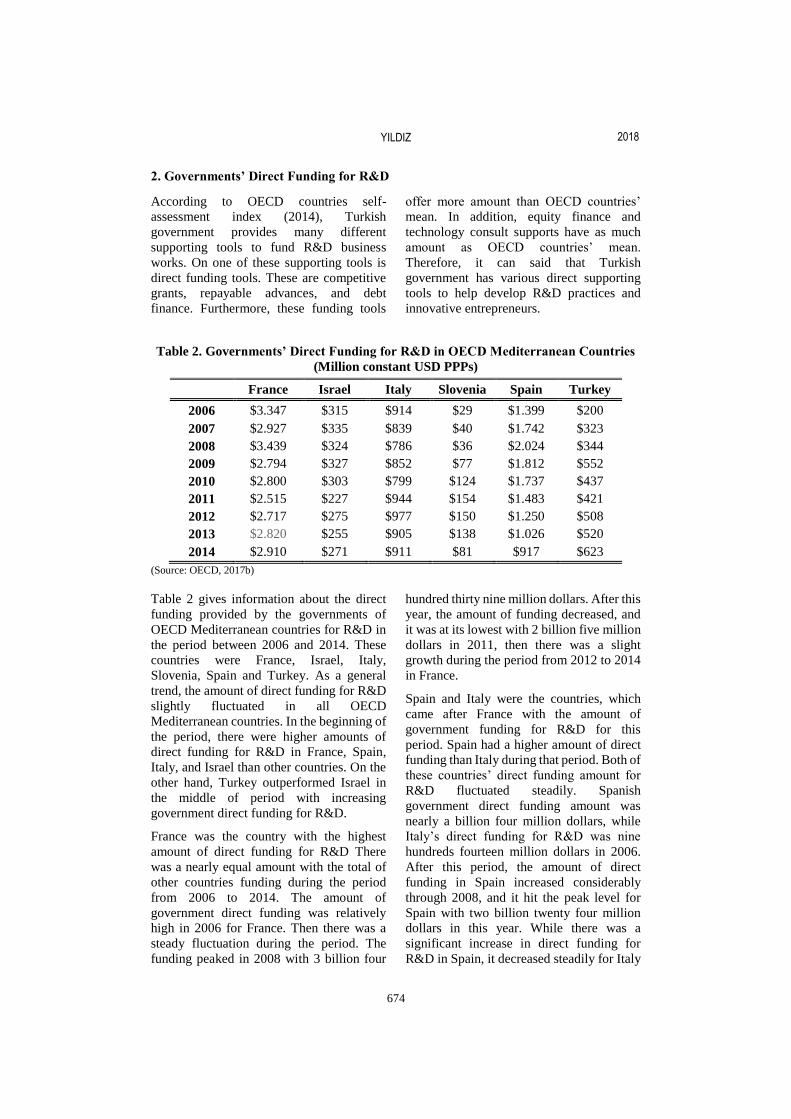
Table 2. Governments’ Direct Funding for R&D in OECD Mediterranean Countries
(Million constant USD PPPs)
France Israel Italy Slovenia Spain Turkey
2006 $3.347 $315 $914 $29 $1.399 $200
2007 $2.927 $335 $839 $40 $1.742 $323
2008 $3.439 $324 $786 $36 $2.024 $344
2009 $2.794 $327 $852 $77 $1.812 $552
2010 $2.800 $303 $799 $124 $1.737 $437
2011 $2.515 $227 $944 $154 $1.483 $421
2012 $2.717 $275 $977 $150 $1.250 $508
2013 $2.820 $255 $905 $138 $1.026 $520
2014 $2.910 $271 $911 $81 $917 $623
(Source: OECD, 2017b)
Table 2 gives information about the direct
funding provided by the governments of
OECD Mediterranean countries for R&D in
the period between 2006 and 2014. These
countries were France, Israel, Italy,
Slovenia, Spain and Turkey. As a general
trend, the amount of direct funding for R&D
slightly fluctuated in all OECD
Mediterranean countries. In the beginning of
the period, there were higher amounts of
direct funding for R&D in France, Spain,
Italy, and Israel than other countries. On the
other hand, Turkey outperformed Israel in
the middle of period with increasing
government direct funding for R&D.
France was the country with the highest
amount of direct funding for R&D There
was a nearly equal amount with the total of
other countries funding during the period
from 2006 to 2014. The amount of
government direct funding was relatively
high in 2006 for France. Then there was a
steady fluctuation during the period. The
funding peaked in 2008 with 3 billion four
hundred thirty nine million dollars. After this
year, the amount of funding decreased, and
it was at its lowest with 2 billion five million
dollars in 2011, then there was a slight
growth during the period from 2012 to 2014
in France.
Spain and Italy were the countries, which
came after France with the amount of
government funding for R&D for this
period. Spain had a higher amount of direct
funding than Italy during that period. Both of
these countries’ direct funding amount for
R&D fluctuated steadily. Spanish
government direct funding amount was
nearly a billion four million dollars, while
Italy’s direct funding for R&D was nine
hundreds fourteen million dollars in 2006.
After this period, the amount of direct
funding in Spain increased considerably
through 2008, and it hit the peak level for
Spain with two billion twenty four million
dollars in this year. While there was a
significant increase in direct funding for
R&D in Spain, it decreased steadily for Italy
The Comparison of R&D Investment Policies Between Turkey and OECD Mediterranean Countries
675
C.23, S.2
in the same period. However, there was a
gradually decrease in direct funding in Spain
through 2013 with a billion twenty six
thousand dollars, and the amount of direct
funding was at the lowest level with nine
hundred seventeen dollars in 2014. On the
other hand, there was a steady fluctuation in
Italy through 2013, and the amount of
government’s direct funding was nine
hundred eleven million dollars, and this
amount was similar to that of Spain.
Government direct funding amount for R&D
in Turkey gradually increased during the
period. In 2006, there was two hundred
million dollars government funding for
R&D, then it doubled with five hundred fifty
two million dollars through 2009. The
amount of government funding in Turkey
continued to raise steadily. Finally, it was at
its peak level with six hundred twenty three
million dollars. Therefore, one may claim
that Turkey did not only maintain its fourth
ranking among the OECD Mediterranean
countries, but also narrowed the gap between
Italy and Spain from year to year. Chart 2
gives information about the variation in
Turkish government direct funding for R&D
compared to other OECD Mediterranean
countries.
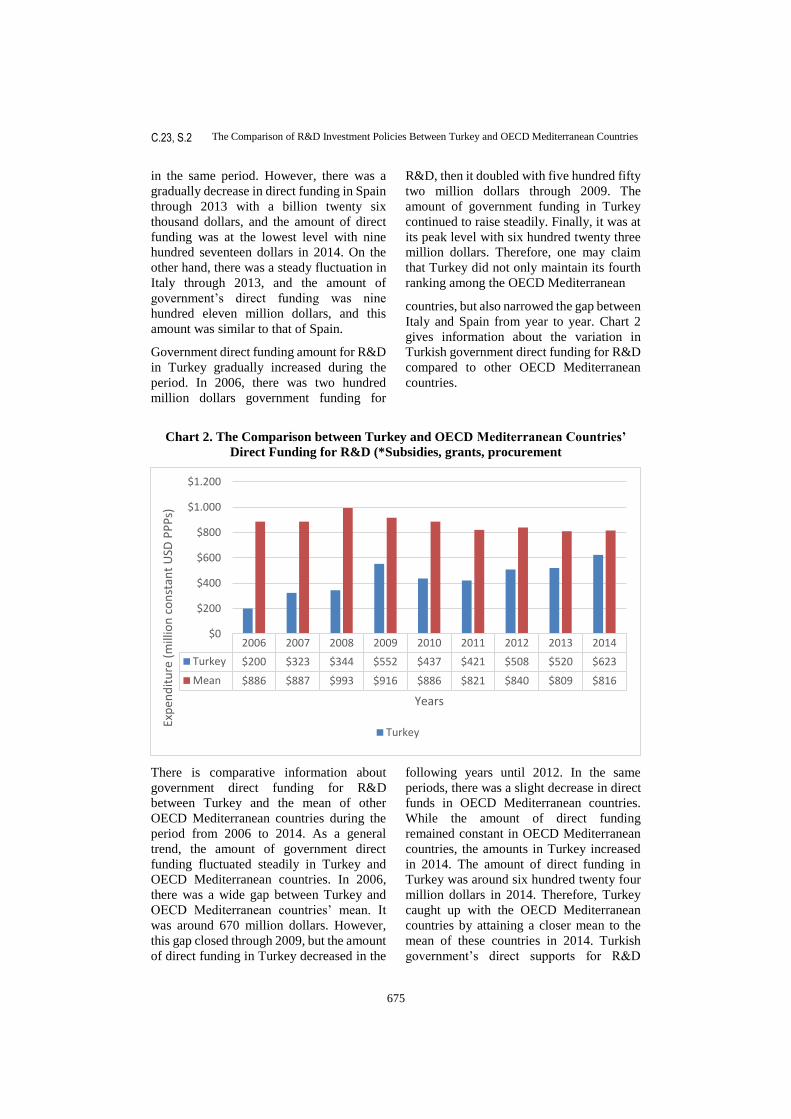
Chart 2. The Comparison between Turkey and OECD Mediterranean Countries’
Direct Funding for R&D (*Subsidies, grants, procurement
There is comparative information about
government direct funding for R&D
between Turkey and the mean of other
OECD Mediterranean countries during the
period from 2006 to 2014. As a general
trend, the amount of government direct
funding fluctuated steadily in Turkey and
OECD Mediterranean countries. In 2006,
there was a wide gap between Turkey and
OECD Mediterranean countries’ mean. It
was around 670 million dollars. However,
this gap closed through 2009, but the amount
of direct funding in Turkey decreased in the
following years until 2012. In the same
periods, there was a slight decrease in direct
funds in OECD Mediterranean countries.
While the amount of direct funding
remained constant in OECD Mediterranean
countries, the amounts in Turkey increased
in 2014. The amount of direct funding in
Turkey was around six hundred twenty four
million dollars in 2014. Therefore, Turkey
caught up with the OECD Mediterranean
countries by attaining a closer mean to the
mean of these countries in 2014. Turkish
government’s direct supports for R&D
2006 2007 2008 2009 2010 2011 2012 2013 2014
Turkey $200 $323 $344 $552 $437 $421 $508 $520 $623
Mean $886 $887 $993 $916 $886 $821 $840 $809 $816
$0
$200
$400
$600
$800
$1.000
$1.200
Exp
end
itu
re (
mill
ion
co
nst
ant
USD
PP
Ps)
Years
Turkey

The Comparison of R&D Investment Policies Between Turkey and OECD Mediterranean Countries
676
C.23, S.2
increased steadily for the last three years so
much.
3. Business Enterprise Expenditures on
R&D
According to the National Science,
Technology and Innovation Strategy
(UBTYS) from 2011 to 2016 by the
Supreme Council for Science and
Technology (SCST), Turkey has three main
goals that are focusing on priority sectors;
improving the design and implementation of
STI policy and supporting innovation in
firms, and entrepreneurship and small
medium sized enterprises (SMEs) (European
Council, 2013). To begin with priority
sectors, nine main sectors are national
priority in Turkey. These are automotive,
machinery, and manufacturing technologies,
energy, ICT, water, food, defence,
aerospace, and health areas. Scientific and
Technological Research Council in Turkey
(TÜBİTAK) has announced over 100 direct
support programmes for these priority
sectors since 2012. In addition, design
development is another important issue in
Turkey’s national science, technology and
innovation strategy. This strategy is based on
the centralization of business sectors and
entrepreneurs since 2011. The policy makers
in Turkey aim to improve public actors’
numbers. Furthermore, these new actors
could be integrated with the support
mechanism thanks to target-oriented
approach. In order to achieve this goal, a
department was set up under the auspices of
Ministry of Science, Industry, and
Technology (MoSIT) for assessing R&D
and innovation support programme’s
achievements by Turkish government.
Finally, supporting innovation,
entrepreneurship, and SMEs is third strategy
in Turkey’s National Science, Technology
and Innovation Strategy. MoSIT, science
and technological research council launched
many support programmes for supporting
private sector investments on R&D. These
are the venture capital (private equity)
funding programme (1501), the individual
entrepreneurship (Phased) support
programme (1512) and the individual
entrepreneurship multi-phased co-financing
programme (1601). Some of these
programmes were provided by the scientific
and technological research council, and
technological products promotion and
marketing programme, the technological
products investment support programme by
MoSIT for entrepreneurship and SMEs.
Table 3 presents information about the
amount of business enterprise expenditures
on R&D in OECD Mediterranean countries
in the period from 2006 to 2014.
Table 3. Business Enterprise Expenditures on R&D in OECD Mediterranean Countries
France Greece Israel Italy Slovenia Spain Turkey
2006 $26.486 $525 $6.140 $9.851 $479 $8.914 $1.923
2007 $27.718 $534 $7.334 $11.572 $476 $10.232 $2.908
2008 $29.200 $714 $7.229 $12.896 $628 $11.211 $3.425
2009 $30.687 $771 $7.101 $13.133 $658 $10.664 $3.546
2010 $32.063 $761 $7.188 $13.568 $789 $10.471 $4.195
2011 $34.170 $694 $7.980 $14.081 $1.048 $10.507 $4.857
2012 $35.408 $688 $8.789 $14.716 $1.145 $10.257 $5.742
2013 $37.503 $795 $9.272 $15.390 $1.194 $10.254 $6.512
2014 $38.056 $829 $9.609 $15.450 $1.157 $10.184 $7.533
(Source: OECD, 2017a)
The countries whose amount of expenditure
on R&D by business enterprises are revealed
are France, Greece, Israel, Italy, Slovenia,
Spain and Turkey. As a general trend, the
amount of business expenditure increased
for nearly all countries in the period between
2006 and 2014. The only exception was
Spain. The amount of business expenditure-
in Spain fluctuated steadily. On the other
hand, France was the country with the

The Comparison of R&D Investment Policies Between Turkey and OECD Mediterranean Countries
677
C.23, S.2
highest level of amount of expenditures on
R&D by business enterprise among the
OECD Mediterranean countries. Italy,
Spain, Israel, and Turkey are followed this
country, respectively. On the other hand, the
amount of expenditure on R&D by business
enterprise in France was higher than other
countries. Moreover, the amount of private
sector’s investment on R&D in France was
much higher than the total amount of
business enterprise expenditure on R&D in
other OECD Mediterranean countries in the
majority of period. Furthermore, it seems
that the amount of business enterprise
expenditure on R&D was higher than
governments’ direct funds on R&D. France
and Israel, which have serious business
expenditure on R&D when compared to the
amount of their direct foundation, were
leading countries at this point. It may be said
that Turkey could be an attractive country to
earn the trust of investors who make
investment on R&D, but it is still not as good
as France and Israel at this point.
Chart 3 provides information about business
expenditure on R&D by comparing Turkey
and OECD Mediterranean countries’ mean
values.
Chart 3. The Comparison of R&D Expenditure of Business Enterprise between Turkey
and Mediterranean Countries.
As a general trend, the business expenditure
on R&D increased in both Turkey and
OECD Mediterranean countries from year to
year. In addition, the gap between Turkey
and other OECD Mediterranean countries
regarding business expenditure seemed to
be closing in 2006, the mean amount of
business expenditure on R&D in OECD
Mediterranean countries was around 7
billion eight hundred dollars, while it was
nearly a billion nine hundred fifty million
dollars in Turkey. Namely, OECD
Mediterranean countries’ mean value of the
business expenditure on R&D was three
times more than that of Turkey i Turkey. The
amount of business expenditure on R&D
increased in both Turkey and other OECD
countries in the period from 2006 to 2014. In
2014, the gap between Turkey and other
OECD Mediterranean countries seemed to
be closing. The amount of business
expenditure’s mean value was around 11
2006 2007 2008 2009 2010 2011 2012 2013 2014
Turkey $1.923 $2.908 $3.425 $3.546 $4.195 $4.857 $5.742 $6.512 $7.533
Mean $7.760 $8.682 $9.329 $9.509 $9.862 $10.477 $10.964 $11.560 $11.831
$0
$2.000
$4.000
$6.000
$8.000
$10.000
$12.000
$14.000
Exp
end
itu
res
(mill
ion
co
nst
ant
USD
PP
Ps)
Years
Turkey Mean

The Comparison of R&D Investment Policies Between Turkey and OECD Mediterranean Countries
678
C.23, S.2
billion eight hundred fifty million dollars in
OECD Mediterranean countries, while it
was seven billion five hundred fifty million
dollars in Turkey. Thus, Turkish government
should develop new policies to increase
investments on R&D in private sector. On
the other hand, Turkey seems to have
improved business expenditure on R&D for
the last years. Therefore, it is highly likely
that it is going to catch up with other OECD
Mediterranean countries.
4. FOREIGN INVESTMENTS ON R&D
Foreign investments on R&D by foreign
investors is another crucial issue in terms of
Turkey’s R&D policy performance. Table 4
gives information about the amount of
foreign investors’ investment in OECD
Mediterranean countries during the period
between 2006 and 2014.
Table 4. R&D investments by foreign investors in OECD Mediterranean Countries
France Greece Israel Italy Slovenia Spain Turkey
2006 $3.282 $110 $2.040 $1.913 $49 $1.037 $29
2007 $3.557 $119 $2.447 $2.335 $48 $1.338 $41
2008 $3.865 $135 $2.767 $1.981 $55 $1.174 $107
2009 $3.557 $186 $4.018 $2.329 $61 $1.112 $102
2010 $3.829 $229 $4.096 $2.472 $70 $1.167 $82
2011 $4.043 $290 $4.422 $2.268 $97 $1.321 $75
2012 $4.042 $300 $4.482 $2.417 $122 $1.241 $71
2013 $4.323 $299 $4.908 $2.493 $127 $1.328 $106
2014 $4.283 $293 $5.100 $2.508 $125 $1.322 $152
(OECD, 2017b)
The values presented in Table 3 reveal the
amount of foreign investments on R&D in
the OECD Mediterranean countries such as
France, Greece, Israel, Italy, Slovenia,
Spain, and Turkey in the period from 2006
to 2014. As a general trend, the amount of
foreign investment on R&D increased from
2006 to 2014 for all countries. On the other
hand, figures pertaining to some countries
fluctuated, and others grew gradually. There
was a steady fluctuation in France, Italy,
Spain, and Turkey, while the amount of
foreign investments on R&D in Greece,
Israel, and Slovenia increased gradually.
France, Israel, Italy, Spain, Greece, Turkey,
Slovenia ranked respectively according to
their amounts of foreign investment on
R&D. France was the country with the
highest-level amount of foreign investment
on R&D. Generally, there was increasing
trend in the amounts of foreign investment in
France. In 2006, the amount of foreign
investment on R&D was three billion two
hundred eighty two million dollars. There
was a gradually growth until 2009. In 2009,
it seems there was a slight decrease in
foreign investments on R&D in France, and
then from this year to 2014, the amount of
foreign investment on R&D rose gradually.
On the other hand, there was a steady rise in
the amount of foreign investment of Israel
from year to year in the period between 2006
and 2014. In 2006, the amount of foreign
investment was two billion forty million
dollars in Israel, and then it grew steadily
until 2009. In this year, the amount of
foreign investment doubled with four billion
eighteen million dollars. After this year, it
increased through 2014. Finally, the amount
of foreign investment on R&D was five
billion one hundred million dollars. In
addition, Italy and Spain had a steadily rising
trend in the amount


YILDIZ
679
2018
of foreign investment. In 2006, Italy had one
billion nine hundred thirteen million dollars,
while Spain had one billion thirty-seven
dollars. Then, there was a slight increase in
the amount foreign R&D investment in both
Italy and Spain through 2014. The amount of
R&D investment on R&D was two billion
five hundred eight dollars in Italy, and one
billion three hundred twenty two million
dollars in Spain. Finally, Turkey had a
steady fluctuation during this period. In
2006, the amount of investment on R&D in
Turkey was twenty nine million dollars.
There was a steady growth with a hundred
seven million dollars through 2008. Then,
the amount of foreign investment decreased
in the period from 2008 to 2012, and it
increased through 2014. The amount of
foreign investment on R&D was a hundred
fifty two million dollars in 2014. The chart 4
helps understand the difference between
Turkey and OECD Mediterranean countries.
Graph 4. Foreign Investment on R&D in Turkey and OECD Mediterranean Countries
As a general trend in OECD Mediterranean
countries, the amount of foreign investment
on R&D increased gradually during the
period. However, Turkey had a steady
fluctuation in the foreign investment on
R&D. In 2008, the amount of foreign
investment in OECD Mediterranean
countries was a billion two hundred nine
million dollars, while it was twenty nine
million dollars in Turkey. On the other hand,
the amount of foreign investment on R&D
increased steadily until 2013. It was a billion
seven hundred eighty eight million dollars
for OECD Mediterranean countries, while it
was seventy five million dollars in Turkey.
Finally, it was a billion nine hundred sixty
nine million dollars in OECD countries, but
the amount of foreign investment on R&D
was a hundred fifty two million dollars in
Turkey. Therefore, it can said that the
foreign investment on R&D in Turkey was
not adequate when compared to the OECD
Mediterranean countries in the period from
2006 to 2014.
CONCLUSION
In this study, a variety of investment and
expenditure issues in R&D in the both
Turkey and OECD Mediterranean countries
were discussed. These issues were gross
domestic expenditure on R&D,
governments’ direct funding on R&D,
2006 2007 2008 2009 2010 2011 2012 2013 2014
Turkey $29 $41 $107 $102 $82 $75 $71 $106 $152
Mean $1.209 $1.412 $1.441 $1.624 $1.706 $1.788 $1.811 $1.941 $1.969
$0
$500
$1.000
$1.500
$2.000
$2.500
Fo
reig
n I
nves
tmen
ts (
mil
lio
n c
onst
nat
US
D P
PP
s)
Years
Turkey Mean

The Comparison of R&D Investment Policies Between Turkey and OECD Mediterranean Countries
680
C.23, S.2
foreign investment on R&D. The statistics
pertaining to Turkey and OECD
Mediterranean countries were compared to
understand Turkey’s and other OECD
Mediterranean countries’ R&D investment
policy. According to gross domestic
expenditure values on R&D, Turkey’s
performance gradually improved. - The
average gross domestic expenditure of
Turkey has almost caught up with the OECD
Mediterranean countries’ values. On the
other hand, there was a steadily fluctuation
in the government direct funding on R&D in
both Turkey and other OECD Mediterranean
countries for this period. It can be said that
Turkey almost caught up with OECD
Mediterranean countries’ mean value of
government direct funding R&D at the end
of this period. Other important issue related
to R&D is business enterprise expenditure.
As a general trend in the period from 2006 to
2014, it seems that there was a gradual
growth in the both Turkey and OECD
Mediterranean countries. In the beginning of
the period, the amount of business enterprise
expenditure differed in Turkey and OECD
Mediterranean countries. In other words,
there was a lack of business expenditure on
R&D in Turkey when compared to other
OECD Mediterranean countries such as
France, Italy, Spain, and Israel. However, it
seems that business expenditure on R&D
increased substantially in the period. Turkey
was the country with the highest increase in
business expenditure on R&D among OECD
Mediterranean countries for this period.
Finally, foreign investments on R&D is
another important indicator in countries’
performance. A general trend in the foreign
investment on R&D in the OECD
Mediterranean countries was a gradually
growth. On the other hand, Turkey had a
steady fluctuation in the foreign investments
on R&D. In addition, by comparing the
amounts of foreign investments on R&D in
Turkey and OECD Mediterranean countries
it can said that Turkey did not have an
adequate level of foreign investment on
R&D. Thus, policy makers in Turkey should
focus on policies for increasing foreign
investments on R&D. Finally, the amount of
gross domestic expenditures in Turkey was
as much as that of OECD Mediterranean
countries’. In addition, government direct
funding on R&D was about to catch up with
OECD Mediterranean countries mean in the
period. However, business enterprise
expenditures and foreign investments on
R&D were not sufficient when compared to
OECD Mediterranean countries. Therefore,
it can be understood that private sector and
foreign investors might hesitate about
making investment on R&D. Turkish
government and policy makers should take
care of private sector and foreign investors
to improve their investments on R&D. They
should increase financial supports, and
indirect supports to attract more investments
on R&D. This way, Turkey may catch up
with the OECD Mediterranean countries and
outperform them.

YILDIZ
681
2018
REFERENCES
1. ABDULRAB, S. (2011). “The Impact of
Culture on Information Technology
Adoption in Yemeni universities (Doctoral
Thesis)”. Robert Morris University
Information Systems and Communication,
USA.
https://search.proquest.com/docview/91744
3028?accountid=11054
2. BASSANINI, A., Scarpetta, S., & Visco,
I. (2000). “Knowledge Technology and
Economic Growth: Recent Evidence From
OECD Countries, OECD Economics
Department Working Papers, No.259,
OECD Publishing, Paris.
3. BERTRAND, O., & Zuniga, P. (2006).
R&D and M&A: Are Cross-Border M&A
Different? An Investigation on OECD
Countries. International Journal of Industrial
Organization, 24(2), 401-423.
4. BLOMSTROM, M. (1991). Host Country
Benefits of Foreign Investment. National
Bureau of Economic Research.
5. CARLIN, W., & Mayer, C. (2003).
Finance, Investment, and Growth. Journal of
Financial Economics, 69(1), 191-226.
6. COCCIA, M. (2009). What Is The
Optimal Rate of R&D Investment to
Maximize Productivity Growth?
Technological Forecasting and Social
Change, 76(3), 433-446.
7. COE, D. T., & Helpman, E. (1995).
International R&D Spillovers. European
Economic Review, 39(5), 859-887.
8. ENGELBRECHT, H.-J. (1997).
“International R&D Spillovers, Human
Capital and Productivity in OECD
Economies: An Empirical Investigation”.
European Economic Review, 41(8), 1479-
1488.
9. EUROPEAN COUNCIL. (2013, Temmuz
3). National Science, Technology and
Innovation Strategy. .
http://europa.eu/youth/tr/article/42/5900_fr
10. FALK, M. (2006). What Drives Business
Research and Development (R&D) Intensity
Across Organisation for Economic Co-
Operation and Development (OECD)
Countries? Applied Economics, 38(5), 533-
547.
11. FRACASSO, A., & Marzetti, G. V.
(2015). International Trade and R&D
Spillovers. Journal of International
Economics, 96(1), 138-149.
12. GOEL, R. K., & Ram, R. (2001).
Irreversibility of R&D Investment and the
Adverse Effect of Uncertainty: Evidence
From The OECD Countries. Economics
Letters, 71(2), 287-291.
13. HEJAZI, W., & Safarian, A. E. (1999).
Trade, Foreign Direct Investment, and R&D
Spillovers. Journal of International Business
Studies, 30(3), 491-511.
14. KINOSHITA, Y. (2000). “R&D And
Technology Spillovers Via FDI: Innovation
And Absorptive Capacity”. William
Davidson Institute Working Paper No. 349.
15. LE BAS, C., & Sierra, C. (2002).
“Location Versus Home Country
Advantages’ In R&D Activities: Some
Further Results On Multinationals’
Locational Strategies”. Research Policy,
31(4), 589-609.
16. LIN, M., & Kwan, Y. K. (2016). FDI
Technology Spillovers, Geography, And
Spatial Diffusion. International Review of
Economics & Finance, 43, 257-274.
17. MELICIANI, V. (2000). The
Relationship Between R&D, Investment
And Patents: A Panel Data Analysis.
Applied Economics, 32(11), 1429-1437.
18. OECD. (2017a). Business Enterprise
Expenditure on R&D (BERD), Retrieved
From
http://stats.oecd.org/index.aspx?r=174265&
erroCode=403&lastaction=login_submit, 29
March 2018
19. OECD. (2017b). Financed By
Government (Direct) in OECD
The Comparison of R&D Investment Policies Between Turkey and OECD Mediterranean Countries
682
C.23, S.2
Mediterranean Countries, Retrieved From
http://stats.oecd.org/index.aspx?r=174265&
erroCode=403&lastaction=login_submit, 28
March 2018
20. OECD. (2017c). Gross Domestic
Expenditure on R&D (GERD). Retrieved
From
http://stats.oecd.org/index.aspx?r=174265&
erroCode=403&lastaction=login_submit, 28
Mart 2018
21. PARK, W. G. (1995). International R&D
Spillovers And OECD Economic Growth.
Economic Inquiry, 33(4), 571-591.
22. PORTER, M. E., & Stern, S. (2001).
Innovation: Location Matters. MIT Sloan
Management Review, 42(4), 28.
23. REDDY, P. (1997). New Trends In
Globalization Of Corporate R&D And
Implications For Innovation Capability In
Host Countries: A Survey From India.
World Development, 25(11), 1821-1837.
24. ROMAIN, A., & Pottelsberghe De La
Potterie, B. Van. (2003). The Determinants
Of Venture Capital: A Panel Data Analysis
Of 16 OECD Countries.
25. TEMPLE, J. (2002). Growth Effects Of
Education And Social Capital In The OECD
Countries. Historical Social
Research/Historische Sozialforschung, 5-46.
26. WANG, E. C. (2007). R&D Efficiency
And Economic Performance: A Cross-
Country Analysis Using The Stochastic
Frontier Approach. Journal of Policy
Modelling, 29(2), 345-360.
27. WANG, E. C. (2010). Determinants Of
R&D Investment: The Extreme-Bounds-
Analysis Approach Applied to 26 OECD
Countries. Research Policy, 39(1), 103-116.