the condition of health - planning department(uttar...
TRANSCRIPT

5 5 The Condition of Health
CHAPTER - 4
The Condition of Health
I. Introduction1. It needs to be acknowledged that in Uttar
Pradesh, in last several years, there has been progresson several health development parameters such as theoverall decline in childhood mortality, maternal mortalityand incidence of preventable diseases. However, incomparison to other states and developing countries,progress in UP leaves considerable scope forimprovement. For instance, over the last decade (1990-2001), while Bangladesh and Nepal recorded a progressof 46% and 37% respectively in reduction in childmortality, India’s progress was 24% and UP showed lowerperformance than the national average. Given thecurrent trend, prospects of attaining the MillenniumDevelopment Goals (MDG) seem difficult.
2.The state shows significant variation in healthrelated burden and disability across regions and incomegroups. Both the rich and the poor face a very high burdenof health related disability. However, the poor andwomen seem to be at a greater disadvantage, theincidence of IMR alone is found to be two and a halftimes higher amongst the poor. At the same time muchlesser proportion of public resources are spent on thebottom 20 % of the population, in comparison to what isspent on the top 20 %.
3. Public sector’s role in health service delivery isvery marked in UP. Much of the mortality reduction duringthe past few decades is traceable to government-drivenefforts, particularly, through immunization campaignsand focus on specific challenges like TB, etc. Given thelimited capacities, in relation to the mandate at hand,such efforts have consumed much of the state’s resources(human and financial ). Understandably, curative careat the cutting edge level could not be given the kind ofpriority that it deserves. However, a very large numberof private sector health providers exist in the state.
4. Health care in U.P. can be summarized as acomposite challenge of access, quality and demand. Thelarge public sector does not have adequate access besidesbeing found wanting in the quality of care at the cuttingedge line (PHCs and Sub-centers). The private sectorhas phenomenal access but a vast majority of this sectorpresents a picture of serious lack of quality to the extentthat it often becomes a serious threat to the health ofthe people. It appears that a re-orientation of the healthstrategy in U.P., where the focus is increasingly onfunctionalizing existing structures; synergy throughpublic private partnership particularly for reaching outto the poor and the marginalized; and on finding solutionsthrough innovative interventions can enable us to meetUP’s health challenge.
5. The future direction of human developmentcircumstances in the state as in the country as a wholedepends critically on the interventions in the healthsector. This chapter looks at the health status in UttarPradesh with particular focus on women and the girl childand highlights future challenges in this area.
II. The Mortality Challenge
Infant Mortality Rate6. Infant Mortality Rate (IMR) is often regarded as
the summary of the health circumstances in a region. Itis common knowledge that IMR in India, in general, isvery high. In industrialized countries, IMR is measuredat around five (State of World Children 2005), whereas,with the exception of Kerala, there is no state in Indiawhere IMR was observed to be lower than 40 in 2000.Even Middle East and North Africa with an IMR of 44compare favorably with India, which has an IMR level of58. It needs to be noted that one of the biggest reasonsfor high IMR in India happens to be poor performance or
Fig. 4.1: NMR as a major constituent of IMR
0 10 20 30 40 50 60 70 80 90 100
NMR
IMR
per 1,000 live births

5 6Human Development Report, Uttar Pradesh
high IMR levels in Uttar Pradesh. It is observed that nearly25% of IMR incidence in the country is accounted for byUttar Pradesh alone.
7. The crude death rate for UP was estimated at20.1 per thousand in 1971 and it declined to 10.3 in1997. It further declined to 8.7 in 2005-06. In rural areas,the rate declined from 21.1 to 10.7 and further to 9.1during the same period and in urban areas it declinedfrom 13.1 to 8.2 and further to 6.8. Much of this declinewas due to sharp fall in the infant mortality rate,particularly after 1990. The infant mortality rate for thestate was 182 per 1000 live births in 1971 and declinedto 99 in 1990 and further to 73 in 2005-06 as per SRS, ascompared to the all India average of 58. Past trends havedemonstrated that while both the neo-natal and post-neonatal components of infant mortality have declined,the decline in neo-natal mortality has not kept pace withthe decline in post neonatal mortality. Deaths duringthe neo-natal period (within 28 days of life) contributeto almost 64% of the infant mortality in the State. Figure4.1 clearly shows that almost two-thirds of the IMR isaccounted for by NMR alone.
8. A recent study published in WHO Bulletin 2006attempts at determining the cause of neonatal death inUP. The study finds that 27% of the deaths are caused bypre term birth, 24% by sepsis and pneumonia, birthasphyxia and birth injury causes another 14% of theneonatal deaths. On the day of birth, asphyxia andpreterm birth emerge as the most important killers. Onday one and during the first week of the life, pretermbirth and sepsis or pneumonia emerges as the big killers.From second week to fourth week, sepsis or pneumoniaemerge as the more important cause of child death.When multiple causes of death were considered, 47% ofneonatal death showed signs of sepsis or pneumonia,while 32% also met with the criteria for preterm birth.
9. Figure 4.2 (A) (B) & (C) capture the relationshipbetween mortality and mother’s age at the time of birth;
number of children and its relationship with mortality;and the relationship between death per 1000 live birthsand previous births intervals. The mortality estimatesexhibit U-shaped pattern with respect to mother’s ageat the time of birth. Infant mortality is highest forchildren of mothers under age 20. It is lower in age-group 20-29 but again it increased in age-group 30-39.Differential by birth order again show U-shapedpattern for order of birth with the exception of childmortality, which increases steadily with the birth order.It is also found that child spacing patterns have apowerful effect on survival chances of children. Infantmortality is well over three times as high for childrenwith a preceding interval of less than 24 months as forchildren with the preceding interval of 48 months or more(National Family Health Survey Series). Traditionally, theentire Health and Family Welfare Program was orientedtowards sterilization. The above evidence points towardsthe fallacy of such a strategy. Spacing methods shouldhave been the mainstay of the program. This could haveensured lower infant mortality rate in Uttar Pradesh. Ifevidence from Indonesia, Tamil Nadu and Kerala is to bebelieved, then low IMR would have ensured lowpopulation growth as well.
10. From the point of view of policy-makers,magnitudes of the risk ratios should be considered inconjunction with the percentage of women in each‘elevated risk’ category. Most of the studies find thatthe highest risk ratio is for births of order four and aboveto women who were over 34 years of age, occurringwithin 24 months of the previous birth. However, only1.2% of all births fell in this category (NHFS). Even acomplete avoidance of such births will have little effecton the overall level of infant mortality. On the otherhand, the risk ratio for births to mothers under age 18 islower in comparison to 34-plus age group (2.11 comparedto 3.42), but there are five times as many births in thiscategory.
0
20
40
60
80
100
120
140
<20 20 -29 30 -39
per 1,000 live births
Mother's age at birth
Fig 4.2(A)Death per 1000 Live Births and Mother's Age at the time of Birth

5 7 The Condition of Health
11. A large proportion of all births fall in one ofthe categories that include these short birth intervalsand all these categories have high-risk ratios. It is veryclear that a change in childbearing behavior of womenin Uttar Pradesh can undoubtedly reduce mortality risksto children. Discouraging child bearing amongst womenunder age 18 is, therefore, likely to have a greaterimpact on overall mortality levels. It appears thatreducing or eliminating births that occur less than 24months apart could attain the greatest reduction inmortality.
12. If mortality rates are to be reduced then adual strategy will have to be followed. Firstly, mortality
reduction strategies will have to be appropriately alignedto focus increasingly on Sepsis or Pneumonia, which arethe main cause of death. Second will be the focus onpreterm birth. The three elevated risk categoriesmentioned above will have to be addressed. The taskhere is well cut out. There are five times as many birthsin the age group of twenty and less as compared to the35 plus group. It is obvious that we should target theunder 20 mothers. Interestingly, the mean age atmarriage in most districts of UP continues to be around16. Discouraging child bearing amongst women underage 20 is, therefore, likely to have a greater impact onoverall mortality levels.
0
20
40
60
80
100
120
1 2 3 4+
per 1,000 live births
Birth order
Fig. 4.2 (B)Death Per 1000 Live Births And Birth Order
0
20
40
60
80
100
120 140
160
24 months 24-47 months 48+ months
per 1,000 live births
Previous births intervals
Fig. 4.2 (C) Death Per 1000 Live Births And Previous Births Intervals

5 8Human Development Report, Uttar Pradesh
13. Equally significant is the fact that the IMR inthe rural areas was higher to urban areas (Fig 4.3).Children in rural areas experience 80% higher risk of dyingbefore their fifth birthday than the urban children. It isinteresting to note that infant and other mortalityindicators are significantly influenced by socialcharacteristics like residence, education, religion andcaste. Demographic characteristics like sex of child,mother’s age at birth, order of birth and birth intervalalso have a significant bearing on infant and childmortality. Infant Mortality Rate is found to decline sharplywith increase in education of mothers.
14. The MDGs take 1990 as the benchmark year. In1990 IMR in Uttar Pradesh was measured at 99 and itwas agreed that by 2015 it would be brought down to33. Fig 4.4 traces the trend path for the IMR in the state.
The blue continuous line clearly demonstrates the trendpath of the IMR during 1990-2004. The dotted blue linecaptures the projected values of the IMR if the trendduring 1990-2004 continues. It shows that if IMR continuesto reduce at the same rate at which it has declinedbetween 1990 and 2004, the MDG of 33 (IMR) will beachieved only in 2034. The red line shows the necessarypath that needs to be followed if the IMR MDG of 33 is tobe achieved by 2015. Naturally, the distance betweenthe dotted blue line and the pink line highlights the needfor extra effort that will have to be put in if the state isserious about bringing down the IMR. It will not be outof place to mention that around two and a half millionchildren die every year in India. Out of them anythingclose to over 4,00,000 children must be dying every yearin UP alone. This is an alarming situation.
Fig 4.3: IMR by Location
77 50
60
70
80
Source: SRS 2005-06
Fig. 4.4: Infant Mortality Trends In UP
Source: Based on SRS Data
0
20
40
60
80
100
120
1990 1993 1997 2000 2004 2008 2012 2016 2020 2024 2028 2032

5 9 The Condition of Health
15. The IMR shows significant intra-state variations.During the 1990s, the Bundelkhand region showed thehighest IMR. The female-male variance in IMR acrossregions also makes an interesting study. In all the regionsof the state the female IMR is higher. In the eastern,western, and the central regions the ratio is not onlytilted in favor of the males but also the differential isvery substantial.
16. IMR also shows sharp variation across districtsof the state. RCH – DLHS data reveals that there are 31districts which have an IMR level which is higher thanthe current state average of 73. If IMR in UP is to bebrought down, then these 31 districts will have to betargeted exclusively.
17. To address the neonatal mortalities, Govt.of UP has decided to launch Comprehensive ChildSurvival Package in phased manner. In the first phase17 districts have been selected. One district fromeach division has been selected where all the MedicalOfficers, Staff Nurses, ANMs & ASHAs are being trainedfor essential new born care, immediate care afterbirth home based new born care as well as facilitybased new born care according to the level of thefunctionary. Behaviour change communication,training for the community mobilization andstrengthening of transportation are other importantconstituents of the programme. It is expected toreduce Infant Mortality Rate by 50% within theproject period. Initiation of early breast feeding upto the age of 6 months timely and correct weaningand continuing breast feeding up to the age of 2 yearsis the most cost effective activity to reduce InfantMortality Rate. Promotion of IYCF has been includedunder NRHM and is being promoted all over the State.
Age of marriage, age of first conception, birthinterval, nutritional status of mother and otherimportant social factors are responsible for highInfant Mortality Rate. All these are being addressedunder NRHM through various strategies.
Maternal Mortality Rate18. It is a sad commentary on the state of affairs
that 38,000 women die every year in the state whiledelivering a child. Almost half the deaths occur at homeand another 10% to 15% mothers die on way to thehospital. In 1997, there were an estimated 707 maternaldeaths per 100,000 live births (SRS 1998) in U.P. Thiswas almost eight times higher than the MMR of Keralaand 70 per cent higher than the national average (436).Recent estimates however, suggest that maternalmortality in UP has now come down to 517. It also needsto be added that for every maternal death, twentymothers start living a life compromised by morbiditycaused by pregnancy related complications.
19. Efforts are being made to increase completeantenatal care, institutional delivery, identification of
complicated cases, timely referral and treatment toreduce Maternal Mortality Rate. Under NRHM FirstReferral Units are being strengthened to deal with thecomplicated cases and efforts are being made to make50% Block PHCs functional as 24x7 units. Under a pilotproject 20 Block PHCs of 10 selected districts have beenmade functional as 24x7 units by contracting ISM ladydoctors and ANMs to deliver round the clock services.Other training programmes of SBAS, EMOC and shortterm Anesthetist have also been started in the State tofill up the gaps.
Box 4.1: Maternal Mortality Rate in U.P. :Some Shocking Facts
l Every 15 minutes a woman dies in UP
l 38,000 maternal deaths occur every year
l For every Maternal Death 20 mothers startleading a life compromised by morbid conditionsbecause of pregnancy related complications.
l Almost half of the deaths occur at home andanother 10-15% on the way to the hospital.
20. In most countries, male death rate is higherthan female death rate at nearly all ages. South Asiagenerally has been an exception in this respect, withhigher death rates for females over much of the agespan. In Uttar Pradesh also the sex-specific mortalitydifferentials tend to move in an unnatural direction. Thefemale death rate for the age group 0-4 exceeds themale death rate by 22% (NFHS 1992). It came to 1.22;0.88; 1.08 and 0.88 for the 0-4, 5-14, 15-49 and 50+ agegroups, respectively. The very high value for the 0-4 agegroup is particularly notable.
21. Sex differential by age provides evidence ofdifferential treatment of male and female childrenleading to higher mortality risks for females. Neo-natalmortality, which reflects a substantial component ofcongenital conditions, particularly preterm birthaccounts for 27% of neonatal death, is slightly higherfor males than for females (WHO 2006). The ratio offemale to male for post neo-natal mortality is 1.24;similar is the ratio for all deaths under age five. By farthe largest differential, however, is in the child deathrate, reflecting mortality risks between ages one andfive. The female to male ratio here is 1.70. Thus,despite the fact that female infants have a naturalbiological advantage at the time of birth, yet they seemto enjoy a significant social disadvantage. Femalesunder one year of age may be less disadvantagedrelative to males because children of both sexes tendto be breast-fed throughout infancy. Once breastfeeding ceases, the potential for differential treatmentof males and females increases. The sharp disadvantageof female children in the age group one to five isconsistent with such differential treatment.

6 0Human Development Report, Uttar Pradesh
Neonatal Mortality22. It has already been mentioned that pre term
birth, pneumonia, sepsis and birth asphyxia, and birthinjury emerge as the biggest neonatal killers. On theday of birth asphyxia and preterm birth emerge as thecommon most killers. On day one and during the firstweek of the life preterm birth and sepsis or pneumoniaemerges as big killer. From second week to fourth weeksepsis or pneumonia emerge as the main cause of childdeath. In the post-neonatal period diarrhea also emergesas a major determinant of child mortality.
23. If mortality rates are to be reduced then thesebig killers will have to be appropriately tackled. RCHdata suggests that awareness about pneumoniamanagement was very poor. Again the awareness levelwas a bigger challenge particularly in Central UP, EasternUP and Bundelkhand Regions. Diarrhea is another majorkiller in the state. RCH survey shows that in most partsof UP awareness about Diarrhea management was verylow. It is commonly known that timely administration ofORS to diarrhea patients can save many lives. In largenumber of the districts the awareness about ORS wasless than 10% ( DLHS RCH 2002 – 2004). Central UP, EasternUP and Bundelkhand regions, particularly, have very highconcentration of such districts. The RCH – DLHS dataalso reveals that many of the low awareness districtsshow relatively high incidence of diarrhea. Suchconvergence is an added cause of concern. Lack of suchawareness about diarrhea management particularlyabout ORS therapy certainly is a threat to the lifecircumstances of the people.
III. The Morbidity Challenge24. As already noted, combined losses due to
premature death and disability from non-fatal illnessesare very high in the state. The estimates of DisabilityAdjusted Life Years (DALYs) lost in six states in India,suggest that UP has the highest loss rate among all theIndian states examined to date. A further analysis, bycause of illness shows that the overwhelming cause ofpremature death and disability are communicablediseases, malnutrition, and prenatal conditions, a diseasepattern common among very poor population. Othernotable diseases which affect quality of life and humandevelopment in UP are reproductive morbidity (includingRTI) and diseases like malaria, tuberculosis, leprosy, AIDS,blindness, diarrhea and measles, etc. Healthy lifeconditions are also threatened by diabetes, bloodpressure and coronary diseases. Invariably, childrenconstitute a large proportion of these victims.
25. High death rates in UP have been a challengein themselves. However, the knowledge that a largenumber of people are losing their lives from non-fataldiseases is a matter of grave concern. Death frommalnutrition raises a whole range of issues relating to
child and maternal care, micronutrients and poverty.Another large chunk of these valuable lives are beinglost due to lifestyle diseases. Such loss of life is oftencrippling for the families concerned as well as for thelarger economy. The revelation that communicablediseases, lifestyle diseases and prenatal conditions arethe major killers in Uttar Pradesh naturally calls forrenewed organized institutional efforts towards reducingmortality induced by such preventable factors.
26. The major illnesses and strategy for dealingwith them are briefly discussed below:
Leprosy27. Leprosy is one of the major health problems in
Uttar Pradesh, which falls in the range of high endemicstates. The National Leprosy control program (NLCP) waslaunched in the state in the year 1955 in two districts ofthe state. Later on, other districts were also covered.The Multi-Drug therapy was introduced in 1985, inVaranasi district. Since 1st April, 1995 all the districts ofUP have been covered under MDT. With the introductionof MDT (Multi-Drug Therapy), the prevalence rate ofleprosy has steadily declined.
28. In 1983 over 1,87,000 cases of leprosy were onrecord. Around the turn of the century, 50,000-60,000new cases were being detected in Uttar Pradesh everyyear. However, by 2005 this number had come down to27,582. The male female ratio of the affected personsworks out to approximately 2:1. The prevalence rate ofleprosy was 52.7 per 10,000 in March 1983. It came downto 1.5 per 10,000 by November 2005. Uttar Pradesh isvery close to the milestones of 1 per 10,000, which ithas set for itself. Annual case detection rate was 2.4against the milestone of 2.8.
Malaria29. Malaria is a high incidence morbidity condition
in Uttar Pradesh. The incidence of malaria shows afluctuating trend (Fig. 4.5). On the whole, during 2000-2005 malaria cases in Uttar Pradesh have fluctuated ataround 85,000. The evidence suggests that over the yearsmalaria cases don’t seem to show any discernabledecline, However, there has been a significant declinein death due to malaria. The RCH data also showssignificant incidence of malaria in almost all the districtsof the states. Maximum incidence is observed in the taraibelt of the state.
Japanese Encephalitis30. Japanese Encephalitis (JE) is a much bigger
and unique challenge in Uttar Pradesh. Figure 4.7 showsthe trends in deaths from JE in U.P. It is found that 60%of total JE cases in the country are accounted for byUttar Pradesh followed by the states like Assam,Karnataka and Bihar (see Fig. 4.6).

6 1 The Condition of Health
Fig. 4.5: Total Malaria Cases in UP 2000-05
0 20000 40000 60000 80000 100000 120000
2000
2001
2002
2003
2004
2005
Year
Total cases
Fig. 4.6: Japanese Encephalitis Incidence in India
Source: State Epidemic Cell, Department of communicable diseases, Health Department, GO UP, Lucknow
Bihar5%
Other states6%
Tamil Nadu4%
Karnataka11%
Assam14%
Uttar Pradesh60%
31. In Uttar Pradesh the number of deaths due toJapanese encephalitis has shown a consistent rise from35 deaths in 1994 to 476 deaths in 2006 (Fig. 4.7).Japanese encephalitis is endemic in several parts of thestate. The disease has emerged as a major killer
particularly in the eastern region of the state. Around32 districts emerge as worst effected by the disease (seemap 4.1). Unfortunately the major chunk of the burdenis borne by innocent children.
Figure 4.7: Trends of the number of cases and deaths from Japanese Encephalitis 2000-06 in UP
0
1000
2000
3000
4000
5000
6000
7000
8000
2000 2001 2002 2003 2004 2005 2006
Cases Deaths
Year
Source: State Epidemic Cell, Department of communicable diseases, Health Department, GO UP, Lucknow

6 2Human Development Report, Uttar Pradesh
Box 4.2 State Response for early Diagnosis &Proper Management of J.E. cases
l The Central Government arranged import ofsingle dose JE vaccine from China in the year2006 and onwards. The JE vaccination campaignswere undertaken to immunize children from age1 to 15 in endemic districts. In the year 2006,68.36 lakh children of 7 most affected districtsGorakhpur, Kushinagar, Maharajganj, Deoria,Siddharthanagar, Sant Kabirnagar andLakhimpur-Khiri were vaccinated.
l In 2007, 94.99 lakh children of 11 districts:Ambedkarnagar, Bahraich, Barabanki, Basti,Balrampur, Gonda, Mau, Raebareli, Sitapur,Saharanpur were vaccinated.
l In 2008, 9 districts : Lucknow, Hardoi, Sulttanpur,Azamgarh, Ballia, Unnao, Muzaffarnagar,Bareilly and Faizabad will be covered.
l A.E.S. Nodal Centre having full-time Director co-ordinate all activities in Directorate General ofMedical & Health Services, U.P.
l The Epidemic Ward has been established inB.R.D. Medical College , Gorakhpur. The vectorBorne Diseases Surveillance Unit has beenestablished in Department of Social &Preventive Medicine of B.R.D. Medical College,Gorakhpur.
l The Viral Research Centre and RehabilitationCentre is being established in Gorakhpur by N.I.V.Pune and Department of Viklang Kalyan U.P.respectively.
l The J.E. Sentine Labs have been identified atC.S.M.M.U. Lucknow, and in District Hospital ofAllahabad, Azamgarh, Basti, Bahraich, Bareilly,Deoria, Faizabad, Gorakhpurr, Gonda, Kushinagar, Kheri, Raebareli, Siddharthnagar andSaharanpur.
l The treatment facilities are available in all theMedical Colleges, District Hospitals andCommunity Health Centres of the State.
Shaharanpu r
Muzaf fa rnaga r
Ba re il ly
Shahjahanpu r
Khe ri
H ar do i
Unnao
Kanpu r(N agar )
Fa tehpu r
Raebare li
Luc kno wBarabanki
S itap ur
Ba hra ic hSraw asti
Ba lr am pur
Gonda
Fa izabad
S ul tanpur
Pra tapgar h
Al lahabad
Jaunpu r
Az am garhMau
Ghazipur
B al lia
Am bedka r N aga r
B ast iSant K ab ir N ag ar
Siddharthnaga r
M aharajgan j
Go rak hpurKush inagar
Deoria
Source: State Epidemic Cell, Department of Communicable Diseases, Health Department, Government of U.P.
Districtwise Incidence of Japanese Encephalitis District Cases Deaths CFRKushinagar 1110 269 24%Gorakhpur 1008 241 24%Maharajganj 611 167 27%Deoria 486 102 21%Siddharthnagar 370 96 26%Basti 276 67 24%Bahraich 241 20 8%Sant Kabir Nagar 239 52 22%Saharanpur 209 151 72%Kheri 167 38 23%Gonda 126 12 10%Raebareli 116 15 13%Balrampur 97 16 16%Lucknow 75 20 27%Shrawasti 65 1 2%Barabanki 63 16 25%Ambedkar Nagar 48 6 13%Sitapur 47 15 32%Sultanpur 23 6 26%Hardoi 20 2 10%Mau 18 6 33%Bareilly 17 3 18%Azamgarh 16 5 31%Unnao 11 4 36%Faizabad 10 3 30%Balia 9 2 22%Muzaffarnagar 9 9 100%Allahabad 7 2 29%Kanpur Nagar 7 0 0%Shahjahanpur 6 2 33%Pratapgarh 5 0 0%Jaunpur 2 2 100%Fatehpur 1 0 0%Ghazipur 1 0 0%UP 5516 1350 24%
Map 4.1

6 3 The Condition of Health
AIDS32. Unlike the common perception, AIDS is very
much a reality in Uttar Pradesh. There are at least 12districts in the state which are regarded as highprevalence districts of HIV (see Map 4.2). Vulnerabilityprofile of Uttar Pradesh for HIV / AIDS is very revealing.About half of the population is in the reproductive agegroup and literacy levels are extremely low. All this isaccompanied by high incidence of poverty and highgender disparity. This substantially raises thevulnerability quotient of Uttar Pradesh as far as HIV /AIDS is concerned. The ORG Marg mapping study revealsthat Uttar Pradesh has a large presence of high risksgroups. The state has 10 million migrants, 52,741 truckers(8 National Highways), 8,234 commercial workers (CSW)and approximately 9,000 intravenous drug users. A longporous Indo Nepal Border only adds to the vulnerabilityof the state. In October 2005 Uttar Pradesh had 2,248AIDS cases, of which 1,873 were men and 375 females.The table also reveals that 21 to 40 age groups is themost vulnerable and shows highest incidence of AIDScases in the state.
33. Efforts have been made by the state to meetthe looming threat of HIV / AIDS. In order to ensure bloodsafety, 145 blood banks were established andstrengthened in the state. Several voluntary counselingand testing centers (VCTC) have been established acrossthe state. At least 83 centers have been opened in theDistrict Hospitals, Medical Colleges and GovernmentOrganizations. These centers provide testing facility forsymptomatic cases; provide counseling facility (Pre / Posttest). They also motivate for change in high risk behavior.68 STD clinics are also functional across the state.
34. It is shocking to note that in the entire state,the awareness about RTI and STI level ranges between0.3 and 41 in different districts (DLHS RCH 2002 – 2004).At a time when AIDS is raising its ugly head in the state,such low awareness about STI / RTI only rings alarm bells.There are at least 20 districts in the state where lessthan 20% of the people were aware of STI / RTI. In allthere were at least 55 districts where awareness aboutSTI / RTI was lower than 40%.
Tuberculosis35. Tuberculosis is prevalent across all the districts
of the state. But prevalence of the disease is much higherin Western and Central U.P. While the detection rate isfairly poor, success in treating the cases is over 80 percent(see fig. 4.8 and 4.9). Sudden decline in detection rateduring 2004 – 2005 is very noticeable. Understandably,there is a strong case for improving our detection system.Given the infectious nature of the disease, people remainin danger of being exposed to the disease.
Table 4.1: Age wise, Sex wise ReportedAIDS Cases in U.P. , October 2005
Age Group Male Female Total
0-10 30 10 4011-20 33 10 4321-30 658 158 81631-40 869 156 102541-50 228 36 264Above 50 55 5 60Total 1873 375 2248
Source: UPSACS
Map 4.2
Source: UPSACS
DISTRICTS WITH HIGH PREVALENCE OF HIV / AIDS
• AGRA
• KANPUR
• LUCKNOW
• GONDA
• MAHARAJ GANJ
• GORAKH PUR
• AZAMGARH
• JAUNPUR
• ALLAHABAD
• MEERUT
• MIRZAPUR
• VARANASI
1
2 3
4 5
6
7 8
9 11
12
10

6 4Human Development Report, Uttar Pradesh
Figure 4.8 Case-detection (2001) and treatment success rates (2000) in RNTCP areas
0%
10%
20%
30%
40%
50%
60%
70%
80%
90%
100%
0% 10% 20% 30% 40% 50% 60% 70% 80% 90% 100%
Detection rate
Target Zone
Uttar Pr.
Orissa
Himachal Pr.Rajasthan
DelhiAssam
Madhya Pr.
Andhra Pr.
All states total
Maharashtra
West Bengal
Tamil NaduGujarat
BiharKerala
KarnatakaJharkhand
Haryana
Manipur
Treatment success of new smear-positive patientsregistered in 2000. Estimated % detection of newsmear-positive patients 2001
Fig. 4.9 National Annual Case Detection Rate and Treatment Success Rate from 2000 to 2005

6 5 The Condition of Health
IV. Maternal Morbidity36. Over the years different national surveys like
National Family Health Survey (NFHS) and Reproductiveand Child Health Survey (RCHS) have suggested that thereis very high incidence of “abortion complications”,“pregnancy complications”, “delivery complications” and“post delivery complications”. Equally sad part of thetruth is that a large number of households in the statedo not seek treatment for reproductive morbidity. Thepregnancy complications show a very even distributionacross the state. Relatively, however, western andeastern regions record a higher incidence of pregnancycomplications. Also, pregnancy complications are muchhigher than both the post delivery complication anddelivery complication. Even post delivery complicationsseem to outnumber the delivery complication all acrossthe state.
37. The western region also shows fairly highincidence of pregnancy and post pregnancycomplications. However, only small proportion of ladiesactually seek any kind of treatment for thesecomplications. Much of the trend which is being observedin different regions of the state remains relativelyunchanged over a long period of time suggesting strongbehavioural pattern and attitudinal issues behind suchscenario.
Antenatal Care38. Antenatal care can contribute significantly to
the reduction in maternal morbidity and infant mortality
because it includes pregnancy related health care andadvice on the correct diet and the provision of iron andfolic acid tablets to pregnant women. Improvednutritional status, coupled with improved antenatal care,can help reduce the incidence of low birth weight babiesand thus reduce prenatal, neonatal and infant mortality.In UP, only about half of the total pregnant women getANC services. Only around 11% of the eligible populationget full antenatal care. while the corresponding figurefor Tamil Nadu was 75% and for Kerala it was 85%. In1998 only 35% of the mothers received any ante natalcare (NFHS II). This jumped to 67% in 2005 (NFHS III). Inthe urban areas, ante natal care rose from 63% to 79%,while in the rural areas, it jumped from 29% to 64%.14.6% of mothers had at least three ante natal care visitsin 1997-98 (NFHS II) in 2005 this jumped to 26.3% (NFHSIII).
Fig. 4.10
Fig. 4.11 Full ANC

6 6Human Development Report, Uttar Pradesh
Fig 4.11 captures the ante natal care acrossdistricts of the state. RCH – DLHS data clearly revealsthat in 27 districts less than 3% of women received fullantenatal care. In another 32 districts only 3% to 7% ofthe women received full antenatal care. Ghaziabad andLucknow were the only two districts where more than10% women received full ante natal support (LHS – RCH2002-04).
39. It is revealed that in different districts around30% to over 82% women get some antenatal care. Vastdifferential between full antenatal care and someantenatal care implies that we do have access to thesepregnant mothers are not able to provide them withadequate care. It also implies that with some effort thecircumstances can be easily altered to improve the healthcircumstances. The percentage of those who receivedtetanus toxoid (TT) injections increased from 37 percentin 1992-93 to 51 percent in 1998-99 (NFHS-2). StateGovernment’s ‘Campaign Approach’ seems to haveyielded results. The percentage of women who receivediron and folic acid tablets for 90 days increased from8.5 percent in 1997-98 to 20.7 percent in 2005 (NFHSIII). The utilization of antenatal services is higher amongyoung women (age 15-34) than among older ones (age35-49).
40. An analysis by place of residence shows thaturban women utilize antenatal services much more.Similarly, more educated women are much more likelyto utilize antenatal care services, than less educatedwomen. Education is also positively associated with thelikelihood of getting care from the doctors. Theproportion of those who received the antenatal care from
doctors is 17% for illiterate women and 60.5% for womenwith at least High School education. Only in Lucknow,Kanpur Nagar, Gorakhpur and Ballia more than 48%women had three check-up during pregnancy period.State Government’s ‘Campaign Approach’ seems to haveyielded results. In nine districts less than ten percentwomen received such checkups and in another 32 districtsless than 25% women got three check-ups. In other words,a large majority of women do not receive appropriateantenatal check-up in the state. This naturally hassignificant implication for mortality and morbiditycondition in the state.
Safe Delivery41. Safe delivery is another area of urgent
attention. There were only six districts of the state wheremore than 45% of the women had safe delivery (NFHSIII). Figure 4.12 captures the safe delivery scenario indifferent districts of the state. Ghaziabad, Balia andLucknow are the only three districts which record over50% safe deliveries in the state. Equally relevant is thefact that in different districts of UP only 03 to 42% ofthe women were actually visited by ANMs and otherhealth workers.
42. From the standpoint of child survival and healthof the mothers, it is advantageous for the birth of thebaby to take place under proper hygienic conditions withthe assistance of a trained medical practitioner.Percentage of institutional deliveries increased from 11percent in 1992-93 to 15 percent in 1998 and further to22% by 2005 (Fig. 4.13). In the urban areas it improvedfrom 37% to 40% while in the rural areas it rose from 11%
Figure 4.12

6 7 The Condition of Health
to 18%. The percentage of births that took place inmedical institutions is about five times higher in urbanareas than in rural areas.
Figure 4.13
43. Inequity in utilization of the institutionaldelivery services available is another very importantissue. It becomes even more important given the factthat state is putting significant emphasis on institutionaldelivery. Only 8% of the mothers who had institutionaldelivery came from the lowest quintile of the population,11% from the second lowest quintile while 46.6% of themothers came from the highest income quintile (Fig.4.14).
8.011.0
16.2
25.2
46.6
0.05.0
10.015.020.025.030.035.040.045.050.0
Q1 Q2 Q3 Q4 Q5
Figure 4.14 Percentage of Mothers Who DeliveredChild in Any Health Facility in UP 2005
Source: Futures Group-ITAP, Reproductive Health IndicatorSurvey, Uttar Pradesh, 2005
44. Similar inequity is observed in terms ofassistance received from health professional duringdelivery (Figure 4.15). Only 12.5% of the deliveries inthe lowest income quintile were supported by any healthprofessional. 16.5% of the mothers who received anyhealth professional’s support came from second lowestquintile while 58.9% of the mothers who receivedassistance from any health professional in the state camefrom the highest income quintile.
45. Trained personnel provide assistance to aroundone-fourth of the total deliveries in the state i.e. 29% ofthe deliveries (NFHS III (2005). Three-fourths of deliveriesare attended in unhygienic conditions at home. Only
12.516.5
22.9
35.3
58.9
0
10
20
30
40
50
60
70
Q1 Q2 Q3 Q4 Q5
Source: Futures Group-ITAP, Reproductive Health IndicatorSurvey, Uttar Pradesh, 2005
Figure 4.15 Percentage of Mothers whose Deliverywas assisted by any Health Professional in UP
24.9% of pregnant mothers received antenatal care fromDoctors. 13.9 % from ANM/LHV; 6.0 % from TBAs, 8.5 %from others and 49.2 % mothers received no antenatalcare (NFHS III (2005). It is, therefore, that Uttar Pradesh’shealth scenario is marked by a very high degree ofreproductive morbidity and mortality. This lack of supportfrom trained medical professionals and unhygienicreproductive and health care environment presents agreat human development challenge before us.Substantial efforts are required to improve the qualityof maternal and child health care in the state. Therelationship between safe delivery and attendance bytrained medical professional (including Dai) works outto be very strong. In comparison, the relationship withinstitutional deliveries is found to be insignificant.
V. Immunization46. Efforts are being made to strengthen routine
immunization by usage & disposal of auto destructiblesyringes, community mobilization by volunteers, specialIEC activities, alternate vaccine delivery system,strengthening of cold chain etc. Special routineimmunization campaigns (RI weeks) are being organizedto cover children in unreached, difficult to reach,underserved areas as well as to cover drop out childrenfrom the month of Nov. 07. Four such rounds are plannedup to March, 2007.
47. Percentage of children who were fullyimmunized increased substantially from 20 percent in1992-93 (NFHS-1) to 42 percent in 1998 (RCHS). At thesame time, children not getting any vaccination declinedfrom 43 percent to 30 percent. Diarrhea deathsaccounted for a significant proportion of all dehydration-related deaths. These could have been prevented byprompt administration of rehydration solutions (ORS).However, only 36 percent (RCHS, 1998) of mothers haveever used ORS packets or were recommended homesolutions to overcome problems of dehydration. Nearly

6 8Human Development Report, Uttar Pradesh
71 percent of all children under-3 years of age have iron-deficiency anemia. Interestingly, western region recordslowest proportion of children who received completeimmunization. Even the proportion of children recordingpartial immunization is found to be low in western UP.Eastern and central region present a much betterscenario. It needs to be mentioned that while westernregion has a very high concentration of private providers,it lags behind in terms of public sector providers. Asmuch of the immunization is the result of public sectordriven campaigns, eastern and other regions seem tohave performed much better.
48. Vaccination against diseases has substantiallyimpacted life expectancy as well as child and infant
Figure 4.16
Source: DLHS – RCH survey 2002 - 04
mortality across the world. In UP however a large numberof children receive no vaccination at all. The change invaccination coverage is a meager 3% between 1997 and2005 (Figure 4.16). The vaccination level in the ruralareas is even more challenging than the state average.Intra state variations across different districts of the stateare also very significant. The percentage of children aged12 to 35 months who did not receive any vaccinationranges between 30% to 54% in different districts of thestate. In at least 10 districts of the state more than 45%of the children did not receive any vaccination (RCH 2002-04). In at least 19 districts less than 20% of the childrenreceived complete vaccination (Figure 4.17).Interestingly Deoria, a poor district in Eastern UP,emerges as the only district where over 50% of thechildren received full vaccination. Even the districtswhere over 40% children received full vaccination arefew and far between.
49. On the whole the state shows significantvariation in health related burden and disability acrossregions and income groups. Both the rich and poor facea very high burden of health related disability. However,the poor and women seem to be at a greaterdisadvantage, the incidence of IMR alone is found to betwo and a half times higher amongst the poor. At thesame time much lesser proportion of public resourcesare spent on the bottom 20% of the population, incomparison to what is spent on the top 20 %.
Fig. 4.17: Fully Vaccinated Children (in%)
6 9 The Condition of Health
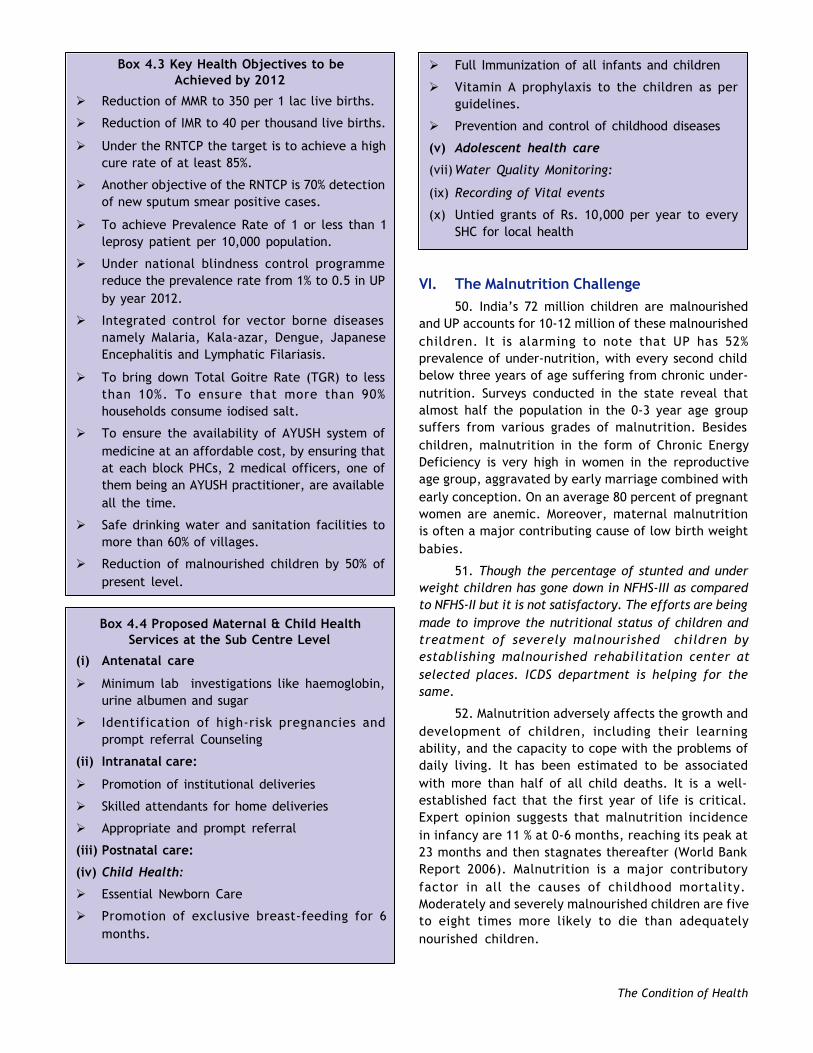
Box 4.3 Key Health Objectives to beAchieved by 2012
Ø Reduction of MMR to 350 per 1 lac live births.
Ø Reduction of IMR to 40 per thousand live births.
Ø Under the RNTCP the target is to achieve a highcure rate of at least 85%.
Ø Another objective of the RNTCP is 70% detectionof new sputum smear positive cases.
Ø To achieve Prevalence Rate of 1 or less than 1leprosy patient per 10,000 population.
Ø Under national blindness control programmereduce the prevalence rate from 1% to 0.5 in UPby year 2012.
Ø Integrated control for vector borne diseasesnamely Malaria, Kala-azar, Dengue, JapaneseEncephalitis and Lymphatic Filariasis.
Ø To bring down Total Goitre Rate (TGR) to lessthan 10%. To ensure that more than 90%households consume iodised salt.
Ø To ensure the availability of AYUSH system ofmedicine at an affordable cost, by ensuring thatat each block PHCs, 2 medical officers, one ofthem being an AYUSH practitioner, are availableall the time.
Ø Safe drinking water and sanitation facilities tomore than 60% of villages.
Ø Reduction of malnourished children by 50% ofpresent level.
Box 4.4 Proposed Maternal & Child HealthServices at the Sub Centre Level
(i) Antenatal care
Ø Minimum lab investigations like haemoglobin,urine albumen and sugar
Ø Identification of high-risk pregnancies andprompt referral Counseling
(ii) Intranatal care:
Ø Promotion of institutional deliveries
Ø Skilled attendants for home deliveries
Ø Appropriate and prompt referral
(iii) Postnatal care:
(iv) Child Health:
Ø Essential Newborn Care
Ø Promotion of exclusive breast-feeding for 6months.
Ø Full Immunization of all infants and children
Ø Vitamin A prophylaxis to the children as perguidelines.
Ø Prevention and control of childhood diseases
(v) Adolescent health care
(vii) Water Quality Monitoring:
(ix) Recording of Vital events
(x) Untied grants of Rs. 10,000 per year to everySHC for local health
VI. The Malnutrition Challenge50. India’s 72 million children are malnourished
and UP accounts for 10-12 million of these malnourishedchildren. It is alarming to note that UP has 52%prevalence of under-nutrition, with every second childbelow three years of age suffering from chronic under-nutrition. Surveys conducted in the state reveal thatalmost half the population in the 0-3 year age groupsuffers from various grades of malnutrition. Besideschildren, malnutrition in the form of Chronic EnergyDeficiency is very high in women in the reproductiveage group, aggravated by early marriage combined withearly conception. On an average 80 percent of pregnantwomen are anemic. Moreover, maternal malnutritionis often a major contributing cause of low birth weightbabies.
51. Though the percentage of stunted and underweight children has gone down in NFHS-III as comparedto NFHS-II but it is not satisfactory. The efforts are beingmade to improve the nutritional status of children andtreatment of severely malnourished children byestablishing malnourished rehabilitation center atselected places. ICDS department is helping for thesame.
52. Malnutrition adversely affects the growth anddevelopment of children, including their learningability, and the capacity to cope with the problems ofdaily living. It has been estimated to be associatedwith more than half of all child deaths. It is a well-established fact that the first year of life is critical.Expert opinion suggests that malnutrition incidencein infancy are 11 % at 0-6 months, reaching its peak at23 months and then stagnates thereafter (World BankReport 2006). Malnutrition is a major contributoryfactor in all the causes of childhood mortality.Moderately and severely malnourished children are fiveto eight times more likely to die than adequatelynourished children.

7 0Human Development Report, Uttar Pradesh
Map 4.3
Map 4.4
Source: Plan Document 2007-2008, Planning Department, U.P.

7 1 The Condition of Health
53. NFHS data suggests that stunting declined from56 to 46 during 1997–2005; wasting rose from 11% to14.5%; and percentage of underweight children declinedfrom 52% to 47% during the same period (Fig. 4.18).
Figure 4.18
54. Gender-wise segregation of data shows thatalthough there is not much difference in the overallmalnutrition status of boys and girls, there areperceptible regional variations across the state. In caseof boys, a majority of districts across the central,eastern, western and bundelkhand regions reported ahigh prevalence of malnutrition (it ranged from 60% to96.3%). Ironically, only Ghaziabad and Pilibhit have lessthen 65% prevalence of malnutrition among boys. therewere at least seven districts in the state where morethan 90% of the boys were malnourished (RCH Survey2002-04). As far as malnutrition amongst girls wasconcerned, a majority of districts across the central,eastern, western and bundelkhand regions reported ahigh prevalence of malnutrition (ranging from 54.5% to95%). There were at least three districts namelyGhaziabad, Farrukhabad and Mainpuri where less than65% of the girls were malnourished. On the other handin 12 districts of the state more than 90% of the girlswere malnourished (RCH Survey 2002-04).
55. Besides the normal malnutrition challenge, UPalso suffers from micronutrient deficiency. Micronutrientdeficiencies are widespread in India. More than 75percent of preschool children and mothers suffer fromiron deficiency anemia (IDA) and 57 percent of pre-schoolchildren have sub-clinical Vitamin A deficiency (VAD).Iodine deficiency is endemic in 85 percent of districts.
Breast Feeding56. Researches suggest that early initiation of
breast-feeding within two hours of birth may protectagainst neonatal mortality. Breast-feeding protects theneonate against several infections including diarrhea andrespiratory infections, and saves lives. An exclusivelybreast-fed infant is about 14 times less likely to die fromdiarrhea, 3 to 4 times less likely to die from respiratory
disease and 2 to 3 times less likely to die from otherinfections than a non-breastfed infant; early initiationof breast feeding may promote maturation of thedigestive tract and protect against infection; and thebody warmth associated with breast-feeding may avertinfant death from hypothermia. Also, breast milk is muchmore economical than artificial milk or powdered milkfood. The average cost of feeding a six-month-old infantfor one month on infant formula may even be equal tothe average monthly per capita income for many families.
57. Exclusive breast-feeding exerts strongcontraceptive effect in the first 4-6 months post partum.Moreover, maternal benefits include early terminationof post partum bleeding and protective effect againstbreast and ovarian cancer. Breast-feeding is particularlyrelevant for developing countries like India whereneonatal and infant mortality rates are high, most womendo not exclusively or predominantly breast-feed theirinfants for the first six months, and delay of initiation ofbreast-feeding beyond the first day of life is common.Breast-feeding is a universal phenomenon, but in theIndian scenario, very few children are put to this practiceimmediately after birth. DLHS NFHS shows that despiteseveral programs aimed at educating and sensitizing thecommunity on the benefits of early initiation andexclusive breastfeeding, 20 districts (Baghpat, Badaun,Ferozabad, Farrukhabad, Kannauj, Etawah, KanpurDehat, Unnao, Shrawasti, Gonda, Fatehpur, Banda,Siddharth Nagar, Sant Kabirnagar, Ambedkar Nagar,Allahabad, Kaushambi, Bhadohi, Varanasi and Chandauli)reported less than 5% of women who immediately breast-fed their baby within 2 hours of birth. Only 6 districts inthe western region namely, Ghaziabad, GautamBuddhanagar, Rampur, Bulandshahr, Aligarh andShahjahanpur reported more than 15% of women whoinitiated breast-feeding early i.e. within two hours ofbirth.
58. Colostrum is the initial breast secretion andconsidered to be the nutritionally rich that providesnatural immunological protection to the newborn. It isa complex food, rich in nutrients and non-nutritionalbioactive components, which promote infant health,growth and development. Practice of colostrum feedingis significantly associated with early initiation of breast-feeding. Unfortunately prevailing cultural practices likegiving pre-lacteals and discarding colostrum delay theinitiation of breast-feeding to the newborn. In differentdistricts of the state 36% to over 80% of the mothersfirst squeeze off the colostrum before feeding theirchildren. An alarmingly high percentage (more than 80%)of children in 23 districts of central, western andBundelkhand region of the state were denied colostrumas their mothers squeezed off the first milk beforebreastfeeding. In another 24 districts 65% to 80% of thechildren are denied colostrum. In only four districtsnamely, Shrawasti, Balrampur, Siddharth Nagar and Sant

7 2Human Development Report, Uttar Pradesh
Kabirnagar, mothers of less than 50% children discardedcolostrum before breast-feeding their newborns.
59. Malnutrition among children is one of thebiggest public health problems in Uttar Pradesh. Itadversely affects the growth and development ofchildren, including their learning ability, and the capacityto cope with the problems of daily living. Every sixthundernourished child in India lives in UP and every secondchild in UP is undernourished. It is a sad reminder thatUP ranks fourth with respect to prevalence ofunderweight children in India. The scenario on otherindicators is no better.
60. Efforts in last few years have yielded someresults. Child development parameters such as IMR,malnutrition, low birth weight, immunization, Vitamin-A supplementation, exclusive breast-feeding, andcomplementary feeding etc, have shown improvement.Nonetheless, challenge at hand is phenomenal and callsfor strategic interventions and focused approach. Districtlevel data shows that the challenge is much bigger incertain pockets and particular districts. This underlinesthe need for targeted interventions.
VII. Safe Drinking Water & Sanitation61. World Health Organization estimates suggest
that about 80% of all sickness and diseases are linked tothe poor drinking water and sanitation conditions. 1.5million children in the age group of 5 years and less dieevery year due to lack of safe water and proper sanitationin India. Infant Mortality Rate can be brought downsubstantially if safe water and proper sanitation isprovided to the population.
62. Adequate availability of safe, potable drinkingwater is a top policy priority for the state government.The policy requires supply of domestic water as pernorms, which differ for types of habitations and locations.The norms at present are 70 lpcd for small towns (up to20,000 population), 135 lpcd for towns with a populationbetween 20,000 and 5 lakh and 150 lpcd for cities ofover 5 lakh population. The norm for the rural area is 40lpcd with one source for 150 persons. Under TotalSanitation Programme, this supply can be extended upto 70 lpcd.
63. The coverage of safe drinking water source inU.P. is quite satisfactory. According to a 2004 surveyreport of UP Jal Nigam, among the 2,60,110 habitation,2,33,341 (89.4%) rural habitations have been coveredwith potable water supply (40 lpcd) by providing onesafe source (hand pumps or piped water) for 150 personswhich is serving 78% of the state population (13.0295crore). Despite this good progress, four districts stillhave more than 25% habitations which are not fullycovered, namely, Bulandshahr (35%), Lakhimpur Kheri
(32.3%), Ambedkar Nagar (29.7%) and Mathura (25.9%).The coverage is satisfactory in the western, central andthe Bundelkhand regions of the state. But the same isnot the case with the eastern part of the state.
64. Out of the total sources, 1.5% have waterquality problem. 26.68 lakh people living in habitationswith `quality problem’ are yet to have access to safedrinking water. There are five districts which have morethan 5% affected drinking water sources. Unnao ranksfirst in this list as 17.6% sources have quality problems,followed by Mathura where this percentage is 14.7.Similarly, Kushinagar, Mau and Gautam Buddhanagar have5% to 8% affected water sources. Besides, 22 districts ofthe state have average water quality problems. In theremaining 43 districts, there is no major qualityproblem.
65. Government of Uttar Pradesh is signing aMemorandum of Understanding (MoU) with GoI forunderscoring its commitment to reforms in water andsanitation sector (Box 4.5). National Rural Drinking WaterQuality Monitoring and Surveillance Programme hasalready been launched in the State. Industrial ToxicologyResearch Centre is the state referral institute forproviding technical support. Health inputs are beingprovided by Social Preventive Medicine Department,KGMU. Jal Nigam is responsible for providing field testkits, H2S Strips and managing district level laboratoriesin all districts. Under NRHM Village Health, Water &Sanitation committee have been constituted under thechairmanship of Gram Pradhan, Members of thecommittee are AWW, ANM, ASHA, Local Dai and habitantsof local areas. The committee is also being provided anannual cash assistance of Rs. 10,000/- for local healthactivities and preparation of Village Health Plan.
66. Sanitation, however, is a problem area in UP.Out of the 70 districts of the state, only 30 have morethan 33% sanitation coverage. The problem in 40 districtsis severe. Agra, Azamgarh, Bareilly, Chitrakoot, DeviPatan, Faizabad, Kanpur, Gorakhpur and Lucknowdivisions have majority of low coverage districts. In 1999the policy moved from the Rural Sanitation Program(CRSP) to the Total Sanitation Campaign (TSC) thatadopted a demand driven approach, the emphasis wason information, education and communication (IEC),capacity development, community leadership,acceleration of rural sanitation coverage, covering allrural school with sanitation facilities. The TSC programgot going in1999-2000 in four districts of the state. By2003-04, all the 70 districts had been taken up but theprogress has been slow. Till March 2006, only 33%coverage could be achieved and full coverage isexpected not before 2012. This deadline needs to beadvanced.

7 3 The Condition of Health
Box 4.5: Reforms in Water & SanitationSector in Uttar Pradesh
Government of Uttar Pradesh is signing aMemorandum of Understanding (MOU) with GOIunderscoring its commitment to reforms in water andsanitation sector. The salient features are:
1. State Government and the Panchayati RajInstitutions realize their Constitutional obligationto (i) provide access to safe drinking water torural population; and (ii) ensure that all segmentsof society, are imparted basic knowledge and aresupported in the use of this knowledge, forimproving health and reducing poverty.
2. The State Government is committed to followthe parameters of Centrally Sponsored schemespertaining to rural Drinking Water and Sanitationsector, including the following priorities forcoverage of rural habitation:-
(i) Meeting the Bharat Nirman targets :
(a) All water Quality affected habitations areproposed to be covered in 11th Plan.
(b) All the slipped back/newly emergedhabitations are to be covered with safewater supply in 2006-07.
(ii) Habitations inhabited exclusively by SC/ST orhaving more than State average SC/ST populationare being covered under priority. Habitations withover 50% SC/ST population, cash contribution willnot be mandatory. Community contribution maybe either in the form of cash / labour / material/land. State may provide 50% subsidy.
(iii) The State Government commits itself to thefollowing reform principles in the Water Sectorand to promote Swajaldhara (demand responsiveand community based) throughout the State:-
(a) Adoption of a demand-responsive approachalong with community participation basedon empowerment of villagers.
(b) Legal ownership, and responsibilities forpublic drinking water and environmentalsanitation assets to be with the VillageWater and Sanitation Committee;
(c) VWSCs to have the powers to plan,implement, operate, maintain and manageall water supply schemes,
(d) The community contribution of 10% to 25%envisaged.
(e) 100% responsibility of Operation andMaintenance (O&M) by the users. Cost ofO&M to be borne by users.
(f) Linkages between water supply, sanitation
and hygiene are recognized and reflectedin policies and plans
(g) The monitoring of water quality (to ensurethat it is safe) is the responsibility of thesupplier i.e. the Panchayats. The VillageWater and Sanitation Committee will beresponsible for water quality monitoringand surveillance;
(h) Each water supply scheme will incorporateconservation measures
(j) Enabling men and women to participateequally in all decision making and controlof assets
(k) Enabling the participation of the poor andmarginalized in all decision making,
(l) Establish effective coordinationmechanisms with the Health and EducationDepartments, at all levels;
3. The State government is committed to attain fullsanitation coverage in the rural areas by the endof 11th Plan.
67. Still there are many challenges in the field ofwater and sanitation, including contamination of watersources; habits; supply; and availability of resources.However, the efforts in recent past do inspire hope.Particularly the kind of partnership and synergy whichgovernment and organizations like UNICEF have forgedseems to be the right path forward. Equally importantare the emerging stories of community partnership andownership of water and sanitation efforts (see Box 4.6).
Box 4.6: Nirmal Gram Puraskar - An Awardfor bringing in dignity and quality in life
Promotion of sanitation was very close to theheart of Mahatma Gandhi who always believed that'Cleanliness is next to Godliness'. The initial impetusgiven by him has been translated in many sanitationprogrammes. In 1999, reform principles were adoptedand allocation made to a demand driven andcommunity-based programme named Total SanitationCampaign (TSC).
TSC is implemented in a decentralized modeand, therefore, involvement of PRIs is central to theprogramme. Recognizing the role of PRIs and with aview to motivate them an incentive scheme calledNirmal Gram Puraskar (NGP) was initiated byGovernment of India.
His Excellency, President of India, Dr. A.P.J.Abdul Kalam gave the NGP awards for the year 2005-06 to 40 gram panchayats from the state on 23rd March2006 at Vigyan Bhawan, New Delhi. Wide spread

7 4Human Development Report, Uttar Pradesh
dissemination of message of cash award and honourgiven to GPs have had a tremendous impact on ruralcommunity and in 2006-07, 1296 GPs from across theState have submitted their proposal for award and488 have finally been selected.
NGP has already given a positive boost to thesanitation drive across the State and will prove crucialto make Uttar Pradesh an ‘open defecation free’ stateby 2012. Now the Gram Pradhans of NGP awardwinning GPs are serving as role model for other GPsand providing further boost to implementation of TSC.
VIII. Public Health Delivery System68. Uttar Pradesh has a large public sector health
infrastructure comprising one Super Specialty Institution(SGPGI), 7 government medical colleges & hospitals, 53District Hospitals, 13 Combined Hospitals, 388Community Health Centres, 823 block PHCs, 2817Additional PHCs apart from 20521 Sub Centres (Table4.2). Government has allowed private medical collegesto be set up in the state. Under this policy 3 medicalcolleges and hospitals have been opened. In addition,4913 private hospitals / nursing homes have beenestablished. There are a large number of registeredand non-registered medical practitioners in the State,who are practicing in the state and they play animportant role in providing medical service to the ruralpopulation.
69. However, the physical health infrastructure inthe State is still much below the country average. For
Table 4.2: Health Infrastructure in U.P.
Urban Areas Rural Areas
Type of Facility Number Type of Facility Number
Super Specialty Institute 5* CHCs 315
Medical Colleges 7 - Govt.2 - Central Govt.
3- Private BPHCs 823
District Male/Female Hospitals 53 Additional PHCs+ BPHCs 3640
Combined Hospitals 13 Rural PPCs 147
Urban FW Bureau 5 Sub Centres 20521
Urban FW Centres 61
Health Posts 136
District Level PPCs 63
*1 super specialty institute, SGPGI, is functional at Lucknow, 4 institutes are in the process of being set up.
instance, the population covered by a Sub-centre in theState is 7080 and the average distance is 3.4 km., whilethe country average is 5109 and 1.3 km. It is estimatedthat 11% of people in Uttar Pradesh are not able to accessmedical care due to locational reasons. Further, evenwhen accessed, there is no guarantee of sustained care.Several other deterrents such as bad roads, unreliabilityof presence of the health provider, costs of transportand wages foregone, etc. make it cheaper for a villagerto get treatment from the local quacks.
70. Fig 4.19 and Fig 4.20 show the utilization ofinpatient and out patient care in the state. It is shockingto find that only around 10% of the people seek outpatientcare from public facilities in rural Uttar Pradesh. Againstthis at the national level the percentage of peopleseeking outpatient care from public facilities is 22% inthe rural areas. In the urban areas, only 13% of the peopleseek outpatient care from public facilities against thenational average of 19%.
71. The role of public facilities in patient care issomewhat better. In rural UP, 27% of the people seekinpatient care from public sector against a nationalaverage of 42%. In urban areas the state picture is veryclose to the national picture. 31% of the people seekinpatient care from public sector facilities against thenational average of 38%. It need be noted, however, thatthe rural facilities like CHC and PHC have 30 beds and 6beds respectively hardly ten per cent of this facility isutilized. Thus, there is much scope for improvedinpatient care in public facilities if bed utilization canbe improved.

7 5 The Condition of Health
Out-patient services in rural areas
1022
9078
0%
10%
20%
30%
40%
50%
60%
70%
80%
90%
100%
UP India
Private
Public
Out-patient services in urban areas
13 19
87 81
0%
10%20%30%40%50%
60%70%80%90%
100%
UP India
Private
Public
Fig 4.19: Utilization of Out-Patient Services in Public and Private Sector
Source: Ministry of Statistics and Program Implementation, NSS 60 round (Jan-Jun, 2004)th
Inpatient services in rural areas
2742
7358
0%
10%
20%
30%
40%
50%
60%70%
80%
90%
100%
UP India
Private
Public
Inpatient service in urban area
31 38
69 62
0%10%
20%
30%
40%50%
60%
70%
80%
90%
100%
UP India
Private
Public
Fig 4.20 Utilization of Inpatient Services in Public and Private Sectors
Source: Ministry of Statistics and Program Implementation, NSS 60 round (Jan-Jun, 2004)th
IX. Human Resources Requirements
72. Severe shortage of manpower at all levels inthe public health delivery system stands out as a majorproblem in public health delivery system (Table 4.3).Every health functionary is under a lot of pressure onaccount of the large numbers that he is expected to
serve. This has a direct bearing on the quality of servicesrendered and uptake of services. The ratio of doctorsper thousand population for U.P. is much below thenational figure of 1 and although the ratio of beds isalmost the same as the all India figure of 0.7, theirgeographical distribution is highly skewed in favour ofthe urban areas.

7 6Human Development Report, Uttar Pradesh
Table 4.3: Number of Medical and Paramedical Staff
Human Resource Sanctioned Filled
Medical Officers
Male (General) 6468 4940
Male (Specialist) 4128 3694
Female (General + Specialist) 1740 1319
Paramedical Staff
Pharmacist 6542 5435
Staff Nurse 4948 4018
ANM 23656 21944
Optometrist 931 830
Lab. Technician 2119 1431
X-Ray Technician 544 452
Dark Room Assistant 193 108
Physiotherapist 19 19
Source: Department of Medical & Health, GoUP
73. The situation is grave in terms of requirementof medical personnel vis a vis their availabilty, speciallyin case of doctors and specialists. Table 4.4 shows theestimated number of health facilities and healthcarepersonnel required for providing primary health careservices in rural areas based on the population normsfor health facilities.
74. Although the State has a large presence ofprivate health providers, it is mostly concentrated inthe urban areas and is largely focusing on curativeaspects. A survey of hospitals in the private sector,commissioned by the Government of UP, revealed that
there are 2,592 private hospitals with total bed capacityof 47,269. There are 2,321 general hospitals that accountfor 92.4 percent of beds in the private sector, 201 nursinghomes with 2,506 beds that offer maternal and childhealth services exclusively, and 70 hospitals with 1,010beds that offer specialty services (UPHSDP ProjectImplementation Plan, Vol. 1, 2000).
75. Total number of doctors and hospital beds,both public and private sector combined, are shown inTable 4.5.
76. The magnitude of various private healthproviders in the State is given in Table 4.6.
Table 4.4: Estimated Number of Medical Professional Required
Description Sub-Centre PHC CHC(1 per 5000 (1 per 30,000 (1 per 1 lakhpopulation) population ) population) Total
Number of Facilities 28940 4823 1447 -
Doctors - 9646 7235 16881
Staff Nurse - 14469 11576 26045
BHW - Male 28940 4823 1447 35210
BHW - Female 28940 4823 1447 35210
Pharmacist - 4823 1447 6270
Lab. Technician - 4823 1447 6270
Note: Assuming a rural population of 144.7 million in 2006, considering a 2 per cent per annum growth over theCensus 2001 figure of 131.5 million
7 7 The Condition of Health
Table 4.5: Medical Practitioners and Beds Availability
Practitioners/Beds Government Sector Private Sector Total Ratio (Per 1000Population)
Allopathic Doctors 9950 29000 38950 0.2
Total Beds 54193 46269 100462 0.6(Urban-31646,Rural-22547)
Table 4.6: Private Health Providers in U.P., 2000-01
Hospitals Physicians & Nurses, Ayurveda Unani Homeo. Diag./Patho.Specialists Physiotherapists Labs.
(Allopathic) & Paramedical
4424 29000 53280 27042 5192 19861 5957
Source: National Commission on Macroeconomics and Health
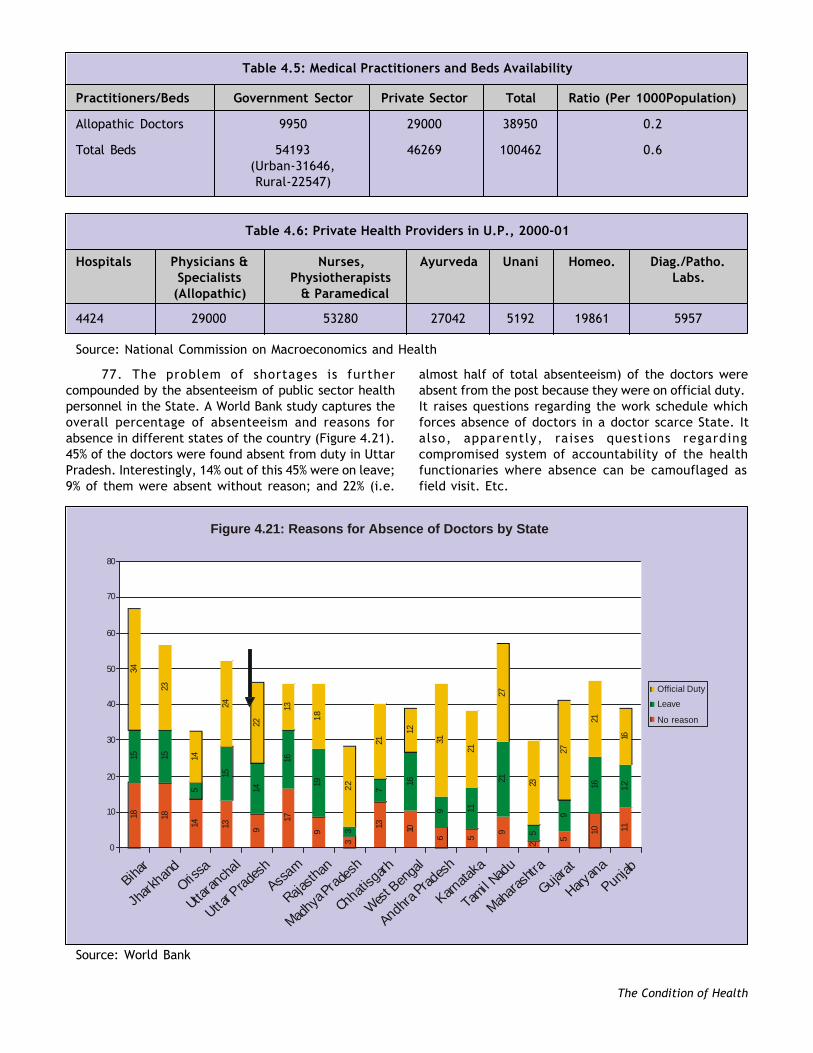
77. The problem of shortages is furthercompounded by the absenteeism of public sector healthpersonnel in the State. A World Bank study captures theoverall percentage of absenteeism and reasons forabsence in different states of the country (Figure 4.21).45% of the doctors were found absent from duty in UttarPradesh. Interestingly, 14% out of this 45% were on leave;9% of them were absent without reason; and 22% (i.e.
almost half of total absenteeism) of the doctors wereabsent from the post because they were on official duty.It raises questions regarding the work schedule whichforces absence of doctors in a doctor scarce State. Italso, apparently, raises questions regardingcompromised system of accountability of the healthfunctionaries where absence can be camouflaged asfield visit. Etc.
Source: World Bank
Figure 4.21: Reasons for Absence of Doctors by State
18 18
14 13 9
17
9
3
13 10
6 5
9
2 5
10 11
15 15
5
15
14
16
19
3
7
16
9 11
21
5
9
16 12
34
23
14
24
22
13
18
22
21
12
31
21
27
23
27
21
16
0
10
20
30
40
50
60
70
80
Bihar
Jharkh
and
Orissa
Uttaran
chal
Uttar Prade
sh
Assam
Rajasth
an
Madhya
Pradesh
Chhatisg
arh
West Ben
gal
AndhraPrad
esh
Karnata
ka
Tamil Nad
u
Mahara
shtra
Gujarat
Haryan
a
Punjab
Official Duty
Leave
No reason

7 8Human Development Report, Uttar Pradesh
78. The lack of proper human resourcedevelopment policies (lack of incentives, lack of in-service training, performance rating system, poormonitoring, etc.) contributes to low employee morale,indiscipline and poor performance. Similarly,inappropriate skills mix complicates the challengefurther, for example, a gynaecologist is posted at a CHCwhere there is no anaesthetist, results in underutilizationof skills. Likewise, transfers are often arbitrary andwithout adherence to any norms.
79. It needs be noted that there are 20,521 sub-centers in rural areas of the state. All sub-centers aremanned by one ANM. As per the plans afoot, soon everysub-centre will have two ANMs. In addition, the stateenvisages establishment of additional 7,000 sub-centersin the next five years in order to meet the IPHS norms.These additional 7,000 sub-centers will require additional14,000 ANMs (norm of two ANMs per sub-centre) in thecoming years. Accordingly we will have a gap of around34,000 ANMs in the coming five years.
80. This shortage needs to be appreciated in thebackdrop of the fact that availability of trained ANMs inthe state is almost negligible as the training centers havenot been conducting training since 1992. During 1992-2004, pre-service training of ANMs did not take place. Itwas only in 2004 that efforts were made and trainingwas restarted. At present there are 40 ANM trainingcentres in the state (each with a capacity 90 per batch).30 centers have been made partially functional. Problemof availability of PHN Tutors continues to be a majorchallenge and affects the quality of training. Also thereare 30 District Training Centers which are non-functionalat present and need to be reactivated. The trainingcapacity in these centres is detailed in Table 4.7.
81. Nursing care is an important component forquality medical care. The State has nine Nurses Trainingschools in government sector with capacity to train 453staff nurses each year and 2 training schools run byCentral Government with a training capacity of 44 staffnurses. Apart from these, there are 33 schools with atraining capacity of 1060 nurses in private sector.
82. Out of 813 blocks in the state, only in 399 blocksCommunity Health Centers are functioning. Construction
Table 4.7: Availability of Training Facilities for ANMs
# Training Centre No. of Training Capacity per Total CapacityCenters Centre per 18 months
1- ANM Training Centres 40 90 3600
2- District Training Centres 10 30 300
3- Approved Nursing Training Centers in Private Sector 20 60 1200
Total 70 5100
of 134 CHC’s is under progress. Each CHC has sanctionedposts of 3 staff nurses. In order to provide effectivemedical care and mother and child care services roundthe clock for 140 FRUs. The actual requirement is of 9Nurses per CHC as per IPHS Standards. Hence, 840additional nurses are required for existing 140 FRUs only.To facilitate round the clock delivery services at 270Block Primary / Community Health Centres, there is anadditional need of 810 nurses. Fortunately, many districtshave adequate bed strength for nurses training forestablishing Nurses Training schools.
X. Health Cost and Financing83. The financial burden of illness in Uttar Pradesh
is very high. While the policy is to provide free healthcare at the cutting edge the de facto situation is thatcare at PHCs is not free. Primary Health Centers arechronically short of medicines. Patients have to purchasemedicines from outside. Cost of transportation, absenceof doctors, wage earning losses, etc. also add up to thecost of health care. While the government chargesnothing and is, therefore, short of resources, the peopleend up either paying from their life time savings orborrowing to receive inappropriate care frominappropriate provider. The expenses on medical careand hospitalization continue to be a major reason forpoverty in Uttar Pradesh.
84. Average medical expenditure perhospitalization case in rural UP in the public sector isestimated at Rs.7648 (Table 4.8). This is more than twiceas much as the national average of Rs.3238. This doesnot include loss of household income. Even the cost inthe private sector is found to be much higher in U.P.than the national average. In the urban areas too thecost of health care in the public sector is much higher inU.P. than the national average. However, in the privatesector it comes out to be lower than the national average.The stronger presence of public sector facilities andlarger trust in the urban public facilities in the estimationof the people along with significant competition in theprivate sector seem to have ensured relatively cheaperprivate health care. Also significantly lower cost of publichealth care in urban areas vis` a vis` care in rural areasmay also have contributed to the process.

7 9 The Condition of Health
Table 4.8: Average Medical Expenditure Per Hospitalization Case In Rural And Urban UP And India
State Rural Urban
Public Private Loss of Income Public Private Loss of Income
U.P. 7648 9169 920 5144 10351 536
India 3238 7408 636 3877 11553 745
Source: NSS 60th Round (Jan-Jun, 2004)
85. Health care in UP is primarily financed byprivate spending with out of pocket accounting for over71% of the total expenditure. Total non public sectorspending accounting for 83% of the spending and thegovernment health care funding accounting for only 17%of the total spend (Figure 4.22).
Figure 4.22: Proportion of Private and Public Spending on Health
17%
71%
12%
0%
10%
20%
30%
40%
50%
60%
70%
80%
90%
100%
83% - Private spending
Other
Out-of-pocketexpenses
Governmenthealthspending
86. National Health Accounts estimates indicatethat the household sector spends Rs.17158 crore onhealth in UP whereas government spends only Rs.2650crore. In Kerala the house hold sector spends only Rs.8373crore, while in Tamil Nadu household sector spendsRs.3624 crore only. The above makes it amply clear thatit is not so much the shortage of resources as it is theinappropriate organization and flow of resources. Muchof the out of pocket expenses comes from the pocketsof ordinary citizens. He spends through his nose, oftenfalling into poverty and ends up getting inappropriatecare.
87. Table 4.9 gives the picture of monthlyexpenditure on health according to various rounds ofNSS for UP, Karnataka and India. In rural UP in 2003 non-institutional medical expenditure accounts for 6.6% ofthe total expenditure while institutional medicalexpenditure accounts for 1.9% of total expenditure. Noninstitutional expenditure in rural U.P. comparesunfavourably with such expenditure than the nationalaverage. In states like Karnataka such expenditure ismuch lower as compared with UP.
Table 4.9: Medical Expenditure (Rs.) as Percentage to Total Expenditure per Person per 30 Days
State Sector Item 59th Round 55th Round 50th Round
Jan03- July 99- July 93-Dec03 June 2000 June 94
1 2 3 4 5 6
Rural Medical (institutional) PCE (Rs.) 9.60 5.73 1.96 Percent 1.89 1.23 0.72
Medical (non-institutional) PCE (Rs.) 33.55 32.96 17.07 Percent 6.59 7.06 6.23
Uttar Pradesh Urban Medical (institutional) PCE (Rs.) 10.62 7.20 2.35 Percent 1.35 1.04 0.60
Medical (non-institutional) PCE (Rs.) 39.74 35.31 16.655.06 5.11 4.28
Rural Medical (institutional) PCE (Rs.) 10.50 6.68 3.19Percent 1.89 1.34 1.18
Medical (non-institutional) PCE (Rs.) 21.31 17.62 9.96 Percent 3.84 3.53 3.70

8 0Human Development Report, Uttar Pradesh
State Sector Item 59th Round 55th Round 50th Round
Jan03- July 99- July 93-Dec03 June 2000 June 94
1 2 3 4 5 6
Karnataka Urban Medical (institutional) PCE (Rs.) 10.77 16.36 4.57 Percent 1.12 1.80 1.08
Medical (non-institutional) PCE (Rs.) 29.76 27.10 10.63 Percent 3.10 2.97 2.51
Rural Medical (institutional) PCE (Rs.) 10.65 6.66 2.52 Percent 1.92 1.37 0.89
Medical (non-institutional) PCE (Rs.) 28.22 22.94 12.76 Percent 5.09 4.72 4.53
All-India Urban Medical (institutional) PCE (Rs.) 16.49 12.33 5.54 Percent 1.61 1.44 1.21
Medical (non-institutional) PCE (Rs.) 43.71 30.95 15.51 Percent 4.28 3.62 3.39
Source: NSS Various Rounds
88. In urban UP too the non institutionalexpenditure is found to be significantly higher. In absolutesense the expenditure in UP is lower, however, inpercentage terms it is found to be higher. This onlysuggests the higher actual burden on the poor familiesand also highlights the need for public intervention bythe welfare state. The resources which are now availableto the state under National Rural Health Mission (NRHM)may well be used to ameliorate this challenge.
XI. Concluding Remarks89. The above analysis of the health situation in
Uttar Pradesh shows that people of the state continueto suffer from serious health deficiencies which stemlargely from maternal health, low birth weight,malnutrition, inadequate psycho-social stimulation anddisability. These factors are compounded by otherenvironmental and social factors such as gender andcaste, inadequate family and community support andpoor quality of service delivery in health care.
90. Moreover, there are wide variations across thestate as are evident from the inter-district comparisons.There are districts in the state where the current statusis much below the 1990 level, which was taken as thestarting point for MDGs. The circumstances are worse inthe districts falling in the tarai region of the state. It isalso found that in most of the cases the districts andregions that perform poorly on one indicator repeat thepoor performance on most related indicators, reflectinga cumulative and concentrative pattern of disadvantage,which is indicative of a definite interdependence ofoutcomes.
91. Morbidity as well as mortality challenge in thestate has several dimensions. The task ahead in terms of
curtailing these incidences is huge by any standard. Thestate is trailing behind substantially in achieving theMillennium Development Goals. If the scenario is to bepositively affected then morbidity circumstances willhave to be targeted with focus on the lagging districtsand social groups.
92. The state is striving hard to overcome thesechallenges. The decline in infant and child mortality ratefor the past few decades are traceable to governmentsponsored preventive health initiative, includingimmunization camps, installation of clean water pointsin rural areas, etc. Nonetheless, it seems to be a longjourney before the objectives can actually be achieved.Although in many of the cases the solutions may actuallybe simple, often it is lack of awareness which makes it abigger challenge than what it normally should be.
93. The task of meeting the health challenges istoo big to be handled by the government alone. Theprivate sector has to play a key role in the delivery ofhealth services in U.P. However, there is lack of standardsand quality assurance systems in both public as well asprivate sectors. Virtually, there is no effective regulationin the private sector. The private sector provides noinformation about its performance and has no systemfor patient protection or fair pricing. There is absolutedearth of information regarding how well private careis delivered in U.P.
94. At the same time, it must be emphasized thatthe role of public sector will retain its criticalimportance. It must be appreciated that the cost oftreatment is among the highest in those states wherethe public health infrastructure is less developed. Thisfact applies to government and private hospitalizationas well as to outpatient treatment. Where public health

8 1 The Condition of Health
system is well developed the treatment cost of bothpublic and private sector facility is low. Competitionfrom public facilities is an important determinant ofcharges in the private facilities as demonstrated by KeralaExperiment. Access to health care is directly related tothe cost of health care. It is amply clear that in UP thecost of private care is exorbitantly high in comparisonto both the cost of public sector facilities as well as thebearing capacity of the population, particularly the poor.
95. The challenge before Uttar Pradesh is huge byany standard. It can only be surmounted if the privatesector, NGOs and the Government join hands. New formsof public private partnership have to be evolved and putinto shape. The public agencies and NGOs should focusgreater resources on development and widespreaddissemination of public health information messagesaimed at improving community members’ capacity tosafeguard their own and their children’s health.
96. A major problem in formulation of effectivepolicy and devising intervention methodologies at thelocal level is the serious lack of credible, timely andregular data on various heath indicators. The surveybased data is either too infrequent or in most of thecases the desegregation level at which the data is
available leaves much to be desired. The MMR data forthe state was available only for 1997 (NFHS 1998). Nowthe same is available for 2005 (NFHS3). For theintervening period even the state level data was notavailable. As far as desegregation is concerned thedistrict level data is just not available, seriouslycompromising the bench-marking or monitoring of theefforts towards maternal mortality reduction. The IMRdata is now available for the district level (RCH data).However, both the frequency of the data and its reliabilityin terms of throwing up credible district level IMRinformation leaves many unanswered questions.Similarly, disaggregated data for neonatal mortality,which is one of the biggest contributors to IMR are alsonot available. The problem of the availability of suchdisaggregated data on a regular basis which can throwup policy directions and enable areas specificinterventions has to be addressed urgently.
97. For the first time the health sector is beinggiven due priority with injection of appropriate resourcesin the form of large NRHM resources and the Planresources. These are likely to be appropriatelysupplemented by resources from institutions like theWorld Bank. This certainly seems to be UP’s opportunity,which should be grabbed with both the hands.