the status of education - planning department(uttar...
TRANSCRIPT

3 1 The Status of Education
CHAPTER - 3
The Status of Education
I. Introduction1. Education is a key component of human
development. Education has been accepted as a right ofevery child. It is needed both as an end in itself to enablepeople to lead a cultured and more satisfying life aswell as for developing human capabilities for earninghigher income. Educational levels are also closely relatedwith other indicators of human development like fertility,mortality rates, etc. This chapter discusses the progressof education at different levels in the state and thevarious state initiatives taken in this direction andidentifies critical areas for future development. Amongother things, it examines the educational status at thestate and district level, progress in educationalinfrastructure, recent government initiatives in the fieldof primary and secondary education, expansion of higherand technical education and public expenditure oneducation in the state. The chapter also identifies thefuture challenges and outlook in the field of education.
II. Status of Education
Educational Profile2. Looking at the educational profile of the
population in the state as revealed by the latest NSSround, we find that about two fifth of the urban femaleswere illiterate in 2004-05 as compared to one fifth of
the urban males (Table 3.1).Still about 36 per cent ofrural males and 70 per cent of rural females are illiterate.Only 15 per cent of rural persons and 37 per cent ofurban persons had received education up to secondarylevel or above. About 14 per cent of the urban peopleand only 2.8 per cent of the rural people had receivededucation up to graduate level or above. These figuresare indicative of the poor level of educationaldevelopment in the state and the challenges that lieahead in this direction.
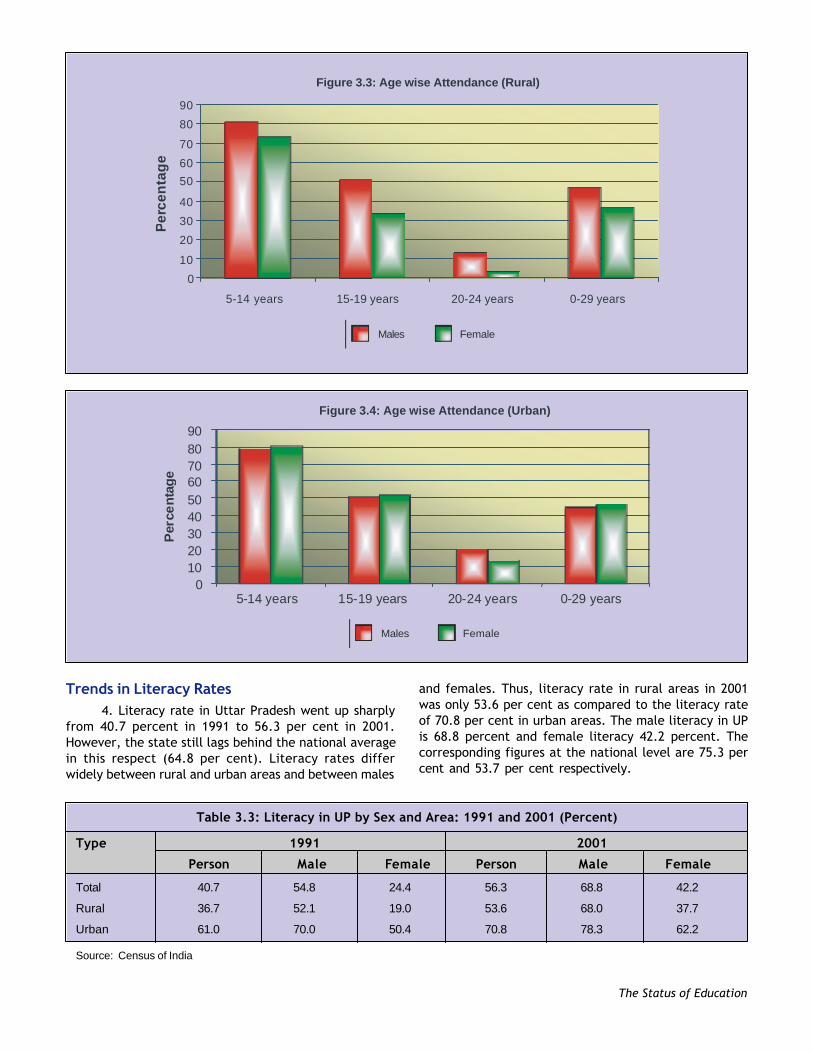
3. The NSS 61st Round also reveals that even now20.6 per cent of urban children and 22.9 per cent ofrural children in the age of 5-14 are not attending school(Table 3.2). The proportion of children and youthattending educational institutions drops sharply as onegoes to higher levels of education. Thus, only 50.9 percent of urban youth and 42.6 per cent of rural youth inthe age group 15-19 is attending any educationalinstitution. This proportion drops sharply to 16.8 per centand 8.3 per cent in urban and rural areas respectively incase of age group 20-24. The attendance rate is foundto be higher in urban areas and lower in rural areas forall age groups. It is also higher for males for all agegroups and much lower for females in rural areas. Inurban areas, however, the attendance of females isbetter than that of males for all age groups except agegroup 20-24.
Table 3.1: Educational Profile of Rural and Urban Population in U.P., 2004-05
Category Rural Urban
Males Females Persons Males Females Persons
Not literate 36.2 69.8 52.9 20.5 39.4 29.3
Literate up to primary 21.7 13.3 17.4 21.3 16.9 19.2
Middle 19.8 8.8 14.3 16.4 12.7 14.7
Secondary 10.4 4.1 7.2 12.7 10.1 11.5
Higher secondary 6.9 3.1 5.0 11.3 8.9 10.2
Diploma / certificate 0.3 0.1 0.2 1.6 0.3 1.0
Graduate and above 4.5 1.1 2.8 16.1 11.7 14.0
All 100 100 100 100 100 100
Source: NSS 61st Round, Report No. 516

3 2Human Development Report, Uttar Pradesh
Table 3.2: Age Wise Attendance Rates in Educational Institutions, 2004-05 (%)
Age groups Urban Rural
Male Female Person Male Female Person
5-14 years 80.6 73.0 77.1 78.9 80.3 79.6
15-19 years 50.5 33.6 42.6 50.3 51.7 50.9
20-24 years 13.2 3.8 8.3 19.9 13.2 16.8
0-29 years 46.3 36.4 41.5 44.4 46.2 45.3
Source: NSS 61st Round, Report Number 516
Figure 3.1: Educational Profile (Rural)
0
10
20
30
40
50
60
70
80
Not
liter
ate
Lite
rate
upto
prim
ary
Mid
dle
Sec
ond
ary
Hig
her
seco
ndar
y
Dip
lom
a/ce
rtifi
cate
Gra
dua
tean
da
bove
Per
cent
ages
Males Females
Males Females
Figure 3.2: Educational Profile (Urban)
0 5
10 15 20 25 30 35 40 45
Not
lite
rate
Lite
rate
upto
prim
ary
Mid
dle
Sec
ond
ary
Hig
hers
eco
ndar
y
Dip
lom
a/c
ertif
ica
te
Gra
dua
tean
da
bove
Per
cen
tage
3 3 The Status of Education
Trends in Literacy Rates4. Literacy rate in Uttar Pradesh went up sharply
from 40.7 percent in 1991 to 56.3 per cent in 2001.However, the state still lags behind the national averagein this respect (64.8 per cent). Literacy rates differwidely between rural and urban areas and between males
and females. Thus, literacy rate in rural areas in 2001was only 53.6 per cent as compared to the literacy rateof 70.8 per cent in urban areas. The male literacy in UPis 68.8 percent and female literacy 42.2 percent. Thecorresponding figures at the national level are 75.3 percent and 53.7 per cent respectively.
Table 3.3: Literacy in UP by Sex and Area: 1991 and 2001 (Percent)
Type 1991 2001
Person Male Female Person Male Female
Total 40.7 54.8 24.4 56.3 68.8 42.2
Rural 36.7 52.1 19.0 53.6 68.0 37.7
Urban 61.0 70.0 50.4 70.8 78.3 62.2
Source: Census of India
Males Female
Figure 3.3: Age wise Attendance (Rural)
0
10
20
30
40
50
60
70
80
90
5-14 years 15-19 years 20-24 years 0-29 years
Per
cen
tag
e
Males Female
Figure 3.4: Age wise Attendance (Urban)
0 10 20 30 40 50 60 70 80 90
5-14 years 15-19 years 20-24 years 0-29 years
Per
cen
tag
e

3 4Human Development Report, Uttar Pradesh
Inter-District Variations in Literacy Rates5. The inter-district disparity in literacy is quite
glaring varying from a low of 38.8 per cent in Rampur toa high of 74.4 per cent in Kanpur Nagar (see Appendix3.1). In only eight districts more than two third
population is literate. On the other hand, in as many as20 districts more than half of the population is illiterate.In as many as 56 out of the 70 districts more than half ofthe females are illiterate. Among males, literacy ratesvary from 46.7 per cent in Shrawasti to 81.3 per cent in
Map 3.1
50.0050.00 - 60.0060.00 - 70.0070.00 - 75.0075.00
UTTAR PRADESH
(BELOW)
(AND ABOVE)
U.P.
Sahranpur
Muzaffar Nagar Bijnore
Moradabad
MeerutBaghpat
Rampur
PilibhitBareilly
Ghaziabad
Budaun
Bulandshahar
ShahjahanpurAligarh Bahraich
Sitapur
Hardoi
Mathura
Farrukhabad
EtahShravasti
GondaBarabanki
Hathras
AgraMainpuri
Firozabad
Balarampur
LucknowUnnao
Kannauj
Etawah
Maharajganj
Basti GorakhpurFaizabad
SultanpurRaebareli
Deoria
Auraiya
Azamagarh mauFatehpur
Jalaun
Hamirpur
Ballia
JaunpurPratapgarh
Jhansi GhazipurKaushambi
Chitrakoot
Banda
Allahabad
VaranasiMahoba
Lalitpur
ChandauliMirzapur
Sonbharda
GB. Nagar
JP Nagar
Lakhimpur
KanpurKanpur
Siddharth
SK Nagar
Ambedkar
Kushi Nagar
SR Nagar
Kheri
DehatNagar
Nagar
Nagar
CATEGORIES
70.91
71.91 68.78
54.91
62.57
75.0076.9948.20
62.4958.73
79.84
48.96
74.3181.26
59.73
59.50
71.7145.58
59.97
64.39
76.47
71.14
67.5246.67
56.3958.85
76.28
74.6076.7075.89
45.84
75.98
56.66
66.28
80.25
72.76
79.9263.64
63.92
66.5767.1073.57
69.42
70.4967.61
75.0176.39
80.14
71.37
71.04 75.6069.01
77.39
71.87
71.91
76.1873.99
78.76 74.8761.96
77.69
69.28
75.81
77.8775.7667.74
63.81
74.0469.59
62.95
District wise Male Literacy - 2001
- 68.82
Total Rural Urban
0
10
20
30
40
50
60
70
80
90
Male Female Male Female1991 2001
Figure 3.5: Literacy in UP by Sex and Area
Perc
enta
ge

3 5 The Status of Education
Table 3.4: Districts with Highest and Lowest Literacy Rates, 2001
Male Female
Highest Literacy Lowest Literacy Highest Literacy Lowest Literacy
District Literacy District Literacy District Literacy District Literacy% % % %
Gautam Buddha 81.26 Kaushambi 61.96 Kanpur Nagar 67.46 Barabanki 34.29
Nagar
Kanpur Nagar 80.25 Sitapur 59.97 Lucknow 60.47 Sonbhadra 33.70
Auraiya 80.14 Shahjahanpur 59.73 Auraiya 59.13 Moradabad 33.01
Etawah 79.92 Kheri 59.50 Ghaziabad 58.01 Lalitpur 32.97
Ghaziabad 79.84 Barabanki 58.85 Etawah 57.38 Kaushambi 29.79
Jhansi 78.76 Bareilly 58.73 Kanpur Dehat 54.64 Kushinagar 29.64
Varanasi 77.87 Siddharthnagar 56.66 Gautam Buddha 53.70 Mahrajganj 27.93
Nagar
Chitrakoot 77.69 Gonda 56.39 Meerut 53.12 Rampur 27.89
Jalaun 77.39 Moradabad 54.91 Varanasi 53.05 Gonda 27.17
Baghpat 76.99 Budaun 48.96 Mainpuri 51.41 Siddharthnagar 27.08
Mainpuri 76.70 Rampur 48.20 Firozabad 50.95 Budaun 25.14
Mathura 76.47 Shrawasti 46.67 Chitrakoot 50.30 Bahraich 22.78
Kanpur Dehat 76.39 Balrampur 45.84 Jhansi 50.16 Balrampur 21.79
Hathras 76.28 Bahraich 45.58 Saharanpur 50.00 Shrawasti 18.58
Source: Census of India 2001
Map 3.2
35.0035.00 - 40.0040.00- 50.0050.00 - 55.0055.00
UTTAR PRADESH
(BELOW)
(AND ABOVE)
U.P.
Sahranpur
Muzaffar Nagar Bijnore
Moradabad
MeerutBaghpat
Rampur
PilibhitBareilly
Ghaziabad
Budaun
Bulandshahar
ShahjahanpurAligarh Bahraich
Sitapur
Hardoi
Mathura
Farrukhabad
EtahShravasti
GondaBarabanki
Hathras
AgraMainpuri
Firozabad
Balarampur
LucknowUnnao
Kannauj
Etawah
Maharajganj
Basti GorakhpurFaizabad
SultanpurRaebareli
Deoria
Auraiya
Azamagarh mauFatehpur
Jalaun
Hamirpur
Ballia
Jaunpur
Pratapgarh
Jhansi GhazipurKaushambi
Chitrakoot
Banda
Allahabad
VaranasiMahoba
Lalitpur
ChandauliMirzapur
Sonbharda
GB. Nagar
JP Nagar
Lakhimpur
KanpurKanpur
Siddharth
SK Nagar
Ambedkar
Kushi Nagar
SR Nagar
Kheri
DehatNagar
Nagar
Nagar
CATEGORIES
District wise Female Literacy - 2001
- 42.22
50.00
47.81 46.10
33.01
34.56
53.1249.17
27.89
35.1135.22
58.01
25.14
42.4853.70
36.25
35.3843.03
22.78
34.59
36.77
43.43
48.65
39.2618.58
27.1734.29
46.31
48.3551.4150.95
21.79
60.47
27.08
41.59
67.46
49.16
57.3829.64
27.93
34.9236.92
42.8842.26
40.8639.30
42.5154.64
59.13
45.30
43.4048.66
41.93
49.21
40.14
43.16
44.07
41.54
50.16 44.0329.79
50.30
36.78
46.38
53.0538.4436.41
32.97
44.1339.26
33.70

3 6Human Development Report, Uttar Pradesh
Gautam Budh Nagar district, while in case of females,literacy varies from 25.1 per cent in Budaun to 67.5 percent in Kanpur Nagar. These figures are a tellingcommentary on the low status of educational developmentin the state . Many districts in Eastern UP and someminority dominated districts in western UP have very lowliteracy rates. Table 3.4 shows the districts with highestand lowest literacy rates for males and females.
III. The School System6. School education in UP comprises three stages,
lower primary (Classes I to V), upper primary (Classes VIto VIII) and secondary education (Classes IX to XII). Interms of organizational structure the school systemconsists of government schools, private aided schools,private unaided schools, minority institutions andmissionary schools. The largest number consists of theprivate unaided schools. The role of private schooling israpidly increasing in the state while that of publicschooling is declining in relative terms.
7. Data on the number of schools, students andteachers and related ratios are given in Table 3. 5.The spread of facilities for lower primary education isthe largest followed by senior secondary and high
schools and higher secondary schools. The same is thecase with the enrollment, which also present apyramidal picture with a large base, which narrowsdown as one moves higher on the ladder of education(Table 3.5).
8. Despite various efforts for promotion of theeducation of the girl child, the ratio of female studentsin total enrollment tends to decline as one moves upfrom primary to higher levels of education. However,the ratio of girls’ enrollment at various levels has sharplyincreased over the past years. While the ratio of femaleteachers is almost identical in primary and upper primaryeducation, it declines very sharply in secondaryeducation. This is one of the reasons of the decliningfemale ratio in secondary education.
9. The ratio of girls’ schools at the upper primarystage of education appears to be very low. But it mustbe mentioned that earlier some of the new upper primaryschools were earmarked as girls’ upper primary schools.But under the various projects like Basic EducationProject and SSA, general upper primary schools areopened which cater to the education of both boys andgirls i.e. they are co-ed schools. These schools are notdesignated as boys’ schools or girls’ schools.
Table 3.5: School Education in U.P. at a Glance, 2004-05 & 2005-06
Item 2004-05 2005-06
Lower Primary Education
Number of schools 129976 134455Ratio of Girls’ schools all co-ed all co-edNumber of Teachers 283287 297952Ratio of female teachers 40.0% 40.0%Number of students 26139380 26270063Ratio of girls 46.7% 46.7%
Upper Primary Education
Number of schools 36874 40021Ratio of girls’ schools 15% 15%Number of teachers 84125 98461Ratio of female teachers 40.1% 45.0%Number of students 9329430 9376167Ratio of girls 43.9% 44.0%
Secondary Education
Number of schools 12766 13809Ratio of girls schools 20.7% 20.7%Number of Teachers 137902 192053Ratio of female teachers 21.6% 16.12%Number of students 6764358 9313351Ratio of female students 29.6% 41.3%
Source: Shilksha Ki Pragati in U.P., Directorate of Education, U.P. (Annual)

3 7 The Status of Education
Growth of Schools10. There has been a very marked growth in the
educational infrastructure in the state. There has beena remarkable increase in the number of schools in thestate since 1970-71 (Figures 3.6, 3.7 and 3.8). Thenumber of junior basic schools increased by more thantwo times during the period 1970-71 to 2005-06. Theincrease was even more remarkable at the senior basic
and secondary school levels showing an increase of 4.5times and 3.7 times respectively. Largest increase in thenumber of schools has taken place after 2000-01reflecting the government’s efforts to cover all theunserviced areas by opening schools under the ‘SarvaShiksha Abhiyan’. The earlier norm was to establish aprimary school within 1.5 km. of any settlement. Thishas now been reduced to one km.
02000400060008000
10000120001400016000
1970-71 1980-81 1990-91 2000-01 2004-05 2005-06
Boys Girls Total
Figure 3.8: Number of Secondary Schools
Boys Girls Total
Figure 3.6: No. of Junior Basic Schools
0
20000
40000
60000
80000
100000
120000
140000
160000
1970-71 1980-81 1990-91 2000-01 2005-06
co-ed co-ed co-ed
co-ed
Boys Girls Total
Figure 3.7: Number of Senior Basic Schools
0
5000
10000
15000
20000
25000
30000
35000
40000
45000
1970-71 1980 -81 1990-91 2000-01 2005-06

3 8Human Development Report, Uttar Pradesh
24 percent in 2005-06. Many promotional schemeshave contributed to achieve this decline includingthe mid day meal scheme. Teacher pupil ratio is onethe indicators of the availability of teaching facilityin schools. The state government has initiatedschemes of appointing para teachers to supplementthe lack of regular teachers. The teacher pupil ratiowas 1:67 at the start of the academic session 2004-05. During the year 2004-05 about one lakh teachersand ‘Shiksha Mitras’ were recruited by the stategovernment in a time bound manner which hasbrought down the teacher pupil ratio from 1:67 to1:52 During 2005-06, about 75,000 Shiksha Mitras and36,000 BTC teachers are to be appointed which willbring down the teacher pupil ratio to 1: 42. This issurely a remarkable progress to ensure qualityteaching. Shiksha Mitras are appointed by the VillageEducation Committee (VEC) which is also responsiblefor payment of honorarium to them.
Increase in Number of Teachers11. The growth in the number of teachers has been
much slower as compared to the growth in the numberof schools (Figures 3.9, 3.10 and 3.11). Thus, the numberof teachers has increased by 46.5 per cent, 88.7 percent and 73.1 per cent between 1970-71 and 2005-06 atthe lower primary, upper primary and secondary schoollevel. Most of the increase in the number of teachershad taken place prior to 1990-91. However, the growthslowed down due to the fiscal crunch faced by thegovernment. Consequently a large number of teachingposts remained unfilled. The government has tried tofill up this gap by appointing para teachers called shikshamitra in large numbers (see Box 3.1).
Box 3.1: Drop Out Rates and Teacher Pupil Ratio
The drop out rate at the primary (class I to V)and upper primary (class VI to VIII) level was about65 percent in 1992-93. This rate has come down to
Males Female Total
Figure 3.9: No. of Teachers in Lower Primary Schools
0
50000
100000
150000
200000
250000
300000
350000
1970 - 71 1980 -81 1990 -91 2000 - 01 2005 -06
Males Female Total
Figure 3.10: No. of Teachers in Upper Primary Schools
0
20000
40000
60000
80000
100000
120000
1970-71 1980-81 1990-91 2000-01 2005-06

3 9 The Status of Education
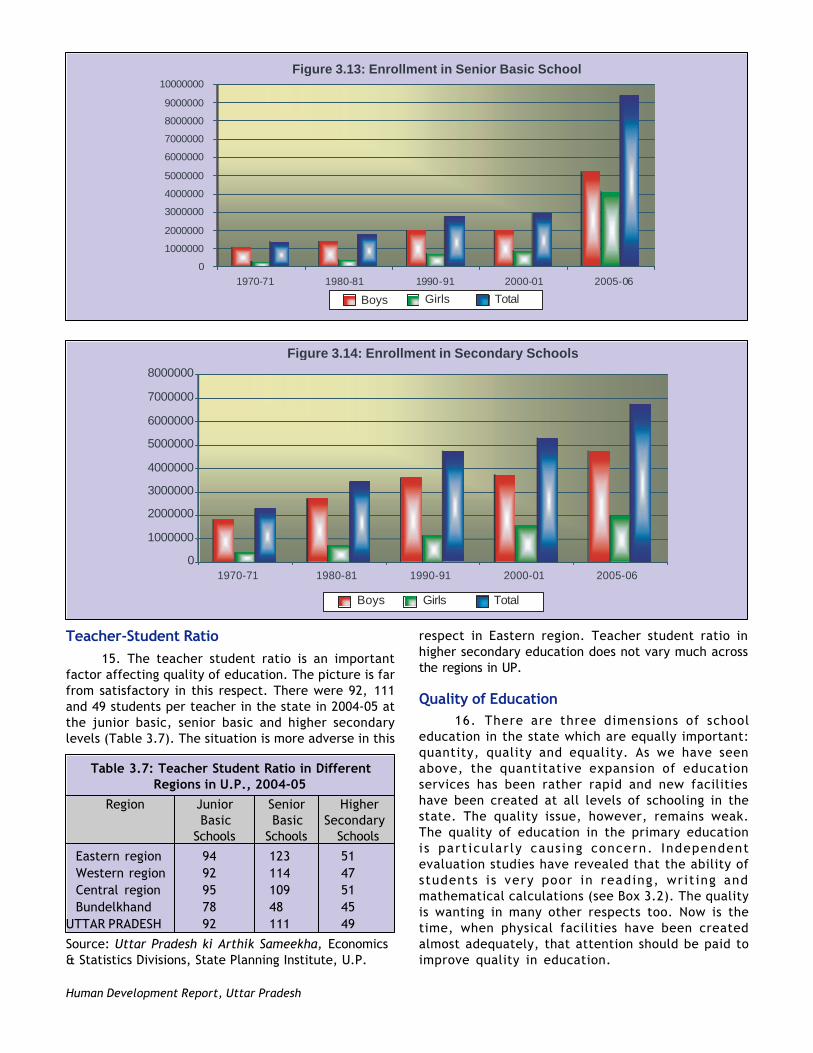
Growth in School Enrollment12. The increase in school enrollment has been
rather impressive particularly in the last decade due tothe special programmes launched by the government foruniversalization of education (figures 3.12, 3.13 and3.14)). Thus, the number of students increased by 2.47times at the junior basic level, 6.8 times at the seniorbasic level and 2.9 times at the secondary level duringthe period 1970-71 and 2005-06. Even more impressivewas the growth of girls enrollment, which went up by3.2 times, 14.5 times and 4.3 times at the three levelsrespectively during the same period. Most of the increasein school enrollment has taken place after 2000-01. Thesefigures are indicative of the fact that Uttar Pradesh,which has been lagging behind in the field of education,is rapidly picking up.
13. The recent initiatives of the state have madean impact on enrollment and retention rate. Theimprovement in enrollment has been higher for girls andother socially deprived groups. There is also someevidence that in specific project areas, learning
achievements have improved along with enrollments.Parents are increasingly becoming aware of the social valueof education especially for the girl child and consequentlythe demand for education is rising. Just as there is a phaseof universalization of primary education, with stages ofdevelopment, there comes a situation in which secondaryeducation also appears to be universalized. However, atthe moment UP has to go a long way to achieve thatcherished level of educational development.
Students per School14. The number of students per class and
institution is an important factor in qualitydetermination. The number of students per educationalinstitution differs widely from school to school. Notablevariations also exist region wise in UP. Table 3.6 depictsthe scenario across the regions in the state. It is onlythe Eastern region, which may be described as “overcrowded” because in the rest of the three regions, thenumber of students per school is less than the stateaverage.
Table 3.6: Region wise Number of Students perEducational Institution, 2004-05
Region Junior Senior HigherBasic Basic Secondary
Schools Schools Schools
Eastern region 233 288 547
Western region 180 249 521
Central region 203 256 521
Bundelkhand 147 111 493
UTTAR PRADESH 201 253 530
Source: Uttar Pradesh ki Arthik Sameekha, Economics& Statistics Divisions, State Planning Institute, U.P.
020000400006000080000
100000120000140000160000180000200000
1970-71 1980-81 1990-91 2000-01 2004-05 2005-06
Males Females Total
Figure 3.11: No. of Teachers in Secondary Schools
Figure 3.12: Enrollment in Junior Basic School
0
5000000
10000000
15000000
20000000
25000000
30000000
1970-71 1980-81 1990-91 2000-01 2005-06 Boys Girls Total
4 0Human Development Report, Uttar Pradesh
Teacher-Student Ratio15. The teacher student ratio is an important
factor affecting quality of education. The picture is farfrom satisfactory in this respect. There were 92, 111and 49 students per teacher in the state in 2004-05 atthe junior basic, senior basic and higher secondarylevels (Table 3.7). The situation is more adverse in this
Table 3.7: Teacher Student Ratio in DifferentRegions in U.P., 2004-05
Region Junior Senior HigherBasic Basic Secondary
Schools Schools Schools
Eastern region 94 123 51Western region 92 114 47Central region 95 109 51Bundelkhand 78 48 45
UTTAR PRADESH 92 111 49
Source: Uttar Pradesh ki Arthik Sameekha, Economics& Statistics Divisions, State Planning Institute, U.P.
respect in Eastern region. Teacher student ratio inhigher secondary education does not vary much acrossthe regions in UP.
Quality of Education16. There are three dimensions of school
education in the state which are equally important:quantity, quality and equality. As we have seenabove, the quantitative expansion of educationservices has been rather rapid and new facilitieshave been created at all levels of schooling in thestate. The quality issue, however, remains weak.The quality of education in the primary educationis part icular ly caus ing concern. Independentevaluation studies have revealed that the ability ofstudents is very poor in reading, writ ing andmathematical calculations (see Box 3.2). The qualityis wanting in many other respects too. Now is thetime, when physical facilities have been createdalmost adequately, that attention should be paid toimprove quality in education.
Figure 3.13: Enrollment in Senior Basic School
0 1000000 2000000 3000000 4000000 5000000 6000000 7000000 8000000 9000000
10000000
1970-71 1980-81 1990-91 2000-01 2005-06 Boys Girls Total
Boys Girls Total
Figure 3.14: Enrollment in Secondary Schools
0
1000000
2000000
3000000
4000000
5000000
6000000
7000000
8000000
1970-71 1980-81 1990-91 2005-062000-01

4 1 The Status of Education
IV. Recent Initiatives for Universalization ofEducation
17. The decade of 1990s has been particularlyimportant from the viewpoint of the development ofschool education in the country as well as the state.This decade is known for several effective schoolinterventions by government. The Eighth Five Year Planof U.P. (1992-97) recognized secondary education as oneof the most important and effective instruments ofhuman resource development and a pre-requisite foreconomic growth and human progress. It emphasizedchecking drop out rates, improvement in formal and nonformal system of education and expansion in the facilitiesfor girls’ education.
18. During the Ninth Plan emphasis was put onquality improvement. The Ninth Five Year Plan (1997-2002) policy accordingly emphasized the need formodification and diversification of curricula so as toprovide skill and training through well structuredvocational courses, planned with communityinvolvement and support. It also aimed at encouragingthe Open Learning System (OLS) for providing
Box 3.2 Quality of Primary Education:Findings of the Pratham Survey
The study by Pratham has revealed that forrural Uttar Pradesh, the quality is very poor in manyrespects. In reading tests it has been found that inclass I, 55.7 percent children can read nothing, 33.0percent can read letter, but only 8.0 percent can readword. In class II, 24.3 percent children can readnothing, 38.0 percent can read letter and 24.3percent can read word. In class III, 11.7 percent canread nothing, 26.4 percent can read letter, and 30.8percent can read word. Even in class V, 3.8 percentchildren can read nothing, 9.8 percent can read letter,and 15.8 percent can read word.
In arithmetic test, in class I, 70 percentchildren can do nothing, 26.7 percent can recognizenumber, 2.3 percent can subtract and 0.7 percentcan divide. In class II, 39.9 percent can do nothing,48.2 percent can recognize number, 9.3 percent cansubtract and 2.9 percent can divide. In class III, 23.5percent can do nothing, 47.9 percent can recognizenumber, 20.9 percent can subtract and 7.7 percentcan divide. Even in class V 9.2 percent can do nothing,29.9 percent can recognize number, 36.4 percent cansubtract and 28.5 percent can divide.
Source: Pratham, ASER 2005, Uttar Pradesh
education to those who could not seek formaleducation through full time secondary educationalinstitutions.
19. The Tenth Five Year Plan (2002-07) recognizededucation as the key intervention whereby the state cantransform its large population into an asset instead oftreating it as a problem or burden. The Plan has notedwith concern the under allocation of plan resources forthe development of education and the decline therein.In the field of elementary education, the Tenth Planaimed at (a) universal enrollment, (b) universalretention, and (c) quality of education. The Plan calledfor developing additional physical facilities of primaryand upper primary education by opening new schools inun-served habitations.
20. In order to enhance the access of studentsto schools, the norm of opening new primary andupper primary schools have been revised in the year2006-07. According to revised norm, the villageshaving population 300 and distance of 1 Km. will beeligible for the opening of new primary school.Similarly, vi l lages having population 800 anddistance 2 Km. will be eligible for opening a newupper primary school.
21. Presently, Sarva Shiksha Abhiyan (SSA) and Midday Meal (MDM) Programme are the most notableprogrammes for promoton of universalization ofeducation at the primary level. Their progress in thestate is briefly discussed below.
Sarva Shiksha Abhiyan (SSA)22. It is a centrally sponsored scheme for
universalization of elementary education (UEE). Itwas started in 16 districts in UP during 2001-02 withGovernment of India share of 85 percent and stateshare of 15 percent. From 2002-03, the SSA is underimplementation in all districts. At present, theGovernment of India share is 65 percent and the stateshare is 35 percent. The role of SSA has beensignificant in many respects. Schemes and activitieslike construction of school buildings, teacherstraining, developing required infra structure, learningmaterial etc. have been covered under thisprogramme (see Box 3.3).
23. Field studies undertaken for the independentevaluation of the SSA scheme have revealed someweaknesses in the implementation of the programme (Box3.4). Though arrangements have been made for coveringlarger number of children, the full use of facilities hasnot been ensured. In many cases, schools have beenopened to achieve the set goals but the required physicalfacilities are still lacking. Along with constraints in physicalfacilities, the teacher attendance is also very low andhence the commitment of students is also lacking.

4 2Human Development Report, Uttar Pradesh
Box 3.3: Progress of Sarva Shiksha Abhiyan
Sarva Shiksha Abhiyan (SSA) is a centrallysponsored scheme for Universalization of ElementaryEducation. SSA was started in 16 districts of UttarPradesh during 2001-02 with Govt. of India share of85% and State Share 15%. During 2002-03 and 2003-04, SSA has been launched in all 70 districts of theState. All programmes and activities like schoolbuildings, teachers training, developing infrastructurerequirements, learning material etc. have been takenup in this programme. During 2001-02 to 2003-04,3998 new primary schools and 7570 new upper primaryschools have been provided in new habitations. Over6100 Shiksha Mitras have been placed in primaryschools by Village Education Committees. To improveTeacher Pupil Ratio, selection process of 67,829Shiksha Mitras is going on. Besides, 6020 EducationGuarantee Centres and 3634 Alternative andinnovative Education Centres have been opened forthose children who are not enrolled under formaleducation. A plan grant of Rs.2,457 crore wasapproved for the financial year 2005-06 afterreviewing the Education for All campaign. Four timesmore school buildings were constructed during 2004-05 compared to the work executed in the precedingperiod of three years. A provision of free text booksto all students of Basic Education Board has beenmade from the academic session 2005-06. Earlier thefacility was available only for girls and SC/ST students.
The Xth five year plan has been completedand undoubtedly it has proved to be a great success.The number of new primary and upper primary schoolis 12130 and 16167 respectively. 176296 additionalclassrooms have been constructed successfully.Besides all this, 167273 SHIKSHA MITRA’S and 40000teachers have been appointed which has decreasedthe pupil teacher ratio from 1:77 to 1:55. The gendergap in primary enrollment has reduced from 10% to4% and similarly the gender gap in the upper primaryschool enrollment has reduced from 20% to 10%.The percentage of SC student enrolled is 27% KasturbaGandhi Balika Vidyalaya Yojna has proved to be veryuseful for girls who are out of school of the age group11-14 age. 257 KGBV’s have been sanctioned outwhich 172 KGBV’s are functional. The proposed targetfor 2007-08 is 66 KGBV’s. Similarly, inclusive educationfor CWSN has been provided. During 2006-07, 2.95lakh children were identified in the household survey,out of which 2.51 lakh have been integrated, 61450children were assessed medically and 31261 childrenwere provided aids and appliances. In XI plan, SSAfunding pattern between the Central and States shallbe in the ratio of 65:35 for the first two years and60:40 for the third year i.e. 2009-10, 55:45 for thefourth year i.e. 2010-11; and 50:50 thereafter i.e.from 2011-12 onwards.
Box 3.4 : SSA in District Unnao : A Field Report
l The target of opening new primary and upperprimary schools for the year 2006-07 has beenfully achieved.
l In case of appointing new teachers, 80 per centof the sanctioned teachers have beenappointed at the primary school level and 62per cent at the upper primary level.
l About 63 per cent schools have playground and49 per cent schools do have sports items butonly 72 percent of such schools use them.
l Physical structure is weak in most schools.l About 82 percent schools have drinking water
facility. More than 25 per cent funding ofdrinking water facility is done through SSA.
l Toilet facilities are available only for 70 percent boys and 45 per cent girls at primary level.
l The teacher-students ratio is found to be 1:42in primary and 1:47 in primary and upperprimary schools.
l Teachers’ attendance is not up to the mark.l 62 percent students were found absent.l Students’ tests are taken regularly but the
performance of 66 percent students in anexclusive test has been poor.
l Drop out rate (4 to 5 percent) is less but isrelatively higher among girls.
Source : Based on an Evaluation Study conducted bythe Giri Institute of Development Studies, Lucknow
Mid Day Meal Scheme24. Mid Day Meal (MDM) scheme was
initiated by the Government of India in 1995. Under thisscheme all students in government aided schools,Madarsas, EGS centres and AIE centres are supplied freemid day meal. Initially 3 kilogram per month raw food-grain was given to every child for 10 months. TheGovernment of UP started supplying cooked mid day mealsince November 2004, and gradually the whole state hasbeen brought under its coverage. To ensure successfulimplementation of this scheme, Committees have beenset up from the state level to the village level formonitoring the progress and to provide necessaryguidance. The responsibility of supplying mid day mealhas been given to Gram Pradhans in villages and WardCommittees in city areas. In some city areas theresponsibility has been entrusted to NGOs. Cookingresponsibility has been entrusted to Gram Vikas Vibhagin villages and to DUDA and SUDA in city areas.Instructions have been issued to employ cooks belongingto SC/ST, widowed ladies on a priority basis and the foodis to be cooked under hygienic conditions. Under thisscheme nearly 1.86 crore children studying in over 93,000schools are covered.

4 3 The Status of Education
Box 3.5 : Mid Day Meal Programme in DistrictUnnao: A Field Report
About 65 percent schools have menu written on wallbut only 48 percent schools supply food accordingly.
More than 70 percent students are happy with thequality of food.
More than 71 per cent schools are still withoutkitchen. But even in schools where kitchen isavailable, food is generally cooked outside.
About 80 percent schools do have the required utensilsin the kitchen.
More than 88% schools have availability of safedrinking water.
In 68 percent schools LPG cylinders are used forcooking and fuel wood is used in the remainingschools.
Despite awareness of cleanliness, it is not followedin practice by the students while eating meals.
Only 9 per cent schools are provided with micro-nutrition supplement.
Participation of parents and Village EducationCommittees in MDM is not satisfactory in most of theschools.
Source: Based on an Evaluation Study conducted bythe Giri Institute of Development Studies, Lucknow
25. The scheme has shown good results and is ingeneral a very welcome measure. Certain shortcomingsin the implementation of the scheme have beenobserved. Often complaints are received about poorquality of food etc. In some schools the food is providedthrough private contractors or NGOs. It has createdproblem of low quality food. Evaluation studies havebrought out certain problems with MDM scheme (see Box3.5). These problems should be looked into carefully andremedied immediately so that full benefits of the schemestart accruing to children.
V. Special Educational Programmes26. A number of special educational programmes
have been introduced by the state government to addressthe problem of education of the children of the deprivedsections of society and special category of studentsincluding Scheduled Castes, Scheduled Tribes, minorities,girls, BPL families and the handicapped children. Anumber of concessions, freeships and other incentivesare given to the special category of students and girls.Some of the special programmes are discussed brieflybelow.
Educational Schemes for SC/ST27. In view of the constitutional provisions for
protection and promotion of the interests of weaker
sections of the society, particularly, Scheduled Castesand Scheduled Tribes, steps have been taken to promotethe cause of this segment of population in such a mannerso as to enable them to reach from elementary tosecondary level of education, which may lead them frompreliminary level of welfare to ultimate aim ofeducational empowerment.
28. Special institutional arrangements have beenmade for the SC/ST students. Ashram Type Schools havebeen opened for them to provide residential facilitiesto them. Similarly, Hostels and Coaching Centres havebeen established for Scheduled Caste/ Scheduled Tribestudents preparing them to compete in the civil servicesexaminations like PCS and IAS.
29. Financial assistance in the form of scholarshipsto Scheduled Castes, and Scheduled Tribe students isprovided to help them continue their education. SocialWelfare Department distributes scholarships toScheduled Caste and Scheduled Tribe students in allclasses / courses. Lists of students studying in recognizededucational institutions are obtained by the SocialWelfare Department of the UP government in co-ordination with the Education Department. High priorityhas been assigned for the distribution of scholarships.The scholarships are provided at the rate of Rs.25 perstudent per month from class I to V, Rs.40 from class VIto VIII and Rs.60 for classes IX and X.
Minorities’ Education Programmes30. Minorities in the state are among the
educationally more backward communities (see Box 3.6).In accordance with the provisions of Indian constitutionand the U.P. Minority Commission Act 1994, the StateGovernment has notified Muslims, Sikhs, Buddhists,Christians and Parsees as Minority Communities. Thereare 21 districts of U.P. wherein more than 20 percent ofpopulation belong to the minority category. Thesedistricts have been declared densely minority populateddistricts and 75 development Blocks have been declaredas Educationally Backward Minorities Blocks. The StateGovernment provides various types of educationalfacilities to minorities particularly in the identified areas.
31. Through the implementation of schemes likeMadarsa Modernization, Minorities ScholarshipProgramme, Hostel and Building Construction Scheme,Margin Money and Term loan scheme etc. efforts arebeing made to integrate the educational and economicrequirements of minorities and solve themsimultaneously. The ultimate aim is to bring about aqualitative improvement in their social, educational andeconomic status.
32. The scholarship scheme for minorities is alsobeing implemented in U.P. to give financial assistanceto minority children while they are in schools. Provisionhas been made for scholarship from class one to classten. Students from class I to v are given Rs.25; from

4 4Human Development Report, Uttar Pradesh
class VI to VIII the rate is Rs.40 and in classes IX and X, it isRs.60 per student per month. The UP Minority Finance andDevelopment Corporation is providing assistance by way ofterm loan, margin money loan, interest free loan and skillimprovement for eligible persons of minority community.It has also made provision for coaching of minority studentsfor better placement in government services.
Box 3.6 Minorities Education: A Case Study inPilibhit District
A field study of educational status of minorities inPilibhit district throws light on their educationalbackwardness. Muslims comprise around 21%population of the district, while Sikhs constitutearound 4%. About 70.5% of Muslim population and 4%of Sikh population live in rural areas of the district.The educational backwardness of Muslims is evidentfrom the fact that 52.47% of Muslims are illiteratewhile among Sikhs only 32.81% are found illiterate.Educational backwardness persists more amongMuslims than among Sikhs through out the educationalladder-primary to graduation level. Only one-thirdof the Muslims have received education, mostly uptothe primary level. Less than half percent of Muslimsreceived education upto graduate level or above ascompared to 3.8% of Sikhs (See Table below).
Educational Status of Muslims and Sikhs in PilibhitDistrict
(Percent of Population)
Educational Category Muslims Sikhs
Illiterate 52.47 32.81
With Primary education 23.16 29.71
Middle Education 7.63 13.47
High School education 2.14 10.19
Intermediate 0.66 2.76
Graduates & Above 0.38 3.28
Professional courses 0.11 0.53
Source: Field Survey by Mohd. Muzammil, Departmentof Economics, Lucknow University, Lucknow.
Madarsa Modernisation33. Under the Madarsa modernisation scheme, 735
Madarsas have been modernized and 359 Madarsas havealready been taken on the grant-in-aid-list so as to facilitatethem to provide pay etc. to their teachers. During 2004-05, state government sanctioned a grant of Rs. 15 lakh forcomputer education / construction of computer rooms in26 Madarsas. During 2006-07, 100 new Madarsas have beenbrought under the state’s grants-in aid facility. Thus, thetotal number of aided Madarsas comes to 459. In otherwords, of the total 1378 recognised Madarsas, about onethird have been put on the grant- in- aid list.
34. With a view to create Madarsa - marketinterface, courses for imparting technical skills have beenintegrated with religious instruction. A total of 140 miniITIs had been working as Madarsa based institutions and160 more ITIs have been opened in Madarsas taking thetotal of Madarsa based ITIs to 300. Various types ofcourses and vocational training programmes are run inthese technical institutes. This has created a new openingfor the tradition bound young boys and girls of the Muslimminority community.
Promotion of Urdu35. For the promotion of the teaching of Urdu
language, the programme of school education in Urdulanguage was started in the state in 1989, when thegovernment of UP declared Urdu as the second officiallanguage of the state. Three objectives are sought to beachieved for promotion of the education of Urdulanguage:
1. Making education available through the vernacularto the children of minorities whose language ismostly Urdu.
2. Making available the system of educationalinstruction in Urdu medium in schools.
3. Encouraging national integration through linguisticadjustments and recognition for minorities.
36. This scheme makes provision for theappointment of one Urdu teacher in a school if thereare a minimum of ten students studying Urdu in a classor if there are a minimum of 40 Urdu medium studentsin the school. Arrangements have been made for trainingof Urdu teachers in Lucknow, Meerut, Agra and Varanasi.
Promotion of Education of Girls37. The significant gender gap in educational
attainment has been noted above. Girls’ enrolment aswell as their retention at all stages of school educationis poor in comparison to the boys. State government hasmade special efforts to promote girls’ education duringthe Ninth and the Tenth Plan including the following:
l Education has been made free of tuition fee forgirls up to XIIth standard, and very recently since2004-05 up to higher education level.
l Fifty per cent of the seats in pre-service traininginstitutions for primary school teachers have beenreserved for girls so as to recruit more womenteachers at the primary level.
l The state government has opened 100 high schoolsin un served blocks from its own resources. It hasalso proposed to open 100 girls High Schools/Intercolleges with the help of voluntary agencies. Thestate government has motivated these agencies /societies by granting them Rs.10 lakh for building,furniture etc.

4 5 The Status of Education
l All the non-formal education centres have beendesignated as girls education centres so as to bringmore and more girls to the centres and cater totheir educational needs;
l The state government has adopted schemes ofincentive grants viz., sanitary facility, classroomsand furniture to those boys’ institutions in whichgirls are also studying.
l A discount of 50 percent is given in Stamp Duty forland registration while opening schools for girls atblock level.
l One school in each block and Nyaya Panchayat isto be developed as Abhinav Vidyalaya.
Policy for Partially Handicapped38. Integrated secondary education scheme has been
launched for the handicapped children of various categories,i.e. children with various degrees of deafness, weak eyesight,physically and mentally handicapped. This scheme wasstarted in 1986-87 to encourage the partially handicappedchildren for pursuing education by giving them financialassistance. This is a centrally sponsored scheme and thecentral government bears the burden of its financing.
39. Under this scheme financial assistance is givento the handicapped students at the rate of Rs.200 asuniform allowance, Rs.400 for books and stationery andRs.50 for conveyance. A grant of Rs.2000 is also given onmedical recommendation for purchase of equipment forthe handicapped child. This scheme is underimplementation in upper primary schools and secondaryschools in the districts of Meerut, Agra, Bareilly, Lucknow,Gorakhpur, Faizabad, Jhansi, Moradabad, and Ballia.
Role of Panchayati Raj Institutions40. Gram Panchayats in the state have been assigned
an important role for active participation in basic education.The State Government has constituted Village Education
Committees (VECs) as statutory bodies under UP BasicShiksha Adhiniyam 1972 and delegated management of Basiceducation to them. The VECs were further strengthenedand more powers were delegated to them in 1999. TheVillage Education Committee is functioning as a subcommittee of the Gram Panchayat with a separate ‘ShikshaNidhi’ (education fund) and is empowered to address alllocal issues regarding elementary education. Members ofVECs have been trained to orient them to their roles andresponsibilities. VECs have been empowered for schoolconstruction work, school maintenance and development,engaging Shiksha Mitras and Achryaji for EGS centres andpayment of honorarium to them. Community basedorganizations like Mother Teacher Associations, ParentTeacher Associations; Women Monitor Groups have also beenconstituted and sensitized. This has been a significant stepto empower local community to enable them to improvelocal school management and teacher accountability.
VI. Education Index41. Recently the National University of Educational
Planning and Administration, New Delhi has prepared anEducation Development Index for primary and upperprimary education for different states using 22 indicatorsrelated to access, infrastructure, teachers and outcome.This index helps in assessing the relative progress ofprimary education in the state. The data on selectedindicators for U.P. alongwith that of the best and theworst state are given in Appendix 3.6 and 3.7. It isdepressing to note that U.P. ranks 27 in case of EDI atprimary level, at rank 30 in case of upper primary leveland at rank 29 in terms of combined index out of 35states. If we compare U.P.s position among the 17 majorstates only even then U.P. figures at rank 12 (see Figure3.15). Only the states of West Bengal, Orissa,Chhatisgarh, Jharkhand and Bihar lag behind U.P. in thisrespect. It may be noted that all of these states havelarge Scheduled Tribe population.
Source: National University of Educational Planning and Administration, New Delhi.
Figure 3.15: Educational Development Index
0.000
0.100
0.200
0.300
0.400
0.500
0.600
0.700
0.800
States
Ind
ex
Va
lue
s
Primary EDI
Upper Primary EDI
Composite EDI
Ker
ala
Tam
ilnad
u
Kar
nata
ka
And
hara
Pra
desh
Mah
aras
htra
Guj
rat
Pun
jab
Utta
ranc
hal
Har
yana
Chh
attis
hgar
h
Raj
asth
an
Oris
sa
Utta
rPra
desh
Wes
tBen
gal
Mad
hya
Pra
desh
Jhar
khan
d
Biha
r

4 6Human Development Report, Uttar Pradesh
Secondary Education42. Once the enrollment targets are achieved at
lower levels of education, the attention is naturallydrawn to secondary and higher levels. Primary educationcertainly provides the base for education but anyworthwhile improvement in human resourcedevelopment status can be made only with effectivesecondary education. The Tenth Five-Year Plan (2002-07) recognized secondary education as the springboardto higher education. It also admits that it is a terminalstage in the general education system. At this stage ofeducation, the youth decides on whether to pursuehigher education or opt for technical training or joinstraight away the work force. Secondary educationcomprises teaching from class IX to class XII. The firsttwo years constitute high school education and the lasttwo years as the intermediate or higher secondaryeducation. It provides the link between primary andhigher education. Traditionally, secondary education hasbeen the weakest link in the entire range of formaleducation. The drop out rate after the high schoolexamination is very high, which calls for rethinking ofthe extension and diversification of secondaryeducation. According to an estimate about 10 lakh highschool students do not join the higher secondaryeducation. Naturally a re-routing is required at this levelof education so that the students completing high schoolexamination are usefully engaged in an alternativestream of education, which may be more fruitful forthem and also beneficial to the society.
43. The capacity creation at secondary educationlevel has been phenomenal and the infra structuralfacilities have been developed to the extent ofabsorbing about half of those passing out of the seniorbasic education. If the enrollment ratio improves andthe demand for secondary education rises, thefacilities may fall short of requirement. The qualityof education at this level also leaves much to bedesired. The swakendra (self centre) system of highschool and intermediate examination has sharplyincreased the pass percentage but led to considerabledeterioration of quality.
44. Private participation is being obtained in abig way for the development of secondary educationin the state and more so in un-served areas and formarginalized groups like girls. Non-recurring grant isbeing provided to private management for opening ofgirls’ high school in those blocks where such facilitiesare not available. In all, 426 development blocks inthe state were identified where high school educationfacilities were lacking for girls. Under this schemeinitially an amount of Rs.10 lakh and now revised toRs.20 lakh is given in two equal installments to privatemanagement for opening girls’ high school in un-servedblocks. Yearly provisions are made in the state budgetto run this scheme with a view to create basic
educational infrastructural facility. Budgetaryallocations are also made for construction of sciencelaboratory, additional school buildings and repair ofexisting buildings with a view to expand facilities. Anew scheme of one time assistance for opening newschools by private management to create extracapacity in rural areas has been initiated during 2006-07 for which an outlay of Rs.200 crore has beenallocated.
45. Due to the concerted efforts of the State Govt.,the level of enrollment, no. of schools and number ofteachers have increased appreciably during Xth Five YearPlan. At present, 558 Govt. colleges, 5276 aided collegesand 9736 unaided colleges are running in the State inwhich 89.92 lakh boys and girls are studying with thehelp of 1,10,864 teachers.
46. Targets set for 11th Five Year Plan are as under:
l Raising Gross Enrolment Ratio (GER) for thesecondary school going age group (14-18 years)which was 37.5% in 2002-03 to at least 65% by 2011-12, in the general stream (besides those in theVocational stream).
l Reducing gender and Social disparities in GER towithin 5 percentage points, and minimizing rural-urban disparity in GER.
l Bringing down pupil-Teacher ratio at the secondarystage to about 25, ensuring suitable subject wiseavailability of teachers and increasing percentageof trained teachers to 100%.
l Improving quality of secondary education and pupilsachievement levels so that pass percentage in Xand XII Board examinations improve to around 75%
An outlay of Rs. 3430 Cr. has been proposed forthe 11th Plan to achieve the above targets.
47. In order to improve access to secondary schooleducation, the state has been following the policy ofup-gradation of upper primary level institutions andestablishing new secondary level schools by assessingthe demands of a particular area or pocket of habitations.In this regard the U.P. Board of Secondary Education hasprescribed certain norms. The up-gradation of aidedupper primary schools follows a procedure laid down bythe Board.
48. A similar practice is being followed for the up-gradation of the institution from high school level tointermediate standard, which requires that the resultof high school on an average should not be less than 40percent. In addition to this the concerned institutionhas to specify a sum of Rs.50,000 as an endowment fundand Rs.2000 as reserve fund deposited in the name ofthe institution and pledged to the inspector of school.The conditions for up-gradation in respect of students’enrolment, library, teaching aids, science equipments,computer etc are laid down very clearly.

4 7 The Status of Education
Box 3.7: Politicization of Secondary Education
Teachers, particularly at the secondary level ofeducation enjoy substantial political influence in theState. Their representation in UP Assembly is ensuredby the Constitution of India which provides that one-tenth of all members in Legislative Council are to beteachers elected from teachers’ constituency. Unlikeother government paid employees, teachers areallowed to contest election to the LegislativeAssembly as well. The political influence of teachersin UP comes not only from their representation inthe state legislature but also from the strength oftheir unions. The problem of absenteeism of teacherswas raised by the Probe Report. The pressure ofteachers lobby often leads the government to acceptthe demands of teachers to avoid public resentmentcaused by prolonged disruption of the schoolingsystem. Teacher unions have used their powers topromote self interest on many occasions.
The evolution of education policy in the state hasbeen heavily influenced by teachers’ demands. Forinstance, the major education Acts in the last threedecades have come about shortly after periods ofintense lobbying by teachers’ unions. Generally thecampaigns of teachers unions have focusedoverwhelmingly on the issue of salaries and workconditions. In this respect they have been quitesuccessful as is evident from the rapid growth ofteachers’ salaries.
Unfortunately teachers have seldom used theirpolitical power to campaign for broad improvementsin the schooling system or for the promotion ofeducation in general. To some extent it is explainedby the fact that the role of teacher’s unions is topromote the immediate interests of their ownmembers rather than those of the pupils or parents.The latter, unlike teachers, tend to be dispersed andunorganized and this asymmetry has led to majorbiases in education policy. Parents’ organizations aredesperately needed to promote and safeguard theeducational interests of their wards and to counteractthe negative and unhealthy political preoccupationof politicized teachers and their unions. This will goa long way in ensuring teachers’ accountability inschools. (Kingdon and Muzammil: 2003) The existingParent Teacher Associations, (PTAs) are not effectiveand thus not able to counter the lobbying of teachersthrough the teacher’s unions.
VII. Vocational Education49. Long back in mid sixties, the Kothari
Commission had opined that 50 percent of studentspassing high school should be diverted towards vocationalstreams. But, the vocationalization of education at thehigher secondary stage has achieved only partial success
in the state. The vocational education scheme is inoperation in the state since 1989-90. The vocationaleducation programme is available to students in classes11 and 12. The scheme of vocational education hascovered a total of 892 secondary educational institutionsincluding 163 government schools and 729 aidedsecondary schools. 100 more schools have been identifiedfor the purpose. In the 892 vocational schools, a total of36 vocational trades are being run in which about 3700subject instructors are hired to impart training tostudents at an honorarium of Rs.1600 per month. During2004-05 about 52,500 students have been benefited bythis scheme of vocational training. There is also aprovision for inviting guest lecturers for specific tradesby teacher experts and they are paid at the rate of Rs.50per lecture. In view of the non receipt of the centralshare of the grant for running this scheme, the stategovernment has sanctioned funds for 2004-05 and 2005-06, a grant of Rs.10.00 crore.
50. Every school has a maximum of four trades anda minimum of two trades. There exists an arrangementof providing non-recurring grant of Rs.1.00 lakh for theconstruction of work shed and another Rs.1.00 lakh fortrade equipments. An annual grant of Rs.3000 per tradeis given for purchase of raw materials and Rs.100 perstudent (with a maximum of 15 students) is given for fieldvisits. The following ten trades have been included in thevocational education in selected schools: (i) fruits andfood processing, (ii) garments and tailoring, (iii) Shorthand and typing, (iv) multipurpose health / medical labtechnique, (v) colour photography, (vi) Repair of Radioand colour TV, (vii) weaving and hand embroiderytechnique, (viii) computer technique and maintenance,(ix) agricultural equipments’ maintenance / repair ofdiesel engine, and (x) maintenance and repair of householdelectrical appliances. Only selected trades are availableat a time in a school. The establishment of vocationalEducation Board in the State is under process.
VIII. Higher Education51. In view of the fast changing economic and
technological scenario, the higher education systemneeds to be revamped so that it could equip studentswith adequate skills to enable their full participation inthe emerging social economic and cultural environment.Government of India has emphasized raising theenrollment level in higher education of the 18-23 yearsage group from the present 6 percent to 10 percent bythe end of the Tenth Five Year Plan. Therefore, the focuswould be on increasing access, quality and liberalizationof higher education. The efforts made at State level overthe past 50 years, have resulted in significant numericalgrowth of new universities and institutions of higherlearning in specialized areas. There are a total of 12state universities, 4 central universities, 3 agriculturaluniversities and one Open University in the State.Besides, there are 9 deemed universities and 7 private

4 8Human Development Report, Uttar Pradesh
universities out of which 3 are functional at present. Inorder to expand higher education in remote areas, thegovernment has initiated private participation in openingdegree colleges. As a result, apart from 124 governmentdegree colleges and 345 non-government aided colleges,1423 self financed colleges have been established in theprivate sector.
52. The current strategy for higher educationincludes: (a) increasing intake in institutions of higherlearning; (b) improving quality of education includingresearch and technology; (c) modernization of curriculum;(d) expansion of distance learning facilities; (e)development of autonomous degree colleges anddepartments, and (f) vocationalization of higher educationThe State government is encouraging private participationto promote higher education in rural and educationallyun-served areas. Efforts are on to make higher educationemployment-oriented by creating professionalism, throughspecialization in various disciplines.
53. The Rajarshi Tandon Open University has beenestablished at Allahabad for providing opportunities tounder-privileged classes of distant areas. The universityis providing education in various traditional andvocational subjects. The system of distance learning isgrowing popular among students deprived of regularlearning facilities. Networking through computerizationis being encouraged to improve information gatheringsystem and make administration effective in degree levelinstitutions. To this end, a website containing civil charterof Higher Education has been launched.
54. The weaker sections of the society living inremote areas are generally deprived of higher educationfacilities due to various socio economic constraints.Similarly there is a wide gender gap at higher education
Box 3.8: Privatization of Higher Education in U.P.
Private sector has now been involved in the expansionof higher education in a big way. As many as 7 privateuniversities ; Gautam Budh University, GautamBudhnagar, U.P. Mangalayatan University, Aligarh,Maharshi Information Technology University, Lucknow,Maulana Mohammed Ali Jauhar University, Rampur,Jagadguru Rambhadracharya University for disabled,Chitrakoot, Integral University, Lucknow and AmityUniversity, UP have been established by Law in theState since 2001 out of which last 3 universities arecurrently functional. Besides, Private sector has alsobeen involved in setting up de gree colleges in theState on a massive scale. Since 1999-2000, 97 newdegree colleges have been set up in remote areas byprivate sector. In order to further expand highereducation in un-served areas 468 NOCs in 2004-05and 476 NOCs in 2005-06 have been issued. More than300 colleges were granted affiliation in 2005-06.
level. To ensure and ‘encourage access and equity’ inhigher education, the government has launched a self-financing scheme. Priority is being given to set upwomen’s degree colleges in such areas. Government alsogrants scholarship to the students of all social categorieswhose parents income does not exceed Rs. 1 Lakh perannum. To further minimize financial burden of highereducation on parents, the State Government has frozenfee in higher education to the level of June 3, 1995.
55. Emphasis is being laid on ensuring maximumprivate participation in the opening of new degreecolleges, particularly in rural areas. In order to reducethe prevailing gender gap in higher education, the stategovernment is giving various types of incentives tomotivate female students to pursue higher education.Their education has been made tuition fee free andscholarship schemes are in place to motivate them andsupport their education in universities and colleges.
56. Out of the Universities imparting generalhigher education, some University departments have thepotential to provide a very quality education by virtueof better academic/work culture, campus discipline,dedicated faculty, supervision of the university inacademic performance etc. For such Universitydepartment with potential for excellence Rs. 15 crorehave been earmarked for 2007-08 to enable them to gofor innovation in teaching, adopt modern methods oflearning & evaluation and also introduce flexibleapproach to selection of courses at post graduate/ degreelevel. Such University department would act as a ‘ RoleModel’ for other University/Departments in their regionof operation. With a view to guide students for choiceof career and facilitate their placement in Govt./Privatesectors or motivate them for self-ventures Rs. 1 crorehas been earmarked for the current financial year tostrengthen the existing Employment Bureau to enablethem to guide students for career option and placementafter the completion of the course. This Cell will functionunder the supervision of the Dean, student Welfare/Senior Professor of the University, Para/ministerial staffwill be deputed by the University from amongst theemployees of the University concerned.
57. Major portion of grants earmarked for HigherEducation goes towards salary payments of the staff andinfrastructure development consequently, studentwelfare largely remains neglected. There are certainactivities which are essential for overall developmentof students but students generally can not afford toundertake the same without financial assistance of thestate. In almost all the curriculum of the disciplines,excursion tours are required but for want of funds, toursare not carried out, as a result, the teaching remainsconfined to class room with no exposure of students toquality conscious and competitive trends in the jobmarket. Students hardly become aware and confidentof facing real life challenges and do not set a high goal

4 9 The Status of Education
and will to achieve it. ‘Student Welfare Scheme’ ismeant to expose students to the rich cultural diversityof the county. Financial support is provided forattending national seminars, publication of research,foreign travel and for critical illness of the students.
Box 3.9: Manyvar Kanshi Ram Smriti StateInstitute of Management in Higher Education
l National Policy on Education (1986 as modifiedin the year 1992) emphatically underlines thecontinuous training of Planners, Administrators andAcademicians for better educational management.The phenomenal expansion of knowledge, thebewildering pace of social and economic change andarray of scientific & technological innovation hasmade it incumbent upon the professionals to beexposed to the new ideas, skills, techniques at regularintervals or else they run the risk of getting out oftouch with the reality and unable to respond to andcope with the new tasks and challenges ahead.National Training Policy-1996 lays emphasis on pre-service, in-service training of all categories ofOfficers/employees in a given system conducive tothe enhancement of professional competence andpositive attitude towards work and life. With this endin view and to develop professional approach toissues, capacity building in education administratorsto meet emerging challenges in higher education,right attitudinal orientation and efficient resourcemanagement, mobilization and utilization of scarceresources at hand State Govt. has decided to establishManyvar Kanshi Ram Smriti. state institute forManagement in Higher Education
For quality improvement in higher education,establishment of Manyvar Kanshi Ram Smriti ShodhPeeth is under process in six universities of the Statenamely, Agra, Meerut, Lucknow, Varanasi, PoorvanchalUniversity, Jaunpur and Gorakhpur.
58. Last decade has witnessed phenomenal growthof institutions of higher education for reasons whichobliged the State to open new Regional Offices of highereducation for effective monitoring and management ofhigher education. For the Financial year 2007-08, Rs.960 lakh has been earmarked for opening of 7 newregional offices at divisional level and also for buildingoffices of the existing 8 regional offices.
59. Despite substantial increase in higher educationfacilities and diversification of courses to suit therequirement of learners, still there is a very large unmetdemand of higher education in the State. It is evidentfrom the large number of applicants for various coursesin Universities and Colleges who are denied admissionfor want of seats. On an average in universities like thatof Lucknow and Allahabad for many subjects, the numberof admission seekers is 8 to 10 times larger than the
number of seats available. It is more so for courses inphysical and natural sciences than in humanities andsocial sciences.
60. Goals set for 11th Five Year Plan ( 2007-12)
l Ensuring access and equity in Higher Education
l Infrastructure development including ICTinfrastructure and basic amenities in universitiesand colleges.
l Induction of quality and relevance in HigherEducation
l Inculcation of professional competence in allcategories of personnel in Higher Education
l Effective monitoring and control of theinstitutions of higher education.
An outlay of Rs. 869 cr. has been proposed forEleventh Five Year Plan to achieve the above goals setfor higher education in the State.
IX. Technical Education61. The promotion of technical education aims at
developing manpower for agricultural and industrialdevelopment and promoting self employment. At presentthere are 81 polytechnics and 7 degree level institutionsin the State. The intake capacity at diploma level anddegree level stood at 8325 and 1724 respectively in theyear 2004-05. Besides public sector polytechnics, 25polytechnics have also been established in private sector.Course wise seats in technical institutions have beenshown in Table 3.8. A number of private engineeringcolleges have been opened in the state in recent years,taking their numbers from 140 in 2003-04 to 195 in 2005-06. However, given the large size of student populationin the state and growing demand for these courses, theirintake capacity is still short of requirement.
Table 3.8 : Course wise Seats in TechnicalEducation Institutions in U.P.
Item 2003-04 2004-05 2005-06
No. ofEngineeringColleges:(a)Government 07 07 07or aided(b)Private 140 169 195
Number of Seats:B. Tech 21809 25374 28009B. Pharma 1025 1645 2910BHMCT 160 310 310B. Arch 160 290 330MCA 6485 5626 5654MBA 4530 5803 7270
Source: Department of Technical Education, U.P.

5 0Human Development Report, Uttar Pradesh
62. Under a new scheme of the Government ofUttar Pradesh, the existing polytechnics are beingupgraded. Integrating persons with disabilities in themainstream of technical and vocational educationscheme has been introduced in Government Polytechnic,Jhansi and Government Girls’ Polytechnic, Moradabadwith the financial assistance of the Government of India.These polytechnics now provide training to physicallyhandicapped students in formal and non formal courses.Government of India has provided grants to polytechnicsfor meeting all non-recurring expenditure and also partof the recurring expenditure.
63. Dr Ambedkar Institute of Technology forHandicapped, Kanpur was established in 1996-97 to helpthe candidates who are physically challenged. It wasestablished with the aim of making the physicallychallenged persons independent and self reliant. Thisnational level institution offers courses in (i) computerscience and engineering, (ii) architectural assistantship,and (iii) modern office management and secretarialpractice. For promotion of women’s technical education,a new Government Girls Polytechnic has been establishedat Daurala in district Meerut.
Box 3.10 New Initiatives During XIth Plan
(i) Establishment of Mahamaya U.P. Instituteof Science, Greater Noida : An engineeringinstitute of science & technology is to beestablished on the pattern of Indian Instituteof Science of Banglore. This institute isproposed to be established at GreaterNoida. It is named as Mahamaya U.P. StateInstitute of Science. For the establishmentof above institute budget provision of Rs.2500.00 lacs has been made during the 2007-08. Land is being provided by the GreaterNoida Development Authority. An outlay ofRs. 25000.00 lacs is being proposed for theyear 2008-09.
(ii) Establishment of Manyavar KanshiramInstitute of Technology, Lucknow: There isa need of another I.I.T level institute in thestate, so that the quality of technicaleducation might be improved and trainedtechnical manpower might be preparedaccording to the industrial as well as globalneed. Keeping this in view state govt. hasdecided to establish Manyavar KanshiramInstitute of Technology, Lucknow. For thispurpose a token provision of Rs. 1000.00 lacshas been made for the year 2007-08. Land isbeing provided by Lucknow DevelopmentAuthority. An outlay of Rs. 25000.00 lacs isbeing proposed for the year 2008-09.
(iii) Establishment of new girls polytechnics Toreduce gender gap and empowerment of womenin the field of technical education theestablishment of 4 new girls polytechnics havebeen proposed one each in four Divisionsnamely, Chitrakoot Dham, Deviipatan,Vinddhyachal and Basti.
(iv) Human resources and natural resources shouldbe fully utilized to the maximum extent.Keeping this in view, the department ofeducation has made a strategy to start newcourses in those polytechnics where only oneor two courses are running. These courses willbe based on emerging technology such as nano-technology, bio- technology, materialtechnology, image processing etc. For thepreparation of the syllabus and curriculumnecessary instructions have been given toDirector I.R.D.T. at the Govt. level.
64. Under a centrally assisted programme,some engineering colleges / institutions have beenselected for intensive development. This programmeaims at the following: (a) to create an environmentin which engineering institutions selected under thesaid programme can achieve their own set targetsfor excellence and sustain the same with autonomyand accountability; (b) to support the developmentplans including synergistic networking and servicesto the competitively selected institutions forachieving higher standards; and (c) to improveefficiency and effectiveness of the technicaleducation management system in the state and theinstitutions selected.
65. Technical education needs to be upgraded andexpanded in a big way to meet the emerging challengesin the globalised world and to provide employmentopportunities to the youth. The Sub Group on TechnicalEducation for the Eleventh Five Year Plan (2007-12)appointed by the state government has given valuablerecommendations for the development of technicaleducation in the state (Box 3.10). These need to beimplemented on a priority basis.
X. Financing of Education66. Public expenditure on education and its
composition is indicative of the relative priority givento the education sector and its various constituents.Expenditure of education constitutes about half of thesocial sector expenditure in Uttar Pradesh. As aproportion of NSDP, expenditure on education has beenin the range of 3.5 to 4.0 per cent (Table 3.9).

5 1 The Status of Education
67. Per capita expenditure on education showeda decline in real terms in the early nineties due to thefiscal problems faced by the government. However,since mid-nineties real per capita expenditure oneducation has been showing an upward trend due tohigher priority given to primary education and
increased flow of funds under central schemes. Itneeds to be noted that per capita expenditure in U.P.on education has been the lowest among major Indianstates. It is only two thirds of national average andhalf of what States like Gujarat and Kerala arespending on education (see Table 3.10).
Table 3.9: Educational Expenditure as a Proportion of NSDP and Social Expenditure (%)
Year Education Exp. Social Sector Exp. Education Exp. Per Capita Real Expenditure
(As % of NSDP) (As % of NSDP) as % of Social Expenditure on Education (in Rs.)
1990-91 4.18 7.99 52.32 206.931991-92 3.46 7.00 49.43 168.671992-93 3.98 7.59 52.44 192.351993-94 3.32 7.01 47.36 161.851994-95 3.47 6.75 51.41 174.691995-96 3.65 7.01 52.07 186.311996-97 3.43 6.67 51.42 191.641997-98 3.52 7.48 47.06 190.421998-99 4.24 7.48 56.68 230.801999-00 3.82 6.66 57.36 217.332000-01 3.84 6.67 57.57 221.492001-02 4.05 7.58 53.43 238.172002-03 3.14 6.34 49.53 186.51
Source: Calculated from Reserve Bank of India Bulletins
050
100150200250300
1990
-91
199
1-92
1992
-93
1993
-94
1994
-95
199
5-96
1996
-97
199
7-98
1998
-99
199
9-00
2000
-01
200
1-02
2002
-03
Figure 3.17: Per Capita Real Expenditure on Education (in Rs.)
Years
Per
cap
ita
Rea
lE
xpen
dit
ure
(RS
.)
Per Capita Real Expenditure on Education (in Rs.)
0 0.5
1 1.5
2 2.5
3 3.5
4 4.5
19
90
-91
19
91
-92
19
92
-93
19
93
-94
19
94-
95
19
95
-96
19
96
-97
19
97
-98
19
98
-99
19
99
-00
20
00
-01
20
01
-02
20
02
-03
Years
Figure 3.16: Education Expenditure As % of NSDP %
Education Expenditure As % of NSDP
Pe
rce
nt

5 2Human Development Report, Uttar Pradesh
68. Though total expenditure on education hasincreased more than four times since 1990-91, it hasdeclined as a proportion of total expenditure comingdown from around 22 per cent in 1990-91 to around 20per cent in 2000-01 and further to around 18 per cent in2005-06 (Table 3.10). This is mainly due to the fiscalcrunch faced by the state during this period.
69. The composition of education expenditure hasbeen shown in Table 3.11. Slightly above 10 per cent of
education expenditure is devoted to higher education,rest being spent on school education. Within expenditureon school education, about two third is spent on primaryeducation and one third on secondary education. In thelast five years, greater priority is being given touniversalization of education in the state. Nearly 98per cent of expenditure on primary education is in theform of grants-in-aid to private schools. In the case ofsecondary education, grants constitute about 75 to 80per cent of total expenditure.
Table 3.10 :Expenditure on Education and Total Budgetary Expenditure (Revenue Account)(Rs. in crore )
Year Expenditure Total Educational Exp.On Education Expenditure As % of Total
1990-91 2093.8 9538.4 21.95
1995-96 3360.9 17556 19.14
1997-98 4156.9 22195 18.73
1998-99 5840.2 27466 21.26
2000-01 6090.9 31033 19.63
2001-02 6018.2 31780 18.94
2003-04 6254.6 37944 16.48
2004-05RE 7538.8 45622 16.52
2004-05BE 6544.3 42786 15.30
2005-06BE 8588.6 48071 17.87
Source: Budgetary Documents, U.P. Government
70. A grant structure needs to be evolved whichrelates grant levels to various school performanceindicators such as percentage of total expenses spenton non-salary costs (to encourage quality improvements),percentage of total funds raised from non-fee sourcessuch as parental donations (to encourage equitable
resource-generation), percentage of parents who aresatisfied with the school (to encourage accountability),and average number of students per class (to encouragecost-consciousness), etc. A more rational grant structurecould be a policy correction that has potentially thebiggest pay-off in increasing educational efficiency.
Table 3.11 : Composition of Education Expenditure (Percent)
Year Elementary Secondary School Higher &Others TotalEducation Education Education Education Education
Expenditure
1990-91 57.87 30.06 87.93 12.07 100.00
1995-96 55.43 33.03 88.46 11.54 100.00
1997-98 54.61 33.10 87.71 12.29 100.00
1998-99 56.83 31.77 88.60 11.40 100.00
1999-00 54.59 31.11 85.70 14.30 100.00
2001-02 62.94 27.83 90.77 9.23 100.00
2003-04 58.06 31.31 90.37 9.63 100.00
2004-05 RE 58.38 31.51 89.89 10.11 100.00
2005-06 RE 59.84 28.20 88.04 11.96 100.00
Source: Computed from State Budgets

5 3 The Status of Education
71. The demand for education at various levelshas been growing at a rapid pace and will continue todo so in the coming year. The state government with itslimited resources will not be able to meet the totalrequirement of funds for financing expansion ofeducation in the state. Gradually the role of privatesector in the field of education is increasing. Thegovernment has introduced the scheme of recognitionwithout grant to new educational institutions to promoteopening up of new schools particularly at the secondarylevel. Public private partnership in promoting educationalinfrastructure is being encouraged specially at technicaland higher education level (see Box 3.11).
Box 3.11: Public Private Partnership inEducation
The public private partnership in the administrationand financing of school education is being encouragedin the state though NGO participation. This is thenew dimension of joint responsibility for thedevelopment of education in the state. The TenthFive Year Plan of U.P. aimed at promoting theparticipation of private entrepreneurs in establishing,expanding and upgrading educational institutions, asthe demand for this level of education is increasingvery fast.
As noted earlier, of late, the private sector has alsobeen involved in setting up degree colleges in theState. This has curtailed the financial burden of theState Government in opening of new colleges. Thepolicy in education financing is that more governmentmoney be spent on primary education and the highereducation should thrive more on private participation.
The UP government is further hopeful that the policyof encouraging private partnership in education willhelp improve the position of the supply of educationin the state. It is also likely to bring about qualitativeimprovement through induced competition.
As mentioned earlier, the government hasallowed opening up of private universities in the stateby enacting a private Universities Act. Seven privateuniversities have already been set up under the Actin the state.
72. In view of the educational backwardness ofthe state, the Twelfth Finance Commission (TFC) hasmade provision for special education grants to UttarPradesh so that the required level of public expenditureon education does not decline below the normative levelas suggested by the Finance Commission. Year wisegrants recommended for education by TFC to UttarPradesh for the award period covering five years from2005-6 to 2009-10 have been shown in Table 3.11. It isexpected that the larger resource availability for
education sector in the state will contributesignificantly in overcoming the educationalbackwardness of the state in the coming years.
Table 3.12: TFC Grants In Aid For EducationSector to U.P.
Year Amount of grants Grants to U.P.to U.P. as percent of
(in Rs. crores) total education
2005-06 736.87 43.6
2006-07 806.87 43.7
2007-08 883.52 41.4
2008-09 967.45 43.8
2009-10 1059.36 43.9
Total 2005-10 4454.07 43.8
Source: Report of the Twelfth Finance Commission2005-10, Government of India, November 2004.
XI. Future Challenges and Outlook73. Substantial progress has been made in the state
during the last decade in the field of educationparticularly at the primary level. However, a number ofserious challenges remain to be addressed in the comingyears. Some of the basic future challenges and emergingoutlook are highlighted below:
74. As the primary education is nearinguniversalization level, generating extra capacity by
Box 3.12: Public Expenditure on Education in U.P.:Some Basic Concerns
l Public spending on education in UP at all levels,particularly at higher levels is insufficient and stilllow as compared to other states, even though ithas increased substantially over the last 15 years.
l The relative decline in educational spending,particularly, since the year 2000 is worrisomeindeed and needs to be. checked
l Spending on education appears to have beencrowded out under the pressure of fiscal reformsand initially due to financial crunch at the state level.
l Specialized education, vocational and technicaleducation have in particular been starved of funds
l The pattern of educational spending has been bothinequitable and inefficient.
l The efficiency of resource utilization in educationin the state is very low. Schools must choose mostcost effective inputs without sacrificing the qualityof teaching.
l Better utilization is needed of the externalresources for education that are received bygovernment of UP.

5 4Human Development Report, Uttar Pradesh
opening new secondary schools and institutions ofhigher learning will be required.
75. Along with expansion in physical infrastructureand other facilities, quality of education will have to bestrengthened. Quality will be hallmark of education inthe days to come and the state that remains backwardin quality education will be too weak to catch up withthe forward states in almost every respect. The thrusttherefore will have to be placed on quality improvementalong with quantitative expansion.
76. Reducing the gender gap in education andmitigating the educational disadvantages of theminorities and other backward classes will need to betaken care of more effectively with a view to promotetheir educational development in particular and theintegrated social development in general.
77. Attention will have to be focused on promotionof primary education in the lagging districts and blocks.
78. Gradually the system of education in UP ismoving from state controlled and state financed systemto privately managed and privately funded system.However, the State still has a major role to play.
79. An increase in fee is bound to occur in the daysto come and soon the system of “subsidized education” islikely to be replaced by “user charging education system”.The surveillance of the government on the user chargeswill be important to ensure ‘equality’ and ‘accountability.’
80. Since free and compulsory education forchildren in age group of 6-14 years has been madeFundamental Right in the Constitution of India, it willnot be possible to make elementary education in thegovernment sector fee charging. At secondary andhigher levels, user charges will have to be raised andelement of subsidy reduced. For making thegovernmentally subsidized system of education to feecharging one, a political consensus will be necessary,without which it would not be possible to raise orimpose additional fee. However, along with makingthe system more fee charging, adequate provision willhave to be made for free-ships to poor students lestthey are deprived of education along with liberalprovision of educational loans.
81. Under the liberalization regime in UttarPradesh, as in the country, foreign schools anduniversities may open up their chain in India andthey will find U.P. a better destination in view ofthe huge demand for secondary and h ighereducation. This calls for a move to restructure thefinancing pattern and the grants in aid criteria forquality improvement in school education and theuniversity education of all types, particularly in thegovernment aided educational institutions so thatthey are able to successfully compete in the changedscenario of inter-state and international educationcompetition.