the contributions of hard skills and socio-emotional behavior to
TRANSCRIPT
2040 Sheridan Rd. w Evanston, IL 60208-4100 w Tel: 847-491-3395 w Fax: 847-491-9916www.northwestern.edu/ipr w [email protected]
Institute for Policy ResearchNorthwestern UniversityWorking Paper Series
WP-05-01
The Contributions of Hard Skills andSocio-emotional Behavior to School Readiness
Greg J. DuncanFaculty Fellow, Institute for Policy Research
Edwina S. Tarry Professor of Education and Social PolicyNorthwestern University
Amy ClaessensGraduate Research Assistant, Institute for Policy ResearchGraduate Student, Human Development and Social Policy
Northwestern University
Mimi EngelGraduate Research Assistant, Institute for Policy ResearchGraduate Student, Human Development and Social Policy
Northwestern University
Version date: October 7, 2004
DRAFTPlease do not quote or distribute without permission.
Abstract
Children enter kindergarten with disparate abilities in reading and mathematics, capabilities forsitting still and making friends, mental health, and inclinations for aggressive behavior. Therelative power of these characteristics to predict later school achievement is the subject of thispaper. Data from the Early Childhood Longitudinal Study–Kindergarten Cohort are used to relateschool-entry test scores on math, reading and general knowledge as well as both teacher andparent reports of self-control, sociability, mental health, and aggressive behavior to reading andmathematics achievement scores at the end of first grade. We also model the power of incrementsin these skills and behaviors across kindergarten to predict test scores at the end of first grade.We find much more predictive power for the “hard” skills than for the collection of “soft” skillsboth for the overall sample and for subgroups defined by race/ethnicity, socioeconomic status,and gender. By far the most powerful avenue for boosting first grade test scores appears to beimproving the basic skills of low-achieving children upon entry into kindergarten.
1
I. Introduction
There is little agreement about what constitutes school readiness. A 1991 surveyof kindergarten teachers found that when asked to name the most important determinantsof readiness to learn, the most cited attributes were: being physically healthy, rested, andwell nourished; being able to communicate needs, wants, and thoughts verbally; beingenthusiastic and curious in approaching new activities; taking turns; and knowing how tosit still and pay attention (Lewit & Baker, 1995; National Center for EducationalStatistics, 1993). Only 10 percent of kindergarten teachers thought that it was importantthat children starting school know the alphabet.
In contrast, President George W. Bush endorsed skill oriented Head Start reformsin 2002 with the words, “On the first day of school, children need to know letters andnumbers. They need a strong vocabulary.... These are the building blocks of learning, andthis nation must provide them.”1 Supporting the Bush position is a report from theNational Research Council’s Committee on the Prevention of Reading Difficulties inYoung Children, which argued for the importance of the acquisition of certain pre-literacy skills before kindergarten and urged that all children be provided access to earlychildhood environments that promote language and literacy growth (National ResearchCouncil, 1998).
Given the increasing emphasis on school readiness, and the potential forpreschool programs to promote school readiness skills, it is essential to understand whatchild abilities and behaviors at school entry are most likely to lead to later school successand adult achievement. We use data from a large and representative sample ofkindergarteners -- the Early Childhood Longitudinal Study-Kindergarten Cohort – toestimate the relative power of both “hard” and “soft” skills to predict later schoolachievement. The survey tested the academic skills of entering kindergarteners and at thesame time asked both teachers and parents about a host of children’s socioemotionalbehaviors. We relate these reports to the children’s subsequent reading and mathematicsachievement. We begin with a review of the literature, followed in Section III by adescription of our data source and its measures. Section IV presents our results, followedin Section V with a discussion and conclusion.
1 http://www.edweek/we/newstory.crm?slug=30bush.h21
2
II. Background
In 1990, the National Governors Association along with the President listed as itsfirst goal for education, “By the year 2000, all children in America will start school readyto learn”(Action Team on School Readiness, 1992). At the time, the concept of schoolreadiness was poorly defined (Kagan, 1990; Crnic & Lamberty, 1994). Work since thenhas suggested five important elements of children’s school readiness: cognition andgeneral knowledge; approaches to learning; emotional well-being and social competence;communicative skills; and health and physical development (Kagan, Moore, &Bredekamp, 1995), although the relative importance of these elements has not beenestablished.
Our own empirical work focuses on the importance to school success of: (i)school-entry cognitive skills as measured by test scores and (ii) socioemotional behaviorssuch as self-control, interpersonal skills, and both “internalizing” and “externalizing”behavior problems. It draws from a diverse array of literatures.
Links between early and later cognitive skills are documented in a broad literatureon the “continuity” in such skills across time. Our interest is in going beyond correlationsto understand to what extent, for example, early reading skills are causal building blocksfor eventual reading proficiency. But we also have an interest in whether early readingskills “cross over” to benefit mathematics achievement, for example by enabling childrento better understand word problems. The teacher survey results suggest a more profoundform of “crossover” — from socioemotional behaviors to reading and math achievement.In this case the literature is quite sparse, since most longitudinal research on children’scapabilities has been conducted within domain, linking, for example, early to laterconduct disorder rather than early conduct disorder to later achievement.
In concentrating on school-entry skills, we ignore a large literature linkingadolescent skills and behaviors to adult achievements. Research on labor marketoutcomes suggests that both cognitive and noncognitive skills developed by adolescenceare important predictors of earnings and occupational attainment (Jencks et al., 1979;Farkas, 2003; Bowles, Gintis, & Osborne, 2001; Caneiro and Heckman, 2003), althoughthere is little agreement on what noncognitive skills matter the most.
Continuity in cognitive skills: causal or spurious? Theory and evidence frompsychology suggest that there is considerable continuity in cognitive skills across time.Early IQ test scores are highly correlated with later test scores, particularly when“early” is defined around age 6 (McCall, Applebaum, and Hogarty, 1973). In theirmeta-analysis of early-grade longitudinal studies, La Paro and Pianta (2000) reportmean correlations of .43 in academic measures from preschool to either kindergarten orfirst grade and of .48 for academic measures between kindergarten and first or second
3
grade. Drawing national data from the Children of the Longitudinal Survey of Youth, Kowaleski-Jones and Duncan (1999) report that correlations between ages 6-7 and 12-13 were .54 and .51 for boys� and girls� respective PIAT reading scores and .43 and .53 for PIAT math scores.
Cross-time correlations in cognitive skills could reflect either causal or spurious effects. A causal story would be one in which achievement at older ages is the product of a sequential process of skill acquisition, with early-stage achievement being a causal prerequisite for later achievement. On the other hand, it could be that genetic endowments of cognitive skills are omnipotent and correlations observed among test scores at different ages are the spurious reflection of these unchanging endowments. In the first, but not second, case a cognitive skills intervention would likely have lasting impacts on achievement. Of course, both causal and spurious processes are likely to be at work but the concern of this paper is with the causal impacts of early achievement and of increments to that achievement on later academic success.
Continuity and crossover in socioemotional behaviors. Continuity in socioemotional domains is less certain. La Paro and Pianta (2000) report mean correlations of about .30 social/behavioral measures from preschool to either kindergarten or first grade, which is about one-third less than mean correlations for academic measures. In terms of behavior problems, Kowaleski-Jones and Duncan (1999) estimate that age 6-7 to age 12-13 correlations in a composite behavior problems index (.38 for boys and .43 for girls), which are only slightly less than achievement correlations. Caspi (2000) uses data from the Dunedon longitudinal study to classify children at age 3 into temperament groups. He finds that undercontrolled 3-year-olds grew up to be impulsive, unreliable and antisocial, while inhibited 3-year-olds were more likely to be unassertive and depressed.
Personality psychologists find considerable continuity in the �big five� personality traits: neuroticism, extraversion, openness, agreeableness and conscientiousness (Costa & McRae, 1994), at least from early adulthood through the rest of the life course. In their meta-analysis of personality trait consistency, Roberts and DelVecchio (2000) find that while traits are consistent over time, consistency increases with age. Arguing against lock-step continuity, Moffitt (1993) identifies two distinct categories of antisocial behavior -- adolescent-limited and life course persistent. While a small proportion of individuals exhibit antisocial behaviors throughout the life course, the majority of people who behave antisocially experience a more temporary involvement in antisocial activities, typically during adolescence. Thus, the development and persistence of some behavioral aspects of noncognitive skills may be more episodic than continuous for some children.
Given that teachers emphasize the importance of emotional, social and other noncognitive skills for school readiness, it might be expected that early socioemotional behaviors have �cross-over� effects on later achievement outcomes. The preferred approach to estimating linkages between early socio-emotional behavior and later achievement is to ask whether interventions directed toward changing behavior have a beneficial effect on subsequent school achievement. Very few random-assignment behavioral interventions estimate impacts on academic outcomes. An exception is Dolan et al. (1993), who report results from a behavioral intervention targeted to both aggressive and shy behaviors among first graders. A random-assignment evaluation showed short-run impacts on both teacher and peer reports of aggressive and shy behavior, but no cross-over impacts on reading achievement. They also test a reading intervention and find within-domain impacts on reading achievement but no cross-over effects on behavior.2
2 A comprehensive approach to addressing conduct problems identified in first grade, the Fast Track prevention program concentrated its resources on the first two years of elementary school, and adopted a random assignment research design (Conduct Problems Prevention Research Group, 1992).
4
Hinshaw (1992) reviews the nonexperimental literature on links between early externalizing behavior problems and subsequent academic underachievement and notes that while a number of studies have found significant correlations, few have controlled for baseline achievement. This raises the possibility that the correlations are the spurious result of SES, other family factors (psychopathology, coercive parenting, maternal depression), or child speech and language difficulties.
The most noteworthy addition to the nonexperimental literature since the Hinshaw review is based on the Beginning School Study (BSS), which began following a cohort of 790 first-grade Baltimore public school children in the fall of 1982. Alexander, Entwisle and Horsey (1997) use the BSS to examine the effect of first grade school performance on high school dropout. Their scale of noncognitive skills, labeled �engagement behaviors,� includes items that measure student work habits and teacher ratings of externalizing behaviors and adaptability. Cognitive measures include achievement test scores and grades. Models include a number of additional school-related and demographic controls. They find that the engagement measure and grades are equally predictive of high school dropout. Alexander, Entwisle and Dauber (1993) estimate both short (end of first grade) and longer term (end of fourth grade) effects of three noncognitive skill clusters -- Interest-Participation, Attention Span-Restlessness and Cooperation-Compliance. They find that the first two are associated with short term achievement test score gains as well as grades in both the short and long term. Interestingly, they also find that the effects of noncognitive skills on achievement test scores appear larger in longitudinal than in cross-sectional models.
Our own analyses parallel the BSS studies, although they have the advantage of being drawn from a large and nationally representative sample of a recent cohort of kindergarteners. Another advantage is that we are able to examine the effects of cognitive and noncognitive skills measured at kindergarten entry as opposed to fall of first grade, when the vast majority of children have already been exposed to some schooling.
III. Models
We view school achievement as a product of the �hard� and �soft� skills children bring to kindergarten, children�s own endowments of ability and temperament, and the enduring advantages and disadvantages of family background characteristics such as socioeconomic status: (1) ACHi1st = a1 + ß1 HARDSKILLiFK + ß2 SOFTSKILLiFK + ß3 FAMi + ß4 CHILDi + eit
where ACHi1st is the math or reading achievement of the ith child at the end of first grade; HARDSKILLiFK is the collection of math, reading and general knowledge skills that child i has acquired at the point of entry into kindergarten as assessed by achievement tests in the fall of the kindergarten year; SOFTSKILLiK is the collection of social, regulatory and behavioral characteristics that child i has acquired as of the fall of the kindergarten year as assessed by both parents and teachers; and FAMi and CHILDi are sets of family background and child characteristics that are likely to exert enduring influences on child achievement up to and after the point of school entry.3
However, the Fast Track intervention in grade 1 included direct tutoring in reading skills so it is not possible to disentangle impacts of the social-emotional and academic components of the program (Conduct Problems Prevention Research Group, 2002). 3 We have intentionally omitted from this model influences between the start of kindergarten and the time of the achievement tests (the end of first grade in our data). Prominent examples include characteristics of schools, neighborhoods and family conditions that children are exposed to in their
5
Our interest is in estimating ß1 and ß2, which, in the absence of omitted-variable bias, can be interpreted as the causal impact of school-entry skills on subsequent achievement. Lacking experimental manipulation of these skills and behaviors, we are forced to rely on longitudinal models for estimating these impacts and adopt two strategies for doing so.
Our first strategy for unbiased estimation of ß1 and ß2 is to estimate an equation of the form of equation (1), including as many measures of FAM and CHILD as possible. Our data set provides us with nearly 100 such control variables, most of which measure family circumstances between birth and entry into kindergarten. Of course, one can never be certain that even large numbers of control variables capture all of the important dimensions of FAM and CHILD, which leaves open the possibility that this approach will still produce biased estimates of ß1 and ß2.
Our second strategy for estimating ß1 and ß2 is to relate changes in HARDSKILL and SOFTSKILL over the course of kindergarten to subsequent achievement. We do so with the following estimation model: (2) ACHi1st = c1 + γ1 HARDSKILLiSK + γ2 SOFTSKILLiSK + γ3 HARDSKILLiFK +
γ4SOFTSKILLiFK + γ5 FAMi + γ6 CHILDi + εit with ACHi1st, HARDSKILLiFK, SOFTSKILLiFK, FAMi and CHILDi defined as before. HARDSKILLiSK is the collection of math, reading and general knowledge skills that child i has acquired in the spring of kindergarten and SOFTSKILLiSK is the collection of social, regulatory and behavioral skills that child i has acquired as of the spring of the kindergarten year. With measures of HARDSKILL and SOFTSKILL at both the beginning and end of kindergarten in the equation, the coefficients on the end-of-kindergarten assessments (γ1 and γ2) amount to estimates of the impact of changes in these skills over the course of kindergarten on end-of-first grade reading and math scores.4
The more general logic of this change model is that if a skill or behavior affects long-run achievement, then short-run changes in that skill or behavior, controlling for starting position, ought to be predictive of eventual achievement. Indeed, much of the Head Start debate has been framed in those terms � e.g., Head Start should augment skill X because that will be beneficial for success in school. Our data do not measure skill augmentation in the preschool period, but they do provide a measure of
early school years. We omit these since we seek a �reduced form� estimate of the role of skills and behaviors that constitute school readiness. Schools undoubtedly account for many of the achievement gains that students enjoy, and it is important to structure school experiences so that they reinforce or compensate for skills children bring with them into school. Accounting for the paths by which school, neighborhood, family and child-specific factors influence school achievement is undoubtedly important, but is beyond the scope of this paper. Leaving them out of the analysis does not bias our estimates of the total effects of kindergarten-entry skills and behaviors on subsequent achievement.
4 Equation (2) is equivalent to a formulation in which ACH is a function of changes in and beginning levels of HARDSKILL and SOFTSKILL:
(3) ACHi1st = d1 + δ1 ∆HARDSKILLi + δ2∆SOFTSKILLi + δ3 HARDSKILLiFK + δ4 SOFTSKILLiFK + δ5 FAMi + δ6 CHILDi + ηit with ∆ indicating a difference between the beginning and end of kindergarten. Algebraic manipulation shows that the δ1 and δ2 parameters in (3) are identical to the γ1 and γ2 parameters of equation (2). As with Jencks and Phillips (1999), we prefer (2) to (3), since it is more amenable to the reliability adjustments we make.
6
augmentation over the course of kindergarten. If the latter matters, then perhaps the former does as well.
IV. Data The Early Childhood Longitudinal Study-Kindergarten (ECLS-K) follows a nationally
representative sample of 21,260 children who were in kindergarten in 1998-99. The study intends to collect six waves of data at the following time points: fall and spring of kindergarten and first grade, and spring of third and fifth grades. Only kindergarten and first grade data were available to us. Data are collected from multiple sources including direct cognitive assessments of children and interviews with parents and surveys of teachers and school administrators. The ECLS-K focuses on children�s early school experiences and collects extensive data at the child, family, classroom and school levels. The current study uses data from three waves of ECLS-K data collection: fall of kindergarten in 1998, spring of kindergarten in 1999 and spring of first grade in 2000. As described in Table 1, cognitive tests were administered in the fall and spring of kindergarten, and in the spring of first grade. Parent and teacher data were collected in the fall and spring of kindergarten.5 Although baseline data collection included over 21,000 children, our analyses include between 12,000 and 13,000 cases, due to missing data. Students were excluded from the analysis if their data were missing fall of kindergarten or spring of first grade test scores or if they were missing data on gender. We also excluded cases that were missing six or more of the parent and teacher social rating scales. The vast majority of our missing data, however, is due to missing test scores (e.g. there are a total of 17,622 reading IRT scores in the fall of kindergarten, and a total of 16,635 reading IRT scores in the spring of first grade).
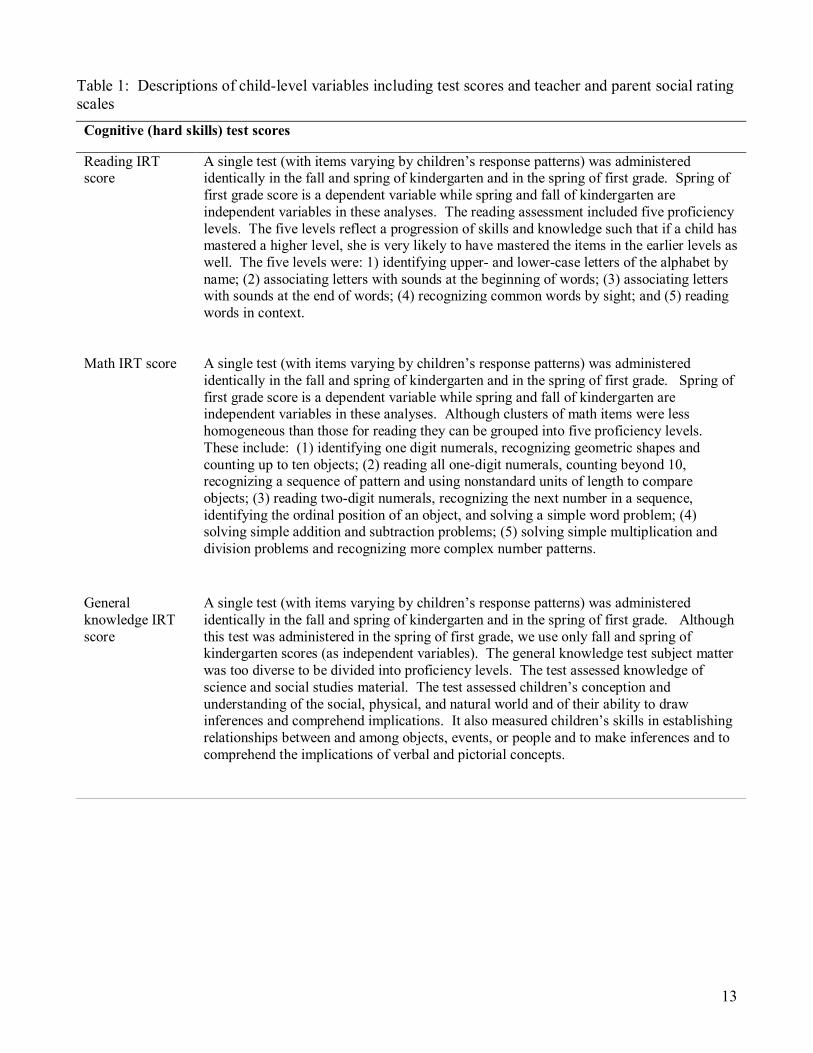
The battery of cognitive tests given as part of the ECLS-K covered three subject areas: language and literacy, mathematical thinking, and general knowledge (Table 1). The children pointed to answers or gave verbal responses. They were not asked to write or explain their reasoning. The tests were administered using a computer assisted interviewing methodology. The cognitive assessment scores used in our analyses are IRT (item response theory) scores that are included in the ECLS-K data.
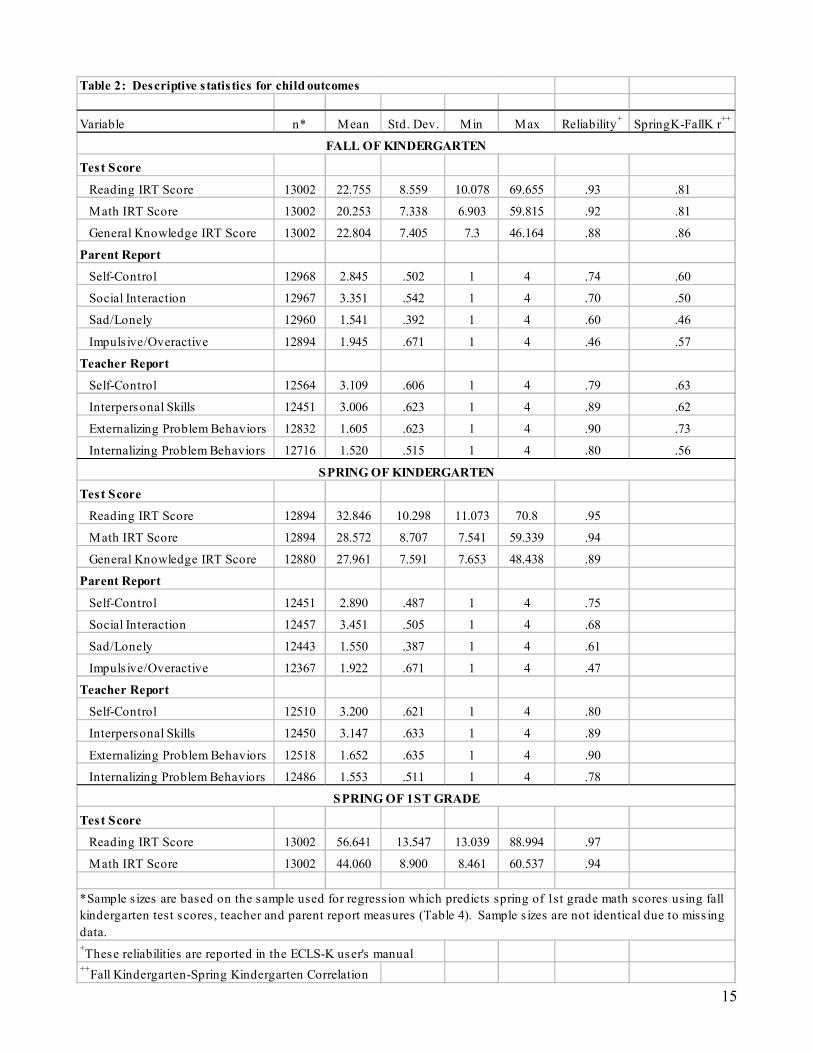
Descriptive statistics on the outcomes of interest are presented in Table 2, with comparable information on the control variables presented in Appendix Table 1. Sample sizes are quite large. All of the IRT test score averages increase substantially from the beginning to the end of kindergarten, and then by even larger increments over the 12-month period to the end of first grade. Sample averages on teacher and parent reports of self-control, social skills and problem behaviors change relatively little, with small gains in self-control and social skills but small increases in both internalizing and externalizing behaviors as well. Correlations in the final column of Table 2 show that although sample averages on the socio-emotional behaviors are changing little, individual scores are quite variable. Fall-to-spring correlations in parent reports range from .56 to .73 and are slightly higher than the cross-time correlations of kindergarten teachers, which range from .46 to .60.
5 Fall parent interviews were conducted between October 1998 and January 1999, and spring interviews were conducted between March and June of 1999. The vast majority (approximately 97%) were conducted by phone by field staff using a computer assistance program. Teacher questionnaires were administered between October and December 1998 for the fall and between March and June 1999 for the spring.
7
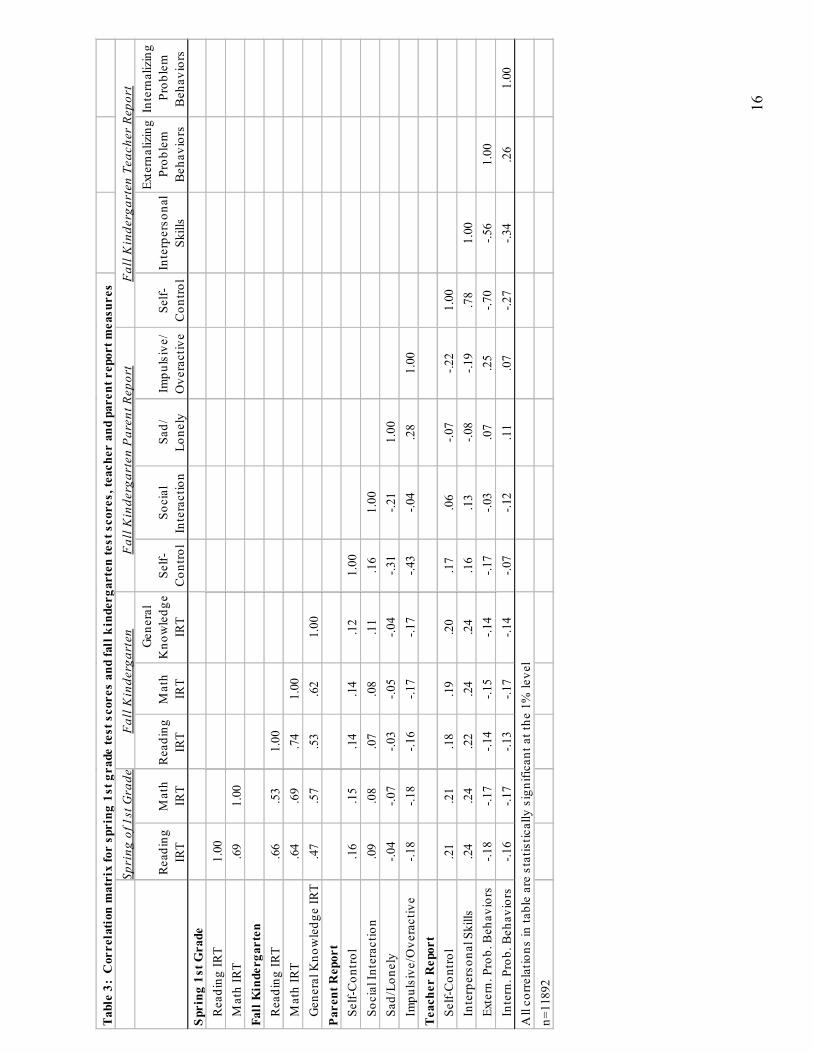
Correlations among the various skill and behavior measures taken at the beginning of kindergarten and end of first grade are shown in Table 3. The first two columns preview some of our regression results by showing strong correlations between a given test across time (e.g., .66 for reading and .69 for math), and a stronger correlation between initial math and 1st grade reading (.64) than between initial reading and 1st grade math (.53). Kindergarten-entry general knowledge test scores have respectable correlations with both subsequent math and reading scores.
Correlations between 1st grade test scores and parent-rated school-entry �soft� skills are all below .20, while correlations with teacher ratings are generally somewhat higher. Interestingly, teacher ratings of both social skills and internalizing mental health problems are considerably stronger correlates of subsequent achievement than are parent reports.
High correlations between parent and teacher reports of the various soft skills might create problems in our attempts include both in regression models of subsequent achievement. The correlations in Table 3 suggest that this is not likely to be the case. Concurrent parent and teacher report of child self-control, sociability, and internalizing and externalizing behavior problems range from .11 to .25. Higher correlations emerge across the various teacher reports, with self-control correlating with interpersonal skills at .78 and with externalizing behavior problems at -.70.
V. Results
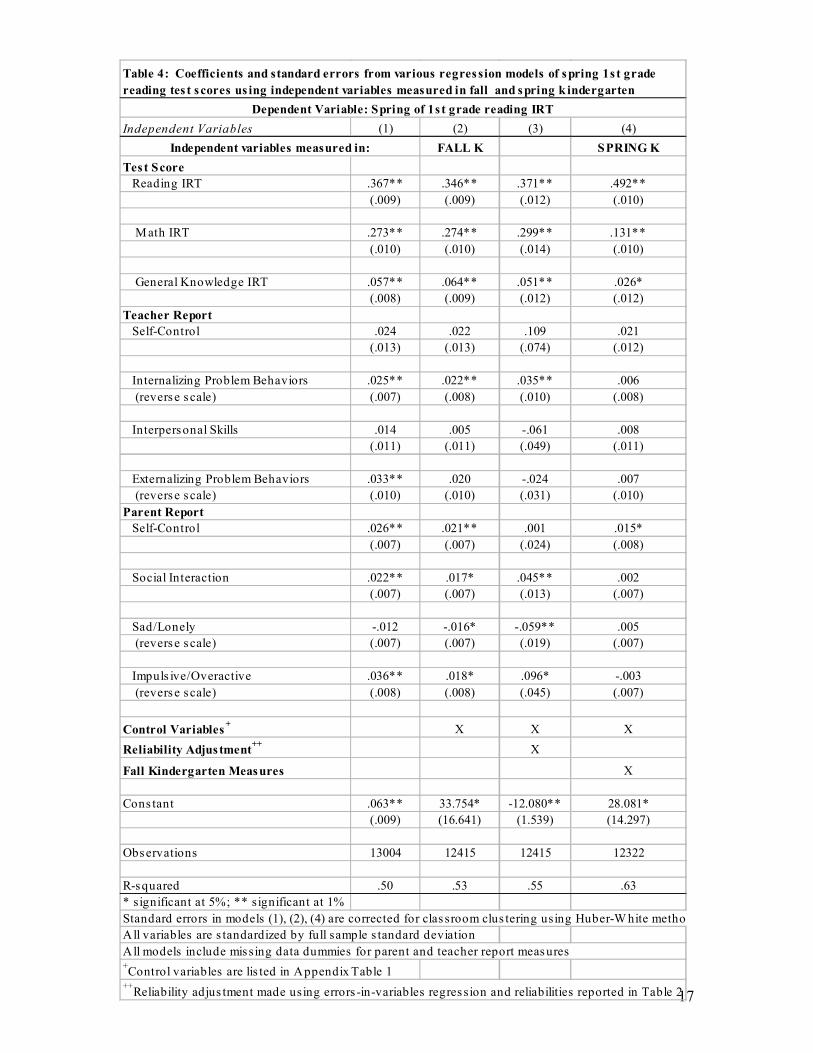
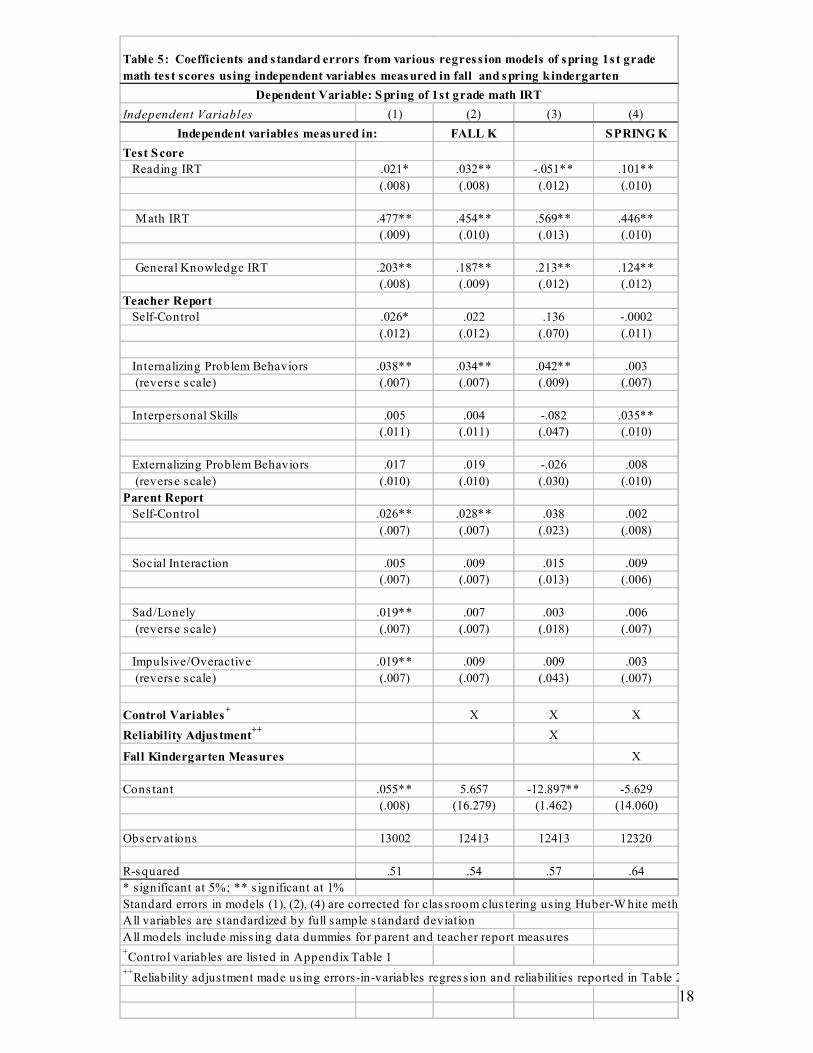
Level models. Table 4 shows estimates of the reading achievement models represented by equations (1; first three columns) and (2; final column). Comparable results for mathematics achievement models are given in Table 5. All variables have been standardized by full-sample standard deviations so that coefficients are comparable with one another and with the correlations presented in Table 3. Scores on variables measuring undesirable characteristics � internalizing and externalizing behavior problems, feeling sad/lonely and impulsiveness � have been reversed so that positive coefficients are expected for all of the skills and socio-emotional measures. Standard errors have been adjusted using Huber-White methods to account for the lack of independence caused by classroom clustering of sample students. Columns (1) and (2) show coefficients and standard errors from regressions that include none and the full set of family and individual controls listed in Appendix Table 1. Model estimates given in the third column adjust coefficients on all of the skill measures for the reliabilities listed in the sixth column of Table 2.6
We first note that adjustments for our extensive set of control variables produce relatively few changes in the coefficients on the test scores and teacher reports of soft skills, which reduce our fears of lingering omitted-variable bias (Altonji et al., forthcoming). As might be expected, these family background controls produced more coefficient reductions in the case of parent reports of socio-emotional behaviors, in particular impulsivity/overactivity. A comparison of standard errors in columns 1 and 2 shows that the addition of the control variables introduced virtually no multicolinearity into these models.
Focusing on the full-control models in the second columns of Tables 4 and 5, it can be seen that beginning reading and math scores are highly predictive of subsequent reading achievement, while beginning math but not reading scores are highly predictive of subsequent math achievement. The general knowledge test is much more predictive of math than reading achievement, although highly significant in both models. 6 We use the EIVREG procedure in STATA to secure these estimates. Since EIVREG does not allow for Huber-White clustering corrections, these adjustments were not made. In the case of the regular regression models, clustering adjustments increased standard errors minimally.
8
Turning to the coefficients on the soft skills, it can be seen that in no case are standard-deviation increments associated with more than a .034 standard-deviation increase in test scores. For end-of-first grade reading scores, parent reports of self-control, social interaction skills and impulsivity/overactivity are at least as predictive as the teacher reports. Curiously, the reverse-scaled parent report of the sad/lonely index has a negative and significant coefficient. In fact, internalizing behavior problems are the only significant teacher-reported assessments in the reading regression. In the case of math achievement, self-control is the only significant parent report, while internalizing problem behavior is the only significant teacher report. The reliability adjustments in the third column of Tables 4 and 5 increase most coefficients somewhat, but do little to alter the general conclusion that school-entry �hard� skills are much more predictive of later school achievement than are either the teacher or parent reports of the �soft� skills.
Change models. The final column of Tables 4 and 5 present estimates from change model (2). Recall that in the presence of beginning-of-kindergarten controls, the coefficients on the end-of-kindergarten measures can be interpreted as the effect of skill changes over the course of kindergarten. The story that emerges is remarkably consistent with that of the level models. Cross-kindergarten gains in math, reading and general knowledge are predictive of subsequent reading and math achievement. Changes in parent-reported self-control are modestly but significantly predictive of reading scores, while teacher reports of gains in interpersonal skills are predictive of math achievement.
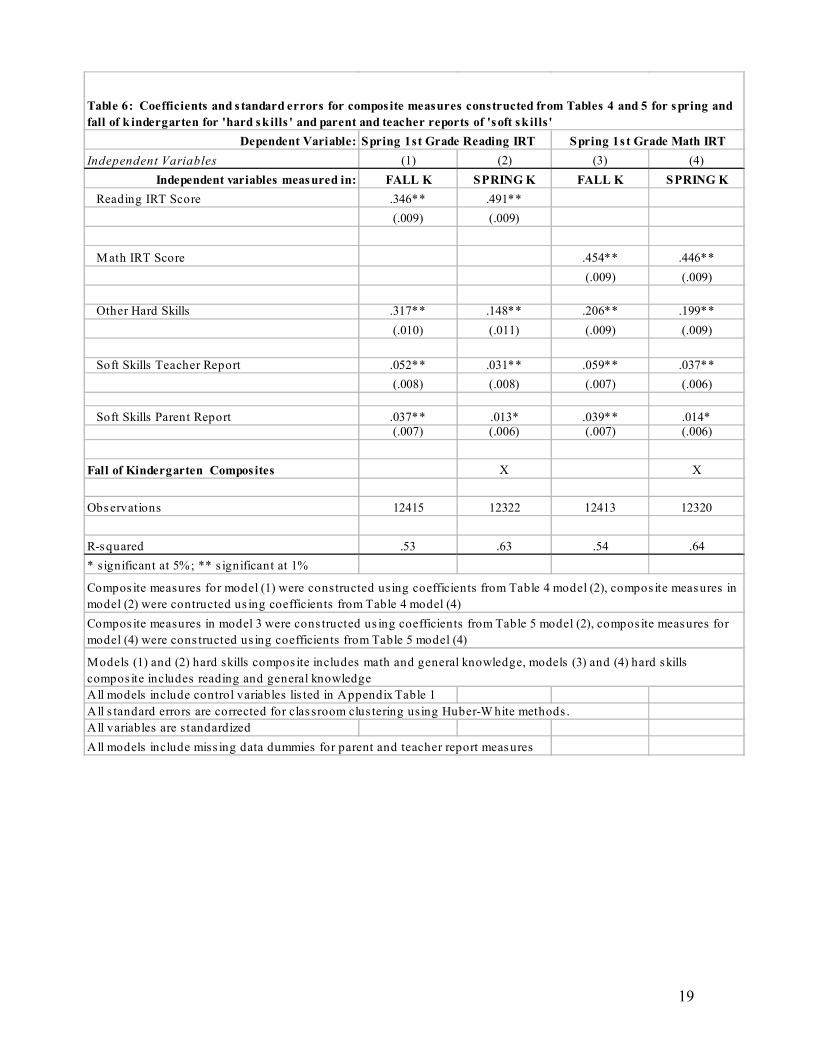
Summary models. As an attempt to summarize the relative importance of the groups of hard and soft skills, we formed composite measures of test scores, and teacher and parent reports of soft skills using the regression coefficients in the second and fourth columns of Tables 4 and 5. In the models predicting reading achievement, we distinguished early reading skills and combined math and general knowledge. In the case of math achievement, we distinguished early math skills and combined reading and general knowledge. Weighting these composites in this way gives them their maximum explanatory power. Restandardizing these composites produces coefficients that are comparable to those in the previous tables.
Table 6 presents estimates of both level and change versions of these models. In all cases, the early math or reading scores are highly predictive of their corresponding outcomes, with standardized coefficients in the .35 to .50 range. Early scores on the �other hard skills� composite have coefficients in the .15 to .30 range. In contrast, teacher and parent reports of socio-emotional behaviors had much smaller standardized coefficients that ranged from .01 to .05. Teacher reports were consistently more powerful predictors of subsequent achievement than parent reports.
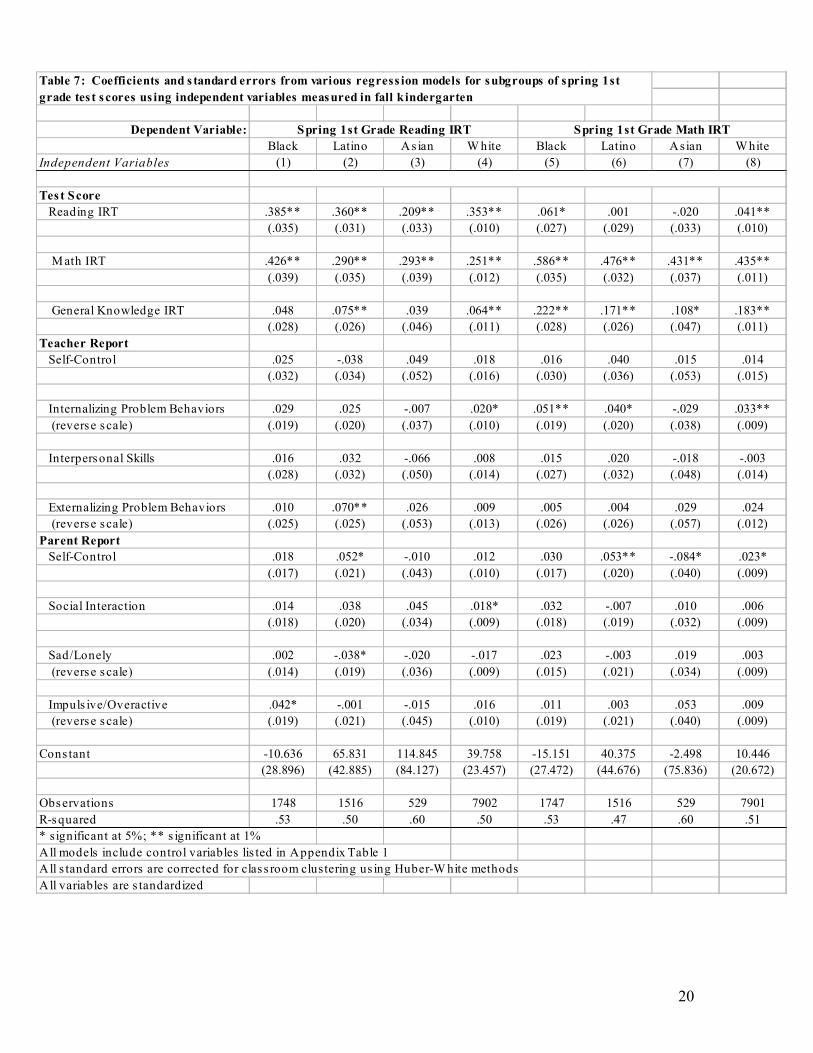
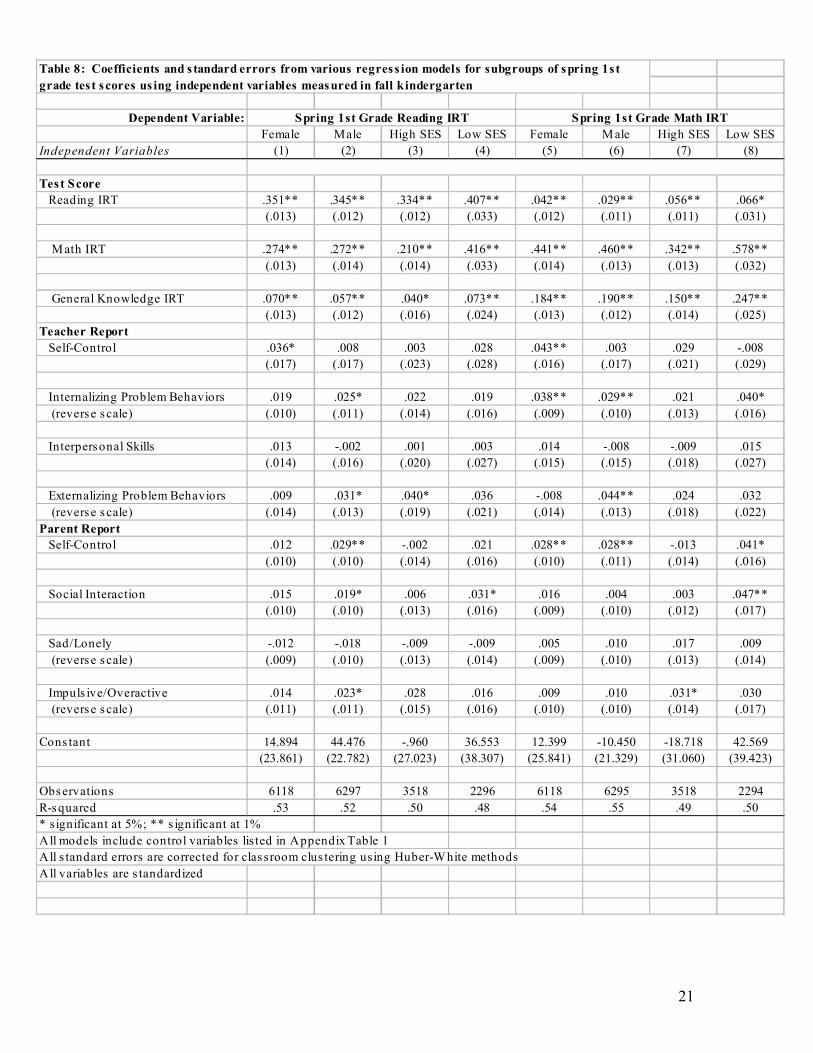
Subgroup models. We next estimated level models for several population subgroups: blacks, Latinos, Asians and whites (Table 7); and gender and low- vs. high-SES families (Table 8). We define low SES as being in the bottom 25% of the weighted distribution on the ECLS-K�s SES composite and high SES as being in the top 25% of that distribution. We do not rescale any of the variables in these regressions. Thus, all are standardized according to full-sample standard deviations, with estimated coefficients reflecting fractions of whole-sample standard deviation changes in a given dependent variable associated with a whole-sample standard deviation change in a given independent variable.
Coefficients on test score variables are remarkably consistent across subgroups. Beginning-kindergarten math achievement is consistently predictive of subsequent reading achievement, particularly for the overlapping groups black and low-SES children. General knowledge but not reading is consistently predictive of subsequent math achievement.
Turning to the socio-emotional behaviors, there are few instances where a given measure is consistently predictive across teacher vs. parent reporter and for both reading and math achievement. The reverse-scaled teacher reports of internalizing behavior have the expected positive associations
9
with subsequent achievement for most groups, as do parent reports of self control. But rarely do any of these coefficients exceed .05.
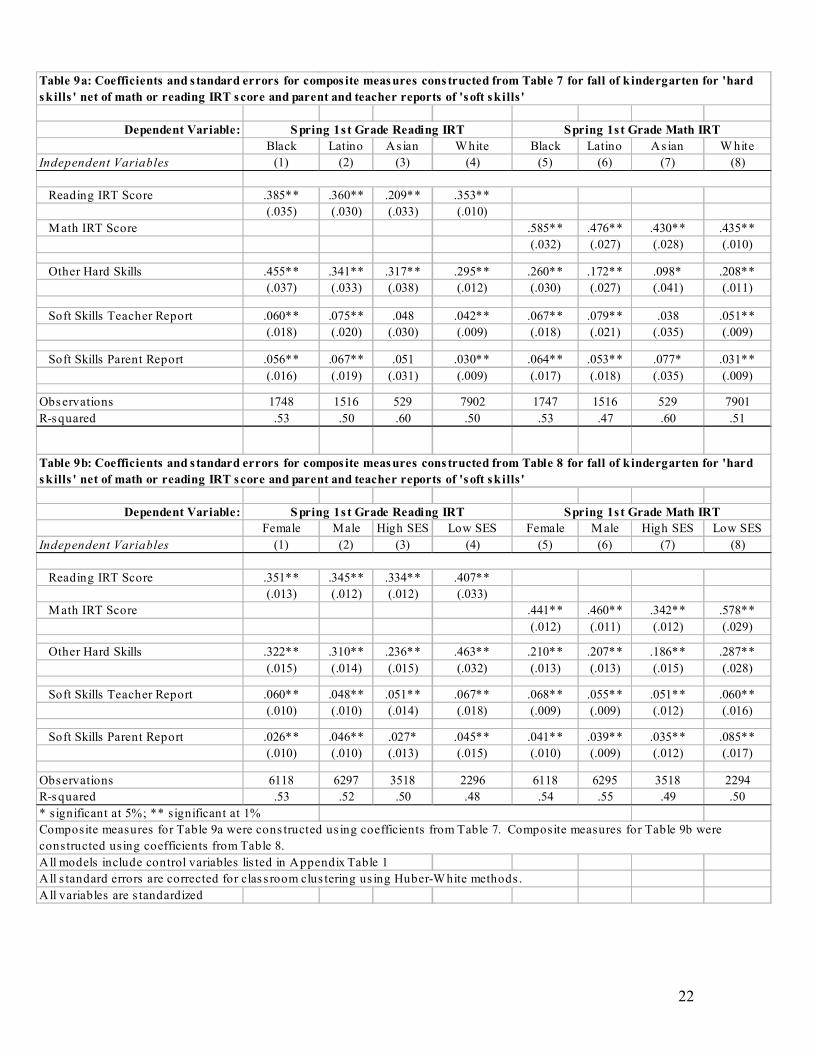
Tables 9a and 9b use summary variables constructed in similar ways to those in Table 6. They confirm the much greater explanatory power of hard skills relative to socio-emotional behavior, with the latter never attaining coefficients as high as .10 and the former almost never attaining coefficients that low. There is some evidence that soft skills matter more for low-SES and Latino children and less for Asian children.
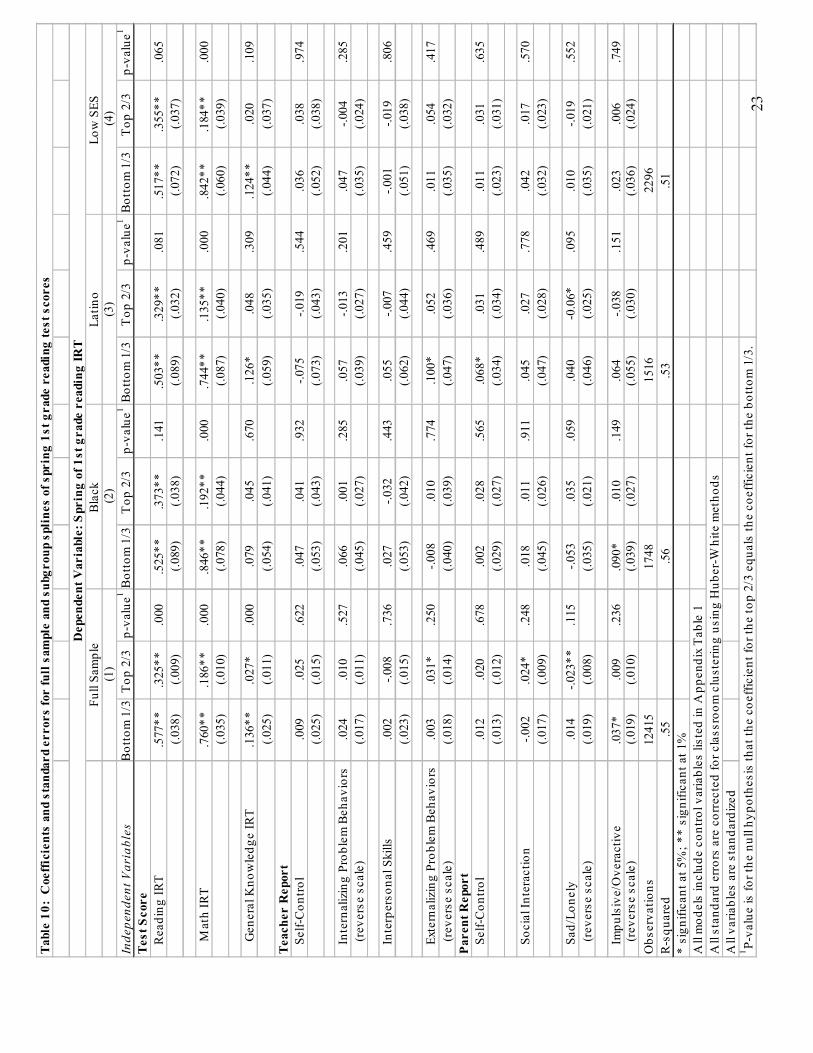
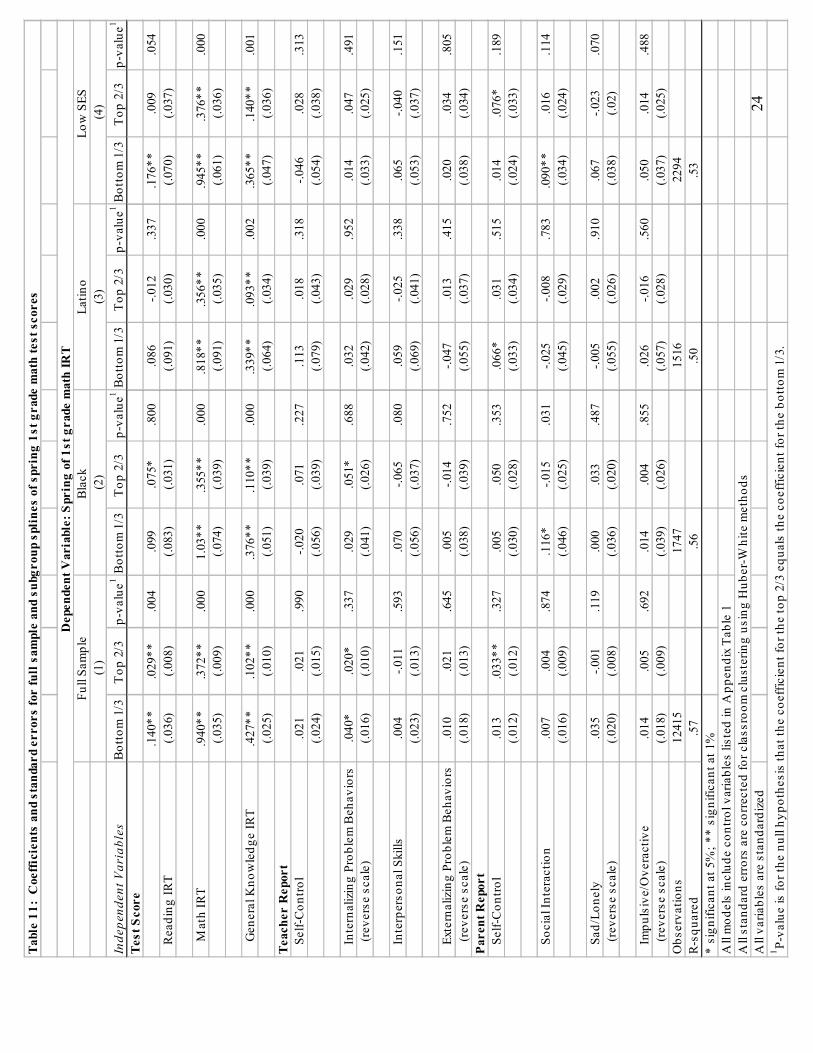
Nonlinear effects? Improving basic academic and socio-emotional skills may matter the most for children with very low levels of these skills. To test for this possibility, we reestimated our level models allowing for different coefficients for children in the bottom one-third of the skill and behavior scales and for children in the top two-thirds. We did this with piecewise linear (spline) functions. Shown in Tables 10 and 11 are the coefficients for the two segments, along with results from a significance test for whether the two slopes differ from one another. Taking the first �Math IRT� entries in Table 10 as an example, it can be seen that the association between beginning math and subsequent reading achievement is highly non-linear. Standard-deviation increases in beginning-kindergarten math achievement are associated with a .76 standard deviation increment in end-of-first-grade reading scores for low initial math achievers but only a .19 standard deviation increment for high initial math achievers. These coefficient differences are highly statistically significant (p<.001).
Looking down the first set of columns in Table 10 and 11, it can be seen that almost all of the associations between initial test scores and end-of-first-grade achievement are highly nonlinear, with gains for low-achievers mattering a lot more than gains for higher achievers. This is true both in the overall sample and, as shown in the remaining columns, for Blacks, Latinos and children in low-SES families.
Reports from kindergarten teachers cited in the introduction would suggest that improvements in noncognitive skills should also matter much more for children entering kindergarten with the most problems. But Tables 10 and 11 provide virtually no support for this idea. For the full sample, only in the case of teacher-reported internalizing problems are coefficients for the most problematic one-third of children statistically significant, and this holds for math but not reading scores. Nor do these coefficients become uniformly stronger among subgroups.
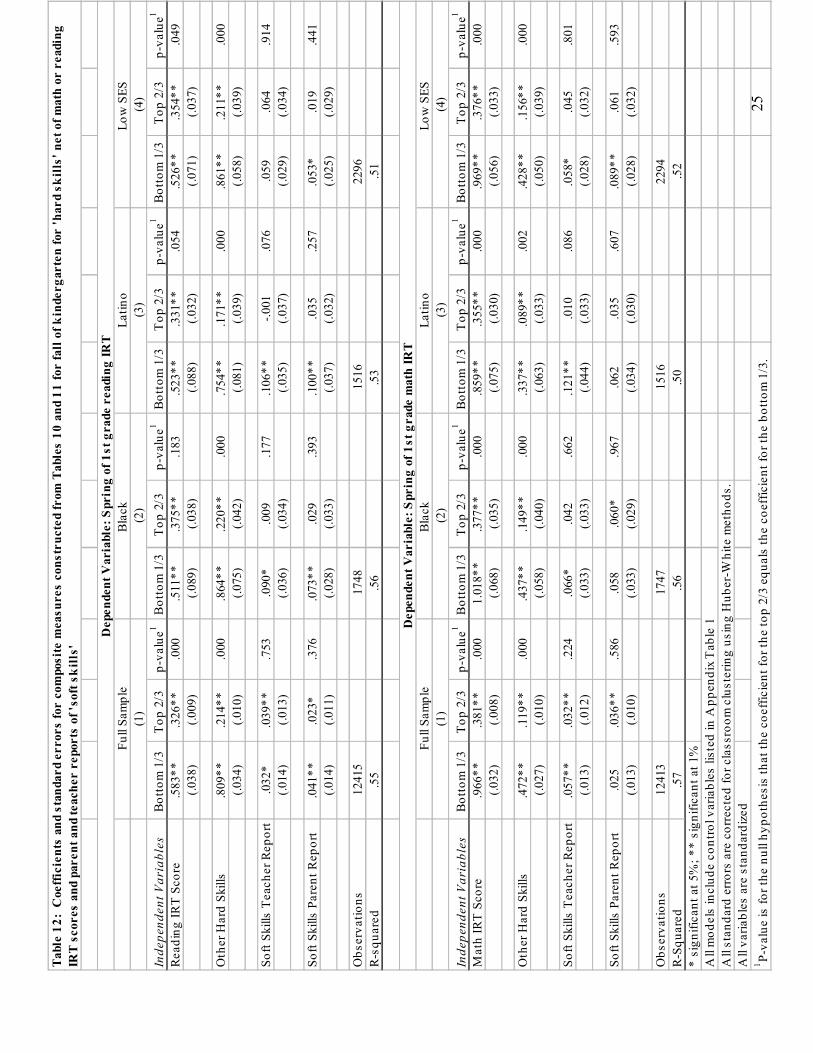
Table 12 provides a summary look at the explanatory power of hard and soft skills in models that allow for nonlinear effects. For reading scores, increasing the math and general knowledge scores of low achievers by one (full-sample) standard deviation is associated with a nearly one standard deviation increase in first-grade reading scores. Coefficients of low achievers are always at least twice those of high achievers. These patterns hold both for the overall sample and for Blacks, Latinos and low-SES subgroups. For end-of-first-grade math achievement, the associations are extremely high for prior math achievement among underachievers. Reading and general knowledge skills have standardized coefficients in the .35 to .45 range for low achievers and in the .10 to .20 range for higher achievers.
Coefficients on teacher and parent reports of soft skills rarely come close to these magnitudes. The most important soft skills appear to be those reported by the teachers for Black and Latino students scoring lowest on them. Coefficient estimates are in the .10 range in most of these cases and statistically significant at conventional levels. Note, however, in Tables 10 and 11 that none of the individual components that went into these teacher-reported composites had statistically significant coefficients for any of these subgroups. In virtually no case do soft skills matter for Black, Latino and low SES children scoring in the top two-thirds of the distributions of these summary variables.
10
VI. Discussion ECLS-K data enable us to relate an exceptionally rich set of academic (reading, math and
general knowledge) measurements in the fall of the kindergarten year, as well as a set of teacher- and parent-rated dimensions of socio-emotional behavior measured at the same time, to academic outcomes (math and reading test scores) measured at the end of first grade. We were surprised by the results.
Given the intensity of the debate over the importance of �soft skills� for children�s school success, we had expected to find considerable evidence that being able to sit still in class or make friends upon school entry would consistently matter for early achievement. But we found little evidence that this was the case, either in the population as a whole, among disadvantaged population subgroups, or among children scoring the lowest on these soft-skill indicators.
More than the usual number of cautions apply at this point in our research on this topic. First, our data are longitudinal rather than experimental and thus subject to omitted-variable bias. Although we were able to control for a very large set of parent and family background factors, adjust for measurement error, and replicate our main findings in change models, it is still the case that we are unable to adjust for all possible sources of bias.
Second, our academic outcomes are measured early in elementary school. As with Alexander, Entwisle and Dauber (1993), we may find that some of the soft skills are more predictive of later than earlier academic outcomes. Data from the third-grade follow-up will provide some information about this, as will our attempts to replicate these findings with other longitudinal data sets.
Third, we have evaluated our collection of soft and hard skills solely on the basis of their ability to predict subsequent math and reading achievement. Policy conclusions regarding interventions require information on the relative costs of improving hard skills and socio-emotional behaviors. While our knowledge base on early reading and math skill interventions is growing, much less is known about the nature and costs of interventions targeting behavior, social and mental health problems. It is conceivable that �soft skill� interventions are warranted by our analyses if they are substantially less expensive than interventions targeting the �harder� early reading and mathematics skills.
11
References Action Team on School Readiness. (1992). Every child ready for school. Washington, DC: National
Governor�s Association. Alexander, K.L, Entwisle, D.R., & Dauber, S.L. (1993). First-grade classroom behavior: Its short- and
long-term consequences for school performance. Child Development, 64, 801-814. Alexander, K.L., Entwisle, D.R., & Horsey, C.S. (1997). From first grade forward: Early foundations
of high school dropout. Sociology of Education, 70, 87-107. Altonji, J., Elder, T., and Taber, C. (forthcoming). Selection on observed and unobserved variables:
Assessing the effectiveness of Catholic schools. Journal of Political Economy. Bowles, S., Gintis, H., & Osborne, M. (2001). The determinants of earnings: A behavioral approach.
Journal of Economic Literature, 34, 1137-1176. Carneiro, P. & Heckman, J. (2003). Human Capital Policy. In J.J. Heckman and A.B. Krueger (Eds.),
Inequality in America: What role for human capital policies? (pp. 77-239). Cambridge, MA: The MIT Press.
Caspi, A. (2000). The child is father of the man: Personality continuities from childhood to adulthood. Journal of Personality and Social Psychology, 78, 158-172
Conduct Problems Prevention Research Group (2002). Evaluation of the first three years of the Fast Track Prevention Trial with children at high risk for adolescent conduct problems. Journal of Abnormal Child Psychology, 30, 19-35
Conduct Problems Prevention Research Group, (1992). A developmental and clinical model for the prevention of conduct disorder: The FAST Track Program. Development and Psychopathology, 4, 509-527.
Costa, P.T., Jr. & McCrae, R.R. (1994). Set like plaster? Evidence for the stability of adult personality. In T.F. Heatherton and J.L. Weinberger (Eds.), Can personality change? (pp. 21-40). Washington, D.C.: APA Press.
Crnic, K., & Lamberty G. (1994, April). Reconsidering school readiness: Conceptual and applied perspectives. Early Education and Development, 5(2), 99-105.
Currie, J. & Thomas, D. (1999). Early test scores, socioeconomic status and future outcomes. National Bureau of Economic Research, Working paper 6943. www.nber.org/papers/w6943.
Dolan, L., Kellam, S., Brown, C., Werthamer-Larsson, L., Rebok, G., Mayer, L., Laudolff, J. and Turkkan, J., Ford, C. & Wheeler, L. (1993). The short-term impacts of two classroom-based preventive interventions on aggressive and shy behaviors and poor achievement. Journal of Applied Developmental Psychology, 14, 317-345.
Farkas, G. (2003). Cognitive skills and noncognitive traits and behaviors in stratification processes. Annual Review of Sociology, 29, 541-562.
Hinshaw, S. (1992). Externalizing Behavior Problems and Academic Underachievement in Childhood and Adolescence� Psychological Bulletin, 11(1):127-155.
Jencks, C., Bartlett S., Corcoran M., Crouse J., Eaglesfield D., Jackson G., McClelland K., Mueser P., Olneck M., Schwartz J., Ward S., & Williams J. (1979). Who Gets Ahead? The Determinants of Economic Success in America. New York: Basic Books.
12
Jencks, C. & Phillips, M. (1999). Aptitude or achievement: Why do test scores predict educational attainment and earnings? In Learning and Earning: How Schools Matter, S.Mayer and P.Peterson, (Eds.) Washington, D.C.: Brookings Institution Press.
Kagan, S. L. (1990). Readiness 2000: Rethinking rhetoric and responsibility. Phi Delta Kappan, 72, 272-279.
Kagan, Sharon L.; Moore, Evelyn; & Bredekamp, Sue (Eds.). (1995). Reconsidering children's early development and learning: Toward common views and vocabulary. Report of the National Education Goals Panel, Goal 1 Technical Planning Group. Washington, DC: Government Printing Office.
Kowaleski-Jones L. & Duncan G.J. (1999). The structure of achievement and behavior across middle childhood. Child Development, 70(4), pp. 930-943.
La Paro, K. & Pianta, R. (2000). Predicting Children�s Competence in the Early School Years: A Meta-Analytic Review. Review of Educational Research, 70(4), 443-484.
Lewit, E.M. & Baker, L. S. (1995). School readiness. The Future of Children, 5(2), 128-139. McCall, R. B., Appelbaum, M. I., & Hogarty, P. S. (1973). Developmental changes in mental
performance. Monographs of the Society for Research in Child Development, 38 (3, Serial No. 150).
Moffit, T.E. (1993). Adolescence-limited and life-course �persistent antisocial behavior: A developmental taxonomy. Psychological Review, 100(4), 674-701.
National Center for Education Statistics. (1993). Public school kindergarten teachers' views on children's readiness for school. Contractor report to the National Center for Education Statistics. NCES 93-410. Washington, DC: U.S. Department of Education, Office of Educational Research and Improvement.
National Research Council (1998). Preventing Reading Difficulties in Young Children, Catherine E. Snow, M. Susan Burns, and Peg Griffin, Editors; Committee on the Prevention of Reading Difficulties in Young Children, National Research Council Washington, D. C.: National Academy Press.
Roberts, B.W. & DelVecchio, W.G. (2000). The rank-order consistency of personality traits from childhood to old age: A quantitative review of longitudinal studies. Psychological Bulletin, 126(1), 3-25.
13
Table 1: Descriptions of child-level variables including test scores and teacher and parent social rating scales
Cognitive (hard skills) test scores
Reading IRT score
A single test (with items varying by children�s response patterns) was administered identically in the fall and spring of kindergarten and in the spring of first grade. Spring of first grade score is a dependent variable while spring and fall of kindergarten are independent variables in these analyses. The reading assessment included five proficiency levels. The five levels reflect a progression of skills and knowledge such that if a child has mastered a higher level, she is very likely to have mastered the items in the earlier levels as well. The five levels were: 1) identifying upper- and lower-case letters of the alphabet by name; (2) associating letters with sounds at the beginning of words; (3) associating letters with sounds at the end of words; (4) recognizing common words by sight; and (5) reading words in context.
Math IRT score A single test (with items varying by children�s response patterns) was administered identically in the fall and spring of kindergarten and in the spring of first grade. Spring of first grade score is a dependent variable while spring and fall of kindergarten are independent variables in these analyses. Although clusters of math items were less homogeneous than those for reading they can be grouped into five proficiency levels. These include: (1) identifying one digit numerals, recognizing geometric shapes and counting up to ten objects; (2) reading all one-digit numerals, counting beyond 10, recognizing a sequence of pattern and using nonstandard units of length to compare objects; (3) reading two-digit numerals, recognizing the next number in a sequence, identifying the ordinal position of an object, and solving a simple word problem; (4) solving simple addition and subtraction problems; (5) solving simple multiplication and division problems and recognizing more complex number patterns.
General knowledge IRT score
A single test (with items varying by children�s response patterns) was administered identically in the fall and spring of kindergarten and in the spring of first grade. Although this test was administered in the spring of first grade, we use only fall and spring of kindergarten scores (as independent variables). The general knowledge test subject matter was too diverse to be divided into proficiency levels. The test assessed knowledge of science and social studies material. The test assessed children�s conception and understanding of the social, physical, and natural world and of their ability to draw inferences and comprehend implications. It also measured children�s skills in establishing relationships between and among objects, events, or people and to make inferences and to comprehend the implications of verbal and pictorial concepts.
14
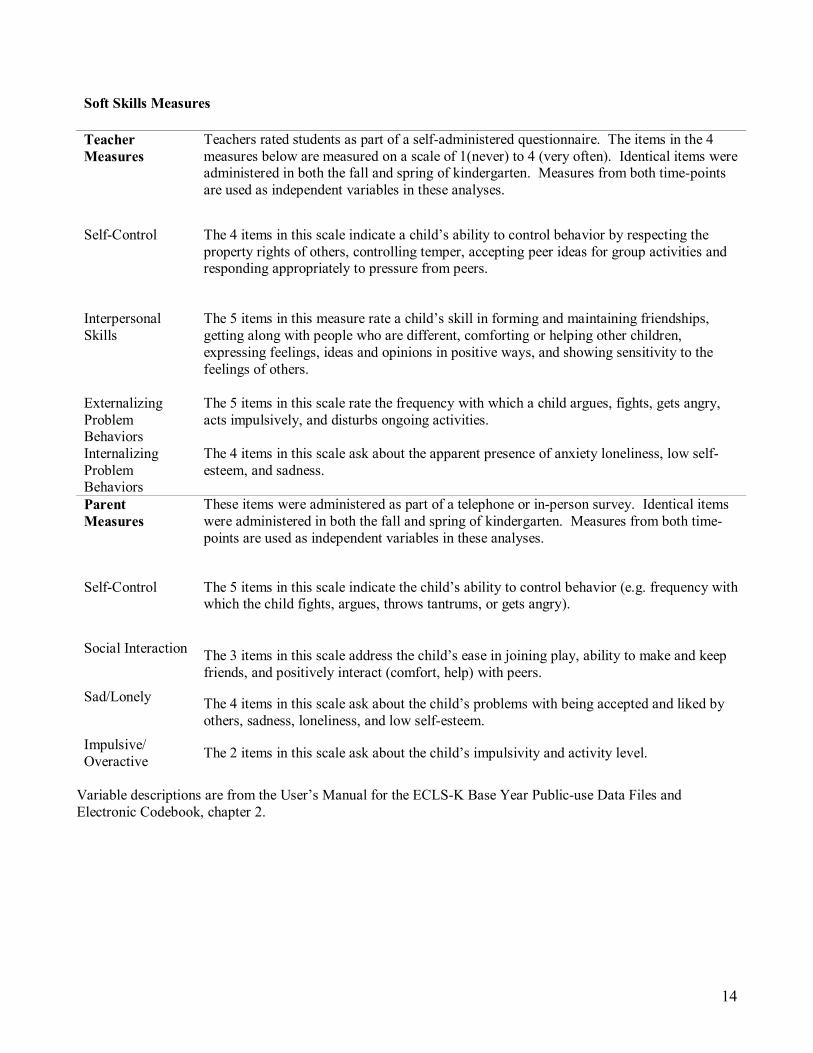
Soft Skills Measures
Teacher Measures
Teachers rated students as part of a self-administered questionnaire. The items in the 4 measures below are measured on a scale of 1(never) to 4 (very often). Identical items were administered in both the fall and spring of kindergarten. Measures from both time-points are used as independent variables in these analyses.
Self-Control The 4 items in this scale indicate a child�s ability to control behavior by respecting the property rights of others, controlling temper, accepting peer ideas for group activities and responding appropriately to pressure from peers.
Interpersonal Skills
The 5 items in this measure rate a child�s skill in forming and maintaining friendships, getting along with people who are different, comforting or helping other children, expressing feelings, ideas and opinions in positive ways, and showing sensitivity to the feelings of others.
Externalizing Problem Behaviors
The 5 items in this scale rate the frequency with which a child argues, fights, gets angry, acts impulsively, and disturbs ongoing activities.
Internalizing Problem Behaviors
The 4 items in this scale ask about the apparent presence of anxiety loneliness, low self-esteem, and sadness.
Parent Measures
These items were administered as part of a telephone or in-person survey. Identical items were administered in both the fall and spring of kindergarten. Measures from both time-points are used as independent variables in these analyses.
Self-Control The 5 items in this scale indicate the child�s ability to control behavior (e.g. frequency with which the child fights, argues, throws tantrums, or gets angry).
Social Interaction The 3 items in this scale address the child�s ease in joining play, ability to make and keep friends, and positively interact (comfort, help) with peers.
Sad/Lonely The 4 items in this scale ask about the child�s problems with being accepted and liked by others, sadness, loneliness, and low self-esteem.
Impulsive/ Overactive The 2 items in this scale ask about the child�s impulsivity and activity level.
Variable descriptions are from the User�s Manual for the ECLS-K Base Year Public-use Data Files and Electronic Codebook, chapter 2.
15
Variable n* Mean Std. Dev. Min Max Reliability+ SpringK-FallK r++
Test Score
Reading IRT Score 13002 22.755 8.559 10.078 69.655 .93 .81
Math IRT Score 13002 20.253 7.338 6.903 59.815 .92 .81
General Knowledge IRT Score 13002 22.804 7.405 7.3 46.164 .88 .86
Parent Report
Self-Control 12968 2.845 .502 1 4 .74 .60
Social Interaction 12967 3.351 .542 1 4 .70 .50
Sad/Lonely 12960 1.541 .392 1 4 .60 .46
Impuls ive/Overactive 12894 1.945 .671 1 4 .46 .57
Teacher Report
Self-Control 12564 3.109 .606 1 4 .79 .63
Interpersonal Skills 12451 3.006 .623 1 4 .89 .62
Externalizing Problem Behaviors 12832 1.605 .623 1 4 .90 .73
Internalizing Problem Behaviors 12716 1.520 .515 1 4 .80 .56
Test Score
Reading IRT Score 12894 32.846 10.298 11.073 70.8 .95
Math IRT Score 12894 28.572 8.707 7.541 59.339 .94
General Knowledge IRT Score 12880 27.961 7.591 7.653 48.438 .89
Parent Report
Self-Control 12451 2.890 .487 1 4 .75
Social Interaction 12457 3.451 .505 1 4 .68
Sad/Lonely 12443 1.550 .387 1 4 .61
Impuls ive/Overactive 12367 1.922 .671 1 4 .47
Teacher Report
Self-Control 12510 3.200 .621 1 4 .80
Interpersonal Skills 12450 3.147 .633 1 4 .89
Externalizing Problem Behaviors 12518 1.652 .635 1 4 .90
Internalizing Problem Behaviors 12486 1.553 .511 1 4 .78
Test Score
Reading IRT Score 13002 56.641 13.547 13.039 88.994 .97
Math IRT Score 13002 44.060 8.900 8.461 60.537 .94
+These reliabilities are reported in the ECLS-K user's manual++Fall Kindergarten-Spring Kindergarten Correlation
Table 2: Descriptive s tatis tics for child outcomes
*Sample s izes are based on the sample used for regress ion which predicts spring of 1st grade math scores using fall kindergarten test scores , teacher and parent report measures (Table 4). Sample s izes are not identical due to miss ing data.
FALL OF KINDERGARTEN
SPRING OF KINDERGARTEN
SPRING OF 1ST GRADE
16
Tab
le 3
: C
orre
lati
on m
atri
x fo
r sp
ring
1st
gra
de te
st s
core
s an
d fa
ll k
inde
rgar
ten
test
sco
res,
teac
her
and
pare
nt r
epor
t mea
sure
s
Rea
ding
IR
TM
ath
IR
TR
eadi
ng
IRT
Mat
h IR
T
Gen
eral
K
now
ledg
e IR
TSe
lf-C
ontr
olSo
cial
In
tera
ctio
nSa
d/
Lone
lyIm
puls
ive/
O
vera
ctiv
eSe
lf-C
ontr
olIn
terp
erso
nal
Skill
s
Exte
rnal
izin
g Pr
oble
m
Beh
avio
rs
Inte
rnal
izin
g Pr
oble
m
Beh
avio
rsS
prin
g 1s
t Gra
de
Rea
ding
IRT
1.00
M
ath
IRT
.6
91.
00Fa
ll K
inde
rgar
ten
R
eadi
ng IR
T.6
6.5
31.
00
Mat
h IR
T.6
4.6
9.7
41.
00
Gen
eral
Kno
wle
dge
IRT
.47
.57
.53
.62
1.00
Par
ent R
epor
t
Self-
Con
trol
.16
.15
.14
.14
.12
1.00
So
cial
Inte
ract
ion
.09
.08
.07
.08
.11
.16
1.00
Sa
d/Lo
nely
-.04
-.07
-.03
-.05
-.04
-.31
-.21
1.00
Im
puls
ive/
Ove
ract
ive
-.18
-.18
-.16
-.17
-.17
-.43
-.04
.28
1.00
Tea
cher
Rep
ort
Se
lf-C
ontr
ol.2
1.2
1.1
8.1
9.2
0.1
7.0
6-.0
7-.2
21.
00
Inte
rper
sona
l Ski
lls.2
4.2
4.2
2.2
4.2
4.1
6.1
3-.0
8-.1
9.7
81.
00
Exte
rn. P
rob.
Beh
avio
rs-.1
8-.1
7-.1
4-.1
5-.1
4-.1
7-.0
3.0
7.2
5-.7
0-.5
61.
00
Inte
rn. P
rob.
Beh
avio
rs-.1
6-.1
7-.1
3-.1
7-.1
4-.0
7-.1
2.1
1.0
7-.2
7-.3
4.2
61.
00A
ll co
rrel
atio
ns in
tabl
e ar
e st
atis
tical
ly s
igni
fican
t at t
he 1
% le
vel
n=11
892
Fal
l Kin
derg
arte
nSp
ring
of 1
st G
rade
Fal
l Kin
derg
arte
n P
aren
t Rep
ort
Fal
l Kin
derg
arte
n Te
ache
r R
epor
t
17
Independent Variables (1) (2) (3) (4)FALL K SPRING K
Test Score Reading IRT .367** .346** .371** .492**
(.009) (.009) (.012) (.010)
M ath IRT .273** .274** .299** .131**(.010) (.010) (.014) (.010)
General Knowledge IRT .057** .064** .051** .026*(.008) (.009) (.012) (.012)
Teacher Report Self-Control .024 .022 .109 .021
(.013) (.013) (.074) (.012)
Internalizing Problem Behaviors .025** .022** .035** .006 (reverse scale) (.007) (.008) (.010) (.008)
Interpersonal Skills .014 .005 -.061 .008(.011) (.011) (.049) (.011)
Externalizing Problem Behaviors .033** .020 -.024 .007 (reverse scale) (.010) (.010) (.031) (.010)Parent Report Self-Control .026** .021** .001 .015*
(.007) (.007) (.024) (.008)
Social Interaction .022** .017* .045** .002(.007) (.007) (.013) (.007)
Sad/Lonely -.012 -.016* -.059** .005 (reverse scale) (.007) (.007) (.019) (.007)
Impuls ive/Overactive .036** .018* .096* -.003 (reverse scale) (.008) (.008) (.045) (.007)
Control Variables + X X XReliability Adjus tment++ X
Fall Kindergarten Measures X
Cons tant .063** 33.754* -12.080** 28.081*(.009) (16.641) (1.539) (14.297)
Observations 13004 12415 12415 12322
R-squared .50 .53 .55 .63* significant at 5%; ** significant at 1%Standard errors in models (1), (2), (4) are corrected for clas sroom clus tering using Huber-W hite methoAll variables are s tandardized by full sample s tandard deviationAll models include mis sing data dummies for parent and teacher report measures +Control variables are lis ted in Appendix Table 1++Reliability adjus tment made using errors -in-variables regres sion and reliabilities reported in Table 2
Table 4: Coefficients and standard errors from various regression models of spring 1s t grade reading tes t s cores us ing independent variables measured in fall and spring k indergarten
Dependent Variable: Spring of 1s t grade reading IRT
Independent variables measured in:
18
Independent Variables (1) (2) (3) (4)FALL K SPRING K
Test S core Reading IRT .021* .032** -.051** .101**
(.008) (.008) (.012) (.010)
M ath IRT .477** .454** .569** .446**(.009) (.010) (.013) (.010)
General Knowledge IRT .203** .187** .213** .124**(.008) (.009) (.012) (.012)
Teacher Report Self-Control .026* .022 .136 -.0002
(.012) (.012) (.070) (.011)
Internalizing Problem Behaviors .038** .034** .042** .003 (reverse scale) (.007) (.007) (.009) (.007)
Interpersonal Skills .005 .004 -.082 .035**(.011) (.011) (.047) (.010)
Externalizing Problem Behaviors .017 .019 -.026 .008 (reverse scale) (.010) (.010) (.030) (.010)Parent Report Self-Control .026** .028** .038 .002
(.007) (.007) (.023) (.008)
Social Interaction .005 .009 .015 .009(.007) (.007) (.013) (.006)
Sad/Lonely .019** .007 .003 .006 (reverse scale) (.007) (.007) (.018) (.007)
Impulsive/Overactive .019** .009 .009 .003 (reverse scale) (.007) (.007) (.043) (.007)
Control Variables+ X X XReliability Adjus tment++ X
Fall Kindergarten Measures X
Cons tant .055** 5.657 -12.897** -5.629(.008) (16.279) (1.462) (14.060)
Observations 13002 12413 12413 12320
R-squared .51 .54 .57 .64* significant at 5%; ** s ignificant at 1%Standard errors in models (1), (2), (4) are corrected for clas s room clus tering using Huber-W hite methAll variables are standardized by full s ample s tandard deviationAll models include miss ing data dummies for parent and teacher report measures +Control variables are lis ted in Appendix Table 1++Reliability adjustment made us ing errors-in-variables regres s ion and reliabilities reported in Table 2
Table 5: Coefficients and s tandard errors from various regress ion models of spring 1s t grade math tes t scores using independent variables measured in fall and spring k indergarten
Dependent Variable: S pring of 1st grade math IRT
Independent variables measured in:
19
Dependent Variable: Spring 1st Grade Reading IRTIndependent Variables (1) (2) (3) (4)
Independent variables measured in: FALL K SPRING K FALL K SPRING K Reading IRT Score .346** .491**
(.009) (.009)
M ath IRT Score .454** .446**(.009) (.009)
Other Hard Skills .317** .148** .206** .199**(.010) (.011) (.009) (.009)
Soft Skills Teacher Report .052** .031** .059** .037**(.008) (.008) (.007) (.006)
Soft Skills Parent Report .037** .013* .039** .014*(.007) (.006) (.007) (.006)
Fall of Kindergarten Compos ites X X
Observations 12415 12322 12413 12320
R-squared .53 .63 .54 .64* significant at 5%; ** s ignificant at 1%
All models include control variables lis ted in Appendix Table 1All s tandard errors are corrected for clas sroom clus tering using Huber-W hite methods . A ll variables are standardized All models include miss ing data dummies for parent and teacher report measures
Models (1) and (2) hard skills compos ite includes math and general knowledge, models (3) and (4) hard skills compos ite includes reading and general knowledge
Table 6: Coefficients and s tandard errors for compos ite measures constructed from Tables 4 and 5 for spring and fall of k indergarten for 'hard skills ' and parent and teacher reports of 'soft skills '
Compos ite measures for model (1) were constructed using coefficients from Table 4 model (2), compos ite measures in model (2) were contructed us ing coefficients from Table 4 model (4)Compos ite measures in model 3 were cons tructed us ing coefficients from Table 5 model (2), compos ite measures for model (4) were cons tructed us ing coefficients from Table 5 model (4)
Spring 1s t Grade Math IRT
20
Dependent Variable:Black Latino As ian W hite Black Latino Asian White
Independent Variables (1) (2) (3) (4) (5) (6) (7) (8)
Test Score Reading IRT .385** .360** .209** .353** .061* .001 -.020 .041**
(.035) (.031) (.033) (.010) (.027) (.029) (.033) (.010)
M ath IRT .426** .290** .293** .251** .586** .476** .431** .435**(.039) (.035) (.039) (.012) (.035) (.032) (.037) (.011)
General Knowledge IRT .048 .075** .039 .064** .222** .171** .108* .183**(.028) (.026) (.046) (.011) (.028) (.026) (.047) (.011)
Teacher Report Self-Control .025 -.038 .049 .018 .016 .040 .015 .014
(.032) (.034) (.052) (.016) (.030) (.036) (.053) (.015)
Internalizing Problem Behaviors .029 .025 -.007 .020* .051** .040* -.029 .033** (reverse scale) (.019) (.020) (.037) (.010) (.019) (.020) (.038) (.009)
Interpersonal Skills .016 .032 -.066 .008 .015 .020 -.018 -.003(.028) (.032) (.050) (.014) (.027) (.032) (.048) (.014)
Externalizing Problem Behaviors .010 .070** .026 .009 .005 .004 .029 .024 (reverse scale) (.025) (.025) (.053) (.013) (.026) (.026) (.057) (.012)Parent Report Self-Control .018 .052* -.010 .012 .030 .053** -.084* .023*
(.017) (.021) (.043) (.010) (.017) (.020) (.040) (.009)
Social Interaction .014 .038 .045 .018* .032 -.007 .010 .006(.018) (.020) (.034) (.009) (.018) (.019) (.032) (.009)
Sad/Lonely .002 -.038* -.020 -.017 .023 -.003 .019 .003 (reverse scale) (.014) (.019) (.036) (.009) (.015) (.021) (.034) (.009)
Impuls ive/Overactive .042* -.001 -.015 .016 .011 .003 .053 .009 (reverse scale) (.019) (.021) (.045) (.010) (.019) (.021) (.040) (.009)
Cons tant -10.636 65.831 114.845 39.758 -15.151 40.375 -2.498 10.446(28.896) (42.885) (84.127) (23.457) (27.472) (44.676) (75.836) (20.672)
Observations 1748 1516 529 7902 1747 1516 529 7901R-squared .53 .50 .60 .50 .53 .47 .60 .51* significant at 5%; ** s ignificant at 1%All models include control variables lis ted in Appendix Table 1All s tandard errors are corrected for clas s room clustering us ing Huber-W hite methodsAll variables are s tandardized
Spring 1st Grade Reading IRT Spring 1st Grade Math IRT
Table 7: Coefficients and s tandard errors from various regress ion models for subgroups of spring 1st grade tes t s cores us ing independent variables measured in fall k indergarten
21
Dependent Variable:Female Male High SES Low SES Female M ale High SES Low SES
Independent Variables (1) (2) (3) (4) (5) (6) (7) (8)
Test Score Reading IRT .351** .345** .334** .407** .042** .029** .056** .066*
(.013) (.012) (.012) (.033) (.012) (.011) (.011) (.031)
M ath IRT .274** .272** .210** .416** .441** .460** .342** .578**(.013) (.014) (.014) (.033) (.014) (.013) (.013) (.032)
General Knowledge IRT .070** .057** .040* .073** .184** .190** .150** .247**(.013) (.012) (.016) (.024) (.013) (.012) (.014) (.025)
Teacher Report Self-Control .036* .008 .003 .028 .043** .003 .029 -.008
(.017) (.017) (.023) (.028) (.016) (.017) (.021) (.029)
Internalizing Problem Behaviors .019 .025* .022 .019 .038** .029** .021 .040* (reverse scale) (.010) (.011) (.014) (.016) (.009) (.010) (.013) (.016)
Interpersonal Skills .013 -.002 .001 .003 .014 -.008 -.009 .015(.014) (.016) (.020) (.027) (.015) (.015) (.018) (.027)
Externalizing Problem Behaviors .009 .031* .040* .036 -.008 .044** .024 .032 (reverse scale) (.014) (.013) (.019) (.021) (.014) (.013) (.018) (.022)Parent Report Self-Control .012 .029** -.002 .021 .028** .028** -.013 .041*
(.010) (.010) (.014) (.016) (.010) (.011) (.014) (.016)
Social Interaction .015 .019* .006 .031* .016 .004 .003 .047**(.010) (.010) (.013) (.016) (.009) (.010) (.012) (.017)
Sad/Lonely -.012 -.018 -.009 -.009 .005 .010 .017 .009 (reverse scale) (.009) (.010) (.013) (.014) (.009) (.010) (.013) (.014)
Impuls ive/Overactive .014 .023* .028 .016 .009 .010 .031* .030 (reverse scale) (.011) (.011) (.015) (.016) (.010) (.010) (.014) (.017)
Cons tant 14.894 44.476 -.960 36.553 12.399 -10.450 -18.718 42.569(23.861) (22.782) (27.023) (38.307) (25.841) (21.329) (31.060) (39.423)
Observations 6118 6297 3518 2296 6118 6295 3518 2294R-squared .53 .52 .50 .48 .54 .55 .49 .50* significant at 5%; ** s ignificant at 1%All models include control variables lis ted in Appendix Table 1All s tandard errors are corrected for clas sroom clus tering using Huber-White methodsAll variables are s tandardized
Spring 1st Grade Reading IRT Spring 1st Grade Math IRT
Table 8: Coefficients and s tandard errors from various regress ion models for subgroups of spring 1s t grade tes t s cores us ing independent variables measured in fall k indergarten
22
Dependent Variable:Black Latino As ian White Black Latino As ian W hite
Independent Variables (1) (2) (3) (4) (5) (6) (7) (8)
Reading IRT Score .385** .360** .209** .353**(.035) (.030) (.033) (.010)
M ath IRT Score .585** .476** .430** .435**(.032) (.027) (.028) (.010)
Other Hard Skills .455** .341** .317** .295** .260** .172** .098* .208**(.037) (.033) (.038) (.012) (.030) (.027) (.041) (.011)
Soft Skills Teacher Report .060** .075** .048 .042** .067** .079** .038 .051**(.018) (.020) (.030) (.009) (.018) (.021) (.035) (.009)
Soft Skills Parent Report .056** .067** .051 .030** .064** .053** .077* .031**(.016) (.019) (.031) (.009) (.017) (.018) (.035) (.009)
Observations 1748 1516 529 7902 1747 1516 529 7901R-squared .53 .50 .60 .50 .53 .47 .60 .51
Dependent Variable:Female Male High SES Low SES Female M ale High SES Low SES
Independent Variables (1) (2) (3) (4) (5) (6) (7) (8)
Reading IRT Score .351** .345** .334** .407**(.013) (.012) (.012) (.033)
M ath IRT Score .441** .460** .342** .578**(.012) (.011) (.012) (.029)
Other Hard Skills .322** .310** .236** .463** .210** .207** .186** .287**(.015) (.014) (.015) (.032) (.013) (.013) (.015) (.028)
Soft Skills Teacher Report .060** .048** .051** .067** .068** .055** .051** .060**(.010) (.010) (.014) (.018) (.009) (.009) (.012) (.016)
Soft Skills Parent Report .026** .046** .027* .045** .041** .039** .035** .085**(.010) (.010) (.013) (.015) (.010) (.009) (.012) (.017)
Observations 6118 6297 3518 2296 6118 6295 3518 2294R-squared .53 .52 .50 .48 .54 .55 .49 .50* significant at 5%; ** significant at 1%
All models include control variables lis ted in Appendix Table 1All s tandard errors are corrected for clas s room clus tering us ing Huber-White methods . A ll variables are s tandardized
Composite measures for Table 9a were cons tructed us ing coefficients from Table 7. Composite measures for Table 9b were constructed using coefficients from Table 8.
Table 9a: Coefficients and s tandard errors for compos ite measures cons tructed from Table 7 for fall of kindergarten for 'hard skills ' net of math or reading IRT score and parent and teacher reports of 'soft skills '
S pring 1s t Grade Reading IRT Spring 1s t Grade Math IRT
Table 9b: Coefficients and s tandard errors for compos ite measures cons tructed from Table 8 for fall of kindergarten for 'hard skills ' net of math or reading IRT score and parent and teacher reports of 'soft skills '
S pring 1s t Grade Reading IRT Spring 1s t Grade Math IRT
23
Inde
pend
ent V
aria
bles
Bot
tom
1/3
Top
2/3
p-
valu
e1B
otto
m 1
/3
Top
2/3
p-
valu
e1B
otto
m 1
/3
Top
2/3
p-
valu
e1B
otto
m 1
/3
Top
2/3
p-
valu
e1
Tes
t Sco
re
Rea
ding
IRT
.577
**.3
25**
.000
.525
**.3
73**
.141
.503
**.3
29**
.081
.517
**.3
55**
.065
(.038
)(.0
09)
(.089
)(.0
38)
(.089
)(.0
32)
(.072
)(.0
37)
M
ath
IRT
.760
**.1
86**
.000
.846
**.1
92**
.000
.744
**.1
35**
.000
.842
**.1
84**
.000
(.035
)(.0
10)
(.078
)(.0
44)
(.087
)(.0
40)
(.060
)(.0
39)
G
ener
al K
now
ledg
e IR
T.1
36**
.027
*.0
00.0
79.0
45.6
70.1
26*
.048
.309
.124
**.0
20.1
09(.0
25)
(.011
)(.0
54)
(.041
)(.0
59)
(.035
)(.0
44)
(.037
)T
each
er R
epor
t
Self-
Con
trol
.009
.025
.622
.047
.041
.932
-.075
-.019
.544
.036
.038
.974
(.025
)(.0
15)
(.053
)(.0
43)
(.073
)(.0
43)
(.052
)(.0
38)
In
tern
aliz
ing
Prob
lem
Beh
avio
rs.0
24.0
10.5
27.0
66.0
01.2
85.0
57-.0
13.2
01.0
47-.0
04.2
85
(rev
erse
sca
le)
(.017
)(.0
11)
(.045
)(.0
27)
(.039
)(.0
27)
(.035
)(.0
24)
In
terp
erso
nal S
kills
.002
-.008
.736
.027
-.032
.443
.055
-.007
.459
-.001
-.019
.806
(.023
)(.0
15)
(.053
)(.0
42)
(.062
)(.0
44)
(.051
)(.0
38)
Ex
tern
aliz
ing
Prob
lem
Beh
avio
rs
.003
.031
*.2
50-.0
08.0
10.7
74.1
00*
.052
.469
.011
.054
.417
(r
ever
se s
cale
)(.0
18)
(.014
)(.0
40)
(.039
)(.0
47)
(.036
)(.0
35)
(.032
)P
aren
t Rep
ort
Se
lf-C
ontr
ol.0
12.0
20.6
78.0
02.0
28.5
65.0
68*
.031
.489
.011
.031
.635
(.013
)(.0
12)
(.029
)(.0
27)
(.034
)(.0
34)
(.023
)(.0
31)
So
cial
Inte
ract
ion
-.002
.024
*.2
48.0
18.0
11.9
11.0
45.0
27.7
78.0
42.0
17.5
70(.0
17)
(.009
)(.0
45)
(.026
)(.0
47)
(.028
)(.0
32)
(.023
)
Sa
d/Lo
nely
.014
-.023
**.1
15-.0
53.0
35.0
59.0
40-0
.06*
.095
.010
-.019
.552
(r
ever
se s
cale
)(.0
19)
(.008
)(.0
35)
(.021
)(.0
46)
(.025
)(.0
35)
(.021
)
Im
puls
ive/
Ove
ract
ive
.037
*.0
09.2
36.0
90*
.010
.149
.064
-.038
.151
.023
.006
.749
(r
ever
se s
cale
)(.0
19)
(.010
)(.0
39)
(.027
)(.0
55)
(.030
)(.0
36)
(.024
)O
bser
vatio
ns12
415
1748
1516
2296
R-s
quar
ed.5
5.5
6.5
3.5
1*
sign
ifica
nt a
t 5%
; **
sign
ifica
nt a
t 1%
All
mod
els
incl
ude
cont
rol v
aria
bles
list
ed in
App
endi
x T
able
1A
ll st
anda
rd e
rror
s ar
e co
rrec
ted
for c
lass
room
clu
ster
ing
usin
g H
uber
-Whi
te m
etho
ds
All
varia
bles
are
sta
ndar
dize
d1 P-
valu
e is
for t
he n
ull h
ypot
hesi
s th
at th
e co
effic
ient
for t
he to
p 2/
3 eq
uals
the
coef
ficie
nt fo
r the
bot
tom
1/3
.
Tab
le 1
0: C
oeff
icie
nts
and
stan
dard
err
ors
for
full
sam
ple
and
subg
roup
spl
ines
of s
prin
g 1s
t gra
de r
eadi
ng te
st s
core
s
Full
Sam
ple
Bla
ck
Latin
oLo
w S
ES
Dep
ende
nt V
aria
ble:
Spr
ing
of 1
st g
rade
rea
ding
IRT
(1)
(2)
(3)
(4)
24
Inde
pend
ent V
aria
bles
Bot
tom
1/3
T
op 2
/3
p-va
lue1
Bot
tom
1/3
T
op 2
/3
p-va
lue1
Bot
tom
1/3
T
op 2
/3
p-va
lue1
Bot
tom
1/3
T
op 2
/3
p-va
lue1
Tes
t Sco
re.1
40**
.029
**.0
04.0
99.0
75*
.800
.086
-.012
.337
.176
**.0
09.0
54
Rea
ding
IRT
(.036
)(.0
08)
(.083
)(.0
31)
(.091
)(.0
30)
(.070
)(.0
37)
M
ath
IRT
.940
**.3
72**
.000
1.03
**.3
55**
.000
.818
**.3
56**
.000
.945
**.3
76**
.000
(.035
)(.0
09)
(.074
)(.0
39)
(.091
)(.0
35)
(.061
)(.0
36)
G
ener
al K
now
ledg
e IR
T.4
27**
.102
**.0
00.3
76**
.110
**.0
00.3
39**
.093
**.0
02.3
65**
.140
**.0
01(.0
25)
(.010
)(.0
51)
(.039
)(.0
64)
(.034
)(.0
47)
(.036
)T
each
er R
epor
t
Self-
Con
trol
.021
.021
.990
-.020
.071
.227
.113
.018
.318
-.046
.028
.313
(.024
)(.0
15)
(.056
)(.0
39)
(.079
)(.0
43)
(.054
)(.0
38)
In
tern
aliz
ing
Prob
lem
Beh
avio
rs.0
40*
.020
*.3
37.0
29.0
51*
.688
.032
.029
.952
.014
.047
.491
(r
ever
se s
cale
)(.0
16)
(.010
)(.0
41)
(.026
)(.0
42)
(.028
)(.0
33)
(.025
)
In
terp
erso
nal S
kills
.004
-.011
.593
.070
-.065
.080
.059
-.025
.338
.065
-.040
.151
(.023
)(.0
13)
(.056
)(.0
37)
(.069
)(.0
41)
(.053
)(.0
37)
Ex
tern
aliz
ing
Prob
lem
Beh
avio
rs
.010
.021
.645
.005
-.014
.752
-.047
.013
.415
.020
.034
.805
(r
ever
se s
cale
)(.0
18)
(.013
)(.0
38)
(.039
)(.0
55)
(.037
)(.0
38)
(.034
)P
aren
t Rep
ort
Se
lf-C
ontr
ol.0
13.0
33**
.327
.005
.050
.353
.066
*.0
31.5
15.0
14.0
76*
.189
(.012
)(.0
12)
(.030
)(.0
28)
(.033
)(.0
34)
(.024
)(.0
33)
So
cial
Inte
ract
ion
.007
.004
.874
.116
*-.0
15.0
31-.0
25-.0
08.7
83.0
90**
.016
.114
(.016
)(.0
09)
(.046
)(.0
25)
(.045
)(.0
29)
(.034
)(.0
24)
Sa
d/Lo
nely
.035
-.001
.119
.000
.033
.487
-.005
.002
.910
.067
-.023
.070
(r
ever
se s
cale
)(.0
20)
(.008
)(.0
36)
(.020
)(.0
55)
(.026
)(.0
38)
(.02)
Im
puls
ive/
Ove
ract
ive
.014
.005
.692
.014
.004
.855
.026
-.016
.560
.050
.014
.488
(r
ever
se s
cale
)(.0
18)
(.009
)(.0
39)
(.026
)(.0
57)
(.028
)(.0
37)
(.025
)O
bser
vatio
ns12
415
1747
1516
2294
R-s
quar
ed.5
7.5
6.5
0.5
3*
sign
ifica
nt a
t 5%
; **
sign
ifica
nt a
t 1%
All
mod
els
incl
ude
cont
rol v
aria
bles
list
ed in
App
endi
x T
able
1A
ll st
anda
rd e
rror
s ar
e co
rrec
ted
for c
lass
room
clu
ster
ing
usin
g H
uber
-Whi
te m
etho
ds
All
varia
bles
are
sta
ndar
dize
d1 P-
valu
e is
for t
he n
ull h
ypot
hesi
s th
at th
e co
effic
ient
for t
he to
p 2/
3 eq
uals
the
coef
ficie
nt fo
r the
bot
tom
1/3
.
(1)
(2)
(3)
(4)
Tab
le 1
1: C
oeff
icie
nts
and
stan
dard
err
ors
for
full
sam
ple
and
subg
roup
spl
ines
of s
prin
g 1s
t gra
de m
ath
test
sco
res
Full
Sam
ple
Bla
ck
Latin
oLo
w S
ES
Dep
ende
nt V
aria
ble:
Spr
ing
of 1
st g
rade
mat
h IR
T
25
Inde
pend
ent V
aria
bles
Bot
tom
1/3
T
op 2
/3
p-va
lue1
Bot
tom
1/3
T
op 2
/3
p-va
lue1
Bot
tom
1/3
T
op 2
/3
p-va
lue1
Bot
tom
1/3
T
op 2
/3
p-va
lue1
Rea
ding
IRT
Sco
re.5
83**
.326
**.0
00.5
11**
.375
**.1
83.5
23**
.331
**.0
54.5
26**
.354
**.0
49(.0
38)
(.009
)(.0
89)
(.038
)(.0
88)
(.032
)(.0
71)
(.037
)
Oth
er H
ard
Skill
s.8
09**
.214
**.0
00.8
64**
.220
**.0
00.7
54**
.171
**.0
00.8
61**
.211
**.0
00(.0
34)
(.010
)(.0
75)
(.042
)(.0
81)
(.039
)(.0
58)
(.039
)
Soft
Ski
lls T
each
er R
epor
t.0
32*
.039
**.7
53.0
90*
.009
.177
.106
**-.0
01.0
76.0
59.0
64.9
14(.0
14)
(.013
)(.0
36)
(.034
)(.0
35)
(.037
)(.0
29)
(.034
)
Soft
Ski
lls P
aren
t Rep
ort
.041
**.0
23*
.376
.073
**.0
29.3
93.1
00**
.035
.257
.053
*.0
19.4
41(.0
14)
(.011
)(.0
28)
(.033
)(.0
37)
(.032
)(.0
25)
(.029
)
Obs
erva
tions
1241
517
4815
1622
96R
-squ
ared
.55
.56
.53
.51
Inde
pend
ent V
aria
bles
Bot
tom
1/3
T
op 2
/3
p-va
lue1
Bot
tom
1/3
T
op 2
/3
p-va
lue1
Bot
tom
1/3
T
op 2
/3
p-va
lue1
Bot
tom
1/3
T
op 2
/3
p-va
lue1
Mat
h IR
T S
core
.966
**.3
81**
.000
1.01
8**
.377
**.0
00.8
59**
.355
**.0
00.9
69**
.376
**.0
00(.0
32)
(.008
)(.0
68)
(.035
)(.0
75)
(.030
)(.0
56)
(.033
)
Oth
er H
ard
Skill
s.4
72**
.119
**.0
00.4
37**
.149
**.0
00.3
37**
.089
**.0
02.4
28**
.156
**.0
00(.0
27)
(.010
)(.0
58)
(.040
)(.0
63)
(.033
)(.0
50)
(.039
)
Soft
Ski
lls T
each
er R
epor
t.0
57**
.032
**.2
24.0
66*
.042
.662
.121
**.0
10.0
86.0
58*
.045
.801
(.013
)(.0
12)
(.033
)(.0
33)
(.044
)(.0
33)
(.028
)(.0
32)
Soft
Ski
lls P
aren
t Rep
ort
.025
.036
**.5
86.0
58.0
60*
.967
.062
.035
.607
.089
**.0
61.5
93(.0
13)
(.010
)(.0
33)
(.029
)(.0
34)
(.030
)(.0
28)
(.032
)
Obs
erva
tions
1241
317
4715
1622
94R
-Squ
ared
.57
.56
.50
.52
* si
gnifi
cant
at 5
%; *
* si
gnifi
cant
at 1
%A
ll m
odel
s in
clud
e co
ntro
l var
iabl
es li
sted
in A
ppen
dix
Tab
le 1
All
stan
dard
err
ors
are
corr
ecte
d fo
r cla
ssro
om c
lust
erin
g us
ing
Hub
er-W
hite
met
hods
.A
ll va
riabl
es a
re s
tand
ardi
zed
1 P-va
lue
is fo
r the
nul
l hyp
othe
sis
that
the
coef
ficie
nt fo
r the
top
2/3
equa
ls th
e co
effic
ient
for t
he b
otto
m 1
/3.
Tab
le 1
2: C
oeff
icie
nts
and
stan
dard
err
ors
for
com
posi
te m
easu
res
cons
truc
ted
from
Tab
les
10 a
nd 1
1 fo
r fa
ll o
f kin
derg
arte
n fo
r 'h
ard
skil
ls' n
et o
f mat
h or
rea
ding
IR
T s
core
s an
d pa
rent
and
teac
her
repo
rts
of 's
oft s
kil
ls'
Full
Sam
ple
Bla
ck
Latin
oLo
w S
ES
Dep
ende
nt V
aria
ble:
Spr
ing
of 1
st g
rade
rea
ding
IRT
Dep
ende
nt V
aria
ble:
Spr
ing
of 1
st g
rade
mat
h IR
T
(1)
(2)
(3)
(4)
Full
Sam
ple
Bla
ck
Latin
oLo
w S
ES
(1)
(2)
(3)
(4)
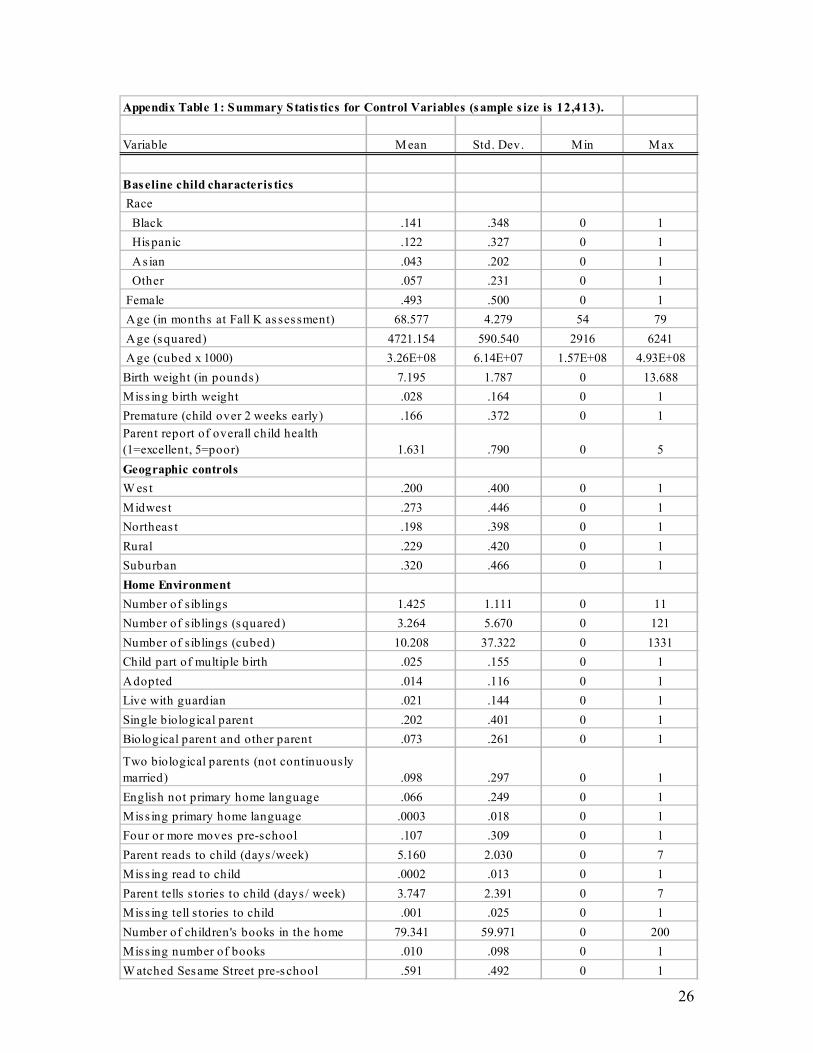
26
Appendix Table 1: Summary Statis tics for Control Variables (sample s ize is 12,413).
Variable M ean Std. Dev. Min M ax
Baseline child characteris tics Race Black .141 .348 0 1 Hispanic .122 .327 0 1 As ian .043 .202 0 1 Other .057 .231 0 1 Female .493 .500 0 1 Age (in months at Fall K as ses sment) 68.577 4.279 54 79 Age (squared) 4721.154 590.540 2916 6241 Age (cubed x 1000) 3.26E+08 6.14E+07 1.57E+08 4.93E+08Birth weight (in pounds) 7.195 1.787 0 13.688Miss ing birth weight .028 .164 0 1Premature (child over 2 weeks early) .166 .372 0 1Parent report of overall child health (1=excellent, 5=poor) 1.631 .790 0 5Geographic controlsW est .200 .400 0 1Midwes t .273 .446 0 1Northeas t .198 .398 0 1Rural .229 .420 0 1Suburban .320 .466 0 1Home EnvironmentNumber of siblings 1.425 1.111 0 11Number of siblings (squared) 3.264 5.670 0 121Number of siblings (cubed) 10.208 37.322 0 1331Child part of multiple birth .025 .155 0 1Adopted .014 .116 0 1Live with guardian .021 .144 0 1Single biological parent .202 .401 0 1Biological parent and other parent .073 .261 0 1
Two biological parents (not continuously married) .098 .297 0 1English not primary home language .066 .249 0 1Miss ing primary home language .0003 .018 0 1Four or more moves pre-school .107 .309 0 1Parent reads to child (days /week) 5.160 2.030 0 7Miss ing read to child .0002 .013 0 1Parent tells s tories to child (days / week) 3.747 2.391 0 7Miss ing tell s tories to child .001 .025 0 1Number of children's books in the home 79.341 59.971 0 200Miss ing number of books .010 .098 0 1W atched Sesame Street pre-school .591 .492 0 1
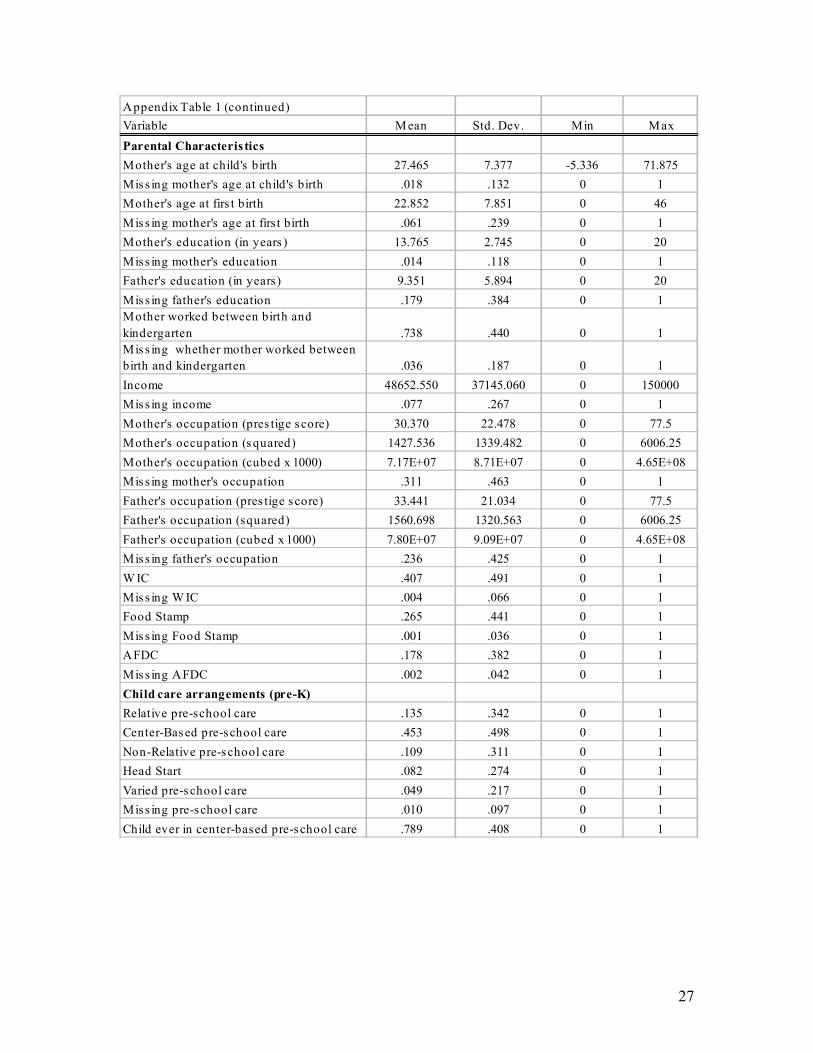
27
Appendix Table 1 (continued)Variable M ean Std. Dev. Min M axParental Characteris ticsMother's age at child's birth 27.465 7.377 -5.336 71.875Miss ing mother's age at child's birth .018 .132 0 1Mother's age at firs t birth 22.852 7.851 0 46Miss ing mother's age at first birth .061 .239 0 1Mother's education (in years ) 13.765 2.745 0 20Miss ing mother's education .014 .118 0 1Father's education (in years) 9.351 5.894 0 20Miss ing father's education .179 .384 0 1Mother worked between birth and kindergarten .738 .440 0 1Miss ing whether mother worked between birth and kindergarten .036 .187 0 1Income 48652.550 37145.060 0 150000Miss ing income .077 .267 0 1Mother's occupation (pres tige score) 30.370 22.478 0 77.5Mother's occupation (squared) 1427.536 1339.482 0 6006.25Mother's occupation (cubed x 1000) 7.17E+07 8.71E+07 0 4.65E+08Miss ing mother's occupation .311 .463 0 1Father's occupation (pres tige score) 33.441 21.034 0 77.5Father's occupation (squared) 1560.698 1320.563 0 6006.25Father's occupation (cubed x 1000) 7.80E+07 9.09E+07 0 4.65E+08Miss ing father's occupation .236 .425 0 1W IC .407 .491 0 1Miss ing W IC .004 .066 0 1Food Stamp .265 .441 0 1Miss ing Food Stamp .001 .036 0 1AFDC .178 .382 0 1Miss ing AFDC .002 .042 0 1Child care arrangements (pre-K)Relative pre-school care .135 .342 0 1Center-Based pre-school care .453 .498 0 1Non-Relative pre-school care .109 .311 0 1Head Start .082 .274 0 1Varied pre-school care .049 .217 0 1Miss ing pre-school care .010 .097 0 1Child ever in center-based pre-school care .789 .408 0 1
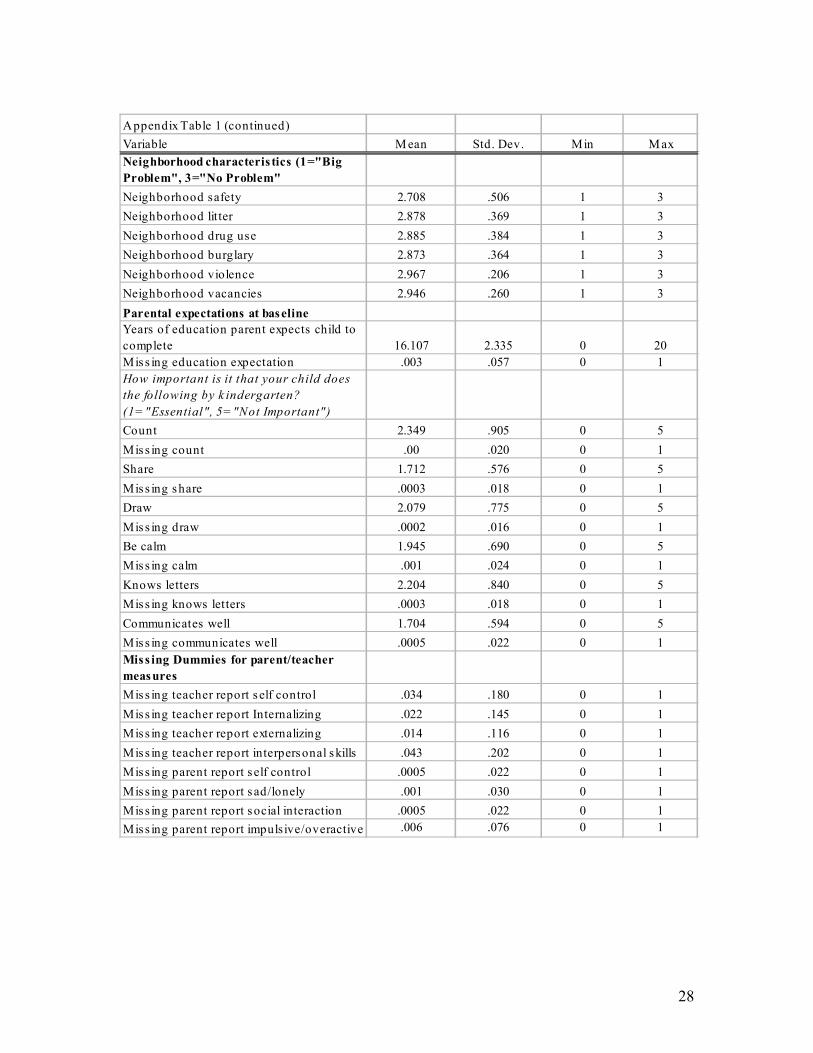
28
Appendix Table 1 (continued)Variable M ean Std. Dev. Min M axNeighborhood characteris tics (1="Big Problem", 3="No Problem"Neighborhood safety 2.708 .506 1 3Neighborhood litter 2.878 .369 1 3Neighborhood drug use 2.885 .384 1 3Neighborhood burglary 2.873 .364 1 3Neighborhood violence 2.967 .206 1 3Neighborhood vacancies 2.946 .260 1 3Parental expectations at baselineYears of education parent expects child to complete 16.107 2.335 0 20Miss ing education expectation .003 .057 0 1How important is it that your child does the following by k indergarten? (1="Essential", 5="Not Important")Count 2.349 .905 0 5Miss ing count .00 .020 0 1Share 1.712 .576 0 5Miss ing share .0003 .018 0 1Draw 2.079 .775 0 5Miss ing draw .0002 .016 0 1Be calm 1.945 .690 0 5Miss ing calm .001 .024 0 1Knows letters 2.204 .840 0 5Miss ing knows letters .0003 .018 0 1Communicates well 1.704 .594 0 5Miss ing communicates well .0005 .022 0 1Miss ing Dummies for parent/teacher measuresMiss ing teacher report s elf control .034 .180 0 1Miss ing teacher report Internalizing .022 .145 0 1Miss ing teacher report externalizing .014 .116 0 1Miss ing teacher report interpersonal skills .043 .202 0 1Miss ing parent report s elf control .0005 .022 0 1Miss ing parent report s ad/lonely .001 .030 0 1Miss ing parent report social interaction .0005 .022 0 1Miss ing parent report impulsive/overactive .006 .076 0 1
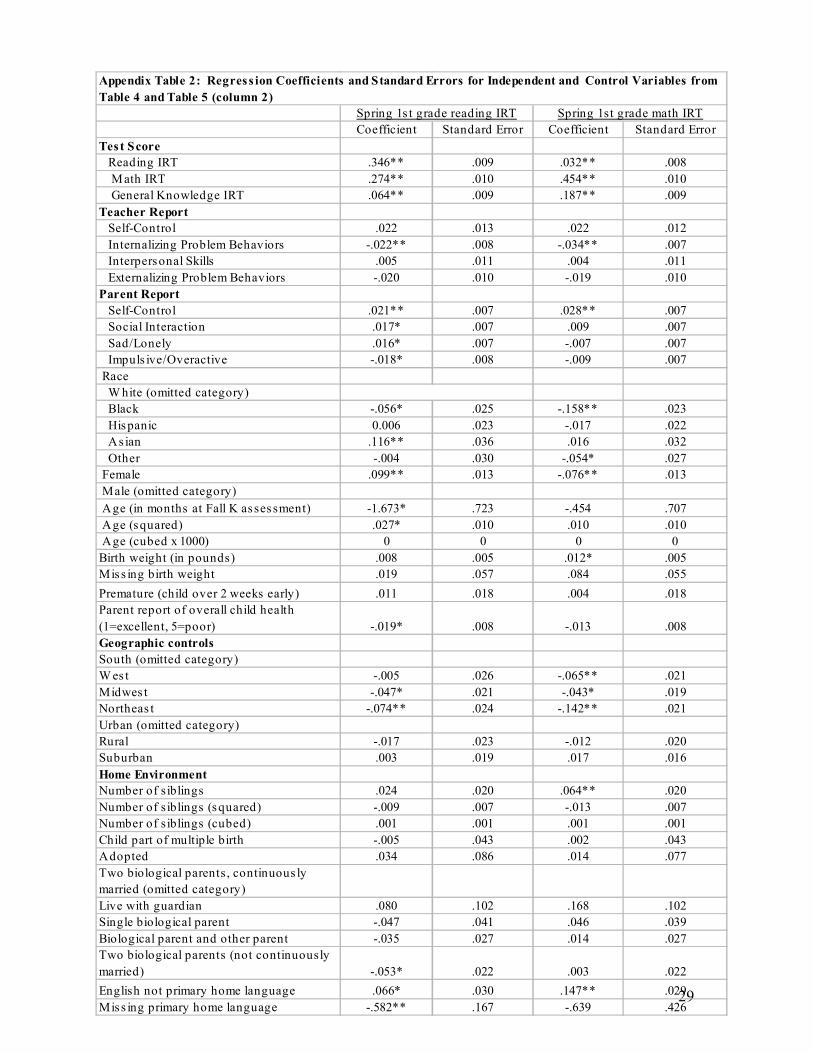
29
Coefficient Standard Error Coefficient Standard ErrorTest Score Reading IRT .346** .009 .032** .008 M ath IRT .274** .010 .454** .010 General Knowledge IRT .064** .009 .187** .009Teacher Report Self-Control .022 .013 .022 .012 Internalizing Problem Behaviors -.022** .008 -.034** .007 Interpersonal Skills .005 .011 .004 .011 Externalizing Problem Behaviors -.020 .010 -.019 .010Parent Report Self-Control .021** .007 .028** .007 Social Interaction .017* .007 .009 .007 Sad/Lonely .016* .007 -.007 .007 Impuls ive/Overactive -.018* .008 -.009 .007 Race W hite (omitted category) Black -.056* .025 -.158** .023 Hispanic 0.006 .023 -.017 .022 As ian .116** .036 .016 .032 Other -.004 .030 -.054* .027 Female .099** .013 -.076** .013 Male (omitted category) Age (in months at Fall K as ses sment) -1.673* .723 -.454 .707 Age (squared) .027* .010 .010 .010 Age (cubed x 1000) 0 0 0 0Birth weight (in pounds) .008 .005 .012* .005Miss ing birth weight .019 .057 .084 .055Premature (child over 2 weeks early) .011 .018 .004 .018Parent report of overall child health (1=excellent, 5=poor) -.019* .008 -.013 .008Geographic controlsSouth (omitted category)W es t -.005 .026 -.065** .021Midwes t -.047* .021 -.043* .019Northeas t -.074** .024 -.142** .021Urban (omitted category)Rural -.017 .023 -.012 .020Suburban .003 .019 .017 .016Home EnvironmentNumber of siblings .024 .020 .064** .020Number of siblings (squared) -.009 .007 -.013 .007Number of siblings (cubed) .001 .001 .001 .001Child part of multiple birth -.005 .043 .002 .043Adopted .034 .086 .014 .077Two biological parents, continuous ly married (omitted category)Live with guardian .080 .102 .168 .102Single biological parent -.047 .041 .046 .039Biological parent and other parent -.035 .027 .014 .027Two biological parents (not continuously married) -.053* .022 .003 .022English not primary home language .066* .030 .147** .029Miss ing primary home language -.582** .167 -.639 .426
Appendix Table 2: Regress ion Coefficients and Standard Errors for Independent and Control Variables from Table 4 and Table 5 (column 2)
Spring 1s t grade reading IRT Spring 1st grade math IRT
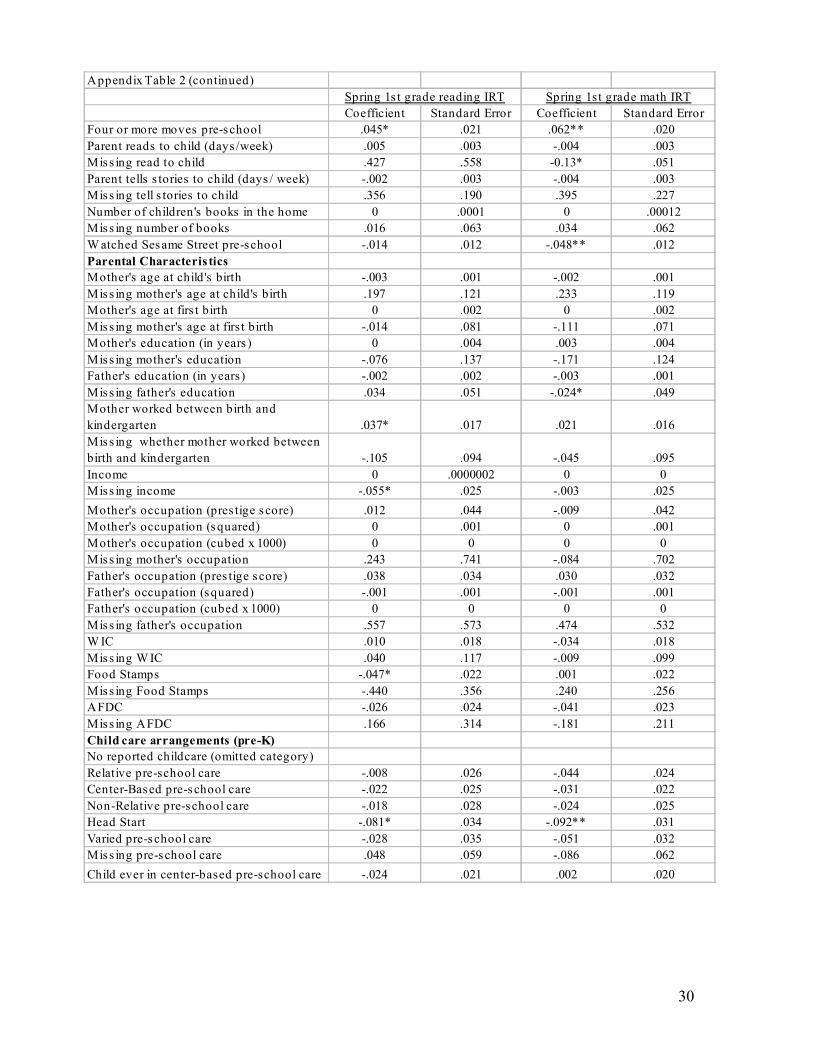
30
Appendix Table 2 (continued)
Coefficient Standard Error Coefficient Standard ErrorFour or more moves pre-school .045* .021 .062** .020Parent reads to child (days /week) .005 .003 -.004 .003Miss ing read to child .427 .558 -0.13* .051Parent tells s tories to child (days / week) -.002 .003 -.004 .003Miss ing tell s tories to child .356 .190 .395 .227Number of children's books in the home 0 .0001 0 .00012Miss ing number of books .016 .063 .034 .062W atched Sesame Street pre-school -.014 .012 -.048** .012Parental Characteris ticsMother's age at child's birth -.003 .001 -.002 .001Miss ing mother's age at child's birth .197 .121 .233 .119Mother's age at firs t birth 0 .002 0 .002Miss ing mother's age at first birth -.014 .081 -.111 .071Mother's education (in years ) 0 .004 .003 .004Miss ing mother's education -.076 .137 -.171 .124Father's education (in years) -.002 .002 -.003 .001Miss ing father's education .034 .051 -.024* .049Mother worked between birth and kindergarten .037* .017 .021 .016Miss ing whether mother worked between birth and kindergarten -.105 .094 -.045 .095Income 0 .0000002 0 0Miss ing income -.055* .025 -.003 .025Mother's occupation (pres tige score) .012 .044 -.009 .042Mother's occupation (squared) 0 .001 0 .001Mother's occupation (cubed x 1000) 0 0 0 0Miss ing mother's occupation .243 .741 -.084 .702Father's occupation (pres tige score) .038 .034 .030 .032Father's occupation (squared) -.001 .001 -.001 .001Father's occupation (cubed x 1000) 0 0 0 0Miss ing father's occupation .557 .573 .474 .532W IC .010 .018 -.034 .018Miss ing W IC .040 .117 -.009 .099Food Stamps -.047* .022 .001 .022Miss ing Food Stamps -.440 .356 .240 .256AFDC -.026 .024 -.041 .023Miss ing AFDC .166 .314 -.181 .211Child care arrangements (pre-K)No reported childcare (omitted category)Relative pre-school care -.008 .026 -.044 .024Center-Based pre-school care -.022 .025 -.031 .022Non-Relative pre-school care -.018 .028 -.024 .025Head Start -.081* .034 -.092** .031Varied pre-school care -.028 .035 -.051 .032Miss ing pre-school care .048 .059 -.086 .062Child ever in center-based pre-school care -.024 .021 .002 .020
Spring 1s t grade reading IRT Spring 1st grade math IRT
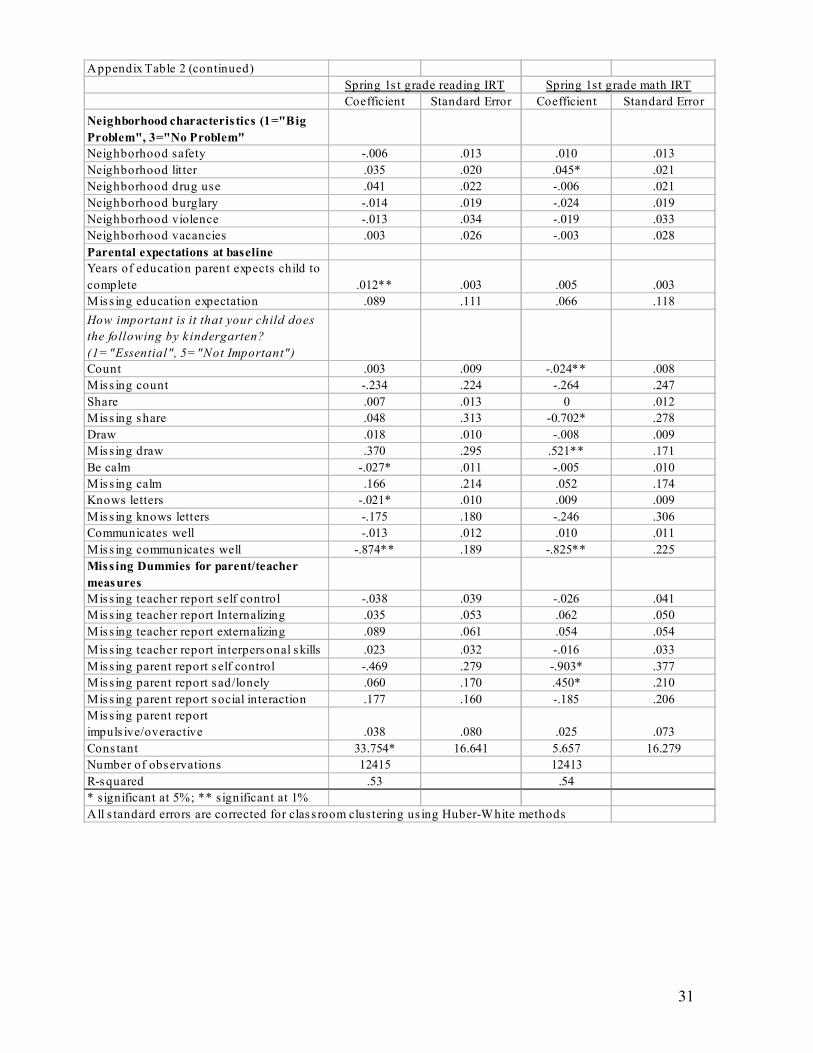
31
Appendix Table 2 (continued)
Coefficient Standard Error Coefficient Standard ErrorNeighborhood characteris tics (1="Big Problem", 3="No Problem"Neighborhood safety -.006 .013 .010 .013Neighborhood litter .035 .020 .045* .021Neighborhood drug use .041 .022 -.006 .021Neighborhood burglary -.014 .019 -.024 .019Neighborhood violence -.013 .034 -.019 .033Neighborhood vacancies .003 .026 -.003 .028Parental expectations at baselineYears of education parent expects child to complete .012** .003 .005 .003Miss ing education expectation .089 .111 .066 .118How important is it that your child does the following by k indergarten? (1="Essential", 5="Not Important")Count .003 .009 -.024** .008Miss ing count -.234 .224 -.264 .247Share .007 .013 0 .012Miss ing share .048 .313 -0.702* .278Draw .018 .010 -.008 .009Miss ing draw .370 .295 .521** .171Be calm -.027* .011 -.005 .010Miss ing calm .166 .214 .052 .174Knows letters -.021* .010 .009 .009Miss ing knows letters -.175 .180 -.246 .306Communicates well -.013 .012 .010 .011Miss ing communicates well -.874** .189 -.825** .225Miss ing Dummies for parent/teacher measuresMiss ing teacher report self control -.038 .039 -.026 .041Miss ing teacher report Internalizing .035 .053 .062 .050Miss ing teacher report externalizing .089 .061 .054 .054Miss ing teacher report interpersonal skills .023 .032 -.016 .033Miss ing parent report s elf control -.469 .279 -.903* .377Miss ing parent report s ad/lonely .060 .170 .450* .210Miss ing parent report social interaction .177 .160 -.185 .206Miss ing parent report impuls ive/overactive .038 .080 .025 .073Cons tant 33.754* 16.641 5.657 16.279Number of observations 12415 12413R-squared .53 .54* significant at 5%; ** significant at 1%All s tandard errors are corrected for clas s room clustering us ing Huber-White methods
Spring 1s t grade reading IRT Spring 1st grade math IRT

32