the corporate ecosystem services review - world ... corporate ecosystem services review 2.0 has been...
TRANSCRIPT

The CorporaTe eCosysTem serviCes review
Guidelines for identifying Business risks and opportunities arising from ecosystem Change
version 2.0


Foreword ii
Acknowledgments iii
summAry iv
chApter I: Background 1
Ecosystem change as source of business risk and opportunity 1
Introducing ecosystem services 3
Linking ecosystem services and business goals: the ESR 8
chApter II: methodology 11
Overview 11
Step 1: Select the scope 13
Step 2: Identify priority ecosystem services 14
Step 3: Analyze trends in priority ecosystem services 20
Step 4: Identify business risks and opportunities 24
Step 5: Develop strategies for addressing risks and opportunities 30
Next steps 32
chApter III: resources 33
notes 35
Additional ESR resources are available at www.wri.org/ecosystems/esr
Table of Contents

practices. The Ecosystem Services Review offers a promising approach for companies to manage the risks and opportuni-ties that will emerge and, at the same time, to become better stewards of the environment. Our three organizations are committed to working with the business community to help this approach become standard practice.
The CorporaTe eCosysTem serviCes reviewii
Global warming may dominate headlines today. Ecosystem degradation will do so tomorrow.
The Millennium Ecosystem Assessment—the first global audit of the world’s forests,
wetlands, and other ecosystems—found that ecosystems have declined more rapidly and extensively over the past 50 years than at any other comparable time in human history. Left unchecked, this degradation jeopardizes not just the world’s biodiversity, but also its businesses. This is because compa-nies depend on the services healthy ecosystems provide such as freshwater, wood, genetic resources, pollination, climate regulation, and natural hazard protection.
This publication provides corporate managers with a proactive approach to making the connection between ecosystem change and their business goals. It introduces the Corporate Ecosystem Services Review—a structured methodology to help businesses develop strategies for manag-ing risks and opportunities arising from their dependence and impact on ecosystems. It is a tool for corporate strategy development and can augment existing environmental management systems.
Our three organizations contributed complementary skills to create the Ecosystem Services Review. The World Resources Institute developed the methodology and managed the road-testing phase as part of its efforts to mainstream ecosystem services into private sector decision-making. Five member companies of the World Business Council for Sustainable Development—Akzo Nobel, BC Hydro, Mondi, Rio Tinto, and Syngenta—road-tested and provided feed-back on the methodology. The Meridian Institute brought the experience and relationships developed as a core member of the secretariat that designed and managed the Millennium Ecosystem Assessment and brought its process design and facilitation skills to the team.
As of early 2012, an estimated 300 companies have used this guidance to identify and address business risks and opportunities arising from ecosystem change. In addition, new decision support tools have been introduced to help companies better understand and capitalize upon the specific business value they receive from ecosystem services, such as the Guide to Corporate Ecosystem Valuation. The Corporate Ecosystem Services Review 2.0 has been updated to draw on these developments.
Global climate change and the demands of a growing population are likely to further degrade ecosystems in com-ing years, increasingly challenging business assumptions and
Foreword
Ph
oto
co
ur
te
sy
of
Mo
nd
i
A Mondi gum plantation (Eucalyptus grandis) growing in the Tygerskloof area, South Africa.
Manish BapnaInterim PresidentWorld Resources Institute
Peter BakkerPresidentWorld Business Council for Sustainable Development
John Ehrmann, PhDManaging PartnerMeridian Institute

Acknowledgments
ACkNOwLEDgmENTS iii
AuthorsCraig Hanson (WRI) Janet Ranganathan (WRI) Charles Iceland (WRI) John Finisdore (WRI)
The authors gratefully acknowledge John Ehrmann (Meridian Institute), James Griffiths (WBCSD), Mikkel Kallesoe (WBCSD and IUCN), and Heather Lair (Meridian Institute) for their contributions in developing the Cor-
porate Ecosystem Services Review.We thank Yasmina Abdelilah, Karen Bennett, Alexa Clay,
Suzanne Ozment, Brianna Peterson, and Alison Williams of WRI for their research in support of this publication.
We are grateful to the following colleagues and friends who provided critical reviews and other valuable contri-butions to this publication: Andrew Aulisi (WRI), Manish Bapna (WRI), Nicholas Bertrand (United Nations Environ-ment Programme), Gerard Bos (Holcim), Antonio Neves de Carvalho (Energias de Portugal), Michael Fahy (SGS SA), Sara Carvalho Fernandes (Energias de Portugal), Jessica Fox (EPRI Solutions), Trey Gibbs (ERS Global, Inc.), Eva Zabey (WBCSD), Frances Irwin (WRI), Joshua Kahan (ERS Global, Inc.), Bruce M. Kahn (Citi Smith Barney), Ayako Kohno (Hitachi Chemical Co., Ltd.), Robin Murphy (WRI), Liv Marthe Ness (Det Norske Veritas), Chris Perceval (WRI), Noam Ross (GreenOrder), Theo Stephens (Department of Conservation, Government of New Zealand), Kerry ten Kate (Forest Trends), Tor G. Tollefsen (Det Norske Veritas), Sissel Waage (Business for Social Responsibility), and Fred Wellington (WRI).
The authors extend special gratitude to the ESR road-test companies, including Karin Andersson (Akzo Nobel), Chris Burchmore (Mondi), Doug Burden (Mondi Shanduka), Peter Gardiner (Mondi), Juan Gonzalez-Valero (Syngenta),
Klas Hallberg (Akzo Nobel), Steve Hunt (Akzo Nobel), Hans Johansson (Akzo Nobel), Sawatenter Khosla (Syngenta), Cameron Jones (Rio Tinto), Tim Lesiuk (BC Hydro), Mick Lovely (Rio Tinto), Dave Richards (Rio Tinto), Bruce Sampson (BC Hydro), Erik Widén (Akzo Nobel), Ian Wylie (Rio Tinto), and Douglas van Zyl (Mondi).
The publication process was helped along by WRI’s wonderful publications team, particularly Hyacinth Billings and Jennie Hommel. We thank Bob Livernash for editing and proofreading. We also thank the staff of Dever Designs for their work.
We are indebted to The David & Lucile Packard Founda-tion, the Netherlands Ministry of Foreign Affairs, the Royal Danish Ministry of Foreign Affairs, the Swedish International Biodiversity Programme, and the World Business Council for Sustainable Development for their generous financial support for this undertaking.
This report is released in the name of the World Resources Institute (WRI), the Meridian Institute, and the World Business Council for Sustainable Development (WBCSD). It is the result of a collaborative effort by WRI, Meridian, and the WBCSD secretariat. It does not necessarily represent the views of WRI, Meridian, WBCSD members, or the publication’s funders.
This publication was updated in 2012 by Suzanne Ozment (World Resources Institute) and Eva Zabey (World Business Council for Sustainable Development). The 2nd version of this publication was also helped along by Robert Winterbot-tom (WRI), Nick Price (WRI), Maggie Powell, Sylvia Song, and the staff at Sveconway Printing and Marketing Solutions.

Ecosystems provide businesses with numerous benefits or “ecosystem services.” Forests supply timber and wood fiber, purify water, regulate climate, and yield genetic resources. River sys-tems provide freshwater, power, and recreation.
Coastal wetlands filter waste, mitigate floods, and serve as nurseries for commercial fisheries.
However, human activities are rapidly degrading these and other ecosystems. The Millennium Ecosystem Assess-ment—the largest audit ever conducted of the condition and trends in the world’s ecosystems—found that ecosystems have declined more rapidly and extensively over the past 50 years than at any other comparable time in human history. In fact, 15 of the 24 ecosystem services evaluated have degraded over the past half century. The Assessment projected further declines over coming decades, particularly in light of popula-tion growth, economic expansion, and global climate change. Left unchecked, this degradation could jeopardize future economic well-being, creating new winners and losers within the business community.
Ecosystem degradation is highly relevant to business be-cause companies not only impact ecosystems and the services they provide but also depend on them. Ecosystem degradation, therefore, can pose a number of risks to corporate perfor-mance as well as create new business opportunities. Types of risks and opportunities include:
•Operational – Risks such as higher costs for freshwater due to scar-city, lower output for hydroelectric facilities due to siltation, or disruptions to coastal businesses due to flooding – Opportunities such as increasing water-use efficiency or building an on-site wetland to circumvent the need for new water treatment infrastructure
•Regulatory and legal – Risks such as new fines, new user fees, government regulations, or lawsuits by local communities that lose ecosystem services due to corporate activities – Opportunities such as engaging governments to develop policies and incentives to protect or restore ecosystems that provide services a company needs
Summary
The CorporaTe eCosysTem serviCes reviewiv
•Reputational – Risks such as retail companies being targeted by nongovernmental organization campaigns for pur-chasing wood or paper from sensitive forests or banks facing similar protests due to investments that degrade pristine ecosystems – Opportunities such as implementing and communi-cating sustainable purchasing, operating, or investment practices in order to differentiate corporate brands
•Market and product – Risks such as customers switching to other suppliers that offer products with lower ecosystem impacts or governments implementing new sustainable procurement policies – Opportunities such as launching new products and services that reduce customer impacts on ecosystems, participating in emerging markets for carbon seques-tration and watershed protection, capturing new revenue streams from company-owned natural assets, and offering eco-labeled wood, seafood, produce, and other products
•Financing – Risks such as banks implementing more rigorous lend-ing requirements for corporate loans – Opportunities such as banks offering more favorable loan terms or investors taking positions in companies supplying products and services that improve resource-use efficiency or restore degraded ecosystems.
Unfortunately, companies often fail to make the con-nection between the health of ecosystems and the business bottom line. Many companies are not fully aware of the extent of their dependence and impact on ecosystems and the possible ramifications. Likewise, environmental management systems and environmental due diligence tools are often not fully attuned to the risks and opportunities arising from the degradation and use of ecosystem services. For instance, many tools are more suited to handle “traditional” issues of pollution and natural resource consumption. Most focus on environmental impacts, not dependence. Furthermore, they typically focus on risks, not business opportunities. As a result, companies may be caught unprepared or miss new sources of revenue associated with ecosystem change.

SummARy v
The Corporate Ecosystem Services Review (ESR) is designed to address these gaps. It consists of a structured methodology that helps managers proactively develop strategies to manage business risks and opportunities arising from their company’s dependence and impact on ecosys-tems. It is a tool for strategy development, not just for environmental assessment. Businesses can either conduct an Ecosystem Services Review as a stand-alone process or integrate it into their existing environmental management systems. In both cases, the methodology can complement and augment the environmental due diligence tools compa-nies already use.
The Ecosystem Services Review can provide value to businesses in industries that directly interact with ecosys-tems such as agriculture, beverages, water services, forestry, electricity, oil, gas, mining, and tourism. It is also relevant to sectors such as general retail, healthcare, consulting, finan-cial services, and others to the degree that their suppliers or customers interact directly with ecosystems. General retailers, for example, may face reputational or market risks if some of their suppliers are responsible for degrading ecosystems and the services they provide.
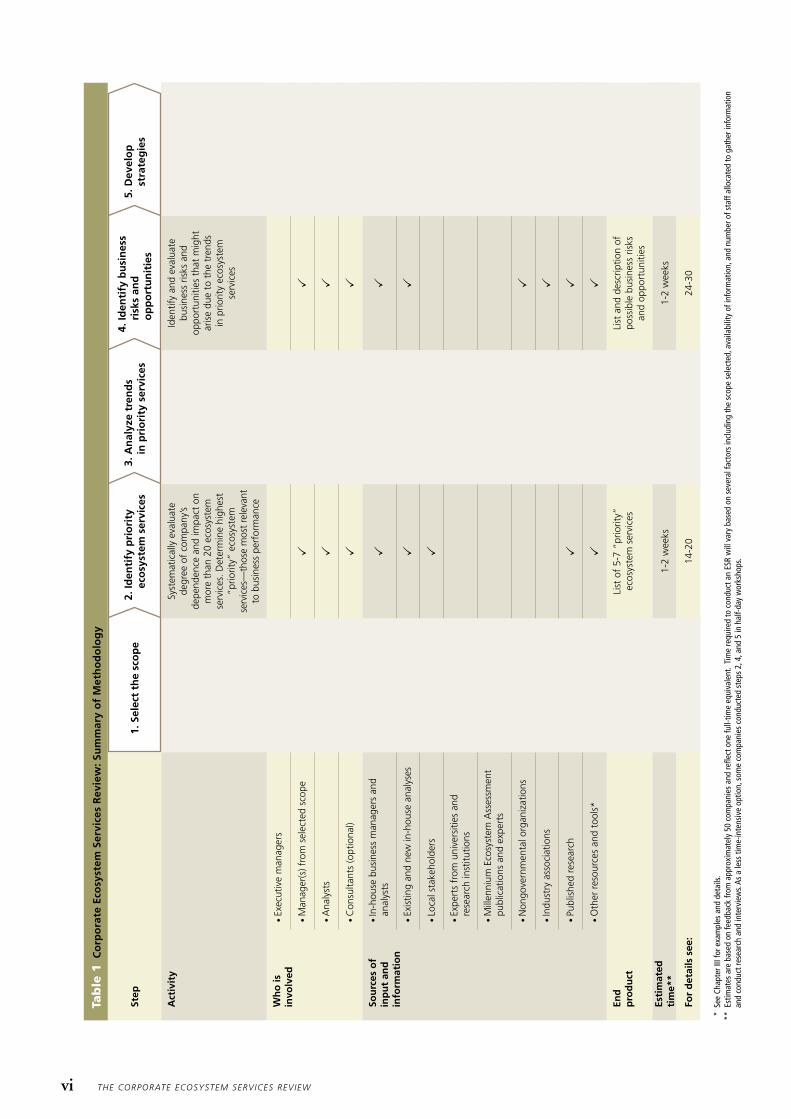
This publication describes the five steps for performing an Ecosystem Services Review (Table 1). It provides an analytical framework, case examples, and helpful suggestions for each step. It concludes by highlighting a number of resources managers can use when conducting an Ecosystem
Services Review, including a “dependence and impact assess-ment” spreadsheet, scientific reports, economic valuation approaches, and other issue-specific tools.
As of 2012, an estimated 300 companies have used the Ecosystem Services Review. In addition, complementary tools and guidance now exist to help companies more fully assess business risks and opportunities emerging from ecosystem change. For example, in 2011 the World Business Council for Sustainable Development released the Guide to Corporate Ecosystem Valuation (CEV), which provides infor-mation on how to quantitatively, or in some cases monetarily, assess risks and opportunities related to ecosystem services. CEV can therefore be a logical next step after undertaking an ESR. The Economics of Ecosystems and Biodiversity (2010) highlighted new examples of the linkages between business and ecosystem services. The ESR remains a fundamental starting point for companies to assess business risks and op-portunities related to ecosystem change.
Global degradation of ecosystems and the services they provide threatens to alter the landscape in which business operates. The Ecosystem Services Review is a proactive ap-proach for companies to manage the risks and opportunities that are emerging. Furthermore, by helping companies make the connection between healthy ecosystems and the bottom line, it will encourage not only more sustainable business practices, but also corporate support for policies to protect and restore ecosystems.
Ecosystems supply a range of services. Forests, for example, provide timber, water regulation, and recreation.
The CorporaTe eCosysTem serviCes reviewvi
step
1. s
elec
t th
e sc
op
e2.
Iden
tify
pri
ori
ty
eco
syst
em s
ervi
ces
3. A
nal
yze
tren
ds
in
pri
ori
ty s
ervi
ces
4. Id
enti
fy b
usi
nes
s
risk
s an
d
op
po
rtu
nit
ies
5. d
evel
op
st
rate
gie
s
Act
ivit
yC
hoos
e bo
unda
ry w
ithin
w
hich
to
cond
uct
the
ESR
(a s
peci
fic b
usin
ess
unit,
pr
oduc
t, m
arke
t,
land
hold
ings
, maj
or
cust
omer
, sup
plie
r, et
c.)
Syst
emat
ical
ly e
valu
ate
de
gree
of
com
pany
’s
depe
nden
ce a
nd im
pact
on
mor
e th
an 2
0 ec
osys
tem
se
rvic
es. D
eter
min
e hi
ghes
t
“prio
rity”
eco
syst
em
serv
ices
—th
ose
mos
t re
leva
nt
to b
usin
ess
perf
orm
ance
Rese
arch
and
eva
luat
e co
nditi
ons
and
tren
ds
in t
he p
riorit
y ec
osys
tem
se
rvic
es, a
s w
ell a
s th
e
driv
ers
of t
hese
tre
nds
Iden
tify
and
eval
uate
bu
sine
ss r
isks
and
op
port
uniti
es t
hat
mig
ht
aris
e du
e to
the
tre
nds
in
prio
rity
ecos
yste
m
serv
ices
Out
line
and
prio
ritiz
e
stra
tegi
es f
or m
anag
ing
th
e ris
ks a
nd
oppo
rtun
ities
wh
o is
in
volv
ed
•Ex
ecut
ive
man
ager
sP
P
• m
anag
er(s
) fro
m s
elec
ted
scop
e P
PP
P
•A
naly
sts
PP
PP
•C
onsu
ltant
s (o
ptio
nal)
PP
PP
sou
rces
of
in
pu
t an
d
info
rmat
ion
• In
-hou
se b
usin
ess
man
ager
s an
d an
alys
tsP
PP
P
•Ex
istin
g an
d ne
w in
-hou
se a
naly
ses
PP
P
•Lo
cal s
take
hold
ers
P
• Ex
pert
s fr
om u
nive
rsiti
es a
nd
rese
arch
inst
itutio
nsP
• m
illen
nium
Eco
syst
em A
sses
smen
t
publ
icat
ions
and
exp
erts
P
•N
ongo
vern
men
tal o
rgan
izat
ions
PP
P
• In
dust
ry a
ssoc
iatio
nsP
PP
• Pu
blis
hed
rese
arch
PP
P
• O
ther
res
ourc
es a
nd t
ools
*P
PP
end
p
rod
uct
Boun
dary
for
ESR
ana
lysi
s Li
st o
f 5-
7 “p
riorit
y”
ecos
yste
m s
ervi
ces
Shor
t pa
per
or s
et o
f da
ta
that
sum
mar
izes
tre
nds
for
each
prio
rity
ecos
yste
m s
ervi
ce
List
and
des
crip
tion
of
poss
ible
bus
ines
s ris
ks
and
oppo
rtun
ities
Prio
ritiz
ed s
et o
f
stra
tegi
es
esti
mat
ed
tim
e**
1-2
wee
ks1-
2 w
eeks
2-5
wee
ks1-
2 w
eeks
1-2
wee
ks
For
det
ails
see
:pa
ges
13-1
414
-20
20-2
324
-30
30-3
2
Tab
le 1
co
rpo
rate
eco
syst
em s
ervi
ces
rev
iew
: su
mm
ary
of
met
ho
do
log
y
* s
ee c
hapt
er ii
i for
exa
mpl
es a
nd d
etai
ls.**
est
imat
es a
re b
ased
on
feed
back
from
app
roxi
mat
ely
50 c
ompa
nies
and
refle
ct o
ne fu
ll-tim
e eq
uiva
lent
. ti
me
requ
ired
to c
ondu
ct a
n es
r w
ill v
ary
base
d on
sev
eral
fact
ors
incl
udin
g th
e sc
ope
sele
cted
, ava
ilabi
lity
of in
form
atio
n, a
nd n
umbe
r of s
taff
allo
cate
d to
gat
her i
nfor
mat
ion
an
d co
nduc
t res
earc
h an
d in
terv
iew
s. As
a le
ss ti
me-
inte
nsiv
e op
tion,
som
e co
mpa
nies
con
duct
ed s
teps
2, 4
, and
5 in
hal
f-day
wor
ksho
ps.

ECOSYSTEM CHANGE AS SOURCE OF BUSINESS RISK AND OPPORTUNITY
What do these five stories—which cross a number of continents and industries—have in common?
• In the 1980s, mineral water company Vittel (now a brand of Nestlé Waters) faced a critical problem. Ni-trates and pesticides were entering the company’s springs in northeastern France. Local farmers had intensified agricultural practices and cleared native vegetation that previously had filtered water before it seeped into the aquifer used by Vittel. This contamination threatened the company’s right to use the “natural mineral water” label under French law. The Vittel brand and business were at stake.1
• Costa Rican hydropower company Energia Global (now Enel Latin America) faced a different crisis. In the 1990s, it was literally losing its source of power. Land-owners were clearing the forested slopes upstream of the company’s dams for livestock and agriculture. With the trees gone, heavy rains were causing increased soil erosion and river sedimentation, lowering dam reservoir capacity and power output.2
• Unilever—an international manufacturer of food, home care, and personal care products with brands such as Lipton, Surf, and Vaseline—experienced a problem at sea. Cod was the main fish used in the company’s pre-mium frozen food products. In the 1990s, however, cod stocks declined precipitously and collapsed altogether in the western North Atlantic due to overexploitation. The dramatic price increases that ensued reduced margins on Unilever’s cod-related products by 30 percent.3
• Potlatch, a U.S.-based wood products company, did not encounter a threat but rather an opportunity. For years, the company had managed its forests for timber. However, its 270,000 hectares of forest in Idaho were a popular destination for hikers, campers, birdwatchers, and hunters, drawing approximately 200,000 visitor-
BACkgROuND 1
use-days per year. Recognizing an opportunity for a complementary source of revenue, the company in-troduced user fees in 2007 to capture the recreational value its forests provide.4
• Allegheny Power had its own kind of opportunity. Ear-lier this decade, the U.S.-based electric utility wanted to divest its 4,800-hectare Canaan Valley property in West Virginia. Traditional approaches appraised the real estate at $16 million. Believing the property—with its pristine forests, marshes, and abundant wildlife—was worth more, the company commissioned an economic valua-tion of the marketable environmental benefits provided by the site, including its ability to sequester carbon and its wetlands. The eco-assessment boosted the total value to nearly $33 million. Allegheny Power subsequently sold Canaan Valley to the U.S. government—which merged it with an existing wildlife refuge—for the tra-ditional appraisal price of $16 million. Using “bargain sale” provisions in the federal tax code, however, the company was able to claim a charitable contribution of $17 million for the property’s environmental value, yielding several million dollars in tax-related savings.5
All of these stories share at least one aspect: they highlight companies facing unexpected risks or novel opportunities arising from their dependence and impact on ecosystems. Vittel, Energia Global, and Unilever faced risks to their bottom lines due to the deterioration of an ecosystem upon which their businesses depended. Potlatch and Allegheny Power seized new business opportunities by tapping into the value of ecosystems.
C H A P T E R
Background

The CorporaTe eCosysTem serviCes review2
• Providing guidance on developing strategies to manage these risks and opportunities
• Illustrating how companies such as Vittel, Energia Global, Unilever, and others successfully addressed ecosystem-related risks and opportunities.
The ESR was developed by the World Resources Institute with support from the Meridian Institute and the World Business Council for Sustainable Development (WBCSD). Five WBCSD member companies “road-tested” the method-ology and provided feedback that was incorporated into its design. The ESR also received input from a number of other companies (Box 2).
But these examples are not isolated cases. Other com-panies face similar risks and opportunities as the world’s ecosystems undergo rapid change due to human pressures. However, many companies are not fully aware of the business implications of their dependence and impact on ecosystems and the services they provide.
The Corporate Ecosystem Services Review (ESR) is designed to make this link and inform corporate strategy. The ESR is a structured methodology that helps managers proactively develop strategies to manage business risks and opportunities arising from their company’s dependence and impact on ecosystems. It is designed for use by sec-tors ranging from extractive industries and agribusiness to manufacturing and retail. For each of these sectors, it can support a number of corporate decisions and processes (Box 1).
This publication guides business managers on how to conduct an ESR by:
• Introducing the concept of “ecosystem services” as a framework for assessing a company’s dependence and impact on the environment
• Describing a process for identifying which ecosystem services are “priority” services; that is, those most relevant to a company’s performance
• Providing a structured approach for analyzing important trends in these priority ecosystem services
• Offering a framework for identifying potential business risks and opportunities arising from these trends
lCorporate, business unit, or market strategy development
lPlanning processes for corporate infrastructure projects such as mines, wells, pipelines, plantations, and facilities
lIdentification of new markets, products, or services
lIdentification of new revenue streams from corporate landholdings
lInvestments in projects or companies
lPolicy-maker engagement strategies
lEnvironmental impact assessments
lEnvironmental reporting
Box 1 Business decisions and processes the corporate esr can support
developers
lThe world resources institute (www.wri.org) is a global, nonprofit environmental think tank that goes beyond research to find practical ways to protect the Earth and improve people’s lives.
lThe meridian institute (www.merid.org) is a nonprofit organization that helps decisionmakers and diverse stakeholders solve some of society’s most contentious public policy issues. meridian facilitated the millennium Ecosystem Assessment.
lThe world Business Council for sustainable Development (www.wbcsd.org) brings together some 200 international companies in a shared commitment to sustainable development through economic growth, ecological balance, and social progress.
road-test companies
lakzo Nobel (www.akzonobel.com) serves customers throughout the world with coatings and chemicals.
lBC hydro (www.bchydro.com) is one of the largest electrical companies in Canada whose purpose is to provide reliable power at low cost for generations.
l mondi (www.mondigroup.com) is a leading international paper and packaging group operating in 35 countries and is Europe’s largest producer of kraft paper and office paper.
lrio Tinto (www.riotinto.com) is a mining and exploration company with operations on every continent whose products include aluminum, copper, diamonds, energy products, iron ore, gold, and industrial minerals.
l syngenta (www.syngenta.com) is a worldwide agribusiness committed to sustainable agriculture through innovative research and technology.
corporate reviewers
lCiti Smith Barney lDet Norske Veritas lEnergias de Portugal lERS global, Inc. lkPmg
lgreenOrder lHitachi Chemical Co., Ltd. lHolcim lSgS SA
Box 2 the corporate esr developers, road-test companies, and corporate reviewers
As of 2012, an estimated 300 companies have used or are using the ESR. For more information on recent applications of the ESR, including new case studies, visit www.wri.org/ecosystems/esr

background 3
INTRODUCING ECOSYSTEM SERVICESEcosystems provide businesses—as well as people and
communities—with a wide range of goods and services. For example, forests supply timber and wood fiber, regu-late climate by absorbing carbon dioxide, and yield genetic resources for medicines. Coral reefs attract tourists, serve as nurseries for commercial fish species, and protect properties along coastlines from storm surges. Wetlands absorb waste, help reduce floods, and purify water. These and other ben-efits from nature are known as “ecosystem services” (see Box 3 for this and other key terms).
categories of ecosystem servicesThe Millennium Ecosystem Assessment shed light on the
importance of ecosystem services for human well-being and business development.6 The Assessment was a four-year inter-national audit of ecosystems that involved more than 1,360 scientists, economists, business professionals, and other experts from 95 countries. Its findings provide the first state-of-the-art scientific evaluation of the condition and trends in the world’s ecosystems and the services they provide, as well as the scien-tific basis for action to conserve and use them sustainably. The Assessment defined four categories of services:
• Provisioning services: The goods or products obtained from ecosystems such as food, freshwater, timber, and fiber.
• Regulating services: The benefits obtained from an ecosystem’s control of natural processes such as climate, disease, erosion, water flows, and pollination, as well as protection from natural hazards. “Regulating” in this context is a natural phenomenon and is not to be con-fused with government policies or regulations.
• Cultural services: The nonmaterial benefits obtained from ecosystems such as recreation, spiritual values, and aesthetic enjoyment.
• Supporting services: The natural processes such as nutrient cycling and primary production that maintain the other services.
Beneficiaries of these services can be at the local, regional, and/or global scale and may include future generations. For instance, a forest may provide local people with wild food, natural fibers, and fuelwood. At a regional level, it may prevent landslides, filter water, and offer recreation for inhabitants of a nearby city. At a global level, this forest may sequester carbon dioxide—helping to regulate greenhouse gas concentrations in the atmosphere—and be the home of a rare plant with pharmaceutical properties that benefit people around the world.
Table 2 lists, defines, and provides examples of the ecosystem services analyzed by the Millennium Ecosystem
Ph
oto
co
ur
te
sy
of
Bc
hy
dr
o
BC Hydro’s Ladore Falls Dam on the Campbell River in British Columbia, Canada.
An ecosystem is a dynamic complex of plant, animal, and micro-organism communities and their nonliving environment interacting as a functional unit. Examples of ecosystems include deserts, coral reefs, wetlands, rain forests, boreal forests, grasslands, urban parks, and cultivated farmlands. Ecosystems can be relatively undisturbed by people, such as virgin rain forests, or can be modified by human activity, such as farms.
ecosystem services—sometimes called “environmental services” or “ecological services”—are the benefits that people obtain from ecosystems. Examples include freshwater, timber, climate regulation, protection from natural hazards, erosion control, and recreation.
Biodiversity is the variability among living organisms within species, between species, and between ecosystems.
A company depends on an ecosystem service if that service functions as an input or if it enables, enhances, or influences environmental conditions required for successful corporate performance.
A company impacts an ecosystem service if the company affects the quantity or quality of the service.
A company’s priority ecosystem services are those services on which the company has a high dependence and/or impact and thereby are the most likely sources of business risk or opportunity to the company.
drivers are factors—natural or man-made—that cause changes in an ecosystem and its ability to supply ecosystem services.
Box 3 key terms

The CorporaTe eCosysTem serviCes review4
Table 2 definitions of ecosystem services
Service Subcategory Definition Examples
provisioning services: The goods or products obtained from ecosystems
Food Crops Cultivated plants or agricultural produce harvested by people for human or animal consumption as food
• grains• Vegetables• Fruits
Livestock Animals raised for domestic or commercial consumption or use • Chickens• Pigs• Cattle
Capture fisheries wild fish captured through trawling and other non-farming methods
• Cod • Crabs • Tuna
Aquaculture Fish, shellfish, and/or plants that are bred and reared in ponds, enclosures, and other forms of freshwater or saltwater confine-ment for purposes of harvesting
• Shrimp• Oysters• Salmon
wild foods Edible plant and animal species gathered or captured in the wild • Fruits and nuts• Fungi• Bushmeat
Biological raw materials
Timber and other wood products
Products made from trees harvested from natural forest ecosys-tems, plantations, or non-forested lands
• Industrial roundwood• wood pulp• Paper
Fibers and resins Non-wood and non-fuel fibers and resins • Cotton, silk, hemp• Twine, rope• Natural rubber
Animal skins Processed skins of cattle, deer, pig, snakes, sting rays, or other animals
• Leather, rawhide, cordwain
Sand Sand formed from coral and shells • white sand from coral and white shells• Colored sand from shells
Ornamental resources
Products derived from ecosystems that serve aesthetic purposes • Tagua nut, wild flowers, coral jewelry
Biomass fuel Biological material derived from living or recently living organ-isms—both plant and animal—that serves as a source of energy
• Fuelwood and charcoal• grain for ethanol production• Dung
Freshwater Inland bodies of water, groundwater, rainwater, and surface waters for household, industrial, and agricultural uses
• Freshwater for drinking, cleaning, cooling, industrial processes, electricity generation, or mode of transportation
genetic resources genes and genetic information used for animal breeding, plant improvement, and biotechnology
• genes used to increase crop resistance to disease or pests
Biochemicals, natural medi-cines, and pharmaceuticals
medicines, biocides, food additives, and other biological materi-als derived from ecosystem for commercial or domestic use
• Echinacea, ginseng, garlic• Paclitaxel as basis for cancer drugs• Tree extracts used for pest control
regulating services: The benefits obtained from an ecosystem’s control of natural processes
maintenance of air quality Influence ecosystems have on air quality by emitting chemicals to the atmosphere (i.e., serving as a “source”) or extracting chemicals from the atmosphere (i.e., serving as a “sink”)
• Lakes serve as a sink for industrial emissions of sulfur compounds
• Tree and shrub leaves trap air pollut-ants near roadways
regulation of climate
global Influence ecosystems have on the global climate by emitting greenhouse gases or aerosols to the atmosphere or by absorbing greenhouse gases or aerosols from the atmosphere
• Forests capture and store carbon dioxide
• Cattle and rice paddies emit methane
Regional and local
Influence ecosystems have on local or regional temperature, precipitation, and other climatic factors
• Forests can impact regional rainfall levels
regulation of water timing and flows
Influence ecosystems have on the timing and magnitude of wa-ter runoff, flooding, and aquifer recharge, particularly in terms of the water storage potential of the ecosystem or landscape
• Permeable soil facilitates aquifer recharge
• River floodplains and wetlands retain water—which can decrease flooding—reducing the need for engineered flood control infrastructure

Sources:
Millennium Ecosystem Assessment. 2005. Ecosystems and Human Well-being: Synthesis. Washington, DC: Island Press.
Braat, L., P. ten Brink. 2008. The Cost of Policy Inaction: The case of not meeting the 2010 biodiversity target. Wageningen/Brussels: The European Commission.
TEEB. 2010. The Economics of Ecosystems and Biodiversity Report for Business - Executive Summary.
BACkgROuND 5
Table 2 definitions of ecosystem services (continued)
Service Definition Definition Examples
regulating services (continued)
erosion control Role ecosystems play in retaining and replenishing soil and sand deposits
• Vegetation such as grass and trees prevents soil loss due to wind and rain and prevents siltation of waterways
• Coral reefs, oyster reefs, and sea grass beds reduce loss of land and beaches due to waves and storms
water purification and waste treatment
Role ecosystems play in the filtration and decomposition of organic wastes and pollutants in water; assimilation and detoxification of compounds through soil and subsoil processes
• wetlands remove harmful pollutants from water by trapping metals and organic materials
• Soil microbes degrade organic waste, rendering it less harmful
disease mitigation
Influence that ecosystems have on the incidence and abundance of human pathogens
• Some intact forests reduce the occurrence of standing water—a breeding area for mosquitoes—which lowers the prevalence of malaria
maintenance of soil quality
Role ecosystems play in sustaining soil’s biological activity, diversity and productivity; regulating and partitioning water and solute flow; storing and recycling nutrients and gases; among other functions
• Some organisms aid in decomposition of organic matter, increasing soil nutrient levels
• Some organisms aerate soil, improve soil chemistry, and increase moisture retention
pest mitigation Influence ecosystems have on the prevalence of crop and livestock pests and diseases
• Predators from nearby forests—such as bats, toads, and snakes—consume crop pests
pollination Role ecosystems play in transferring pollen from male to female flower parts
• Bees from nearby forests pollinate crops
natural hazard mitigation
Capacity for ecosystems to reduce the damage caused by natural disasters such as hurricanes and tsunamis and to maintain natural fire frequency and intensity
• mangrove forests and coral reefs protect coastlines from storm surges
• Biological decomposition processes reduce potential fuel for wildfires
cultural services: The nonmaterial benefits obtained from ecosystems
recreation and ecotourism
Recreational pleasure people derive from natural or cultivated ecosystems
• Hiking, camping, and bird watching• going on safari• Scuba diving
ethical and spiritual values
Spiritual, religious, aesthetic, intrinsic, “existence,” or similar values people attach to ecosystems, landscapes, or species
• Spiritual fulfillment derived from sacred lands and rivers• People’s desire to protect endangered species and rare
habitats
educational and inspirational values
Information derived from ecosystems used for intellectual development, culture, art, design, and innovation
• The structure of tree leaves has inspired technological improvements in solar power cells
• School fieldtrips to nature preserves aid in teaching scientific concepts and research skills
supporting services: The natural processes that maintain the other ecosystem services
habitat Natural or semi-natural spaces that maintain species popu-lations and protect the capacity of ecological communities to recover from disturbances
• Native plant communities often provide pollinators with food and structure for reproduction
• Rivers and estuaries provide nurseries for fish reproduction and juvenile development
• Large natural areas and biological corridors allow animals to survive forest fires and other disturbances
nutrient cycling Flow of nutrients (e.g., nitrogen, sulfur, phosphorus, carbon) through ecosystems
• Transfer of nitrogen from plants to soil, from soil to oceans, from oceans to the atmosphere, and from the atmosphere to plants
primary production
Formation of biological material by plants through photosynthesis and nutrient assimilation
• Algae transform sunlight and nutrients into biomass, thereby forming the base of the food chain in aquatic ecosystems
water cycling Flow of water through ecosystems in its solid, liquid, or gaseous forms
• Transfer of water from soil to plants, plants to air, and air to rain

The CorporaTe eCosysTem serviCes review6
Assessment and The Economics of Ecosystems and Biodiver-sity. It is an important resource for conducting an ESR. Box 4 answers some frequently asked questions about ecosystem services.
trends in ecosystem services Although buffered against ecosystem change by culture
and technology, all people and businesses fundamentally de-pend on the flow of ecosystem services. However, the ability of ecosystems to continue providing many of these services is in jeopardy. The Millennium Ecosystem Assessment found that people have changed ecosystems more rapidly and exten-sively over the past 50 years than in any comparable period of time in human history. For example:
• More land was converted to cropland between 1950 and 1980 than in the 150 years spanning 1700 to 1850. With a quarter of the Earth’s terrestrial surface now used for crops or confined livestock, further increases in agricultural output will likely have to come from more intensive management of existing cultivated areas.
• More than half of the synthetic nitrogen fertilizer ever used has been applied over the past two decades, con-tributing to an increase in the number of waterways at risk of becoming “dead zones” for commercial fisheries.
• Water withdrawals from rivers and lakes doubled since 1960, with long-term implications for the availability and flow of freshwater in some regions.
• Twenty percent of the world’s coral reefs and nearly a quarter of its mangrove forests have been lost since about 1980, along with their capacity to buffer coastlines from storms.
• Wild marine fish harvests peaked in the 1980s and have since remained static, with implications for all those who rely on maritime resources.7
These changes have led to the deterioration in the quan-tity and/or quality of many ecosystem services. The Assess-ment found that 60 percent—15 out of 24—of the ecosys-tem services evaluated were degraded over the past 50 years (Table 3). Five services were rated “mixed,” increasing in supply or quality in some regions of the world but decreasing in others. Three provisioning services—crops, livestock, and aquaculture—were rated as “enhanced,” reflecting people’s focus on managing ecosystems to generate food for a growing population.8 Yet actions to increase these three provisioning services have inadvertently led to the degradation of many regulating and cultural services, most of which have no value in the marketplace until they are lost. In other words, there are often trade-offs between the services.
why business should be concerned The Millennium Ecosystem Assessment projected that the
degradation of ecosystems and the services they provide will grow significantly worse in the first half of the 21st century, particularly as the global population swells toward 9.2 billion,9 emerging economies increase per capita consumption levels, and climate change unfolds. The Assessment also warned that further ecosystem deterioration increases the risk that some services such as freshwater supply, natural hazard regulation, and wild foods may cross a threshold after which they abruptly and possibly irreversibly decline.
Is biodiversity an ecosystem service? Ecosystem services are sometimes confused with biodiversity. Biodiversity is not itself an eco system service but rather underpins the supply of ecosystem services. The value some people place on biodiversity for its own sake is captured under the cultural ecosystem service called “ethical values” (Table 2). Other ecosystem services closely associated with bio diversity include food, genetic resources, timber, biomass fuel, recreation, and ecotourism.
Are minerals and fossil fuels ecosystem services? minerals and fossil fuels—coal, oil, and natural gas—are examples of natural resources that are not ecosystem services. The quantity and quality of minerals and fossil fuels are not dependent upon the living component of existing ecosystems and therefore are not benefits derived from ecosystems. Although fossil fuels and some minerals come from organic material that was alive millions of years ago, this timeframe is not relevant for business or policy decisions.
If fossil fuels are not an ecosystem service, then why is freshwater considered one? unlike fossil fuels, freshwater is a resource the quantity and quality of which is often dependent upon living components of ecosystems. For instance, forests affect the quantity and quality of freshwater in a region by soaking up water through tree roots, releasing water vapor through leaves, and preventing siltation of rivers.
what is the difference between climate change, global climate regulation services, and local climate regulation services? Climate change refers to any significant alteration in the Earth’s temperature, precipitation, or other climatic factors lasting for an extended period of time. Although climate change may result from natural factors, the term is commonly used to refer to alterations resulting from human activities that increase atmospheric greenhouse gas concentrations such as the burning of fossil fuels or deforestation.
Global climate regulation is the influence an ecosystem has on global climate primarily by altering the concentration of greenhouse gases in the atmosphere. For example, trees absorb carbon dioxide when they grow and release it if they are burned.
Local climate regulation is the influence an ecosystem has on local temperature, precipitation, or other climatic factors through effects such as providing shade, trapping or releasing moisture, and absorbing or reflecting sunlight.
Box 4 Frequently Asked Questions about ecosystem services

background 7
These trends matter to companies because business and ecosystems are inter-related. Businesses impact ecosystems through consumption, pollution, land conversion, and other activities. At the same time, businesses depend on ecosys-tems. The beverage industry, for example, depends on the supply of freshwater. Agribusiness relies on nature’s pollina-tion, pest control, and erosion control services. Insurance companies benefit from the coastal protection provided by coral reefs, while the tourism industry benefits from this ecosystem’s recreational value. Since many of these benefits are received for free, business often takes them for granted until the service becomes stressed or disappears.
Because of these impacts and dependencies, the degrada-tion of ecosystems can present a number of business risks as well as new opportunities. Types of risks and opportunities include:
•Operational – Risks such as higher costs for freshwater due to scar-city, lower output for hydroelectric facilities due to siltation, or disruptions to coastal businesses due to flooding – Opportunities such as increasing water-use efficiency or building an on-site wetland to circumvent the need for new water treatment infrastructure
•Regulatory and legal – Risks such as new fines, new user fees, government regulations, or lawsuits by local communities that lose ecosystem services due to corporate activities – Opportunities such as engaging governments to develop policies and incentives to protect or restore ecosystems that provide services a company needs
•Reputational – Risks such as retail companies being targeted by nongovernmental organization campaigns for pur-chasing wood or paper from sensitive forests or banks facing similar protests due to investments that degrade pristine ecosystems – Opportunities such as implementing and communi-cating sustainable purchasing, operating, or investment practices in order to differentiate corporate brands
•Market and product – Risks such as customers switching to other suppliers that offer products with lower ecosystem impacts or governments implementing new sustainable procure-ment policies – Opportunities such as launching new products and services that reduce customer impacts on ecosystems, participating in emerging markets for carbon seques-tration and watershed protection, capturing new revenue streams from company-owned natural assets, and offering eco-labeled wood, seafood, produce, and other products
•Financing – Risks such as banks implementing more rigorous lending requirements for corporate loans – Opportunities such as banks offering more favorable loan terms or investors taking positions in companies supplying products and services that improve resource-use efficiency or restore degraded ecosystems.
Degraded Mixed Enhanced
provisioning Capture fisheries
wild foods
Biomass fuel
Freshwater
genetic resources
Biochemicals, natural medicines, and pharmaceuticals
Timber and other wood fiber
Other fibers (e.g., cotton, hemp, silk)
Crops
Livestock
Aquaculture
regulating Air quality regulation
Regional and local climate regulation
Erosion regulation
water purification and waste treatment
Pest regulation
Pollination
Natural hazard regulation
water regulation
Disease regulation
global climate regulation (carbon sequestration)
cultural Ethical values (spiritual, religious)
Aesthetic values
Recreation and ecotourism
Table 3 trends in the world’s ecosystem services over the past 50 years
Source: Adapted from the Millennium Ecosystem Assessment. 2005. Ecosystems and Human Well-being Synthesis. Washington, DC: Island Press.

The CorporaTe eCosysTem serviCes review8
LINKING ECOSYSTEM SERVICES AND BUSINESS GOALS: THE ESR
Many businesses, unfortunately, fail to make the connec-tion between the health of ecosystems and corporate perfor-mance. Companies often are not fully aware of the extent of their dependence and impact on ecosystems and the possible ramifications.
Likewise, environmental management systems and envi-ronmental due diligence tools are often not fully attuned to the risks and opportunities arising from the degradation
of ecosystems and the services they provide. For instance, many tools are more suited to handle “traditional” issues of pollution and resource consumption. Most focus on environ-mental impact, not dependence. Furthermore, they typically focus on risks, not business opportunities. Consequently, companies may be caught unprepared or miss new sources of revenue associated with ecosystem change.
The ESR is designed to meet this business need. It is a methodology that helps managers identify the connections between a company’s impact or dependence on ecosystem services and potential business risks or opportunities. In this manner, it can inform and strengthen business strategy.
which sectorsThe ESR can be useful to companies from a variety of
sectors. It is relevant to businesses in industries that directly interact with ecosystems—such as agriculture, beverages, wa-ter services, forestry, electricity, oil, gas, mining, and tourism. It is also relevant to sectors such as general retail, healthcare, consulting, financial services, manufacturing, and others to the degree that their suppliers or customers interact directly with ecosystems (Box 5). General retailers, for example, may face reputational or market risks if some of their suppliers are responsible for degrading ecosystems and the services they provide. Financial services firms may face similar risks due to their investments.
Business benefitsRoad-test experience indicates that the ESR can provide a
number of business benefits such as: • Identifying new business risks and opportunities arising
from a company’s dependence and impact on ecosystems and the services they provide. Because the framework of ecosystem services is a new approach for assessing the inter-relationship between business and the environment, the ESR can uncover sources of risk and opportunity that traditional strategy development processes miss.
• Framing and giving added urgency to risks or opportuni-ties previously identified by management. The ESR can yield new information that raises the profile of issues the company may have considered in the past but that are now worthy of greater attention.
• Anticipating new markets and influencing government policies that will emerge in response to ecosystem degra-dation. The ESR can help managers identify opportuni-ties to participate in emerging ecosystem service-related markets such as payments for carbon sequestration, mitigation banking, and eco-labeling systems. It also can help managers prepare for new government regula-tions and participate in the development of new public policies.
• Strengthening existing approaches to environmental management. The ESR can complement existing environmental management systems and due diligence tools in a number of ways. First, the ESR fills gaps by evaluating a suite of environmental and business issues that tradi-tional processes and tools do not address (Box 6). Second, the ESR—or elements of it—can be directly integrated into a company’s existing environmental due diligence tools. Third, managers can use the ESR to screen or prioritize which environmental issues to evaluate with existing tools.
• Improving stakeholder relationships. Many natural resource conflicts that companies face relate to the fact that stakeholders—communities, indigenous people, other industry sectors, nongovernmental organiza-tions—value different services coming from the same ecosystem (Box 7). The ESR can improve a company’s understanding of these issues and identify options for better managing trade-offs.
• Demonstrating leadership in corporate sustainability by proactively addressing the degradation of ecosystem services. Several observers have identified this issue as the next big “global environmental problem” that may garner political attention and impact business.10 This issue is where climate change was 10 years ago and similarly may grow to become a preeminent concern.
“The ESR helped us to better understand how a number of emerging environmental
changes are likely to affect our business and how our company might best position
itself to respond to these changes.”—Steve Hunt, Senior Vice President, Asia-Pacific,
Eka Chemicals, a division of Akzo Nobel

BACkgROuND 9
FeaturesThe ESR has several features to make it user-friendly:• It offers a structured methodology to help companies
understand their dependence and impact on ecosystems and the resulting business risks and opportunities in a coherent, systematic manner.
• It leverages existing, relevant data that companies may have on hand, although additional research and input are likely required as well.
• It has a simple design allowing managers to tailor it to meet their own needs and existing processes.
• It provides supporting tools and information to help managers throughout the review, including: – A complete list of ecosystem services, definitions, and examples; – A questionnaire and spreadsheet for assessing corporate dependence and impact on ecosystem services; – A framework and set of questions to guide analysis of ecosystem service trends; – An extensive list and case examples of business risks and opportunities that might arise from trends in ecosystem services; – A framework to guide the development of strategies for addressing these risks and opportunities; and – Suggested data sources and case studies throughout.
Ph
oto
: s
tu
dio
to
ivo
st
ee
n
Akzo Nobel’s Eka Chemicals plant at the Veracel pulp mill in Brazil.
The paper and pulp industry both impacts and depends upon forests. This inter-relationship is especially prevalent in Indonesia and China, an emerging epicenter of global paper production. In these nations, rapid deforestation—and the associated loss of ecosystem services—is attracting increasing international attention. This presents significant operational, regulatory, and reputational risks to the industry.
Eka Chemicals—a division of the global coatings and chemicals manufacturer Akzo Nobel—is a leading supplier of cellulose processing agents to the paper and pulp industry. Eka recognized that forest ecosystem-related risks to its customers could translate into risks, as well as new business opportunities, for itself. But what are these risks and opportunities, and what options does Eka have to manage them?
To answer these questions, Akzo Nobel conducted an Ecosystem Services Review. Through a structured process, the ESR uncovered a set of risks Eka’s major China- and Indonesia-based customers would likely face due to ecosystem degradation. The ESR helped Eka translate its customers’ risks into a portfolio of risks and opportunities for itself. It also helped identify new strategies that the company could pursue to manage these challenges and opportunities.
Leveraging and augmenting analyses Eka had on hand, the ESR also was able to raise the profile of a number of options that managers had previously discussed but which now—in light of the ESR findings—have become more timely, relevant, and worthy of a business response.
Box 5 Akzo nobel conducts an esr
many companies already have environmental management systems and use due diligence tools such as environmental impact assessments, environmental and social impact assessments, and lifecycle assessments. The ESR can complement and strengthen these approaches by:
lEvaluating corporate activities with regard to the emerging issue of ecosystem services rather than more standard issues such as corporate emissions and effluents.
lAssessing all major ecosystem services.
lAssessing a company’s impact and dependence on ecosystems, not just its impact.
lEvaluating a company vis-à-vis the environment and what people value in ecosystems.
lInforming corporate strategy with information about business risks and opportunities.
Box 6 how the esr can complement other environmental management Approaches

The CorporaTe eCosysTem serviCes review10
• It directs managers to a number of issue-specific tools and resources if more detailed analysis is required (see Chapter III).
• It has a website (www.wri.org/ecosystems/esr) where managers can download supporting tools and data resources.
what the esr is notTo set appropriate expectations and to maximize the
value of conducting an ESR, it is important to note what the methodology is not:
• It does not identify or address every environmental issue. For instance, it does not provide an exhaustive inventory or quantification of a company’s total environmental footprint, greenhouse gas emissions, water effluents, or toxic releases.11 Nor does it track a company’s mineral or energy consumption. Rather, the ESR addresses a subset of environmental issues, namely, those arising from a company’s dependence and impact on ecosystem services.
• It is not strictly quantitative. Quantitative information about a company’s dependence and impact on ecosystem services or about trends in ecosystem services can be very useful when conducting a corporate ESR. However, quantitative information for some services is often sparse or nonexistent. Nevertheless, this shortcoming does not preclude a successful review. The road tests proved that qualitative analyses can be sufficient input for identify-ing many potential business risks and opportunities.
• It is not dependent upon economic valuation of ecosystem services. The ESR does not require managers to estimate the economic value of each ecosystem service. As this publication will explain, risks and opportunities arising from a company’s dependence and impact on ecosystems can be identified through other approaches. Likewise, many strategies for addressing these risks and opportu-nities—such as making internal operational changes, launching new products, working with governments to develop new policies—do not require economic valua-tion of ecosystem services. Nevertheless, some compa-nies may find that conducting an economic valuation of selected ecosystem services may be a valuable input to strategy development—as was the case for Allegheny Power. WBCSD’s Guide to Corporate Ecosystem Valuation is a useful resource on when and how to incorporate economic valuation into the ESR process.12
• It does not require a long, multiyear analysis. The time required to conduct an ESR will vary among companies and is a function of the scope chosen, the availability of data, and the amount of staff involved in the review.
Prior to the mid-1990s, BC Hydro, a government-owned hydroelectric utility in British Columbia, found itself at odds with its regulators and others who relied on the waterways of British Columbia for fishing, recreation, spiritual and cultural values, and as a source of fresh-water. In response to growing tensions among users, BC Hydro initiated discussions to seek a less adversarial way to reach resolution on the competing interests for water use. The province of British Columbia formally initiated a water use planning program to define suitable operating parameters that would balance environmental, social, and economic values.
The water use planning process, which was voluntary in nature, took a participatory approach and included users of the various eco-system services in the watershed, including First Nations, environmental organizations, Fisheries and Oceans Canada, the government of British Columbia, and communities surrounding the hydroelectric facilities. with external assistance, BC Hydro developed a series of model-generated scenarios that illustrated how each user of the ecosystem would be affected as the company altered two operating variables: reservoir level and river flow rate. One scenario might yield more power generation but fewer recreational opportunities and less fish. Another might yield the opposite.
Participants reviewed each scenario, discussed the trade-offs among ecosystem services, and used a value-based trade-off system to agree on a preferred option. That option became the operating plan for the dam. In addition, participants recommended monitoring pro-grams to evaluate whether or not the anticipated nonpower benefits were being realized, as well as studies to collect data for issues that were identified but could not be resolved during the process. Participants were also asked to determine whether or not similar benefits to an operational change could be achieved at a lower cost by constructing a facility known as a “physical works.” Examples included build-ing a new or upgraded boat ramp for better access to a reservoir, providing spawning or rearing habitat for fish, and installing erosion control features.
Integrating considerations about ecosystem services into the planning process proved to be a success for BC Hydro. Even though the number of operating constraints has increased significantly, water use planning has yielded a number of benefits, including operational clarity and certainty, regulatory certainty, fewer lawsuits, and improved stakeholder relationships.
Box 7 Balancing competing demands for ecosystem services: Bc hydro
“The ESR helped us identify new business opportunities for a growing market.”
– Madalena albuquerque, business strategy and Planning, syngenta

11
OVERVIEWThe ESR methodology consists of five steps (Figure 1):
1. select the scope. Choose the “scope” or boundary within which to conduct the ESR. Candidates include a business unit, product, market, corporate landhold-ings, infrastructure project, major supplier, or major customer segment, among others.
2. Identify priority ecosystem services. Systematically evaluate the company’s dependence and impact on more than 20 ecosystem services. Determine which of these are “priority” services—the ones most relevant to corporate performance.
3. Analyze trends in priority services. Research and evaluate the condition and trends in the priority ecosystem services, as well as the drivers of these trends.
4. Identify business risks and opportunities. Identify and evaluate the business risks and opportunities that might arise due to trends in the priority ecosystem services.
5. develop strategies. Outline strategies for managing the risks and opportunities.
As Figure 1 illustrates, the ESR bridges ecosystem and business considerations by starting with an evaluation of a company’s interaction with ecosystems and finishing with an assessment of implications for business performance.
who conducts an esr?Table 4 outlines who should be
involved in conducting an ESR during each step. Note that the Ecosystem Services Review generates most value when managers responsible for corporate strategy, business operations, and environmental performance collaborate. Managers can use or tailor the pre-sentation available at www.wri.org/ecosystems/esr to make the case to colleagues about the value of conducting an ESR and educate them about the methodology. Companies can also opt to hire consultants to apply the ESR.
where to get information?Managers can tap into several sources of data and input
when conducting an ESR (Table 5). Note that relying solely on internal business perspectives poses the risk that the ESR will merely perpetuate possible corporate misperceptions or knowledge gaps. Complementing internal information sources with those external to the company is highly recom-mended.
The following sections describe the five steps of the ESR in detail, introduce an analytical framework for each step, provide case examples, and offer some helpful hints.
C H A P T E R
methodology
Figure 1 steps in a corporate ecosystem services review
1. Select the scope2. Identify priority
ecosystem services3. Analyze trends in
priority services
4. Identify business risks and opportunities
5. Develop strategies
mETHODOLOgy

The CorporaTe eCosysTem serviCes review12
Involved in step:
Who 1 2 3 4 5 Comment
Executive managers P P Executive or senior managers responsible for corporate strategy and environmental performance need to be involved in selecting the scope and in formulating and approving the strategies emerging from the ESR. Their involvement encourages implementation of the ESR results.
manager(s) from selected scope
P P P P One or more managers responsible from the selected scope—business unit, product line, regional market, project, etc.—should be involved in nearly every step since they will be responsible for implementing the strategies developed by the ESR.
Analysts P P P P In-house analysts conduct most of the research, interviews, data preparation, and other activities involved in an ESR. They do not need to be experts in ecosystems.
Consultants (optional) P P P P management consultants can conduct an ESR on behalf of a company. Alternative-ly, consultants can be involved in selected steps, providing information, perspec-tives, and specialized tools/models for conducting ESR-related analyses.
Table 4 who conducts an esr?
Table 5 sources of Input and Information
Relevant for step:
Source 1 2 3 4 5 Comment
In-house business managers and analysts
P P P P managers and analysts may have perspectives relevant to every step of the ESR. One efficient way to gather their input is to host brainstorming sessions in which they jointly develop preliminary perspectives for the relevant ESR step. These “rapid assessment” sessions can help prioritize subsequent analyses, saving time.
Existing and new in-house analyses
P P P Existing in-house analyses of the company’s impact on ecosystems, assessments of selected ecosystem services such as water, and profiles of selected ecosystem ser-vice trends can kick-start an ESR, even if these analyses were originally conducted for other purposes. Some new analyses, nevertheless, are often required to fill information gaps.
Local stakeholders P Engaging local stakeholders is highly recommended. Local stakeholders may include representatives from nearby communities, other companies, indigenous tribes, nongovernmental organizations, outdoor recreation clubs, etc. Interviewing or hosting meetings with stakeholders can help identify which ecosystem services they value. This input can help create a shortlist of services about which the com-pany should carefully consider its impacts. A company exposes itself to potential risk when it impacts an ecosystem service that is valued by others.
Experts from universities and research institutions
P Academics renowned for their knowledge of particular ecosystems, ecosystem services, or drivers of ecosystem change are often willing to share their expertise with businesses.
millennium Ecosystem Assess-ment publications and experts
P millennium Ecosystem Assessment experts and reports offer detailed information about the condition and trends in ecosystems and ecosystem services, as well as analyses of the drivers of ecosystem change.
Nongovernmental organiza-tions
P P P Nongovernmental organizations typically have in-house experts and access to relevant research.
Industry associations P P P Industry associations may have in-house experts and access to topical research.
Published research P P P Relevant—preferably peer-reviewed—papers and studies can be accessed via the internet or libraries.
Other resources and tools P P P A number of issue-specific tools and resources can help corporate managers con-duct more in-depth analyses. See Chapter III for more information.

Helpful Hints Step 1
• Be prepared to refine the scope as the ESR proceeds. For instance, Rio Tinto decided to narrow the boundaries of its review after finding the original scope too broad for manageable analysis.
• Consider spreading out the timing of conducting an ESR to coincide with data availability or existing strategy development or environmental assessment processes.
• Insights gained from conducting the ESR for one division of the company can be applicable to another to the degree that these divisions are similar. For example, the results of the ESR for one mine may be quite applicable to another nearby mine. However, they may be less applicable for a site located in another country due to differences in surrounding ecosystems and trends affecting ecosystems.
STEP 1: SELECT THE SCOPEThe first step is to select the “scope” of the ESR. The pur-
pose of this step is to define clear boundaries within which to conduct analysis in order to keep the process manageable and yield more actionable results.
For a business with just one major product, service, or mar-ket, the ESR scope could be the entire company. However, for a business with multiple products, services, or markets, a more manageable scope would be a particular portion of the com-pany. Conducting a single ESR for the entirety of a diversified company would be resource-intensive and analytically complex because the company’s business units likely differ—sometimes significantly—in terms of how they interact with ecosystems. If such a diversified company wants to cover its entire business portfolio, it can do so by conducting a series of ESRs.
three questions to askThree questions can help managers select an ESR scope
(Figure 2):
1. which stage of the value chain? An ESR could focus on a company’s own operations, providing insight into the direct implications that trends in ecosystem services would pose for the company. One alternative is to look “upstream” in the value chain. This approach would shed light on the implications of ecosystem service trends for key suppliers and the business risks and opportunities that these, in turn, may pose to the company conducting the ESR. Another alternative is to look “downstream.” This approach would provide insight into the implica-tions of ecosystem service trends for the company’s major customers and the business risks and opportuni-ties that these, in turn, may pose to the company. One helpful hint is to select a stage in the value chain where interactions with ecosystems are prominent since these interactions are the most likely sources of ecosystem service-related risk or opportunity. The Helpful Hints give other suggestions for selecting the scope.
2. who and where specifically? If conducting the ESR on the company itself, then select a certain aspect of the business. Options include—but are not limited to—a particular business unit, product line, facility, project (such as a mine, pipeline, other infrastructure development), or natural asset owned by the company (such as forestland or other landholdings). If the ESR
is focused on key suppliers, then choose a specific sup-plier or category of suppliers and perhaps further narrow the scope by selecting a particular geographic market in which these suppliers operate. If the ESR is focused on major customers, then choose a particular customer or customer segment and perhaps further refine the scope by selecting a particular geographic market in which these customers are located.
3. Is the candidate scope strategic, timely, and supported? Particularly for the first ESR, the scope should be of high strategic importance to the company. Examples include the company’s fastest growing market, an upcoming major product line, or the business unit with the greatest market share. The scope should offer a window of oppor-tunity for the ESR to influence upcoming important business decisions. In addition, there should be sufficient internal management support for conducting an ESR within the selected scope. Be sure to secure relevant senior management buy-in and have staff (or consultants) available to conduct the interviews and analysis required in subsequent steps.
Box 8 profiles the scopes selected by the road-test companies. For the sake of simplicity, we will use the term “company” throughout the rest of the Guidelines to refer to the scope selected for the ESR.
Figure 2 considerations when selecting the scope
1. which stage of the value chain?
2. who and where specifically?
3. Is it strategic, timely, and supported?
Suppliers Company Customers
•which suppliers?
• In which geographic market(s)?
•which customers?
• In which geographic market(s)?
• what aspect of the company?
– Business unit
– Product line
– Facility
– Project
– Landholdings
mETHODOLOgy 13

The CorporaTe eCosysTem serviCes review14
STEP 2: IDENTIFY PRIORITY ECOSYSTEM SERVICES
The second step is to evaluate in a structured yet rapid manner the company’s dependence and impact on more than 20 ecosystem services. This evaluation will help identify which of these are “priority” services—the ones most likely to be a source of risk or opportunity for the company. These priority ecosystem services are the focus of analysis in subse-quent steps; the other services are screened out.
To identify its priority services, a company needs to understand its level of dependence and impact on each ecosystem service. This is because the ecosystem services that are sources of business risk or opportunity typically are those that the company highly depends upon and/or highly impacts. For instance, if a company highly depends upon an ecosystem service and that service becomes scarce or degrades, then the company may face business risk in the form of higher input costs or disruption to its operations. If a company negatively impacts an ecosystem service by depleting or degrading it, then the company’s actions may pose regulatory or reputational business risks. Conversely,
if a company positively impacts an ecosystem service by supplying or enhancing it, then the company’s actions may give rise to possible new business opportunities or reputational benefits.
evaluating dependenceAnswering two questions for each ecosystem service listed
in Table 2 (see pages 4 and 5) can help managers evaluate whether or not their company depends on an ecosystem service and, if so, by how much:
1. does this ecosystem service serve as an input or does it enable/enhance conditions for successful company performance? A company depends on an ecosystem service if that service functions as an input or if it enables, enhances, or influences environmental condi-tions required for successful corporate performance. For example, timber is an input for wood product manu-facturers. Freshwater is an input for beverage compa-nies and many others. Animal pollinators assist in the reproduction of 90 percent of flowering plants and one third of human food crops.13 By absorbing excess water during floods, marshes enable conditions critical for the success of businesses located in floodplains—and their insurers. The recreational services provided by coral reefs and estuaries enhance the economic performance of coastal tourism businesses.
2. If “yes” to question 1, then does this ecosystem service have cost-effective substitutes? The degree to which a company depends on an ecosystem service is a function of whether or not there is a cost-effective substitute for that service. If there is no such substitute, then the company is considered to be highly dependent upon that service. Beverage manufacturers and hydro-electric facilities, for instance, are highly dependent upon freshwater because there is no substitute for this ecosystem service. Substitutes may exist, however, for some services. For a business located on a coast, a sea wall might provide the storm surge protection that a coral reef would have provided. Concrete or steel can fill in for wood in construction. Nevertheless, whether or not these are cost-effective substitutes will vary by company.
Answering “yes” to question 1 and “no” to question 2 indicates that the company’s dependence upon the ecosystem service is high. Answering “yes” to question 1 and “yes” to question 2 indicates that the company’s dependence upon the ecosystem service is medium. Answering “no” to ques-tion 1 indicates that the company has low or no dependence upon the ecosystem service (Figure 3).
Akzo nobel chose to apply the ESR “downstream,” assessing the implications of ecosystem degradation for the major China- and Indonesia-based customers of its pulp and paper chemicals business unit, Eka Chemicals. The ESR thereby contributed to corporate decisions regarding whether or not to enter into busi-ness with certain prospective customers.
Bc hydro selected its Campbell River hydropower dam on Vancouver Island as its scope. Although one of the company’s smaller generation facilities, Campbell River is of strategic importance given its proximity to population centers and its fisheries resource. In addition, the facility had an abundance of environmental and social data already on hand.
mondi, with substantial forest holdings in South Africa and Russia, selected three of its South African pine and eucalypt plantation areas—Shanduka, SiyaQhubeka, and Tygerskloof—for its scope. These areas were chosen for the range of physical, climatic, and other environmental conditions under which the trees are grown.
rio tinto road tested the ESR for a prospective copper mine in Peru that was in the prefeasibility stage of project development. The ESR was timed to inform the major technical decisions about mine design that occur during this stage.
syngenta focused its ESR on one of its customer segments, farmers in southern India. By looking “downstream,” the ESR helped the company identify risks its customers have been fac-ing due to ecosystem degradation and, in turn, identify oppor-tunities for Syngenta in the form of new products and services that would address or mitigate these risks. Syngenta selected India because the country is a significant growth market for agriculture. given India’s geographic, demographic, agricultural, and climatic diversity, the company focused on the southern states of Andhra Pradesh, karnataka, kerala, maharashtra, and Tamil Nadu to keep the analysis focused.
Box 8 examples from the road tests (step 1)

evaluating impactAnswering the following three questions for each eco-
system service listed in Table 2 (see pages 4 and 5) can help managers evaluate whether or not their company impacts an ecosystem service and, if so, by how much:
3. does the company affect the quantity or quality of this ecosystem service? A company impacts an ecosystem service if it affects the quantity or quality of that service. For example, a forest plantation affects the quantity of freshwater in its watershed. A business that fills in wetlands in order to construct a new facility may affect the quantity of water runoff and aquifer recharge. A firm in the extractive industries may affect the quality of a location’s recreation services by scarring the land-scape or otherwise disturbing an ecosystem valued by hikers, campers, and others.
Be sure to consider the company’s indirect impacts or secondary effects, as well. Roads or pipelines installed by an oil and gas company, for instance, increase access by third parties to previously inaccessible areas. The resulting influx of people may affect the quantity or quality of several ecosystem services in the region. For example, in-migration might lead to deforestation, impacting freshwater, wild foods, carbon sequestration, erosion regulation, and the cultural services associated with a pristine ecosystem.
4. If “yes” to question 3, then is the company’s impact positive or negative? The impact is positive if the company increases the quantity or quality of the eco-system service. For example, a forest products company increases the quantity of timber and wood fiber because its forests actually supply these services. Under the appropriate management regime, the company’s forest could increase the quality of wild game hunting and recreational services as well.
The impact is negative if the company decreases the quantity or quality of the ecosystem service. For exam-ple, agribusiness can reduce the quantity of freshwater in a watershed. By removing mangroves, a coastal hotel or shrimp farm can decrease the quality of shoreline protection.
In the context of the ESR, the terms “positive” and “negative” are not intended to be judgmental but merely reflect whether a company increases or decreases the quantity or quality of an ecosystem service.
5. If “yes” to question 3, then does the company’s im-pact limit or enhance the ability of others to benefit from this ecosystem service? The degree to which a company impacts an ecosystem service in a manner that might pose a business risk or opportunity for itself is a function of whether or not the impact limits or en-hances the ability of others to benefit from the service. Beneficiaries could include indigenous people, farmers, local communities, other businesses, or, in the case of cultural services, people living on the other side of the world who value endangered species.
Answering “yes” to any of the following considerations indicates that managers should answer “yes” to question 5:
• Is the company’s impact on this ecosystem service a large share of the total local or regional impact? A company with a large contribution relative to others is more likely to be responsible—or perceived to be respon-sible—for limiting (or enhancing) the ability of others to benefit from the service. Illustrative examples include a company that consumes (or replenishes) 15 percent of the freshwater in a watershed, one that con-sumes (or supplies) 20 percent of the nation’s wood fiber, or one that is solely responsible for clearing (or restoring) a native grassland valued for its biodiversity and associated cultural services. There are no hard and fast rules for defining what constitutes a “large share.” Managers will need to use their own or expert judgment regarding the size of impact relative to the appropriate spatial scale for the ecosystem service.
• Is this ecosystem service already in short supply relative to demand? A company’s impact is more likely to limit (or enhance) the ability of others to benefit from the service if that service is already supply-constrained.
• Could the company’s impact push this ecosystem service across a physical threshold that leads to scarcity of the service or triggers a regulatory response? A company’s impact is more likely to limit (or enhance) the ability of others to benefit from the service if that service is nearing a physical or regulatory threshold. In a region where available freshwater is on the verge of being tapped out, for instance, a new resort or manufac-turing facility that consumes water—albeit a small amount—may push that service across a threshold. Water shortages might occur as demand outstrips sup-ply or as the government imposes water restrictions.
mETHODOLOgy 15
1. Does this ecosystem service serve as an input or does it enable/enhance conditions for successful company performance?
yes
2. Does this ecosystem service have cost-effective substitutes?
yes
mediumdependence
Lowdependence
Highdependence
No
No
Figure 3 Questions to Ask per ecosystem service when evaluating dependence

The CorporaTe eCosysTem serviCes review16
Note that a company’s impact on ecosystem services and the affected beneficiaries may exist on a variety of spatial and temporal scales. See Box 9 for suggestions on selecting the appropriate scale.
Answering “yes” to question 3 and “yes” to question 5 indicates that the company’s impact on the ecosystem service is high. Answering “yes” to question 3 and “no” to question 5 indicates that the company’s impact on the ecosystem service is medium. Answering “no” to question 3 indicates that the company’s impact on the ecosystem service is low or negli-gible (Figure 4).
The dependence and impact assessment can be qualitative and quick. Although answers to the five questions may be straightforward for some ecosystem services, this structured approach increases the likelihood of uncovering previously overlooked dependencies and impacts. The Dependence and Impact Assessment Tool that accompanies these Guidelines can help managers conduct the evaluation in a structured manner (Box 10).
prioritizing ecosystem servicesAfter completing the dependence and impact assessment,
determine which are the priority ecosystem services for the company—those most likely to be sources of business risk and opportunity. The results of the assessment can serve as good input for the prioritization process. Select five to seven services in order to keep the ESR analysis focused and man-ageable going forward. The following are suggested guide-lines for selecting the priority services:
• The top-tier candidates for priority ecosystem services are those deemed “high” in both categories—depen-dence and impact.
Particularly during steps 2 and 3 of an ESR, it is important to select the appropriate spatial and temporal scale for the ecosystem service being reviewed. During step 2, managers need to determine the scale against which to assess their company’s relative dependence and impact on an ecosystem service. During step 3, managers need to determine how far into the future and across what spatial area to conduct trends analyses.
Relevant spatial scales might coincide with political boundaries, such as districts or countries, or might better fit with geographic bound-aries, such as watersheds or forest areas that may be under the jurisdiction of several political entities. Relevant temporal scales may range from several years to many decades and will be company-specific.
There are no hard and fast rules for determining scale. managers will need to use their own judgment or seek the advice of experts. Sug-gested considerations include:
lRecognize that the appropriate scale may differ between ecosystem services.
lThe spatial scale should encompass at least the specific ecosystem providing the service being considered. For example, a resort evalu-ating trends in coral reef-based recreation and storm protection services should consider the coral reef located offshore of its property.
lA common spatial boundary to use is the watershed. Ecosystem services such as freshwater supply, water regulation, erosion control, water purification, and waste treatment are bound through hydrological processes within a watershed. Likewise, beneficiaries of these services are usually located within the same watershed.
lFor ecosystem services whose beneficiaries are global, a broader international perspective may be needed. Biomass fuels can be traded between countries on different continents. The ethical values people derive from the biodiversity of the Amazon rain forest are shared by many around the world. The climate regulation service provided by forests has global beneficiaries and an emerging global market.
lThe temporal period should fit the company’s strategic planning timeframe. For example, a business that sets 10-year strategies would want to understand its dependence and impact on ecosystem services and trends in priority services over at least the next 10 years. How-ever, impacts that manifest themselves over time periods longer than the business planning cycle may still present risks and opportunities in the near term if governments or nongovernmental organizations introduce policies or campaigns to ward off possible long-term problems.
lThe temporal period should encompass at least the current beneficiaries of the ecosystem service. However, for many services it will be important to also consider future beneficiaries in order to avoid possible regulatory or reputational risks.
Box 9 what is the Appropriate scale?
• The second-tier candidates are those deemed “high” in one category and “medium” in the other. The dependence and impact categories should have equal weighting; one is not more important than the other.
Lowimpact
mediumimpact
No
No
Figure 4 Questions to Ask per ecosystem service when evaluating Impact
Negative
3. Does the company affect the quantity or quality of this ecosystem service?
yes
4. Is the company’s impact positive or negative?
5. Does the company’s impact limit or enhance the ability of others to benefit from this ecosystem service?
yes
HighImpact
Positive

• The third-tier candidates are those deemed “high” in one category and “low” in the other.
• If too many services are deemed “high” in the impact category, give preference to the ones with “negative” impacts. Road-test companies found that the business implications of negative impacts often outweighed those of “positive” impacts.
• A service deemed “high” can be screened out if the company has already recently reviewed business risks and opportunities regarding this ecosystem service. For exam-ple, Mondi identified “timber and other wood fiber” as
an ecosystem service upon which it had a high, positive impact. However, Mondi did not select it as a priority because managers regularly assesses the status, trends, risks, and opportunities associated with this ecosystem service since wood fiber is the firm’s core business.
• Those deemed “low” in both categories are not priority services.
Boxes 11 and 12 show the ecosystem service prioritization results for two road-test companies.
mETHODOLOgy 17
The Dependence and impact assessment Tool is a spreadsheet that guides managers through the five dependence and impact questions for each ecosystem service and automatically develops a visual summary of the results. The spreadsheet has three sections:
lA set of instructions for using the tool.
lA dependence and impact questionnaire. The questionnaire is laid out in a matrix format: Twenty-three ecosystem services, with definitions and examples of each, are listed vertically while the five questions regarding dependence and impact are listed horizontally. Tabs are provided in the response cells to facilitate answering the questions for each service. The questionnaire also provides space for writing in comments to explain answers given to the questions, remind managers of the rationale for their answers, or highlight where significant data gaps exist.
lA summary matrix that translates the responses provided in the questionnaire into a one-page visual chart. using easy-to-understand symbols, the matrix indicates whether the company’s impact and dependence on each ecosystem service is high, medium, or low and whether the impact is positive or negative. The summary matrix can show responses whether the selected scope is some aspect of the company itself, upstream suppliers, or downstream customers.
users can add and subtract features from the tool in order to tailor it to meet their own needs and preferences. To download it, visit www.wri.org/ecosystems/esr
Box 10 the dependence and Impact Assessment tool

The CorporaTe eCosysTem serviCes review18
mondi conducted a dependence and impact assessment for each of the three plantations in its road test. The dependence and impact summary matrix below profiles the results for one of the plantations.
Based on this assessment, mondi selected six ecosystem services as priorities:
lFreshwater. Pine and eucalypt plantations significantly depend upon and impact the quantity of freshwater.
l regulation of water timing and flows. The plantation depends upon the ability of the surrounding ecosystems to help regulate the tim-ing of water flows.
lBiomass fuel. As a byproduct, the plantation generates biomass residues that can be utilized as a source of energy by the company’s mills, local villages, or other parties.
l Global climate regulation. The plantation impacts the carbon cycle since trees sequester carbon dioxide.
l recreation and ecotourism. given its proximity to the greater St. Lucia wetland Park, a world Heritage Site, the plantation—and the wetlands and grasslands it contains—have the potential to provide recreational or ecotourism benefits.
lLivestock. The plantation impacts the ecosystem service of livestock in that, by being a dedicated industrial tree farm, the site precludes surrounding villagers from using the landscape for large-scale livestock grazing. Selective controlled grazing on the wetlands and rem-nant grasslands is, however, widely practiced.
Box 11 example from the road tests: mondi (step 2)
key: High medium Low + Positive impact – Negative impact ? Don’t know
suppliers company operations customers
ecosystem service dependence Impact dependence Impact dependence Impact
provisioning
crops –
livestock –
capture fisheries
Aquaculture
wild foods +
timber and other wood fiber +
other fibers (e.g., cotton, hemp, silk)
Biomass fuel +
Freshwater –
genetic resources ?
Biochemicals, natural medicines, and pharmaceuticals +
regulating
maintenance of air quality ? ?
global climate regulation +
regional/local climate regulation +
regulation of water timing and flows –
erosion control –
water purification and waste treatment –
disease mitigation
pest mitigation
pollination
natural hazard mitigation
cultural
recreation and ecotourism +
ethical and spiritual values +

mETHODOLOgy 19
syngenta looked “downstream” and conducted a dependence and impact assessment for one of its customer segments, farmers in southern India (see the dependence and impact summary matrix below).
Based on this assessment, the ESR team selected six priority ecosystem services:
lFreshwater. Agriculture in the region highly depends upon this ecosystem service for watering crops—on rain-fed and irrigated farms—and for generating electricity to run some irrigation systems. At the same time, farmers can impact freshwater quantity (through irriga-tion) and quality (through fertilizer and agrochemical runoff).
l regulation of water timing and flows. Southern Indian farmers are dependent on the role that wetlands and other ecosystems play in managing the timing and magnitude of water runoff during the monsoon season and in recharging aquifers.
lerosion control. Farmers depend on vegetation to retain topsoil. Poor agricultural practices are having some localized negative effects, but other practices such as living fences and minimum tillage are improving erosion control.
lpest mitigation. Southern Indian farmers rely on some native organisms to help control crop pests in integrated crop management systems. But farming practices such as growing monocultures, fragmenting natural habitats, and inappropriately using agrochemicals are eroding nature’s ability to manage pests in the region.
lpollination. many crops in the region benefit from pollination by bees and other animals, although a substitute practice—pollination by human hand—is used especially for plant breeding. Although data are limited, agriculture in southern India likely has a negative impact on natural pollination due to conversion of pollinator habitat.
lNutrient cycling. Crops depend on nature’s processing of nutrients such as nitrogen and phosphorus, but synthetic substitutes exist. Poor farming practices in the region sometimes inhibit this natural process, requiring more man-made inputs to replace lost nutrients.
Box 12 example from the road tests: syngenta (step 2)
key: High medium Low + Positive impact – Negative impact ? Don’t know
suppliers company operations customers
ecosystem service dependence Impact dependence Impact dependence Impact
provisioning
crops +
livestock +
capture fisheries
Aquaculture
wild foods –
timber and other wood fiber –
other fibers (e.g., cotton, hemp, silk) +
Biomass fuel +
Freshwater –
genetic resources –
Biochemicals, natural medicines, and pharmaceuticals –
regulating
maintenance of air quality –
global climate regulation +/–
regional/local climate regulation +/–
regulation of water timing and flows +/–
erosion control +/–
water purification and waste treatment
disease mitigation
pest mitigation –
pollination –
natural hazard mitigation
cultural
recreation and ecotourism +/–
ethical values +/–
other services identified by company
nutrient cycling –

The CorporaTe eCosysTem serviCes review20
The five to seven ecosystem services selected as priorities will become the focus of analysis in subsequent steps of the ESR. The other services are screened out, at least for the time being. Additional information uncovered while conducting the trends analysis in step 3 may lead managers to revisit step 2 and add—or subtract—one or more services to the list of priorities.
The Helpful Hints offer additional suggestions for step 2, based on experiences from the road tests. Box 13 outlines the sources, inputs, and perspectives that some road-test compa-nies used during step 2.
STEP 3: ANALYZE TRENDS IN PRIORITY ECOSYSTEM SERVICES
The third step is to research and analyze the status and trends in the priority ecosystem services that were identified in step 2. The purpose of this research is to provide managers with a sufficient amount of relevant information and insights so that they can later identify business risks and opportuni-ties that may arise from these trends.
how to analyzeFor the trends analysis, conduct research to answer the
following five questions for each of the ecosystem services identified as a “priority” in step 2:
1. what are the condition and trends in the supply and demand for the ecosystem service? Identify the present and expected future supply and demand for the service. When answering this question, it is important to determine up-front which aspects of supply and demand—quantity or quality—are the most relevant to
The ecosystems surrounding a hydroelectric facility—the river, reservoir, and forests—provide a variety of ecosystem services. As part of its water use planning process, Bc hydro convened a number of stakeholders to determine which services they val-ued and how the company’s dams impacted those services. The ecosystem services that stakeholders valued became BC Hydro’s shortlist of services that warranted careful consideration. Stake-holders included:
lFisheries and Oceans Canada, the government department responsible for ensuring commercial fish species are managed sustainably and endangered species are protected
lThe government of British Columbia, which is responsible for licensing hydroelectric facilities and management plans
lFirst Nations—the indigenous people of Canada—who value salmon and other species as sources of food, income, and cultural heritage
lEnvironmental organizations, representing people who place ethical value on the biodiversity within the forests and waters surrounding dams
lLocal communities, who utilize the river system for drinking water and recreation.
rio tinto held a “rapid assessment” session to go through the questionnaire and develop a draft dependence and impact matrix. Participants included managers from the mine’s prefea-sibility team, community relations, and corporate environmental affairs, as well as a biodiversity impact assessment consultant Rio Tinto had on contract. Afterwards, the company refined the assessment, filling in the gaps and resolving differences in perspectives.
To identify the priority ecosystem services for its customers in southern India, the syngenta team gathered input from its own Indian agronomists. In addition, the team interviewed sev-eral agricultural scientists from Indian universities and represen-tatives of nongovernmental organizations specializing in food, poverty, and environmental issues in the region.
Box 13 examples of sources of Input (step 2)
Helpful Hints Step 2
lAvoid “getting stuck” in step 2. It is just a screening exercise leading to the core of the ESR. Furthermore, managers can revisit step 2 if they later uncover pertinent new information.
lEngage stakeholders to determine which ecosystem services they value. This input can help create a shortlist of services about which the company should carefully consider its impacts.
lConsider not only actual impacts but also perceived impacts when conducting the dependence and impact as-sessment. Stakeholder perceptions of a company’s impact on ecosystem services can often be just as important a source of reputational risk as actual, physical impacts. Distinguish between those that are perceived and those that are physical in the “comments” section of the Depen-dence and impact assessment Tool.
lmost road-test companies chose to exclude the “support-ing ecosystem services” (see Table 2 on pages 4 and 5) when conducting the ESR. These services are so basic and fundamental that they manifest themselves in many of the provisioning, regulating, and cultural services. “Primary production,” for example, is the foundation of timber, other fibers, crops, and biomass fuel. Considering this supporting service could lead to “double counting” or “double consideration” of services. Nevertheless, compa-nies in some sectors such as agriculture or forestry may find it valuable to explicitly consider one or more support-ing services—particularly nutrient cycling—given the direct interaction between these sectors and this service.
lConsider impacts alone, not actions to mitigate impacts. For example, when evaluating the effects of a prospective Rio Tinto mine on local biodiversity and the associated cul-tural services, the team was tempted to incorporate into the assessment possible “biodiversity offset” purchases. Offsets, however, are a possible strategy for minimizing risks caused by the mine’s impact. Risk mitigation strate-gies are considered during step 5 of the ESR.
lIf the dependence and impact assessment becomes too complex, revisit step 1 to narrow the scope or split it into more than one ESR. The road test for Rio Tinto, for example, became easier once the team split the original scope into separate dependence and impact assessments for the mine site, the road, and the prospective port.
lConsider applying additional criteria if the first attempt at prioritizing ecosystem services fails to narrow the list to seven or fewer. Additional criteria could include the probability of the company having a high impact on an ecosystem service and the number of people affected, among others.

the company. The most relevant aspect may vary between ecosystem services and companies. For instance, trends in the quantity of the ecosystem service of timber may be most relevant for a wood products manufac-turer. Trends in the quality of freshwater may be most important for a firm in the beverage industry. Similarly, when answering this question it is important to select the appropriate spatial and/or temporal scale for the ecosystem service under review (see Box 9 on page 16 for suggestions on selecting the appropriate scale).
2. what direct drivers underlie these trends? Identify the “direct drivers” of trends in the priority ecosystem service. Direct drivers are factors—natural or man-made—that cause changes in an ecosystem and its ability to supply ecosystem services. Common direct drivers include:• Changes in land use and land cover. Examples include
deforestation, conversion of natural grasslands to farms, and drainage of wetlands.
• Overconsumption. For instance, ecosystem services such as capture fisheries, wild foods, and freshwater can be exploited beyond their capacity to replenish themselves.
• Climate change. Climate change is expected to alter the quantity, distribution, and timing of many ecosystem services, including crops, capture fisheries, freshwater, and natural hazard regulation.14
• Discharge of pollution and overuse of fertilizers. Ex-amples include toxic chemical releases and nitrogen and phosphorus runoff. The latter can lead to excessive nutrient enrichment of coastal waters and the emergence of “dead zones.”15
• Introduction of invasive, nonnative species. By crowd-ing out native species or preying on species lack-ing natural defenses, invasives such as the emerald ash borer (Agrilus planipennis Fairmaire) in North America, molasses grass (Melinis minutiflora) in South America, western corn rootworm (Diabrotica virgifera virgifera) in Europe, and giant African snails (Achatina fulica) in Asia can alter the structure and dynamics of an ecosystem and thereby the quality or quantity of ecosystem services it provides.16
Assess these direct drivers in terms of their relative contribution to the trends, size of impact, location, and timing. In addition, be aware that these direct drivers can act not only in isolation but also interact at mul-tiple geographic scales and time frames. For instance, climate change can lead to crop failures in one region, which can encourage overexploitation of ecosystems elsewhere. Invasive species can change land cover over time as they alter the species dynamics of ecosystems.
3. what is the company’s contribution to these drivers? Identify how, where, and to what degree the company is contributing or could contribute to the direct drivers of ecosystem change. If a company’s strategy, operations, or activities impact any of these drivers, then it will likely impact an ecosystem and the services provided.
Developing an understanding of the company’s role in relation to these drivers and trends is helpful prepara-tion for identifying possible business risks and opportu-nities in step 4 of the ESR.
4. what is the contribution of others to these drivers? Identify who else is contributing to these drivers of ecosystem change. Contributors might include local communities, farmers, other companies, or other indus-try sectors. Determine how, where, and to what degree these contributors are affecting the drivers of ecosys-tem change and how their impact might evolve in the future.
5. what indirect drivers underlie these trends? Identify and evaluate the drivers that are indirectly affecting these trends in the priority ecosystem service. Indirect drivers are factors that contribute to changes in the direct drivers, the company, or other users of ecosystem services. Indirect drivers could be:• Governmental (policies, regulations, subsidies, and
incentives)• Demographic (population growth and distribution)• Economic (globalization and markets)• Technological (new technologies)• Cultural and religious (people’s choices about what
and how much to consume).
These five questions comprise a simple framework that can give managers a comprehensive understanding of the important trends per priority ecosystem service (Figure 5).
gathering inputConducting interviews, reviewing existing research, or
commissioning original analysis—where significant data gaps exist—are recommended approaches for answering these five questions. Managers can tap into a variety of information sources (see Table 5 on page 12). Box 14 gives examples of data sources used by some road-test companies.
mETHODOLOgy 21
ric
Ar
do
LA
Bo
, r
io t
into
. 2
00
6.
Rio Tinto’s camp at its prospective copper mine in La Granja, Peru.

The CorporaTe eCosysTem serviCes review22
Figure 5 ecosystem service trends and drivers Framework
Akzo nobel reviewed existing research published by academics and nongovernmental organizations. The company also relied on reports prepared by consultants addressing issues such as the economic and environmental trends in the Chinese wood fiber industry and a study on the state of forests and plantations for an Indonesian mill project.
Bc hydro utilized research previously conducted or commissioned by the company regarding trends affecting the watersheds where its dams are located. In addition, the ESR team interviewed a number of leading academics from major Canadian universities and millennium Ecosystem Assessment scientists who are renowned for their knowledge of the interplay between hydroelectric facilities and ecosystems.
mondi leveraged existing in-house analyses and external research reports. To complement this input, managers interviewed two to four experts for each of the six ecosystem services mondi identified as priorities. Interviewees came from a variety of backgrounds, including:
lForestry consulting firms with an existing working relationship with the company
lRegional universities such as the university of kwa Zulu Natal
lRegional research institutes such as the Council for Scientific and Industrial Research, the Plant Protection Research Institute, and the Centre for Environment, Agriculture, and Development
lmillennium Ecosystem Assessment scientists with expertise in South African ecosystems
lNongovernmental organizations.
syngenta complemented its in-house knowledge by consulting a range of research reports and interviewing relevant experts for each priority service, including:
lAgricultural professionals from the India Agricultural Research Center and the International Rice Research Institute
lProfessors from the university of maryland, kerala Centre for Development Studies, and the Indian Institute of Technology in mumbai
lExperts from research institutions, including the International Food Policy Research Institute and the Consultative group on Interna-tional Agricultural Research
lAgriculture experts from multilateral organizations including the Food and Agriculture Organization and the world Bank
lEnvironmental nongovernmental organizations such as the world wide Fund for Nature-India, the world Conservation union, and the Ashoka Trust for Research in Ecology and the Environment.
Box 14 examples of sources of Input (step 3)
1. condition and trends in the ecosystem service
•Supply and demand
•Quantity and quality
•Present and future
2. direct drivers
•Changes in land use and land cover
•Overconsumption
•Climate change
•Pollution
•Invasive, non-native species
•Other
5. Indirect drivers
•governmental
•Demographic
•Economic
•Technological
•Cultural and religious
3. company activities
•How
•where
•To what degree
4. Activities of others
•who
•How
•where
•To what degree

methodology 23
Helpful Hints Step 3
• Interview experts early on. A few 30-minute telephone interviews can save a lot of time because experts can quickly summarize the trends, identify the most important drivers, and pinpoint the most relevant data sources.
• Interview at least one expert per priority service.
• Consider hosting a meeting in which a number of experts share information and react to each others’ perspectives.
• Be sure to consider the role of government policy as an indirect driver. many of the road tests found that specific tax provisions, subsidies, or other government policies often were a major factor influencing trends in ecosys-tems and the services they provide.
• Note the likelihood of each ecosystem service trend. For those that are nearly certain to occur, the company may need to develop a definitive response strategy during step 5 of the ESR. For those that are less certain to occur, the company might consider developing hedging or “no regrets” strategies until more information becomes available or until the trends unfold.
• Leverage scientific assessments and business tools that are specific to particular ecosystem services (such as freshwater) or drivers of ecosystem change (such as climate change). See Chapter III for suggestions.
• If little information is available about a particular ecosystem service, consider researching a case example to at least get an indication of status and trends.
1. Where possible, support answers to these questions with quantitative data. The availability of numeric data varies by ecosystem service, driver, and geography. For in-stance, quantitative information often exists for provision-ing services that have formal markets—crops, livestock, aquaculture, capture fisheries, and timber, among oth-ers—or for services that many governments measure and monitor such as freshwater. Quantitative information also may be available for some drivers, such as land use change, climate change, and pollution.However, quantitative data can be difficult to access or
may not even exist for some of the regulating services, cul-tural services, and drivers. In these situations, using qualita-tive information and expert advice can be sufficient and yield valuable insights.
While conducting the trends analysis, it is helpful to record relevant findings and to summarize any interviews. It is also helpful to prepare a short paper or presentation for each priority ecosystem service once the analysis has been completed. The summary facilitates sharing results with col-leagues and can serve as a helpful reference for later steps in the ESR (Box 15). The Helpful Hints offer other suggestions for conducting step 3.
mondi conducted a trends analysis for each of its six priority ecosystem services. The figure below provides a high-level summary of the key trends and drivers for one of these services, freshwater. The ESR team developed a longer PowerPoint presentation with all the details in order to synthesize the research and to present the findings to colleagues during a progress review at the end of step 3.
Box 15 example from the road tests (step 3)
3. company activities
• Reduce water quantity due to tree species used (eucalypt, pine)
• Increase water quantity via wetland and riparian area preservation, grassland management practices, and invasive species eradication
1. condition and trends in the ecosystem service
• water in 6 of 7 subcatchment areas where mondi plantations are located were overallocated by 2000
• water in all 7 subcatchment areas projected to be in deficit by 2025
2. direct drivers
• Overconsumption of water resources
• Climate change reducing regional rainfall levels and soil moisture content
• Spread of thirsty, invasive, non-native species
4. Activities of others
• South African water usage by sector:
– Irrigation: 62%
– urban: 27% (fast growth)
– Rural domestic: 5%
– Non-forestry industry: 3%
– Forestry industry: 3%
• many farms using inefficient irrigation practices
5. Indirect drivers
• government grants water entitlements to each sector. unclear who will be curtailed in areas of water stress
• Projected population growth of 0.4% / year
• Projected economic growth of 5.0% / year
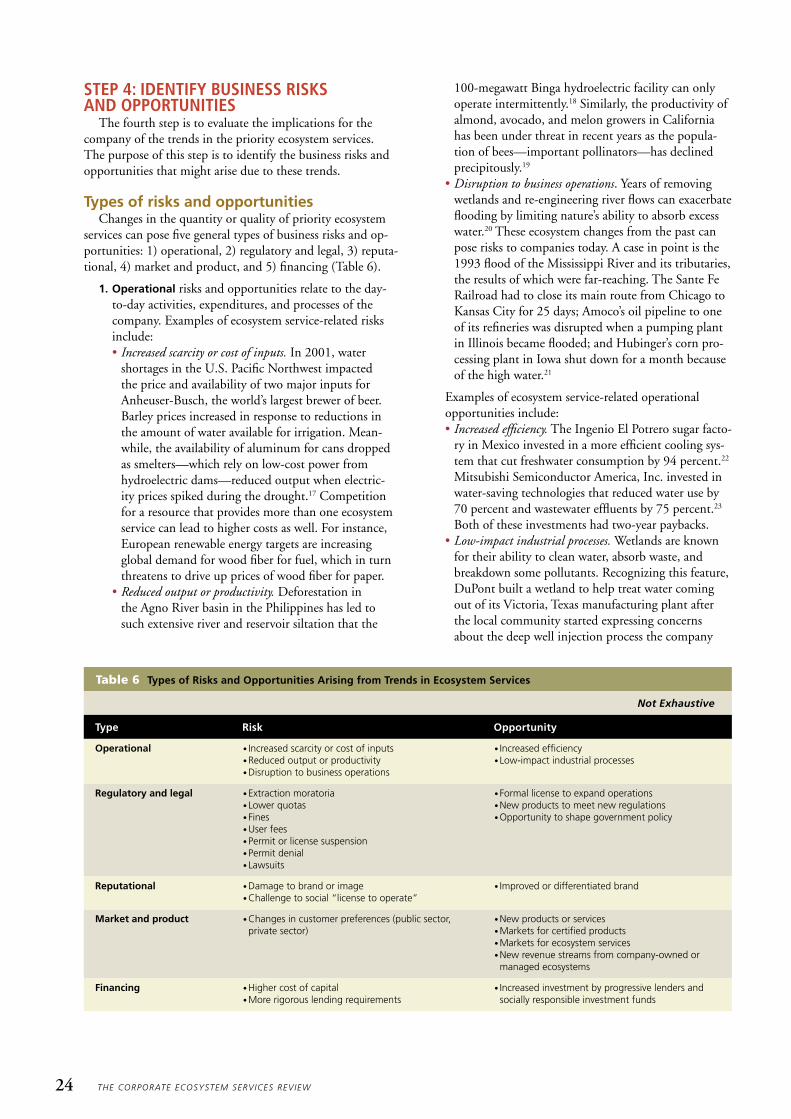
The CorporaTe eCosysTem serviCes review24
STEP 4: IDENTIFY BUSINESS RISKS AND OPPORTUNITIES
The fourth step is to evaluate the implications for the company of the trends in the priority ecosystem services. The purpose of this step is to identify the business risks and opportunities that might arise due to these trends.
types of risks and opportunitiesChanges in the quantity or quality of priority ecosystem
services can pose five general types of business risks and op-portunities: 1) operational, 2) regulatory and legal, 3) reputa-tional, 4) market and product, and 5) financing (Table 6).
1. operational risks and opportunities relate to the day-to-day activities, expenditures, and processes of the company. Examples of ecosystem service-related risks include:• Increased scarcity or cost of inputs. In 2001, water
shortages in the U.S. Pacific Northwest impacted the price and availability of two major inputs for Anheuser-Busch, the world’s largest brewer of beer. Barley prices increased in response to reductions in the amount of water available for irrigation. Mean-while, the availability of aluminum for cans dropped as smelters—which rely on low-cost power from hydroelectric dams—reduced output when electric-ity prices spiked during the drought.17 Competition for a resource that provides more than one ecosystem service can lead to higher costs as well. For instance, European renewable energy targets are increasing global demand for wood fiber for fuel, which in turn threatens to drive up prices of wood fiber for paper.
• Reduced output or productivity. Deforestation in the Agno River basin in the Philippines has led to such extensive river and reservoir siltation that the
100-megawatt Binga hydroelectric facility can only operate intermittently.18 Similarly, the productivity of almond, avocado, and melon growers in California has been under threat in recent years as the popula-tion of bees—important pollinators—has declined precipitously.19
• Disruption to business operations. Years of removing wetlands and re-engineering river flows can exacerbate flooding by limiting nature’s ability to absorb excess water.20 These ecosystem changes from the past can pose risks to companies today. A case in point is the 1993 flood of the Mississippi River and its tributaries, the results of which were far-reaching. The Sante Fe Railroad had to close its main route from Chicago to Kansas City for 25 days; Amoco’s oil pipeline to one of its refineries was disrupted when a pumping plant in Illinois became flooded; and Hubinger’s corn pro-cessing plant in Iowa shut down for a month because of the high water.21
Examples of ecosystem service-related operational opportunities include:• Increased efficiency. The Ingenio El Potrero sugar facto-
ry in Mexico invested in a more efficient cooling sys-tem that cut freshwater consumption by 94 percent.22 Mitsubishi Semiconductor America, Inc. invested in water-saving technologies that reduced water use by 70 percent and wastewater effluents by 75 percent.23 Both of these investments had two-year paybacks.
• Lowimpact industrial processes. Wetlands are known for their ability to clean water, absorb waste, and breakdown some pollutants. Recognizing this feature, DuPont built a wetland to help treat water coming out of its Victoria, Texas manufacturing plant after the local community started expressing concerns about the deep well injection process the company
Not Exhaustive
type risk opportunity
operational •Increased scarcity or cost of inputs•Reduced output or productivity•Disruption to business operations
•Increased efficiency•Low-impact industrial processes
regulatory and legal •Extraction moratoria•Lower quotas•Fines•user fees•Permit or license suspension•Permit denial•Lawsuits
•Formal license to expand operations•New products to meet new regulations•Opportunity to shape government policy
reputational •Damage to brand or image•Challenge to social “license to operate”
•Improved or differentiated brand
market and product • Changes in customer preferences (public sector, private sector)
•New products or services•markets for certified products•markets for ecosystem services• New revenue streams from company-owned or managed ecosystems
Financing •Higher cost of capital•more rigorous lending requirements
• Increased investment by progressive lenders and socially responsible investment funds
Table 6 types of risks and opportunities Arising from trends in ecosystem services

25
had been using. After being routed through an on-site biological treatment facility, wastewater is now released into the wetland for further cleaning before returning to the Guadalupe River.24
2. regulatory and legal risks and opportunities relate to the laws, government policies, and court actions that can affect corporate performance. Examples of ecosys-tem service-related risks include:• Extraction moratoria. China imposed a logging ban on
forests in the upper reaches of the Yangtze River and the middle and upper reaches of the Yellow River after the devastating 1998 floods. Rampant logging con-tributed to the disaster by reducing the forest’s ability to control erosion and regulate water flows during heavy rains. The ban had significant implications for forest product companies buying from China.25
• Lower quotas. Over the past decade, the European Union has been tightening fishing quotas on cod, hake, plaice, and other species in an effort to curb the depletion of wild fish stocks.26
• Fines. In 2008, Union Pacific was fined $102 million for liabilities in a California forest fire. The U.S. Dis-trict Court found Union Pacific not only responsible for the cost of firefighting and lost timber, but also for the economic damages to soil, wildlife, habitat, and recreational uses.27
• User fees. Responding to increased scarcity of freshwa-ter, Mexico’s National Water Commission raised the fee companies pay for water rights 17-fold between 1990 and 1993.28
• Permit or license suspension. In 2004, the state govern-ment suspended the permit of a Coca-Cola bottling plant in Kerala, India due to concerns over the plant’s impact on local freshwater levels and quality.29
• Permit denial. In 2004, the UK government denied Associated British Ports planning permission for a port expansion at Dibden due to its potential encroachment on nearby coastal ecosystems that were valued for their biodiversity and associated cultural services. As a result, Associated British Ports had to write off £45 million it had spent on the proposal and its share price dropped 12 percent the week immedi-ately following the permit denial.30
• Lawsuits. In 2003, indigenous Ecuadorians filed suit against ChevronTexaco in an Ecuadorian court, charging the company with dumping toxic oil waste-water into 350 open pits as well as into Amazon- basin wetlands and rivers that the tribes rely upon for drinking, bathing, and fishing.31
Examples of ecosystem service-related regulatory opportunities include:• Formal license to expand operations. In some situa-
tions, restoring or protecting an ecosystem can help a business make the case to regulators that it should be allowed to expand activities elsewhere. For instance, International Paper converted more than 2,000 hect-ares of its land in Georgia into a conservation bank for
the endangered red-cockaded woodpecker (Picoides borealis), allowing the company to legally expand its operations in other forests of lower conservation value.32
• New products to meet new regulations. New regula-tions to prevent the transport of invasive species via ship ballast water have been set by the International Maritime Organization and will take effect in 2009. Aquatic species transported from one ecosystem to another by ship can have a devastating effect on marine life and local economies. To help ship owners
meet the new requirements, Alfa Laval developed and launched PureBallast, a ballast water treatment system that removes unwanted marine organisms without additives or chemicals.33
• Opportunity to shape government policy. The tourism industry in Australia benefits from the recreational and ecotourism services provided by the Great Barrier Reef. In 2003, tourism industry associations engaged the Australian government to expand the network of marine sanctuaries within the reef in order to protect and increase the ecosystem’s ability to sustain the in-dustry into the future. Their efforts paid off. In 2004, the government implemented a new zoning plan that expanded the “green zones”—where commercial and recreational fishing are banned—from 5 percent to nearly 33 percent of the reef.34
3. reputational risks and opportunities relate to the com-pany’s brand, image, or relationship with customers, the general public, and other stakeholders. Examples of ecosystem service-related risks include:• Damage to brand or image. Protests against firms such
as Home Depot and B&Q in the 1990s affected their reputation among some customer segments.35 These campaigns were triggered by the impact suppliers of these do-it-yourself chains were having on old-growth forests, a rare ecosystem valued by many people for its rich biodiversity and myriad ecosystem services beyond timber. Similarly, the forestry company Mac-Millan Bloedel suffered reputational damage when Greenpeace and others protested against the firm for clear-cutting forests. In response to the protests, Scott Paper and Kimberly-Clark in the United Kingdom stopped sourcing from MacMillan Bloedel, causing the latter to quickly lose 5 percent of its revenue.36
“The ESR helped BC Hydro clarify its dependence on several key
ecosystem services, an important factor in establishing our long-term goal of
No Net Environmental Impact by 2024.”—Ray Stewart, Chief Safety Health and
Environment Officer, BC Hydro
mETHODOLOgy

The CorporaTe eCosysTem serviCes review26
• Challenge to social “license to operate.” In 1995, Cana-dian aluminum manufacturer Alcan sought to divert a river to generate hydropower for one of its smelters. However, local indigenous communities objected since the river was a source of freshwater, fish, and cultural services for them. With little accumulated goodwill with indigenous communities, Alcan was unable to receive consent to operate and ultimately abandoned the project, losing $500 million in up-front investment.37
Examples of ecosystem service-related reputational opportunities include:• Improved or differentiated brand. Fetzer Vineyards—a
division of Brown-Forman, the seventh largest wine manufacturer in the United States—is differentiating its brand in the competitive wine industry by seeking to become the “sustainable” wine producer. For in-stance, the company uses cover crops to improve ero-sion control and attract natural predators to manage pests, has a pond to naturally treat winery wastewater, and implements other approaches that leverage ser-vices provided by ecosystems—and publicly profiles these practices.38
4. market and product risks and opportunities relate to product and service offerings, customer preferences, and other market factors that can affect corporate per-formance. Examples of ecosystem service-related risks include:• Changes in public sector customer preferences. In 2004,
the UK government revised its wood procurement policies. Government-purchased timber now has to be legally logged and, where feasible, come from suppliers offering timber from “sustainable” sources. This revision had significant implications for Travis Perkins, the country’s largest supplier of building materials. With nearly 20 percent of its timber sales going to government building projects, the company faced the risk of losing a sizeable share of its business if it failed to meet these new customer preferences.39
Ph
oto
co
ur
te
sy
of
Mo
nd
i
An extensive wetland found on Gilboa Estate, a Mondi Shanduka plantation.
“The ESR methodology effectively draws on expert advice, stakeholder views, and company
strengths to identify and quantify emerging business risks and systematically determines a
range of solutions and opportunities.”—Peter Gardiner, Natural Resources Manager, Mondi
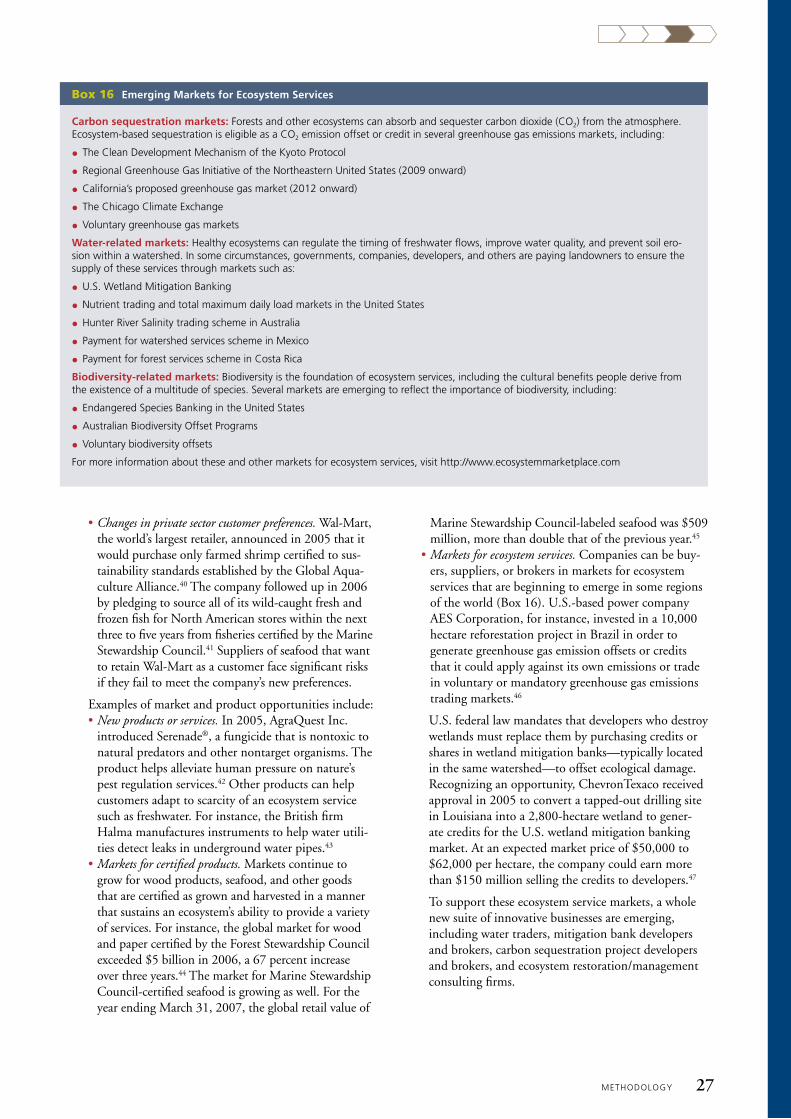
• Changes in private sector customer preferences. Wal-Mart, the world’s largest retailer, announced in 2005 that it would purchase only farmed shrimp certified to sus-tainability standards established by the Global Aqua-culture Alliance.40 The company followed up in 2006 by pledging to source all of its wild-caught fresh and frozen fish for North American stores within the next three to five years from fisheries certified by the Marine Stewardship Council.41 Suppliers of seafood that want to retain Wal-Mart as a customer face significant risks if they fail to meet the company’s new preferences.
Examples of market and product opportunities include:• New products or services. In 2005, AgraQuest Inc.
introduced Serenade®, a fungicide that is nontoxic to natural predators and other nontarget organisms. The product helps alleviate human pressure on nature’s pest regulation services.42 Other products can help customers adapt to scarcity of an ecosystem service such as freshwater. For instance, the British firm Halma manufactures instruments to help water utili-ties detect leaks in underground water pipes.43
• Markets for certified products. Markets continue to grow for wood products, seafood, and other goods that are certified as grown and harvested in a manner that sustains an ecosystem’s ability to provide a variety of services. For instance, the global market for wood and paper certified by the Forest Stewardship Council exceeded $5 billion in 2006, a 67 percent increase over three years.44 The market for Marine Stewardship Council-certified seafood is growing as well. For the year ending March 31, 2007, the global retail value of
Marine Stewardship Council-labeled seafood was $509 million, more than double that of the previous year.45
• Markets for ecosystem services. Companies can be buy-ers, suppliers, or brokers in markets for ecosystem services that are beginning to emerge in some regions of the world (Box 16). U.S.-based power company AES Corporation, for instance, invested in a 10,000 hectare reforestation project in Brazil in order to generate greenhouse gas emission offsets or credits that it could apply against its own emissions or trade in voluntary or mandatory greenhouse gas emissions trading markets.46
U.S. federal law mandates that developers who destroy wetlands must replace them by purchasing credits or shares in wetland mitigation banks—typically located in the same watershed—to offset ecological damage. Recognizing an opportunity, ChevronTexaco received approval in 2005 to convert a tapped-out drilling site in Louisiana into a 2,800-hectare wetland to gener-ate credits for the U.S. wetland mitigation banking market. At an expected market price of $50,000 to $62,000 per hectare, the company could earn more than $150 million selling the credits to developers.47
To support these ecosystem service markets, a whole new suite of innovative businesses are emerging, including water traders, mitigation bank developers and brokers, carbon sequestration project developers and brokers, and ecosystem restoration/management consulting firms.
carbon sequestration markets: Forests and other ecosystems can absorb and sequester carbon dioxide (CO2) from the atmosphere. Ecosystem-based sequestration is eligible as a CO2 emission offset or credit in several greenhouse gas emissions markets, including:
lThe Clean Development mechanism of the kyoto Protocol
lRegional greenhouse gas Initiative of the Northeastern united States (2009 onward)
lCalifornia’s proposed greenhouse gas market (2012 onward)
lThe Chicago Climate Exchange
lVoluntary greenhouse gas markets
water-related markets: Healthy ecosystems can regulate the timing of freshwater flows, improve water quality, and prevent soil ero-sion within a watershed. In some circumstances, governments, companies, developers, and others are paying landowners to ensure the supply of these services through markets such as:
lu.S. wetland mitigation Banking
lNutrient trading and total maximum daily load markets in the united States
lHunter River Salinity trading scheme in Australia
lPayment for watershed services scheme in mexico
lPayment for forest services scheme in Costa Rica
Biodiversity-related markets: Biodiversity is the foundation of ecosystem services, including the cultural benefits people derive from the existence of a multitude of species. Several markets are emerging to reflect the importance of biodiversity, including:
lEndangered Species Banking in the united States
lAustralian Biodiversity Offset Programs
lVoluntary biodiversity offsets
For more information about these and other markets for ecosystem services, visit http://www.ecosystemmarketplace.com
Box 16 emerging markets for ecosystem services
mETHODOLOgy 27

The CorporaTe eCosysTem serviCes review28
• New revenue streams from companyowned or managed ecosystems. Companies can capture new revenue streams by recognizing that their environmental assets may provide more than one good or service. For instance, Inland Empire Paper Company introduced user fees—$65 per year for families, $40 per year for individuals, $10 for a one day permit—for hikers, mountain bikers, hunters, and others who use its 46,000 hectares of forestlands in Washington and Idaho, essentially creating a revenue stream from the forest’s recreational services.48
5. Financing risks and opportunities relate to the cost and availability of capital from investors. Operational, regu-latory, reputational, and/or market risks (and oppor-tunities) can impact a company’s cash flows, which in turn can affect its credit quality. As a result, a business may face a higher cost of capital or more rigorous lend-ing requirements as the financial sector becomes more attuned to the implications of ecosystem degradation for borrowers or clients. Alternatively, managers may find some lenders and socially responsible investment funds becoming more interested in investing in their companies. For example:•In 2011, the World Bank Board approved new
International Finance Corporation (IFC) perfor-mance standards that screen for ecosystem service risks and impacts. This indicates that the IFC will no longer support projects that significantly degrade ecosystem services.49
• Dutch-based ABN AMRO has committed to avoid financing projects or operations that extract resources from virgin or high-conservation-value forests.50 High-conservation-value forests provide myriad ecosystem services, including watershed protection, carbon sequestration, recreation, and ethical value—they host a wealth of biodiversity.
• Global investment banks such as Citigroup are beginning to assess the degree to which large listed companies are exposed to risks and opportunities associated with freshwater scarcity and quality. Sec-tors that rely on water as an input into production processes or that release wastewater as an output are coming under greater scrutiny by banks. On the other hand, companies that provide solutions for water sup-ply, treatment, and demand management are gaining more investment attention.51
• Goldman Sachs has expressed interest in investment opportunities in markets for water, biodiversity, and forest-based ecosystems.52
Note that these five types of risks and opportunities are not mutually exclusive; one type can feed another. A regula-tory risk, for instance, could translate into a financing risk; a company on the verge of facing new regulations might find its bank implementing tighter lending policies. A reputa-tional risk could evolve into a market risk; a company experi-encing reputational damage might find some of its customers changing their buying patterns.
process for identifying risks and opportunities
There are many ways to identify possible business risks and opportunities arising from trends in a company’s priority ecosystem services. One method that proved useful to ESR road-test companies was to begin by holding a structured brainstorming session. Start by summarizing the company’s dependence and impact on one of its priority ecosystem ser-vices (step 2) and then briefly review the trends in that service (step 3). All of the relevant facts will therefore be fresh in the minds of the session’s participants. Armed with this informa-tion, participants proceed to brainstorm possible business risks and opportunities these trends might pose for the com-pany. To help trigger ideas, managers could consider each type of risk and opportunity outlined in Table 6 (see page 24).
Once completed, managers move on to the next priority ecosystem service and go through the same process, continu-ing until all priority services have been covered. The brain-storming exercise might span more than one meeting.
Desk research can supplement the results of the brain-storming session. Questions to consider that might uncover additional risks and opportunities include:
• What risks and/or opportunities have other businesses in the company’s industry faced due to these ecosystem service trends?
• What risks and/or opportunities have these trends posed to other businesses outside the company’s industry?
The end product of step 4 of the ESR is a list of risks and opportunities the company might face due to trends in priority ecosystem services. Managers can identify risks and opportunities per priority ecosystem service (Table 7) or per type of risk and opportunity (Table 8). The Helpful Hints provide other suggestions for step 4.
Helpful Hints Step 4
• manage the brainstorming session so that one person does not dominate the discussion and idea generation.
• To increase the likelihood of novel ideas being considered, include one or more outside experts or representatives of nongovernmental organizations during the brainstorming session.
• Look for opportunities to provide new products/services that help others either mitigate their impact on ecosystems or adapt to declining ecosystem services.
• Be sure to consider government policy not only as a source of business risk but also a potential opportunity to gain competitive advantage or “level the playing field.”
• If the company has internal expertise in certain aspects of ecosystems, consider providing for-profit consulting services to other firms.
• Look for ways to monetize ecosystem services the company already provides without compensation.
• Find opportunities to build on corporate initiatives already under way.
• After brainstorming risks and opportunities per priority ecosystem service, identify risks and opportunities that might arise due to the interplay between services.

priority ecosystem service
potential risks potential opportunitiestype of risk/ opportunity
Freshwater • Increased water scarcity due to: – Invasive alien species proliferation – Increasing demand among nearby, inefficient water users (farmers) – Climate change
• Internal efficiency improvements in freshwater use
• (Co)financing water efficiency improvements of nearby landowners
Operational
regulation of water timing and flows
•See above
Biomass fuel • New biomass-to-energy markets for plantation residues
market and product
global climate regulation • Emerging markets for carbon sequestration
market and product
recreation and ecotourism • Ecotourism or recreation-based revenue streams from company-managed wetlands/grasslands
market and product
livestock • Reduced plantation productivity due to increasing grazing pressures
Operational
• Increased scrutiny from nearby stakeholders for perceived “under-utilization” of mondi land set aside as wetlands/ grasslands
Reputational
Table 7 risks and opportunities summary: mondi
type risk opportunity
operational •Increased wood fiber scarcity • Increase mineral filler content in paper as a fiber replacement strategy
regulatory and legal • Scarcity of wood due to increased government scrutiny of and actions against companies that use illegally sourced wood
• Lack of water due to increased government restric-tions on water usage in areas where heavy pollution leads to declining water availability
• Voice support for national, u.S., and Eu government measures to curb illegal logging
• work through industry association initiatives to combat illegal logging
• Supply company’s water purification products to developing markets
reputational • Increased scrutiny by purchasers and nongovernmental organizations of unsustainable forest management practices
• Support industry initiatives for customers to implement Forest Stewardship Council-oriented sustainability policies
• Partner with customers who invest in sustainable forestry and plantation development
market and product • Competition for fiber as raw material for various end-uses (e.g., power generation, biofuels, paper pulp, cellulose products)
• Supply chemicals and engineering know-how for processing of cellulose byproducts
Financing
Table 8 risks and opportunities summary: Akzo nobel
mETHODOLOgy 29

The CorporaTe eCosysTem serviCes review30
An additional activity is necessary for man agers who chose a supplier or customer as the scope of the ESR. For these managers, all of the research and the risks and opportuni-ties identified up to this point have been with respect to the selected supplier or customer. These findings will need to be converted into risks and opportunities for the business con-ducting the ESR, as Syngenta did during its road test (Box 17).
STEP 5: DEVELOP STRATEGIES FOR ADDRESSING RISKS AND OPPORTUNITIES
The fifth step is to develop and prioritize strategies for minimizing the risks and maximizing the opportunities identified during step 4. Once the fifth step has been completed, managers will have a prioritized set of strategies to implement, which in some cases can be a good time to undertake corporate ecosystem valuation.
categories of strategiesStrategies for responding to ecosystem service-related risk
and opportunities fall into three broad categories (Figure 6):
1. Internal changes. Companies can address many of the risks and opportunities listed in Table 6 (see page 24) through changes in operations, product/market strate-gies, and other internal activities. Potlatch, for instance, developed a strategy to establish a new revenue stream from its forests through visitor user fees. Unilever reduced its exposure to declining cod stocks in part by switching to other—albeit less profitable—species.53
Examples of other internal changes include increas-ing the efficiency of using ecosystem-based resources, launching new products or services, supplying or buying sustainably certified products, and reducing the impact of corporate operations on ecosystems to avoid regulatory risks.
2. sector or stakeholder engagement. Companies can also address some of these risks and opportunities by partnering with industry peers, collaborating with other sectors, or structuring transactions with stakeholders. Vittel, for instance, addressed its water contamination problem (see Chapter I) by paying farmers in the wa-tershed to switch to more sustainable land use practices and restoring the ecosystems surrounding the springs. The strategy worked; water purity returned and Vittel is now one of Nestlé Waters’ top selling brands.54 As an additional response to its fish supply crisis, Unilever collaborated with the World Wide Fund for Nature and
Figure 6 categories of strategies
Industry peer collaboration
Cross-sector collaboration
NgO collaboration
Transactions with stakeholders
Etc.
sector or stakeholder engagement
Operations
Product strategy
market strategy
Procurement strategy
Land management
Etc.
Internalchanges
Tax incentives
Subsidy reforms
Protected areas
Zoning
Etc.
policy-makerengagement
syngenta chose one of its customer segments, farmers in southern India, as the scope for its road test. The ESR identified a number of risks to farmers in this region arising from the degradation of several ecosystem services. Risks included:
lReduced availability and quality of freshwater for irrigation
lLoss of topsoil due to clearance of native vegetation, failure to implement erosion control measures, and other poor farming practices
lPotential loss in yields of some fruits, vegetables, and spices due to a decline in the number of pollinators
lLower yields due to a decline in the ability of natural predators to contain pest outbreaks
lReduced soil fertility due to poor management practices.
These risks indirectly affect Syngenta by threatening to reduce the number of viable farmers in the region and by shifting crop prefer-ences, thereby requiring the company to adapt its seeds or crop protection products. At the same time, the company identified a number of possible opportunities to help farmers either reduce their impacts on ecosystems or adapt to ecosystem change. Examples include:
lBased on the company’s experience in other regions (e.g., Operation Bumblebee in the united kingdom), lead an initiative to increase pollinators in the region through selling natural seed mixes, selling bees, or offering assistance through extension services
luse the company’s in-depth knowledge of plants to offer farmers an improved integrated pest management system
lDevelop and offer seeds and crop protection products that use less water, have better built-in resistance to disease and pests, and are more tolerant of dry or salty soils, among other traits
lStrengthen the company’s approach to the market and its training services to offer farmers best management practices that restore natural ecosystem functions
lEngage the company’s foundation and external research institutions to fill gaps in information about the status and trends in ecosys-tem services critical to agriculture in the region.
Box 17 translating customer risks into Business risks and opportunities

a range of stakeholders to create the Marine Steward-ship Council.55 Energia Global made payments to a for-est protection fund that paid landowners upstream of its dams to conserve or re-establish tree cover, thereby reducing siltation of the rivers.56
3. policy-maker engagement. Not all ecosystem service-related risks and opportunities can be successfully addressed through internal corporate activities alone or through sector and stakeholder engagement. Some re-quire changes in government policy. Many ecosystems providing services valued by a company are controlled by governments. Others stretch across numerous pri-vate owners, making engagement inefficient or nearly impossible. Moreover, poor public policies are often a key indirect driver of the degradation of ecosystem services. Therefore, a productive corporate strategy for addressing some ecosystem service-related issues can be to engage policy-makers and government agencies to establish good policies. Companies can voice support for (or provide input to) incentives or effective rules for sustainable management of ecosystem services. In 2007, for instance, leaders of six multinational companies—The Coca-Cola Company, Levi Strauss & Co., Läckeby Water Group, Nestlé S.A., SABMiller, and Suez—pledged to work with governments and policy-makers to address pressing issues regarding freshwater availability and quality.57
Box 18 highlights some of the strategies identified by one of the road-test companies.
Identifying and prioritizing strategiesEach company has its own specific processes for developing
and prioritizing strategies to address identified business risks and opportunities. This publication does not attempt to reinvent these approaches. Rather, ESR road-test experience suggests that the following activities can complement existing processes:
• Brainstorm and discuss possible strategies for addressing each of the ecosystem service-based risks and opportuni-ties identified in step 4. This exercise can immediately follow the brainstorming session conducted for step 4, while the issues are fresh in the minds of participating managers. Several road-test companies took this ap-proach. Or the session could occur at a later date, when managers themselves may be more refreshed.
• Involve in the brainstorming session the team that conducted the ESR, the business manager(s) who may be responsible for implementing the strategies, and rep-resentatives from corporate government relations.
• Follow up the exercise with research to provide more detail on the candidate strategies. For example, if a strategy involves developing new revenue streams from a company-owned ecosystem, then managers may want to conduct an ecosystem service economic valuation study (see Box 19). If the strategy involves working with national policy-makers to create incentives for more sustainable management of selected ecosystem services, then managers may want to research possible policy op-tions and determine which policy-makers to approach.
• Look at other companies facing similar ecosystem service-based risks and opportunities to help trigger additional ideas. Identify the strategies they are imple-menting to address these issues.
Through its ESR road test, mondi identified several strategies for managing the risks and opportunities it identified, including:
Internal changeslimplement additional internal water efficiency improvements. The company can reduce risks associated with growing freshwater scar-
city by implementing a series of water-use-efficiency practices such as more aggressively clearing invasive species, better matching tree species to site conditions, utilizing water-efficient strains as they become available, and more frequently conducting prescribed burns on its grasslands.
lstart using invasive species as biomass fuel. mondi can combine its interest in removing competition for water and in tapping into the growing market for biomass fuel by starting to use the invasive species cleared from its plantations as feedstock for power and/or heat generation. Potential end users of the feedstock are mondi’s own mills or a new biomass pellet manufacturer located not far from one of the plantations.
sector or stakeholder engagement lobtain additional water entitlements by (co)financing water efficiency improvements of upstream landowners. many farmers operating
near mondi’s plantations use inefficient irrigation systems but lack a financial incentive or ability to upgrade. mondi could engage se-lected farmers and offer to (co)finance irrigation system upgrades in return for a share of the recipient’s water entitlements—the share could be negotiated and based on the amount of projected water savings. These entitlements could, through an afforestation license procedure, result in additional water rights for plantations.
lpromote coppiced woodlots for biomass fuel. Leveraging the company’s forestry expertise, mondi could help nearby private land-owners and villages establish woodlots on degraded land for growing biomass fuel on coppiced rotations. mondi could provide seedlings, offer extension services, and purchase the wood to use either in its own mill or sell to a nearby wood pellet manufacturer. These woodlots would provide additional revenue for villagers and thereby strengthen mondi’s reputation and stakeholder relationships.
policy-maker engagementlengage policy-makers to improve freshwater resource use policies. mondi could explore voicing support for stronger policies that
encourage water-use efficiency in South Africa and, leveraging its expertise in water management, provide input into policy design. (Specific policy recommendations identified during the ESR are confidential at this stage.)
Box 18 example from the road tests (step 5)
mETHODOLOgy 31

The CorporaTe eCosysTem serviCes review32
• Prioritize the suite of strategies based on commonly used parameters such as return on investment, net present value, relative ease of implementation, urgency of the risk or opportunity, or other criteria.
The Helpful Hints offer additional suggestions for step 5.
NEXT STEPSThe ESR concludes with the identification and prioritiza-
tion of strategies to address ecosystem service risks and op-portunities. But what comes after these strategies have been advanced?
Building on the experience of implementing an ESR in one part of the company, managers can extend the methodology to additional divisions, markets, customers, suppliers, or other aspects of their business. Managers can also incorporate the ESR—or elements of it—into their existing environmental management and due diligence systems or into their corporate strategy development processes in order to augment them.
In both cases, the ESR is a promising approach for com-panies to strengthen their ability to respond to a growing global environmental crisis. By accounting more fully for the dependence and impact of their business on ecosystem services, managers can better address the associated risks and opportunities. In addition, by helping companies make the connection between healthy ecosystems and the bottom line, the ESR can stimulate more sustainable business practices
and support for public policies that protect and restore the ecosystems upon which we all depend. One thing is abun-dantly clear: “business as usual” is no longer an option.
Helpful Hints Step 5
lkeep track of possible strategies throughout the entire ESR process. managers or interviewees may identify good strate-gic options during any one of the ESR steps. keep a running list and review them in a structured manner during step 5.
lRecognize that some strategies may address more than one risk or opportunity.
lBe willing to engage nongovernmental organizations and other noncorporate stakeholders when developing and even executing the strategies.
lArticulate the context—the trends in the relevant priority ecosystem service—when presenting the set of strategies to executive management for approval.
lPost the ESR results and supporting documentation on the company intranet to facilitate knowledge transfer.
lInvolve at least one person from the first ESR team in subse-quent corporate ESRs to ensure lessons learned are shared and to avoid “reinventing the wheel.”
lIf economic valuation of ecosystem service-related risks and opportunities is helpful for strategy development, refer to wBCSD’s Guide to Corporate ecosystem valuation.
Ecosystem valuation assigns quantitative values to ecosystem services such as carbon sequestration, recreation, and watershed protection, in order to improve decision-making. Conducting an ecosystem valuation may be a particularly useful activity for some companies during, or as a result of, step 5 of the ESR (strategy development).
wBCSD’s Guide to Corporate ecosystem valuation is a useful framework for conducting an ecosystem valuation study in step 5 of the ESR. The guide is a framework to help managers make better-informed business decisions by explicitly valuing both the costs of ecosys-tem degradation and the benefits received from ecosystem services. It has five steps:
The Guide to Corporate ecosystem valuation can inform a number of business purposes, such as communicating the value of ecosystem services, comparing the costs and benefits of an investment in ecosystem restoration or protection, and identifying possible market values or revenue streams from an ecosystem service. Some companies have also used the guide to measure the societal value of ecosystem services in order to engage stakeholders and policymakers.
Box 19 step 5 and corporate ecosystem Valuation
Stage 1 — Scoping:
This stage helps a company define the scope for the valuation exercise, using a checklist of questions. Only brief responses are required, and the process may involve numerous iterations.
Stage 5 — Embedding:
The final stage is to embed the CEV approach within company processes and procedures.
Stage 4 — Application:
This stage involves companies using and communicating the valuation results to influence internal and external decision-making.
Stage 3 — Valuation:
This stage involves the actual valuation, which may be qualitative, quantitative and/or monetary. It begins by fully defining the company aspect to be valued, and ends by subjecting the results to a sensitivity analysis.
Stage 2 — Planning:
This stage develops a suitable plan to undertake the valuation effectively. The plan should be more specific in terms of detail as compared to stage 1.
P R E PA R AT I O N P O S T VA L U AT I O NVA L U AT I O N
1Scoping
3Valuation
5Embedding
4Application
2Planning
source: world Business council for sustainable development (wBcsd). 2011. Guide to Corporate Ecosystem Valuation. online at: http://www.wbcsd.org.

resources 33
The ESR website (www.wri.org/ecosystems/esr) provides a number of tools and resources to help business managers, analysts, and consultants conduct a Corporate Ecosystem Services Review. Some key resources are listed below as well.
esr toolsManagers can download materials and tools designed
specifically for the ESR, including:• An electronic version of these guidelines in pdf format
available in English, French, Spanish, Portuguese, Chinese, and Japanese
• A spreadsheet containing the Dependence and Impact Assessment Tool (see Box 10 on page 17 for details about the tool) available in English, French, Spanish, Chinese, and Japanese
• Short presentations to communicate the business case for an ESR, explain the five steps of the process, and build support for conducting a review
• Case studies on how companies are using the ESR and are responding to business risks and opportunities aris-ing from their dependence and impact on ecosystems
• Other internet-based options for sharing ESR experiences and for obtaining answers to questions about the ESR
•ESR training materials including videos, step-by-step PowerPoint presentations and exercises, and detailed ESR case studies.
scientific assessmentsThe website includes profiles and links to several scientific
assessments that can be helpful when conducting the ecosystem service trends analysis (step 3), including:
• The Millennium Ecosystem Assessment, which provides a state-of-the-art scientific audit of the condition and trends in the world’s ecosystems and ecosystem services, as well as a review of the drivers of ecosystem change
• Reports of the Intergovernmental Panel on Climate Change, which provide the latest scientific and technical assessments of human-induced climate change, including
its observed and projected impacts on the world’s ecosystems and eco-system services such as freshwater
• The Intergovernmental science-policy Platform on Biodiversity and Ecosystem Services (IPBES) is designed to be an interface between the sci-entific community and policy makers, and aims to build capacity for and strengthen the use of science in policy making. Like the IPCC, IPBES assessments could also be very valuable to business.
economic valuation The website includes information and links regarding
economic valuation of ecosystem services, including:•The Guide to Corporate Ecosystem Valuation, a process
to help managers make better-informed business decisions by explicitly valuing both the costs of ecosystem degradation and the benefits received from ecosystem services.
•The Economics of Ecosystems and Biodiversity Report for Business is designed to draw attention to the global economic benefits of biodiversity and ecosystem services, to highlight the growing costs of biodiversity loss and ecosystem degradation, and to draw together expertise from the fields of science, economics, and policy.
•Other ecosystem service valuation tools can sometimes be used to help quantify the physical quantity and quality of ecosystem services, their location, and their economic value. Tools—including InVEST, ARIES, ATEAM, EcoMetrix, and the Ecosystem Portfolio Model, among others—are continually being tested and refined. Managers should be sure to understand the assumptions underlying the models they use and check results against the company’s specific circumstances.
C H A P T E R
Resources

The CorporaTe eCosysTem serviCes review
Issue-specific toolsThe website includes descriptions and links to a number
of tools and resources that may assist with in-depth analysis of particular ecosystem services, drivers of ecosystem change, or business strategies to manage risks and opportunities. The website provides guidance on when these tools may be most relevant in the ESR process.
The website also includes guidance on incorporating eco-system services into business performance systems, such as:
•Nature in Performance (2012), a WRI report that pro-vides initial guidance on how to incorporate ecosystem services into corporate environmental management, reporting, and due diligence systems.
•The Global Reporting Initiative’s Approach for Reporting on Ecosystem Services (2011), which provides guidance on incorporating ecosystem services into an organiza-tion’s performance disclosure.
sector-specific toolsThe website also provides an overview and links to tools
and resources that may help companies in particular industries assess their dependence and impact on ecosystems, business risks and opportunities, and strategies for managing them. It identifies the ESR steps where these tools may provide the most assistance.
The resources website will be updated as new support tools become available.
professional networks There are also several professional networks focusing on
business and ecosystem services that connect managers, con-sultants, and ecosystem experts to share lessons learned and promote collaboration. For example:
•The Ecosystem Services Experts Directory includes a wide range of noted experts on ecosystems and ecosystem function willing to provide specific guidance on particular ecosystem trends or environmental management practices.
34

background 35
1 Perrot-Maître, D. 2006. The Vittel Payments for Ecosystem Services: A “Perfect” PES Case? London: International Insti-tute for Environment and Development.
2 Malavasi, E.O. and J. Kellenberg. 2003. Program for Payments for Ecological Services in Costa Rica. Available at: http://www2.gsu.edu/~wwwcec/special/lr_ortiz_kellenberg_ext.pdf
3 ISIS. 2004. Is Biodiversity a Material Risk for Companies? London: ISIS Asset Management plc.
4 Maughan, R. “Potlatch Corp. to Charge Fees for Access to N. Idaho Forests” Seattle PostIntelligencer. October 4, 2006.
5 Bayon, R. “Making Money in Environmental Derivatives” The Milken Institute Review. March 1, 2002; Powicki, C.R. “Eco-Solutions Plays Key Role in Landmark Conservation Deal.” EPRI Journal Online. February 25, 2002; Lashley, D. 2003. Market Based Case Studies Involving EcoAsset Management On NonMined Lands. GreenVest LLC.
6 For more information about the Millennium Ecosystem Assessment, see www.maweb.org.
7 Millennium Ecosystem Assessment. 2005. Ecosystems and Human Wellbeing: Synthesis. Washington, DC: Island Press.
8 The other ecosystem service rated as “enhanced” is global climate regulation (carbon sequestration). According to the Millennium Ecosystem Assessment, forests and soils were a net source of carbon dioxide (CO
2) emissions over the past
two centuries. Approximately 40 percent of CO2 emissions
came from land use change, primarily through deforestation, while terrestrial ecosystems absorbed approximately only a third of all CO
2 emissions during that time period. During
the 1980s and 1990s, however, terrestrial ecosystems were a net CO
2 sink. They were the source of about 20 percent
of CO2 emissions—fossil fuels accounted for the rest—but
absorbed approximately a third of total CO2 emissions dur-
ing that time period. Therefore, the ability of ecosystems to sequester carbon in the 1980s and 1990s was “enhanced” relative to the past two centuries. Nevertheless, deforesta-tion is still a major source of man-made CO
2 emissions and
efforts to curb deforestation would help reduce greenhouse gas concentrations in the atmosphere. Source: Millennium Ecosystem Assessment. 2005. Ecosystems and Human Wellbeing: Current State and Trends. Washington, DC: Island Press.
9 United Nations. 2007. World Population Prospects –The 2006 Revision: Executive Summary. New York: United Na-tions, Department of Economic and Social Affairs, Popula-tion Division.
10 See Millennium Ecosystem Assessment. 2005. Ecosystems and Human Wellbeing: Opportunities and Challenges for Business and Industry. Washington, DC: World Resources Insti-tute; ISIS. 2004. Is Biodiversity a Material Risk for Companies? London: ISIS Asset Management plc.
11 For guidance on how to measure corporate greenhouse gas emissions, see World Resources Institute and WBCSD. 2004. The Greenhouse Gas Protocol: A Corporate Accounting and Reporting Standard (Revised Edition). Washington, DC: World Resources Institute and WBCSD.
12 World Business Council for Sustainable Development (WBCSD). 2011. Guide to Corporate Ecosystem Valuation. Available at: http://www.wbcsd.org.
13 Buchmann, S.L. and G.P. Nabhan. 1996. The Forgotten Pollinators. Washington, DC: Island Press.
14 Intergovernmental Panel on Climate Change (IPCC). 2007. Climate Change 2007 – Impacts, Adaptation and Vulnerability. Contribution of Working Group II to the Fourth Assessment Report of the IPCC. Cambridge, UK: Cam-bridge University Press.
15 Dead zones are vast regions of oxygen-depleted waters that stress aquatic ecosystems. Dead zones can lead to fish kills, ecosystem collapse, and economic damage to shellfish, recre-ational fishing, and other industries.
16 United States Department of Agriculture. National Agriculture Library, National Invasive Species Information Center. Available at: http://www.invasivespeciesinfo.gov/animals/eab.shtml; The Nature Conservancy. Available at: http://www.nature.org/earth/grasslands/coverstory.html; Hungarian Ministry of Environmental Protection and Water Resources. 2003. Invasive Alien Species in Hungary. Budapest; The World Conservation Union. Global Invasive Species Da-tabase. Available at: http://www.issg.org/database/. Cornell University estimates that non-native invasive species cause economic losses of $1.4 trillion per year worldwide, $137 billion in the United States alone, and $49 billion in Brazil alone. Source: Environmental News Service. 2005. “Brazil Struggles to Control Invasive Animals and Plants.” October 6, 2005. Available at: http://www.ens-newswire.com/ens/oct2005/2005-10-06-07.asp
Notes
NOTES

The CorporaTe eCosysTem serviCes review36
17 Global Environmental Management Initiative. “Anheuser-Busch Inc.—Exploring Water Connections Along the Supply Chain.” Case study for module 1 of Connecting the Drops Toward Creative Water Strategies—A Water Sustainability Tool. Available at: http://www.gemi.org/water/anheuser.htm
18 International Rivers. 2001. Dams in the Cordillera. Avail-able at: http://internationalrivers.org/files/021214.corddams.pdf
19 Committee on the Status of Pollinators in North America, National Research Council. 2007. Status of Pollinators in North America. Available at: http://books.nap.edu/openbook.php?record_id=11761
20 Potter, K. W. 1994. “Estimating Potential Reduction Flood Benefits of Restored Wetlands.” Water Resources Update, University Council on Water Resources 97: 34-38; U.S. Envi-ronmental Protection Agency. 2006. Wetlands: Protecting Life and Property from Flooding. EPA843-F-06-001. According to the Environmental Protection Agency, restoring the 100-year flood zone of the upper Mississippi five-state watershed would allow ecosystems to store an additional 39 million acre-feet of floodwater—the volume of the Great Flood of 1993—and save more than $16 billion in projected flood damage costs.
21 Feder, B.J. “Winners as Well as Losers in the Great Flood of ’93.” New York Times. August 15, 1993.
22 Miranda-da-Cruz, S. 1997. “Success Stories from Latin America and the Caribbean: Rationalization of Water Use at a Sugar Mill.” Vienna: United Nations, Industrial Develop-ment Organization. Available at: http://www.un.org/esa/earthsummit/mex.htm
23 Business for Social Responsibility. 2003. “Water Issues Issue Brief.” Available at: http://www.bsr.org/insight/issue-brief-details.cfm?DocumentID=49620#leadership (Accessed February 15, 2008.)
24 Global Environmental Management Initiative. “DuPont: Managing Strategic Risk through Innovative Wastewater Treatment.” Available at: http://www.gemi.org/water/du-pont.htm
25 Durst, P.B., T.R. Waggener, T. Enters, and T.L. Cheng, eds. 2001. Forests Out of Bounds: Impacts and Effectiveness of Logging Bans in Natural Forests in AsiaPacific. Bangkok, Thailand: Food and Agricultural Organization, Regional Of-fice for Asia and the Pacific.
26 BBC. “Fish Quotas Aim to Halt Decline.” December 19, 2003. Available at: http://news.bbc.co.uk/2/hi/eu-rope/3333395.stm
27 Thompson, D. “Union Pacific To Pay $102 Million for Forest Fire.” The New York Sun. July 22, 2008.
28 Miranda-da-Cruz, S. 1997. “Success Stories from Latin America and the Caribbean: Rationalization of Water Use at a Sugar Mill.” Vienna: United Nations, Industrial Develop-ment Organization. Available at: http://www.un.org/esa/earthsummit/mex.htm
29 BBC. “Cola Companies Told to Quit India.” January 20, 2005. Available at: http://news.bbc.co.uk/2/hi/south_asia/4192569.stm
30 ISIS. 2004. Is Biodiversity a Material Risk for Companies? London: ISIS Asset Management plc.
31 Amazon Watch. “ChevronTexaco Faces Trial in Ecuador for Rainforest Destruction.” May 6, 2003. Available at: http://www.corpwatch.org/article.php?id=6691; Forero, J. “Texaco Goes on Trial in Ecuador Pollution Case.” The New York Times. October 23, 2003. Available at: http://www.nytimes.com/2003/10/23/business/texaco-goes-on-trial-in-ecuador-pollution-case.html
32 Finn, M., G. Rahl, and W. Rowe, Jr. 2006. Unrecognized Assets: Think of Your Land, Water, and Pollution Controls as Sources of Value, not as Costs. Strategy + Business.
33 SET Corporation. “Alfa Laval to Launch Ballast Water Treatment System Today.” Press release. December 15, 2006. Available at: http://www.setcorp.ru/main/pressrelease.phtml?news_id=13498&language=english
34 Hodge, A. “Tough Bans to Save Reef—Fishermen and Shipping Shut Out.” The Australian, NSW Country Addi-tion. June 2, 2003; BBC. Australia Life-line for Barrier Reef.” December 3, 2003. Available at: http://news.bbc.co.uk/2/hi/asia-pacific/3286707.stm
35 Preston, J. “Home Depot Says It Aims to Save Ancient For-ests.” Reuters. August 26, 1999; Hodson, C. “Plywood with a Pedigree.” CNN.com. Available at: http://www.rainfor-estrelief.org/documents/CNN_on_Lauan_Logging.pdf
Notes

resources 37
36 Willard, B. 2002. The Sustainability Advantage: Seven Business Case Benefits of a Triple Bottom Line. Gabriola Island, British Columbia: New Society Publishers.
37 Esty, D. and A. Winston. 2006. Green to Gold. New Haven and London: Yale University Press.
38 Wine Business Monthly. “Top 30 U.S. Wine Companies of 2004.” February 2005. Available at: http://www.wine-business.com/wbm/?go=getArticle&dataId=36564; Fetzer Vineyards. 2007. Sustainability Brochure. Available at: http://www.fetzer.com/sustainability.aspx
39 ISIS. 2004. Is Biodiversity a Material Risk for Companies? London: ISIS Asset Management plc.
40 Center for Environmental Leadership in Business. “Wal-Mart Commits to Sustainable Seafood Procurement.” July 20, 2006. Available at: http://www.conservation.org/sites/celb/fmg/articles/Pages/072006_walmart_commits_to_sus-tainable_seafood_procurement.aspx. The Global Aquaculture Alliance (GAA) is an international, nonprofit trade associa-tion dedicated to advancing environmentally and socially responsible aquaculture. GAA promotes Best Aquaculture Practices standards and facility certification for sustainable aquaculture. For more information, visit www.gaalliance.org.
41 Wal-Mart Stores. “Wal-Mart Takes Lead On Support-ing Sustainable Fisheries.” February 3, 2006. Available at: http://walmartstores.com/pressroom/news/5638.aspx. The Marine Stewardship Council is an international nonprofit organization that was set up in 1997 to promote solutions to the problem of overfishing. The MSC runs the only widely recognized environmental certification and eco-labeling scheme for wild capture fisheries. For more information, visit www.msc.org.
42 AgraQuest. “AgraQuest Introduces Serenade® Garden Concentrate.” Press release. January 31, 2005. Available at: http://www.agraquest.com/news-media/archived.html (Ac-cessed February 15, 2008.)
43 Available at: http://www.halma.com/our-companies/key-products.aspx
44 ABN AMRO. 2001. ABN AMRO Risk Policies: Forestry and Tree Plantations. Amsterdam: ABN AMRO Bank N.V.
45 Marine Stewardship Council. Annual Report 200607. Available at: http://eng.msc.org
46 Finn, M., G. Rahl, and W. Rowe, Jr. 2006. Unrecognized Assets: Think of Your Land, Water, and Pollution Controls as Sources of Value, not as Costs. Strategy + Business.
47 Kenny, A. “Chevron Opens Mitigation Bank in Paradis(e).” Katoomba Group. Available at: http://ecosys-temmarketplace.com/pages/article.news.php?component_id=4255&component_version_id=6132&language_id=12
48 Landers, R. “Timber Companies Charging Fees.” SpokesmanReview.com. September 13, 2007. Available at: http://www.spokesman.com/stories/2007/sep/13/timber-compa-nies-charging-fees/
49 International Finance Corporation. 2011. Performance Standard 6 – V2 Biodiversity Conservation and Sustainable Management of Living Natural Resources. Available at: http://www.ifc.org/ifcext/policyreview.nsf/Content/Performance Standard6
50 ABN AMRO. 2001. ABN AMRO Risk Policies: Forestry and Tree Plantations. Amsterdam: ABN AMRO Bank N.V.
51 Kerschner, E.M. and M. Geraghty. 2008. Water Worries. New York: Citigroup Global Markets.
52 Goldman Sachs. 2005. “Environmental Policy Frame-work.” Available at: http://www2.goldmansachs.com/
53 ISIS. 2004. Is Biodiversity a Material Risk for Companies? London: ISIS Asset Management plc.
54 Perrot-Maître, D. 2006. The Vittel Payments for Ecosystem Services: A “Perfect” PES Case? London: International Insti-tute for Environment and Development.
55 Marine Stewardship Council. “History of MSC.” Available at: http://www.msc.org/html/content_470.htm. (Accessed February 15, 2008.)
56 Malavasi, E.O. and J. Kellenberg. 2003. Program for Payments for Ecological Services in Costa Rica. Available at: http://www2.gsu.edu/~wwwcec/special/lr_ortiz_kellenberg_ext.pdf
57 United Nations Global Compact. “CEOs Issue Global Call to Action on Water Crisis.” Press release. July 6, 2007. Available at: http://www.unglobalcompact.org/NewsAndE-vents/news_archives/2007_07_05e.html
NOTES

ABOUT WORLD RESOURCES INSTITUTEThe World Resources Institute (WRI) is an environmental think tank that goes beyond research to create practical ways to protect the Earth and improve people’s lives. Our mission is to move human society to live in ways that protect Earth’s environment for current and future generations. Our program meets global challenges by using knowledge to catalyze public and private action to:
• Reverse damage to ecosystems. We protect the capacity of ecosystems to sustain life and prosperity.• Expand participation in environmental decisions. We collaborate with partners worldwide to increase people’s access to
information and influence over decisions about natural resources.• Avert dangerous climate change. We promote public and private action to ensure a safe climate and sound world economy.• Increase prosperity while improving the environment. We engage the private sector to grow while improving environmental
and community well-being.
For more information, visit www.wri.org
ABOUT WORLD BUSINESS COUNCIL FOR SUSTAINABLE DEVELOPMENTThe World Business Council for Sustainable Development is a CEO-led organization of forward-thinking companies that gal-vanizes the global business community to create a sustainable future for business, society and the environment. Together with its members, the council applies its respected thought leadership and effective advocacy to generate constructive solutions and take shared action. Leveraging its strong relationships with stakeholders as the leading advocate for business, the council helps drive debate and policy change in favor of sustainable development solutions.
The WBCSD provides a forum for its 200 member companies - who represent all business sectors, all continents and a com-bined revenue of more than $7 trillion - to share best practices on sustainable development issues and to develop innovative tools that change the status quo. The Council also benefits from a network of 60 national and regional business councils and partner organizations, a majority of which are based in developing countries.
www.wbcsd.org
ABOUT MERIDIAN INSTITUTEThe Meridian Institute helps decision-makers and diverse stakeholders solve some of society’s most contentious public policy issues. Meridian works with all involved parties to create the right conditions for creative, practical solutions, and mutually beneficial agreements that can be effectively implemented. Meridian’s experience encompasses environment, natural resources, agriculture, sustainability, science and technology, and security. We work at the local, national, and international levels.
For more information, visit www.merid.org
For more information about the corporate ecosystem services review, visit www.wri.org/ecosystems/esr
Copyright © World Resources Institute
January 2012, update of version 1.0 (March 2008)
ISBN 978-1-56973-785-9
Printed in USA
Suggested citation: Hanson, C., J. Ranganathan, C. Iceland, and J. Finisdore. 2012. The Corporate Ecosystem Services Review: Guidelines for Identifying Business Risks and Opportunities Arising from Ecosystem Change. Version 2.0. Washington, DC: World Resources Institute.


world resources institute – wri10 G Street, NE (Suite 800), Washington DC 20002, United StatesTel: +1 202 729 76 00, Fax: +1 202 729 76 10 Web: www.wri.org
meridian institutePO Box 1829, 105 Village Place, Dillon CO 80435, United StatesTel: +1 888 775 83 40, Fax: +1 970 513 83 48 Web: www.merid.org
world Business Council for sustainable Development – wBCsD4, chemin de Conches, 1231 Conches-Geneva, SwitzerlandTel: +41 22 839 31 00, Fax: +41 22 839 31 31 Web: www.wbcsd.org ISBN-978-1-56973-785-9