the cost of not being christian: hindus, sikhs and muslims ...people.umass.edu/smodel/imr_36.pdf ·...
TRANSCRIPT
The Cost of Not Being Christian: Hindus, Sikhs and Muslims in Britain and CanadaAuthor(s): Suzanne Model and Lang LinSource: International Migration Review, Vol. 36, No. 4, Host Societies and the Reception ofImmigrants: Institutions, Markets and Policies (Winter, 2002), pp. 1061-1092Published by: The Center for Migration Studies of New York, Inc.Stable URL: http://www.jstor.org/stable/4149492Accessed: 21/12/2009 20:28
Your use of the JSTOR archive indicates your acceptance of JSTOR's Terms and Conditions of Use, available athttp://www.jstor.org/page/info/about/policies/terms.jsp. JSTOR's Terms and Conditions of Use provides, in part, that unlessyou have obtained prior permission, you may not download an entire issue of a journal or multiple copies of articles, and youmay use content in the JSTOR archive only for your personal, non-commercial use.
Please contact the publisher regarding any further use of this work. Publisher contact information may be obtained athttp://www.jstor.org/action/showPublisher?publisherCode=cmigrations.
Each copy of any part of a JSTOR transmission must contain the same copyright notice that appears on the screen or printedpage of such transmission.
JSTOR is a not-for-profit service that helps scholars, researchers, and students discover, use, and build upon a wide range ofcontent in a trusted digital archive. We use information technology and tools to increase productivity and facilitate new formsof scholarship. For more information about JSTOR, please contact [email protected].
The Center for Migration Studies of New York, Inc. is collaborating with JSTOR to digitize, preserve andextend access to International Migration Review.
http://www.jstor.org
The Cost of Not Being Christian: Hindus, Sikhs and Muslims in Britain and Canada Suzanne Model
Lang Lin
University ofMassachusetts
This article compares foreign born Hindus, Sikhs and Muslims to native born white Christians on four economic outcomes in two nations: Britain and Canada. For Canada, our data come from the 1991 Census, for Britain from the Fourth National Survey of Ethnic Minorities (1994). Theory and research lead us to predict that, ceterisparibus, non-Christians will fare bet- ter in Canada on three of the four outcomes. In the main, however, this expectation does not hold up. Compared to their British counterparts, Canada's Muslims fare less well on labor force participation and Canada's Hindus and Sikhs less well on unemployment. Compared to their Canadi- an counterparts, British Muslims fare less well on unemployment. On occupation and earnings, we detect no cross-national differences. To
explain the paucity of cross-national disparities, we draw on Reitz's argu- ment that Canada's reputation as an attractive immigrant destination has been exaggerated. To explain the few differences we do find, we emphasize cross-national differences in religious discrimination and our inability to control adequately for differences in sending countries.
In recent years, students of the economic attainment of immigrants have become increasingly interested in cross-national comparisons (Model et al., 1999; Reitz et al., 1999). Rather than examining different groups within a
single host society, they contrast similar groups in two or more societies. This new emphasis reflects both an increase in the number of immigrant destina- tions and an increase in the data available on immigrants within those desti- nations. To date, the most popular research strategy has been the U.S.-Cana- da comparison, with the occasional addition of Australia (Borjas, 1988; Baker and Benjamin, 1997; Card and Freeman, 1993; Chiswick, 1992; Reitz, 1998). The present inquiry takes cross-national comparison in a new direc- tion. We ask: what is the "cost" of being a non-Christian immigrant in a Christian nation (Siegel, 1965). More specifically, is the "cost" or penalty of
being Hindu, Sikh or Muslim greater in Canada or in England? A comparison of non-Christian trajectories in the old world versus the
new is certainly timely. For many years, Islamophobia or, as Halliday (1999)
? 2002 by the Center for Migration Studies of New York. All rights reserved. 0198-9183/02/3604.0140
IMR Volume 36 Number 4 (Winter 2002):1061-1092 1061
1062 INTERNATIONAL MIGRATION REVIEW
puts it, "anti-Muslimism" was known to be strong in Europe. But scholars are now uncovering the phenomenon in North America as well (Eck, 2000). The events of September 11th doubtless exacerbate this response. Sikhs too have occasionally been in the limelight, especially in the 1980s, when Sikh terrorists mounted an unsuccessful attempt to create an independent Punjab state.
Research on the economic consequences of membership in a non- Christian religion has been hampered by the dearth of data about religion. As a result, many scholars use birthplace as a proxy, a strategy that renders impos- sible a decision as to whether or not religion makes an independent contribu- tion to ethnic attainment. The present study utilizes the 1991 Canadian census and the 1994 Fourth National Survey of Ethnic Minorities in Britain, both of which contain a religion question. Limiting our inquiry to males, we compare foreign born Hindus, Sikhs and Muslims to native born Christian whites on labor force participation, unemployment status, occupational status and earn- ings in Canada and Britain. A later section of the article takes a look at the effects of religion separately within each country. Our main conclusion is that cross-national differences are few, but most groups experience at least one short- fall in each country.
THEORETICAL GROUNDING
To develop our hypotheses regarding which nation, Canada or Britain, offers foreign born non-Christians the more favorable environment, we draw upon a typology that Alejandro Portes and his colleagues developed with a cross- national perspective in mind, though it has not yet been used to inform com- parative research (Portes and Manning, 1986; Portes and Borocz, 1989; Portes and Rumbaut, 1996, 2001). The typology identifies three "contexts of reception" as critical for the economic incorporation of immigrants: govern- ment policy, labor market conditions and ethnic community characteristics. However, our focus motivates us to draw selectively from the typology as well as to add to it. For instance, under the rubric of government policy we emphasize official responses to discrimination, in contrast to Portes and Rumbaut (1996), who stress immigration law. Another difference is that we consider several variables under the rubric of labor market policy, whereas Portes and Rumbaut consider only one. Our extension includes indicators relevant to immigrant labor markets and indicators relevant to general labor markets. Finally, our evaluation of the effects of ethnic community charac- teristics follows Portes and Rumbaut quite closely.
We begin, like Portes and Rumbaut (1996), with government policy. But, the policy we consider central in deciding whether Canada or Britain
THE COST OF NOT BEING CHRISTIAN IN BRITAIN AND CANADA 1063
offers non-Christian immigrants the more cordial reception is not immigra- tion law, as Portes and Rumbaut would have it, but discrimination law. Both the United Kingdom and Canada offer comprehensive civil legislation that includes mechanisms of redress. Yet, we hypothesize that the Canadian sys- tem is the more effective, for four reasons. First, the Canadian law has a less
stringent standard of evidence than the British law. Second, the Canadian law
permits similar complaints filed by more than one individual to be dealt with
together, while under British law each case is considered on its own merits. Third, the Canadian government underwrites the cost of pursuing a com-
plaint; in Britain, financial aid is means tested and not always available even then. Fourth, the Canadian code explicitly forbids discrimination on the
grounds of religion; the British does not. For present purposes, this provision is central. To be sure, there are shortcomings in both nations' regulations. A common complaint is inadequate resources for pursuing complaints. Still,
compared to Britain, Canada has the stronger policy (de Beijl, 1995). The second context of reception Portes and Rumbaut (1996) identify is
labor market conditions. Under this rubric, their key variable is labor market discrimination, a factor we consider along with demographic and economic indicators. Portes and Rumbaut (1996:85) start by observing that ". .. wide-
spread discrimination may hold that certain groups should be confined to
low-wage menial labor ... or it can hold that they are simply too incompe- tent to be employable at all." In other words, gatekeepers do not devalue all outsiders equally; they construct a hierarchy of preference, ranking applicants from some backgrounds more favorably than others.
In the present instance, we are less interested in ethnic than religious discrimination. One of the few Canadian studies to take up this question is a
survey of attitudes toward immigrant groups, some of which were described
wholly in religious terms. In their 1991 survey, the Angus Reid group asked a sample of over 3,000 Canadians to assess "How comfortable would you feel
being around . . ." members of several immigrant groups. On a scale where 100 would be perfectly comfortable, here are some of the more intriguing scores: British 90.7; Italian 88.1; French 86.5; Jews 86; Chinese 84; West Indian Blacks 79.7; Arabs 74.9; Moslems 73.6; Indo Pakistanis 72 and Sikhs 68.8. Most relevant for present purposes, the disparity between Moslem and Sikh is statistically significant (t=6.7444, p<.0000).1 Unfortunately, the researchers neglected to inquire about Hindus.
1Calculations by the authors, who thank Richard Wanner for furnishing us with these data.
1064 INTERNATIONAL MIGRATION REVIEW
British data on this topic are also sparse; the data used in the present study, the Fourth National Study of Ethnic Minorities, offer some insights. Members of its white subsample were asked, successively, whether or not they were prejudiced against Asians, Muslims, Caribbeans and Chinese. Twenty-six percent of whites acknowledged being prejudiced against Asians, 25 percent against Muslims, 20 percent against Caribbeans and 8 percent against Chinese. This survey also asked all participants, minority or not, the open ended ques- tion "Of all the racial, ethnic and religious groups in Britain, against which do
you think there is the most prejudice?" The answer varied with the
ethnicity/religion of respondents. Among whites, 32.6 percent said "Asians," 10.6 percent "Muslims," 11.7 percent "Pakistanis" and 10.4 percent "Caribbeans." Less than one percent of whites selected "Sikhs" as experiencing the most prejudice, an assessment echoed by Sikhs. Taken together, these results
suggest that, to the extent that the British take account of religion, Muslims are the group most likely to encounter stigma. Evidently, the distinction between Muslims and Sikhs operates differently in Britain than Canada.
One reason for the difference may be that Britain was the setting for the infamous "Rushdie affair" in which the Ayotollah Khomeni issued a death threat against India-born British Muslim writer Salman Rushdie. To be sure, Sikhs have also been the recipients of unfavorable publicity, especially in the 1980s, when Sikh separatism on the subcontinent turned violent (Tatla, 1993). Yet, perhaps it was not this publicity that triggered the strong anti- Sikh sentiment recorded in the Canadian survey, but rather a struggle over the right of male Sikh adolescents to carry kirpahs (a dagger that carries ritu- al significance) in school. This was a debate that polarized the Peel School Board in suburban Toronto around the time of the survey described above
(Hudson, 1991; Lakey, 1991). To sum up, the surveys cited here suggest that the hierarchy of religious
discrimination may be different in the two countries. Yet, to understand the
implications of this hierarchy, it is also useful to consider the demographic composition of the labor force, especially group size. Calculations based on the 1991 Canadian census show that in Toronto, for instance, 1.0 percent of the male labor force is Sikh, 2.7 percent is Hindu, and 2.7 percent Muslim.
Analogous data for London are not available, but our tabulations based on the ethnic question in the 1991 UK census show Indians make up about 5
percent of London's male labor force; Pakistanis and Bangladeshis together comprise another 1.5 percent. These figures create queues consonant with the
expectation that Sikhs fare better in Britain than Canada and Muslims better
THE COST OF NOT BEING CHRISTIAN IN BRITAIN AND CANADA 1065
in Canada than Britain. But, because both minorities are small, it is unlike-
ly that the economic effect of the cross-national differences in their standing is large.
We turn now to a labor market condition that affects all workers, but which, we believe, has special potential to produce cross-national differences in the well-being of non-Christian immigrants: unemployment rates. Over the time period we examine, Canadians faced an unemployment rate of 9.4
percent; the British rate was 11.3 percent. These values imply that Canadian
employers had less discretion in hiring or promotion than their British coun-
terparts did. This difference is potentially important because, when labor markets are tight, employers are freer to indulge in discriminatory behavior than when labor markets are slack (Hodge, 1973). High unemployment rates, in turn, depress labor market participation. This phenomenon, called the "discouraged worker effect," occurs because job searches are costly. When individuals believe their chances of success are small, their propensity to search declines. Thus, the cross-national difference in unemployment rates
suggests minorities in Canada will have both higher labor force participation and lower unemployment than their British counterparts.
A similar structural effect impacts occupational and earnings attain- ment: the more unequal the occupational structure or the earnings distribu- tion, the greater the potential disadvantage for subordinate groups; the less
unequal the structure, the smaller the gap between subordinate and superor- dinate (Reitz, 1998; Blau and Kahn, 2000). Unfortunately, comparable data on the occupational structures of Canada and Britain are hard to come by because each country's official statistics define occupations differently. We draw on Esping-Andersen et al. (1993) cross-national comparison of occu-
pational polarization under Fordist and post-Fordist regimes in 1981. They define occupational polarization as the ratio of unskilled to upper white col- lar workers within each regime. Using their figures and collapsing Fordist and
post-Fordist regimes, we conclude that Canada has the more equitable occu-
pational structure. The ratio there is 2.09; in the UK it is 2.30.
Turning finally to cross-national differences in earnings inequality, we draw on Katz's (1998) measure: the log of the ratio of wages earned by men in the lowest decile to wages earned by men in the highest decile. In both 1989 and 1994, these ratios were higher in Canada than the UK; in other
words, Britain has the more equitable earnings distribution. To recapitulate, the effect of labor market structure is not identical
across outcomes. The earnings distribution is more favorable in Britain than
1066 INTERNATIONAL MIGRATION REVIEW
Canada; the occupational structure and the unemployment rate are more favorable in Canada than Britain. Since the latter also affects labor force par- ticipation, on three of the four job outcomes, the structural variables favor Canada.
The third and final "context of reception" that Portes and Rumbaut
(1996:87) identify is ethnic communities, in particular whether they exist at
all, and if so, whether ". .. they are composed primarily of manual workers or contain a significant professional or business element." The occupational standing of group members is important both because immigrants encounter discrimination and because they tend to rely on one another to find employ- ment. Thus, Portes and Rumbaut expect that newcomers with no compatri- ots to help them find work will be disadvantaged. Similarly, those joining compatriots who are mostly manual workers are likely to be incorporated into the labor market as manual workers, irrespective of their job qualifications. Newcomers joining communities with a significant professional component are likely to be introduced to jobs in professional services, though which
occupations they access will also depend on their credentials. Finally, new- comers entering ethnic communities containing a significant business ele- ment are likely to be incorporated as ethnic economy employees. Since the
job outcomes of self-employed ethnics and their co-ethnic employees do not
depend on the practices of native white employers, ethnic economies are par- ticularly valuable when the dominant economy is weak and/or discrimination is strong.
Attention to the history of the South Asian religious communities in Canada and Britain indeed uncovers some differences. Historically, the first to arrive in Canada in perceptible numbers were Sikhs, recruited at the turn of the last century to replace the newly outlawed Chinese and Japanese. Set-
tling primarily in British Columbia, the overwhelmingly male Sikh popula- tion worked primarily in the lumber industry. Between 1908 and 1967, a
variety of penalties and quotas restricted immigration from Asia. In 1967, the introduction of the point system nominally ended discrimination on the basis of national origin. Gupta (1994:62) explains, "With this new emphasis, the
immigration of professional South Asians to Canada increased, changing the size and character of the entire community." Yet, once underway, this "new" wave of immigrants doubtless stimulated the relocation of relatives, since the Canadian immigration system allocates at least some points on the basis of
kinship (Reitz, 1998). Moreover, in the mid-1970s, Canada accepted modest numbers of South Asian refugees from Africa, who doubtless derived some
benefit from the presence of their compatriots from the subcontinent. In
THE COST OF NOT BEING CHRISTIAN IN BRITAIN AND CANADA 1067
short, in Canada, connections between the pioneering generation and late-
twentieth-century migrants is relatively weak, but those arriving in the last 20 years have joined a well-established community.
In England, too, Sikhs were the first settlers from the subcontinent. Ini-
tiating settlement in the post World War I era, these pioneers were mainly craftsmen, most of whom became peddlers. However, England's post World War II labor shortage eventually drew most of them into durable manufac- turing. According to Hiro (1971:121), "This wage-earning community was later to prove to be the nucleus around which Indian immigration to Britain
grew" because, as economic and political conditions in India worsened, those with relatives or close friends in England were the most likely to emigrate. At first, the new states of India and Pakistan limited passport holders to the more educated and affluent. In 1960, however, the Supreme Court of India struck down this law. In response, the Indian government moved from a de jure to a defacto means of emigration control. It restricted access to foreign currency, a policy that reinforced the advantage of those with contacts in Britain. Yet, as some of the barriers to exit declined, new barriers to entry appeared. Britain passed its first immigration control act in 1962. To be sure, in the 1970s, the door opened briefly to admit African refugees of Indian descent, but, with this exception, the only applicants able to immigrate from the sub- continent in recent years have been those with close relatives in Britain.
To evaluate the impact of these disparate migration histories on immi- grant incorporation requires attending to the interaction between the job locations of earlier waves and the skills of later waves. In the British case, ear- lier waves held manual jobs; this meant that later arrivals, even if skilled, were
likely to follow their compatriots into the factory. And indeed, empirical research suggests this was so. More recently, recession has closed many Mid- lands factories, and Britain's South Asian population has turned increasingly to self-employment (Ballard, 1994). As in most countries, ethnic small busi- ness relies heavily on the labor power of kin. In the Canadian case, earlier waves held nonmanual jobs; this meant well-qualified later arrivals could
expect to work as professionals, the less qualified could expect to secure sup- port jobs. Taken together, these considerations suggest later arrivals to Cana- da have had channels to slightly better jobs than later arrivals to England.
This concludes our discussion of the many variables we associate with Portes and Rumbaut's three "contexts of reception." Now we use this mate- rial to predict which country will offer non-Christian immigrants the more
salutary environment. With respect to the policy context, the discussion indicates that the Canadian government is more strongly committed to the
1068 INTERNATIONAL MIGRATION REVIEW
protection of non-Christian immigrants than the British. Similarly, newcom- ers settling in Canada, most of whom arrived after the mid-1960s, probably entered more resourceful religious communities than newcomers settling in Britain more than a decade earlier. However, the labor market context con- tains a few variables that work to the British advantage. Probably the most
significant of these is the lower earnings inequality in the UK. Other things equal, stigmatized groups earn more in host societies where earnings inequal- ity is low than where it is high. Because we believe that structural factors are
among the more powerful determinants of economic attainment, we expect that the British advantage on this variable will overpower the more numerous variables on which Canada holds the edge. Thus, on earnings we associate a better outcome with Britain.
A second variable on which Britain emerges the more attractive is toler- ance for Sikhs. However, we choose to under-emphasize this finding, for two reasons. The first is the difficulty an outsider has in distinguishing a Sikh from a Hindu or from a Jain, for that matter. To be sure, some Sikhs wear tur- bans and carry daggers, but, in the West, such persons are rare. Thus, those Canadian employers with a "taste" for discrimination against Sikhs will have
difficulty indulging it. Second, in the absence of longitudinal data on Cana- dian attitudes, we cannot rule out the possibility that the low ranking of Sikhs was simply a reflection of intergroup tensions in suburban Toronto in 1991. Labor market disadvantage is rarely the outcome of brief antagonisms.
These considerations translate into the following hypotheses: ceteris
paribus, on labor force participation, unemployment and occupational status, the "cost" of being Sikh, Hindu or Muslim will be lower in Canada than in Britain; on earnings, however, the "cost" will be lower in Britain.
Unfortunately, meeting the "ceteris paribus" condition is difficult because of a multitude of confounding factors. Below, we identify and discuss the most salient of these, all of which originate in sending countries. Like their counterparts operating in receiving countries, these sending-country traits can be classified under three causal rubrics: ethno-religious traditions (culture), family resources, and the selectivity of migration.
We define ethno-religious tradition as similar values, attitudes and behaviors of individuals of a given ethno-religious heritage, regardless of socioeconomic status (Light, 1984; DiMaggio, 1994). As a first approxima- tion at controlling for ethno-religious heritage, we compare groups that are religiously similar but have settled in different destinations (Reitz, 1998). To take into account the potential effects of national origin, we control for birth-
THE COST OF NOT BEING CHRISTIAN IN BRITAIN AND CANADA 1069
place. Unfortunately, most non-Christians in Britain are South Asian but non-Christians in Canada come from a wide range of countries. This is an
especially nettlesome problem in the case of Muslims because South Asia is one of many regions where Islam holds sway. Yet another problem is that cul- ture interacts with context. For example, discrimination tends to exacerbate
religious zeal. Thus, at least one analysis of Muslims in Britain argues that fundamentalism has gained adherents in response to British intolerance of Islam (Gardner and Shukur, 1994). This insight implies that, if prejudice is
greater in the UK than Canada, controlling for a Muslim affiliation in Britain has a different meaning than controlling for a Muslim affiliation in Canada.
Yet, the religious effects that we seek to control are those that affect eco- nomic behavior. Only if some intra-religious differences in religious practices produce variations in people's motivation to work or to maximize earnings are
they relevant to the present undertaking. The first scholar to raise these issues was Max Weber. His analysis of the religions of India showed that some Hindu castes were more successful capitalist competitors than others (Weber, 1958). Today, some scholars challenge the accuracy of Weber's sources, oth- ers the logic of his argument (Huff and Schluchter, 1999). Nevertheless, caste is associated with occupation. Some castes are entrepreneurial, others spe- cialize in a craft or a profession. Islam too incorporates a variety of econom- ic adaptations. Ismaili Muslims are known for their exceptional ability to raise capital for business enterprise, other Muslim denominations are handi-
capped in this regard (Nanji, 1983; Rafig, 1992). These considerations imply that we should control for self-employment and occupation whenever possi- ble. Still, statistical controls are only partial remedies; moreover, self-employ- ment and occupation are inappropriate in models of labor force participation and unemployment. To be sure, omitted variables always plague statistical
analysis; the best we can do is remain mindful of them. The same problem arises with respect to "family resources." Our defin-
ition of "family resources" parallels Nee and Sanders' (2001) description of
immigrant families as purveyors of "social, financial and cultural-human cap- ital" with one exception: we classify cultural capital as a cultural rather than a family resource. Family resources include social capital (links to the resources of others), human capital (knowledge and skills) and financial cap- ital (wealth). Since our data include no measures of family background, our main control for these resources is education. But the educational advantage of Canadian South Asians relative to British South Asians, as well as the
greater skill barriers associated with admission to Canada suggest that non-
Christian Canadians have the relatively more prosperous family origins.
1070 INTERNATIONAL MIGRATION REVIEW
Again, this would be a cross-national difference that we cannot adequately con- trol.
The final, origin-based source of variation in immigrant attainment is the
selectivity of migration. By this term we mean the unobserved traits that dis-
tinguish migrants from non-migrants. Selectivity can be positive or negative; that is, movers may be more or less talented, more or less diligent than stayers. Debates regarding the determinants of selectivity have been shrill. Traditional
demographic theory holds that economically motivated movers are positively selected; on the other hand, persons fleeing natural disaster or persecution "... may not be selected at all" (Lee, 1966:56). Recent scholarship suggests that
sojourners, tied migrants (those who move to join family members) and undoc- umented migrants are also less positively selected than economic migrants (Chiswick, 1999; Duleep and Regets, 1999). According to economist George Borjas (1994), the positively selected also include people persecuted because
they are members of a professional or entrepreneurial class and people settling in nations where earnings inequality is high, relative to the countries from which they emigrated.
These considerations are complex, but we conjecture that they are unlike-
ly to translate into large differences between Canada and England. In the main, non-Christian immigrants, especially the males, are economic migrants. Both countries house some African Indian refugees, most of whom, before migra- tion, were entrepreneurs. The proportion of undocumented non-Christians is
likely to be small, but perhaps larger in Canada - where large scale immigration has been underway for nearly four decades - than in England, where entry for non-EU nationals is difficult. At the same time, the proportion of sojourners - or persons expecting to return home - is likely somewhat greater in England, where many South Asians settled "temporarily." Pakistanis and Bangladeshis especially have clung to this "myth of return," but few do so before retirement; others arrange for their bodies to be shipped home for burial (Anwar, 1979; Gardner and Shukur, 1994). To sum up, countercurrents run in both direc- tions, but we believe that the great majority of both countries' immigrants are
positively selected, economically motivated movers.
Assessing these considerations together, we suspect that the factor most
likely to contaminate our cross-national comparison is variation in social class
background. The bulk of migrants from South Asia to Canada probably have more advantageous social origins than their British counterparts. Controlling for education diminishes but does not eliminate the problem, as scholarship on status attainment has long shown. We know of no way to redress this imbalance save to attend to it when interpreting our results.
THE COST OF NOT BEING CHRISTIAN IN BRITAIN AND CANADA 1071
DATA AND METHODS
For Canada, the data come from the 1991 Public Use Microdata File of Indi- viduals (PUMFI), a three percent sample drawn from the Canadian census of that year and, for Britain, from the Fourth National Survey of Ethnic Minori- ties (NSEM). The NSEM, which covers England and Wales, was undertaken
by the Policy Studies Institute in 1994. It is less representative than a census- based sample because it does not cover the entire population and because it has a lower response rate than censuses do. Of those successfully contacted, 79 percent of minority households and 71 percent of households headed by British whites participated in the NSEM (Smith and Prior, 1996). Moreover, since the absolute size of the NSEM sample (7,949 individuals) is much smaller than the PUMFI sample (809,654 individuals), many ethnic minori- ties are simply too few in the NSEM to support reliable estimates.
For this reason, the non-Christians that receive primary attention on the British side of the analysis are Hindus, Sikhs and Muslims born either on the Indian subcontinent or Africa. Moreover, nearly all of the Africa-born in the NSEM are ethnically South Asian. In Canada, on the other hand, the Africa-born include substantial numbers of Maghrebis (North Africans) and sub-Saharan Blacks, along with persons whose origins lie on the subconti- nent. The Canadian data include a number of other categories that contain
enough persons to support analysis, though the codes used to identify these
groups are disappointingly broad. In terms of religion, there are sufficient
Jews and Buddhists; in terms of birthplace, in addition to European coun-
tries, the data distinguish the Middle East, South Asia, Hong Kong, the PRC, the Philippines, Vietnam, Other Asia, Africa, Latin America and a residual Other category. Finally, the Canadian data contain an ethnicity question. Although it is coded very crudely and some of its categories overlap with
birthplace - it permits the analyst to distinguish "Arabs" from "South Asians" and "West Asians" - a distinction relevant to our analysis of the Africa-born.
Unfortunately, the ethnicity question assigns some sub-Saharan blacks to a "Black/Caribbean" ethnic code and others to a residual "Other single origins" code; hence, we cannot unambiguously identify sub-Saharan Blacks among the Africa-born.
In order to render the two data sets as comparable as possible, we deal with these many discrepancies by creating five religious categories - Hindus, Sikhs, Muslims, Christians and "Other" - and four birthplace categories - South Asia, Africa, Britain/Canada, and "Other." In our multivariate analy- ses, we omit Christians and Britain/Canada, a strategy that allows us to mea-
1072 INTERNATIONAL MIGRATION REVIEW
sure the difference between being a member of a minority religion or nation-
ality relative to being a native-born Christian. In order to assure that this con- trast is limited to white people, we delete from our analysis all native-born Christians of non-European origin.
There are a few other limitations and changes in the Canadian data that deserve mention. First, with respect to the PUMFI, in order to keep the
analysis of manageable size, native-born European-origin whites were sam-
pled at 2 percent. All other groups were retained in their entirety. Second, for reasons of confidentiality, the codes for cases coming from the Atlantic Provinces and the Territories do not distinguish among non-Christian reli-
gions. Residents of these regions were therefore excluded from the study. Having described our sample, we turn next to our dependent and inde-
pendent variables, some of which are also problematic. Four dependent vari- ables are used in this research: labor force participation, unemployment, occu-
pational status and the log of weekly earnings. Labor force participation is coded one if the individual is in the labor force - employed or unemployed, zero otherwise; unemployment is coded one if the individual is unemployed, zero if employed. Non-labor force participants are missing on this variable. For
occupational status, we rely on Treiman's International Socio-Economic Index
(ISEI). Although a translation scheme is available for assigning an occupation- al status to each of the 333 occupational categories in the NSEM, no such scheme is available for the PUMFI. Equally problematic, the PUMFI divides
occupation into only 14 categories. Thus, we had to devise a method for assign- ing each of these 14 categories a status score. Following Ganzeboom et al. (1992) observation that "the costs of being crude" are severe only when the number of occupations falls below six, we computed weighted average ISEIs for each of the 14 Canadian occupations. Calculating these averages required three
pieces of information: the detailed occupational codes associated with each of the 14 categories (Statistics Canada, 1994), the title of and number of persons in each detailed occupational code (Statistics Canada, 1995), and the ISEI score for each occupational title (Ganzeboom and Treiman, 1996). To facilitate the
mapping process, we used Ganzeboom and Treiman's "numerical dominance rule." That is, when a detailed Canadian occupational code contained titles associated with more than one ISEI, the Canadian occupation was assigned the ISEI of its largest title. After each of the 14 occupations had been assigned all its component ISEIs, we weighted the ISEIs by the number of their incum- bents. Each individual then was assigned an ISEI equal to the weighted average associated with his PUMFIs occupation.
THE COST OF NOT BEING CHRISTIAN IN BRITAIN AND CANADA 1073
Finally, with respect to earnings, there is a paucity of cases in the NSEM. Only 79 percent of employed sample members reported their earn-
ings. As a result, only 94 Sikhs, the smallest religious group, appear in the
earnings analysis. Nothing can be done about this shortfall save to acknowl-
edge it when interpreting the results. A similar, less worrisome difficulty plagues the cross-national strategy, namely that the number of cases missing on the dependent variables is not the same in Canada and Britain. Consider, for instance, unemployment; 13.3 percent of the British sample and 11.4 per- cent of the Canadian sample are missing on this outcome; i.e., they are not in the labor force. Neo-classical economists believe that jobless individuals are
disproportionately the less qualified and the less diligent. If this is so, then the men appearing on the British side of a British-Canadian comparison involv-
ing labor force participants will constitute a more positively selected sample than those appearing on the Canadian side. This disparity, in turn, might lead to an overestimate of the attainment of British workers relative to Canadian.
Economists have developed several techniques to correct for this "sam-
ple selection bias." When estimating unemployment, occupational status and
earnings, we estimate a preliminary equation that distinguishes missing from
non-missing cases on these three dependent variables. This equation allows us to calculate the inverse Mills ratio, a variable that "controls" for the effects of selection bias. Interestingly, the Mills ratio is significant in the unemployment and earnings models but not in the occupational status models. This is prob- ably because we ignore labor force status when analyzing occupational status; that is, any worker who reports an occupation is included in our efforts to
predict occupational status, whether or not he is currently working. The independent variables include human capital measures, indicators
of family responsibilities, descriptions of regional characteristics, dummies for
birthplace and dummies for religion. Details about their construction appear in Appendix A. Information regarding which independent variables predict which dependent variables, as well as regarding which independent variables
produce which inverse Mills ratios, appears in Appendix B. Both in order to simplify the analysis and because female labor force
participation is relatively low among foreign born Muslims, the analysis is limited to males. Those Muslim immigrant women who report employment are a highly select group - an issue that deserves detailed analysis in its own
right. Because of the shortage of cases in the NSEM, all men age 21 to 64 (rather than the more customary 25 to 64) are included. The analytic strate-
gy is simple. For each dependent variable, a regression for Canada and a
regression for England is estimated. The coefficients of the dummies for the
1074 INTERNATIONAL MIGRATION REVIEW
religion variables in the two nations are then compared. Because labor force
participation and unemployment are dichotomous, we use logistic regression to estimate these models. This means that cross-national comparisons must be done cautiously; the coefficients generated by separate logistic regression models may be confounded by residual variation. Thus, we use Allison's (1999) method for testing whether or not an adjustment for residual varia- tion is appropriate, and when it is, we test for coefficient differences using his interactive approach rather than the standard Wald chi square test. On the other hand, we use ordinary least squares regression in our occupational sta- tus and earnings models; thus a simple t-test can be used to test for cross- national differences between coefficients.
RESULTS
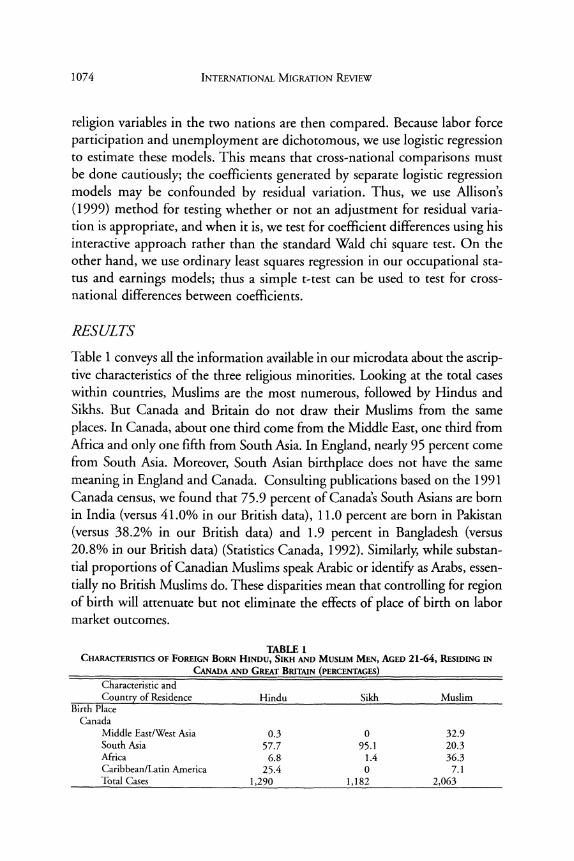
Table 1 conveys all the information available in our microdata about the ascrip- tive characteristics of the three religious minorities. Looking at the total cases within countries, Muslims are the most numerous, followed by Hindus and Sikhs. But Canada and Britain do not draw their Muslims from the same
places. In Canada, about one third come from the Middle East, one third from Africa and only one fifth from South Asia. In England, nearly 95 percent come from South Asia. Moreover, South Asian birthplace does not have the same
meaning in England and Canada. Consulting publications based on the 1991 Canada census, we found that 75.9 percent of Canada's South Asians are born in India (versus 41.0% in our British data), 11.0 percent are born in Pakistan (versus 38.2% in our British data) and 1.9 percent in Bangladesh (versus 20.8% in our British data) (Statistics Canada, 1992). Similarly, while substan- tial proportions of Canadian Muslims speak Arabic or identify as Arabs, essen-
tially no British Muslims do. These disparities mean that controlling for region of birth will attenuate but not eliminate the effects of place of birth on labor market outcomes.
TABLE 1 CHARACTERISTICS OF FOREIGN BORN HINDU, SIKH AND MUSLIM MEN, AGED 21-64, RESIDING IN
CANADA AND GREAT BRITAIN (PERCENTAGES) Characteristic and Country of Residence Hindu Sikh Muslim
Birth Place Canada
Middle East/West Asia 0.3 0 32.9 South Asia 57.7 95.1 20.3 Africa 6.8 1.4 36.3 Caribbean/Latin America 25.4 0 7.1 Total Cases 1,290 1,182 2,063
THE COST OF NOT BEING CHRISTIAN IN BRITAIN AND CANADA 1075
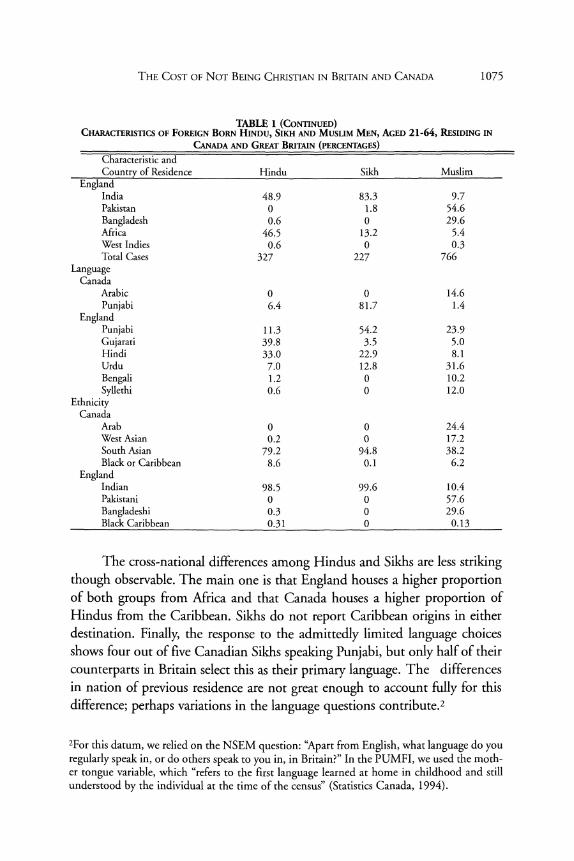
TABLE 1 (CONTINUED) CHARACTERISTICS OF FOREIGN BORN HINDU, SIKH AND MUSLIM MEN, AGED 21-64, RESIDING IN
CANADA AND GREAT BRITAIN (PERCENTAGES) Characteristic and Country of Residence Hindu Sikh Muslim
England India 48.9 83.3 9.7 Pakistan 0 1.8 54.6 Bangladesh 0.6 0 29.6 Africa 46.5 13.2 5.4 West Indies 0.6 0 0.3 Total Cases 327 227 766
Language Canada
Arabic 0 0 14.6 Punjabi 6.4 81.7 1.4
England Punjabi 11.3 54.2 23.9 Gujarati 39.8 3.5 5.0 Hindi 33.0 22.9 8.1 Urdu 7.0 12.8 31.6 Bengali 1.2 0 10.2 Syllethi 0.6 0 12.0
Ethnicity Canada
Arab 0 0 24.4 West Asian 0.2 0 17.2 South Asian 79.2 94.8 38.2 Black or Caribbean 8.6 0.1 6.2
England Indian 98.5 99.6 10.4 Pakistani 0 0 57.6 Bangladeshi 0.3 0 29.6 Black Caribbean 0.31 0 0.13
The cross-national differences among Hindus and Sikhs are less striking though observable. The main one is that England houses a higher proportion of both groups from Africa and that Canada houses a higher proportion of Hindus from the Caribbean. Sikhs do not report Caribbean origins in either destination. Finally, the response to the admittedly limited language choices shows four out of five Canadian Sikhs speaking Punjabi, but only half of their
counterparts in Britain select this as their primary language. The differences in nation of previous residence are not great enough to account fully for this difference; perhaps variations in the language questions contribute.2
2For this datum, we relied on the NSEM question: "Apart from English, what language do you regularly speak in, or do others speak to you in, in Britain?" In the PUMFI, we used the moth- er tongue variable, which "refers to the first language learned at home in childhood and still understood by the individual at the time of the census" (Statistics Canada, 1994).
1076 INTERNATIONAL MIGRATION REVIEW
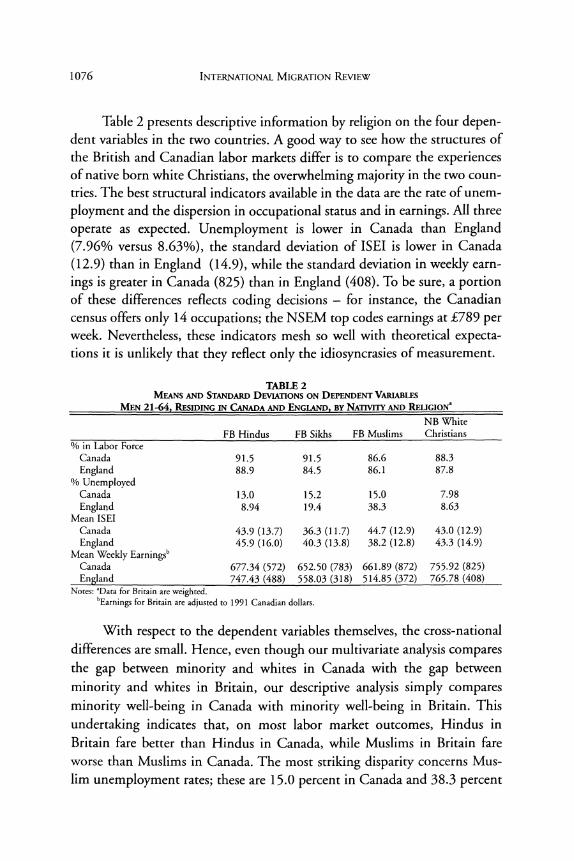
Table 2 presents descriptive information by religion on the four depen- dent variables in the two countries. A good way to see how the structures of the British and Canadian labor markets differ is to compare the experiences of native born white Christians, the overwhelming majority in the two coun- tries. The best structural indicators available in the data are the rate of unem-
ployment and the dispersion in occupational status and in earnings. All three
operate as expected. Unemployment is lower in Canada than England (7.96% versus 8.63%), the standard deviation of ISEI is lower in Canada
(12.9) than in England (14.9), while the standard deviation in weekly earn-
ings is greater in Canada (825) than in England (408). To be sure, a portion of these differences reflects coding decisions - for instance, the Canadian census offers only 14 occupations; the NSEM top codes earnings at ?789 per week. Nevertheless, these indicators mesh so well with theoretical expecta- tions it is unlikely that they reflect only the idiosyncrasies of measurement.
TABLE 2 MEANS AND STANDARD DEVIATIONS ON DEPENDENT VARIABLES
MEN 21-64, RESIDING IN CANADA AND ENGLAND, BY NATIVITY AND RELIGIONa
NB White FB Hindus FB Sikhs FB Muslims Christians
% in Labor Force Canada 91.5 91.5 86.6 88.3 England 88.9 84.5 86.1 87.8
% Unemployed Canada 13.0 15.2 15.0 7.98 England 8.94 19.4 38.3 8.63
Mean ISEI Canada 43.9 (13.7) 36.3 (11.7) 44.7 (12.9) 43.0 (12.9) England 45.9 (16.0) 40.3 (13.8) 38.2 (12.8) 43.3 (14.9)
Mean Weekly Earningsb Canada 677.34 (572) 652.50 (783) 661.89 (872) 755.92 (825) England 747.43 (488) 558.03 (318) 514.85 (372) 765.78 (408)
Notes: "Data for Britain are weighted. bEarnings for Britain are adjusted to 1991 Canadian dollars.
With respect to the dependent variables themselves, the cross-national differences are small. Hence, even though our multivariate analysis compares the gap between minority and whites in Canada with the gap between
minority and whites in Britain, our descriptive analysis simply compares minority well-being in Canada with minority well-being in Britain. This
undertaking indicates that, on most labor market outcomes, Hindus in Britain fare better than Hindus in Canada, while Muslims in Britain fare worse than Muslims in Canada. The most striking disparity concerns Mus- lim unemployment rates; these are 15.0 percent in Canada and 38.3 percent
THE COST OF NOT BEING CHRISTIAN IN BRITAIN AND CANADA 1077
in Britain. The Sikh comparison yields mixed results: labor force participa- tion, unemployment and earnings are more favorable in Canada, occupa- tional status is more favorable in Britain. This last finding surprised us. Given Canada's immigration policy, we assumed a goodly proportion of its South Asians would be upper-white-collar workers. Returning to the data, we found that slightly over one third of Sikhs in both countries work in manufacturing. In Canada, however, Sikhs are also over-represented in agriculture and in
transport, while in England their largest concentration, after manufacturing, is retail trade. Doubtless, historical differences in the characteristics of the
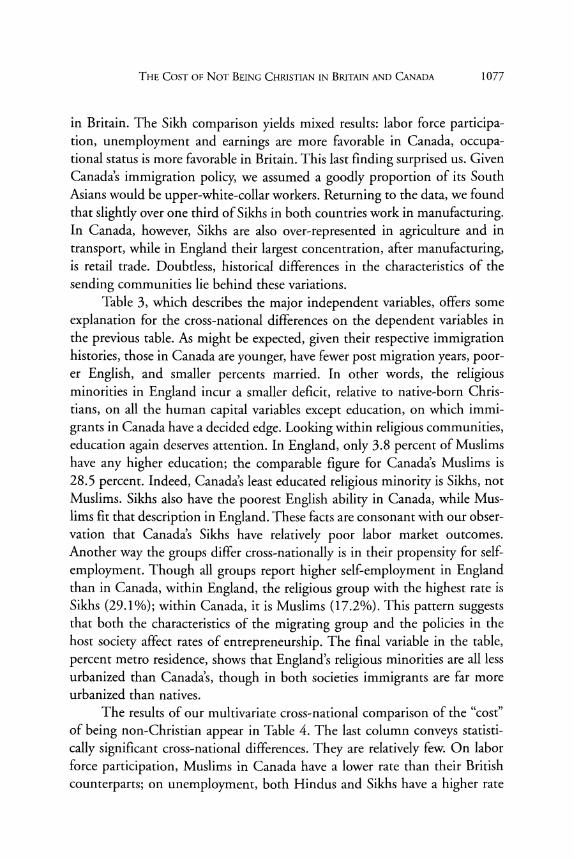
sending communities lie behind these variations. Table 3, which describes the major independent variables, offers some
explanation for the cross-national differences on the dependent variables in the previous table. As might be expected, given their respective immigration histories, those in Canada are younger, have fewer post migration years, poor- er English, and smaller percents married. In other words, the religious minorities in England incur a smaller deficit, relative to native-born Chris- tians, on all the human capital variables except education, on which immi-
grants in Canada have a decided edge. Looking within religious communities, education again deserves attention. In England, only 3.8 percent of Muslims have any higher education; the comparable figure for Canada's Muslims is 28.5 percent. Indeed, Canada's least educated religious minority is Sikhs, not Muslims. Sikhs also have the poorest English ability in Canada, while Mus- lims fit that description in England. These facts are consonant with our obser- vation that Canada's Sikhs have relatively poor labor market outcomes. Another way the groups differ cross-nationally is in their propensity for self-
employment. Though all groups report higher self-employment in England than in Canada, within England, the religious group with the highest rate is Sikhs (29.1%); within Canada, it is Muslims (17.2%). This pattern suggests that both the characteristics of the migrating group and the policies in the host society affect rates of entrepreneurship. The final variable in the table,
percent metro residence, shows that England's religious minorities are all less urbanized than Canada's, though in both societies immigrants are far more urbanized than natives.
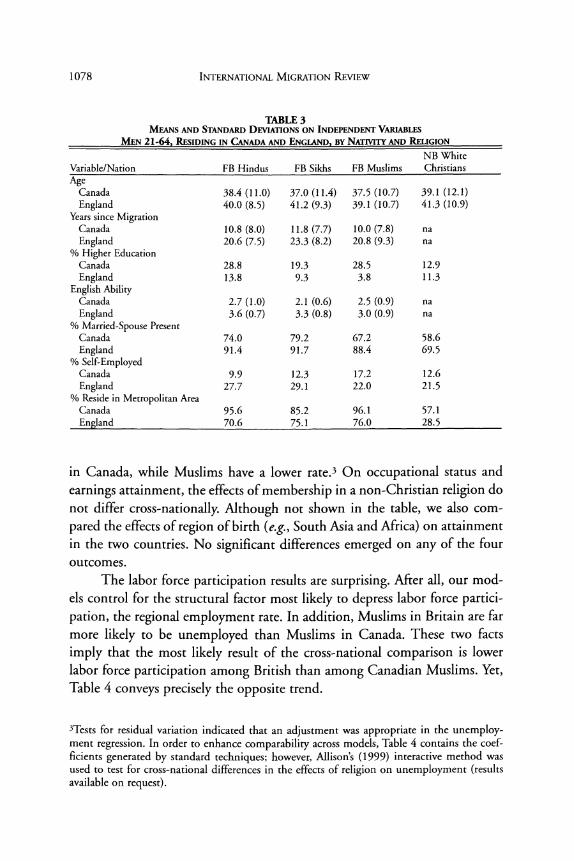
The results of our multivariate cross-national comparison of the "cost" of being non-Christian appear in Table 4. The last column conveys statisti-
cally significant cross-national differences. They are relatively few. On labor force participation, Muslims in Canada have a lower rate than their British
counterparts; on unemployment, both Hindus and Sikhs have a higher rate
1078 INTERNATIONAL MIGRATION REVIEW
TABLE 3 MEANS AND STANDARD DEVIATIONS ON INDEPENDENT VARIABLES
MEN 21-64, RESIDING IN CANADA AND ENGLAND, BY NATIVITY AND RELIGION
NB White Variable/Nation FB Hindus FB Sikhs FB Muslims Christians Age
Canada 38.4 (11.0) 37.0 (11.4) 37.5 (10.7) 39.1(12.1) England 40.0 (8.5) 41.2 (9.3) 39.1 (10.7) 41.3 (10.9)
Years since Migration Canada 10.8 (8.0) 11.8 (7.7) 10.0 (7.8) na England 20.6 (7.5) 23.3 (8.2) 20.8 (9.3) na
% Higher Education Canada 28.8 19.3 28.5 12.9 England 13.8 9.3 3.8 11.3
English Ability Canada 2.7 (1.0) 2.1 (0.6) 2.5 (0.9) na England 3.6 (0.7) 3.3 (0.8) 3.0 (0.9) na
% Married-Spouse Present Canada 74.0 79.2 67.2 58.6 England 91.4 91.7 88.4 69.5
% Self-Employed Canada 9.9 12.3 17.2 12.6 England 27.7 29.1 22.0 21.5
% Reside in Metropolitan Area Canada 95.6 85.2 96.1 57.1 England 70.6 75.1 76.0 28.5
in Canada, while Muslims have a lower rate.3 On occupational status and
earnings attainment, the effects of membership in a non-Christian religion do not differ cross-nationally. Although not shown in the table, we also com-
pared the effects of region of birth (e.g., South Asia and Africa) on attainment in the two countries. No significant differences emerged on any of the four outcomes.
The labor force participation results are surprising. After all, our mod- els control for the structural factor most likely to depress labor force partici- pation, the regional employment rate. In addition, Muslims in Britain are far more likely to be unemployed than Muslims in Canada. These two facts
imply that the most likely result of the cross-national comparison is lower labor force participation among British than among Canadian Muslims. Yet, Table 4 conveys precisely the opposite trend.
3Tests for residual variation indicated that an adjustment was appropriate in the unemploy- ment regression. In order to enhance comparability across models, Table 4 contains the coef- ficients generated by standard techniques; however, Allison's (1999) interactive method was used to test for cross-national differences in the effects of religion on unemployment (results available on request).
THE COST OF NOT BEING CHRISTIAN IN BRITAIN AND CANADA 1079
TABLE 4 NET EFFECTS OF BIRTH PLACE AND RELIGION ON THREE LABOR MARKET
OUTCOMES IN CANADA AND ENGLAND
DV/Nation/ Canadian English A Religion Coefficient Coefficient parametera
Labor Force Participation South Asia -0.8532c -1.0153 0.215 Africa -1.0435c -1.2654 0.304 Hindu 0.0498 0.5209 -0.925 Sikh 0.1357 -0.1185 0.442 Muslim -0.3829c 0.8318 -2.291a
Unemployment South Asia 1.5903C -0.3015 0.34 Africa 1.4629C -0.7473 1.00 Hindu 0.1691 0.1403 8.60b Sikh 0.3311a 0.1782 5.10a Muslim 0.4457c 1.7401C -7.56b
Occupational Status South Asia -0.5048 0.2993 -0.341 Africa -0.8953 3.1338 -0.923 Hindu 0.0581 -1.6361 1.030 Sikh -4.8869c -4.3425c -0.313 Muslim -0.6228 -2.6629 1.158
Log of Weekly Earnings South Asia -0.5466c -0.8054c 1.671 Africa -0.5235c -0.7468c 1.542 Hindu -0.0403 0.0779 -1.402 Sikh 0.0842a -0.0446 1.242 Muslim -0.0741b -0.0455 -0.316
Notes: ap<.05 bp<.01 Cp<.001 dIn models of unemployment, the A parameter is chi square; in all other models, it is the t statistic.
Of course, labor market variables are not the only determinants of labor force participation. Supply-side factors represent another source of variation. One potentially relevant supply-side factor is denomination; as pointed out earlier, there are significant variations in beliefs and practices within faiths. Yet, we know of no theory that posits differences in Muslims' propensity to work by denomination. A more plausible supply-side factor is the selectivity of migration. We anticipated that most migrants in both countries were eco-
nomically motivated settlers. However, this assumption might require amendment, especially if a higher proportion of Canada's than England's Muslims are refugees. Not only do theorists consider refugees less positively selected than economically motivated movers, but refugees are eligible for benefits that most other migrants cannot receive. Although detailed figures of
refugees by religion, ethnicity or nationality are rare, Canada appears to
accept more refugees than Britain (Employment and Immigration Canada, 1991; NIDI, 1994). To be consonant with our results, a refugee-based expla-
1080 INTERNATIONAL MIGRATION REVIEW
nation must show that the key cross-national difference is religion, not national origin.
To test these ideas, we constructed interaction terms in the Canadian data between being Muslim and reporting Arab, South Asian, West Asian or Black/Caribbean "ethnicity." When added to the regression, two of these were
significant: West Asian Muslims were less likely to be in the labor force and Black/Caribbean Muslims were more likely. According to the PUMFI docu-
mentation, West Asian ethnicity includes Afghanis, Armenians, Iranians, Israelis, Kurds and Turks; Black/Caribbean includes Caribbean backgrounds as well as Ghanians, African Blacks and Blacks, but not Ethiopians or Soma- lis - the two major sources of African refugees. While these regional categories seem arbitrary, they do suggest that West Asian Muslims are an important source of the difference in labor force participation in the two countries, an
interpretation we verified by re-estimating the cross-national comparison without West Asians. Still, we cannot be sure that a disproportion of refugees is the reason for the low labor force participation of Canada's West Asian Muslims. At this point, we can only say that this group is less likely to par- ticipate.
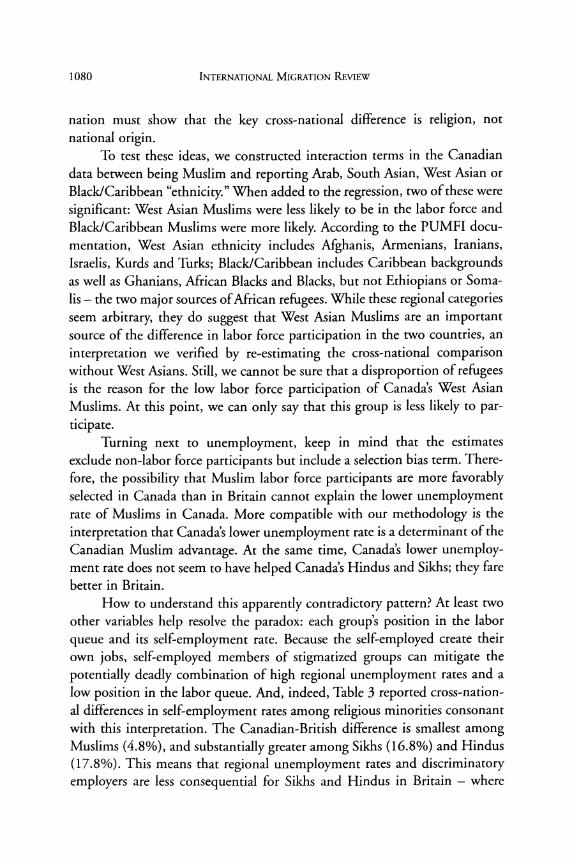
Turning next to unemployment, keep in mind that the estimates exclude non-labor force participants but include a selection bias term. There-
fore, the possibility that Muslim labor force participants are more favorably selected in Canada than in Britain cannot explain the lower unemployment rate of Muslims in Canada. More compatible with our methodology is the
interpretation that Canada's lower unemployment rate is a determinant of the Canadian Muslim advantage. At the same time, Canada's lower unemploy- ment rate does not seem to have helped Canada's Hindus and Sikhs; they fare better in Britain.
How to understand this apparently contradictory pattern? At least two other variables help resolve the paradox: each group's position in the labor
queue and its self-employment rate. Because the self-employed create their own jobs, self-employed members of stigmatized groups can mitigate the
potentially deadly combination of high regional unemployment rates and a low position in the labor queue. And, indeed, Table 3 reported cross-nation- al differences in self-employment rates among religious minorities consonant with this interpretation. The Canadian-British difference is smallest among Muslims (4.8%), and substantially greater among Sikhs (16.8%) and Hindus
(17.8%). This means that regional unemployment rates and discriminatory employers are less consequential for Sikhs and Hindus in Britain - where
THE COST OF NOT BEING CHRISTIAN IN BRITAIN AND CANADA 1081
nearly 30 percent are self-employed - than in Canada where around 10 per- cent are self-employed.
Furthermore, the survey research described earlier suggests that white
employers rank Sikhs at the bottom of the labor queue in Canada but not in Britain. We initially dismissed this finding, perhaps prematurely. One reason for our hesitation was the suspicion that Canadian employers cannot distin-
guish Sikhs from Hindus or Jains. An admittedly flawed way of examining this assumption is to compare the magnitude of the Canadian religion coef- ficients. This exercise reveals that the Sikh and Hindu unemployment coeffi- cients are not statistically different from one another (chi sq. = 1.46, p =
0.226), nor are the Sikh and Muslim unemployment coefficients statistical-
ly different from one another (chi sq.=0.64, p=0.424). Thus, to the extent that the religion coefficients convey employer attitudes - an admitted simpli- fication - the position of Sikhs in the Canadian labor queue is about the same as the position of other non-Christians. To sum up, Hindus and Sikhs suffer more unemployment in Canada than Britain because they are less often self-
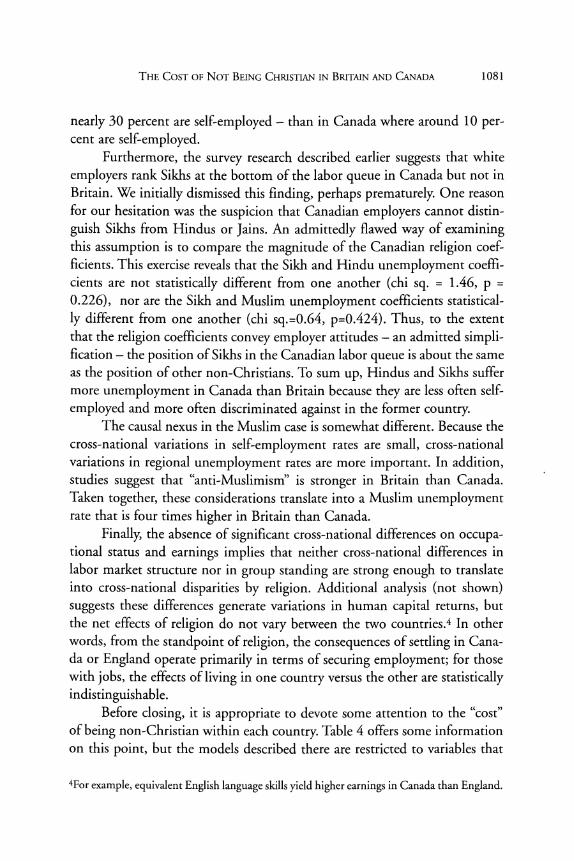
employed and more often discriminated against in the former country. The causal nexus in the Muslim case is somewhat different. Because the
cross-national variations in self-employment rates are small, cross-national variations in regional unemployment rates are more important. In addition, studies suggest that "anti-Muslimism" is stronger in Britain than Canada. Taken together, these considerations translate into a Muslim unemployment rate that is four times higher in Britain than Canada.
Finally, the absence of significant cross-national differences on occupa- tional status and earnings implies that neither cross-national differences in labor market structure nor in group standing are strong enough to translate into cross-national disparities by religion. Additional analysis (not shown) suggests these differences generate variations in human capital returns, but the net effects of religion do not vary between the two countries.4 In other words, from the standpoint of religion, the consequences of settling in Cana- da or England operate primarily in terms of securing employment; for those with jobs, the effects of living in one country versus the other are statistically indistinguishable.
Before closing, it is appropriate to devote some attention to the "cost" of being non-Christian within each country. Table 4 offers some information on this point, but the models described there are restricted to variables that
4For example, equivalent English language skills yield higher earnings in Canada than England.
1082 INTERNATIONAL MIGRATION REVIEW
appear in both data sets. Moving away from cross-national comparison allows us to include all theoretically relevant variables. Of course, we remain con- strained by the available measures; thus, in the Canadian data we cannot dis-
aggregate South Asia or Africa into its components. Our main refinement is to add four dummies for ethnic group membership, again highly aggregated. They are Black/Caribbean, Arab, South Asian and West Asian. Though some of these ethnicities are highly correlated with birthplace, they are only mod-
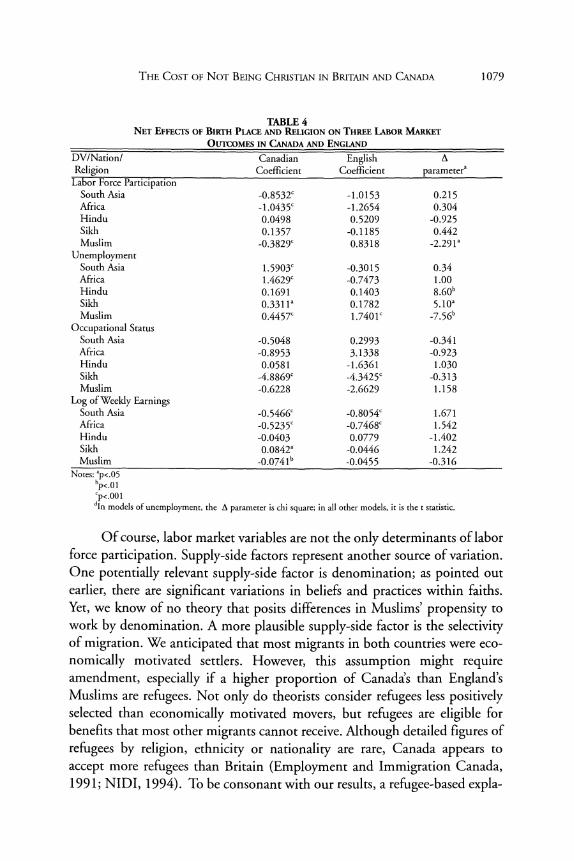
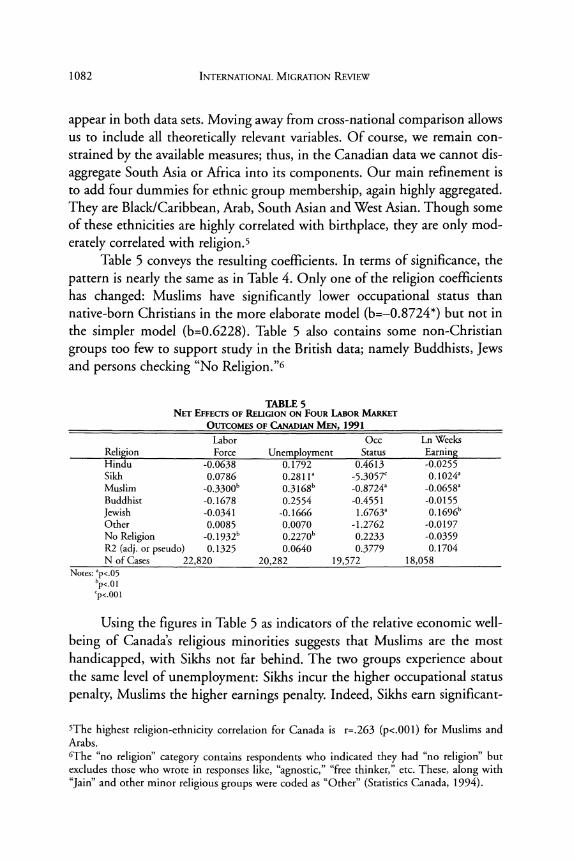
erately correlated with religion.5 Table 5 conveys the resulting coefficients. In terms of significance, the
pattern is nearly the same as in Table 4. Only one of the religion coefficients has changed: Muslims have significantly lower occupational status than native-born Christians in the more elaborate model (b=-0.8724*) but not in the simpler model (b=0.6228). Table 5 also contains some non-Christian
groups too few to support study in the British data; namely Buddhists, Jews and persons checking "No Religion."6
TABLE 5 NET EFFECTS OF RELIGION ON FOUR LABOR MARKET
OUTCOMES OF CANADIAN MEN, 1991
Labor Occ Ln Weeks Religion Force Unemployment Status Earning Hindu -0.0638 0.1792 0.4613 -0.0255 Sikh 0.0786 0.2811a -5.3057c 0.1024a Muslim -0.3300b 0.3168b -0.8724a -0.0658' Buddhist -0.1678 0.2554 -0.4551 -0.0155 Jewish -0.0341 -0.1666 1.6763a 0.1696b Other 0.0085 0.0070 -1.2762 -0.0197 No Religion -0.1932b 0.2270b 0.2233 -0.0359 R2 (adj. or pseudo) 0.1325 0.0640 0.3779 0.1704 N of Cases 22,820 20,282 19,572 18,058
Notes: ap<.05
bp<.01 Cp<.001
Using the figures in Table 5 as indicators of the relative economic well-
being of Canada's religious minorities suggests that Muslims are the most
handicapped, with Sikhs not far behind. The two groups experience about the same level of unemployment: Sikhs incur the higher occupational status
penalty, Muslims the higher earnings penalty. Indeed, Sikhs earn significant-
5The highest religion-ethnicity correlation for Canada is r=.263 (p<.001) for Muslims and Arabs. 6The "no religion" category contains respondents who indicated they had "no religion" but excludes those who wrote in responses like, "agnostic," "free thinker," etc. These, along with "Jain" and other minor religious groups were coded as "Other" (Statistics Canada, 1994).
THE COST OF NOT BEING CHRISTIAN IN BRITAIN AND CANADA 1083
ly more than native white Christians with similar characteristics. To further
explore the reason for this result, we re-estimated the earnings equation with- out controlling for occupational status. With this variable deleted, Sikhs no
longer register a net earnings advantage; the effects of membership in the other religious groups, however, remain the same. In other words, Sikhs take
up occupations for which they are overqualified, but within those occupa- tions they earn somewhat more than similarly qualified native white Chris- tians.
Turning to the remaining minority religions, we find that all four labor market outcomes of Hindus and Buddhists are the same as native white
Christians; Jews have slightly higher occupational status and earnings - a
finding reported before - and men with "no religion" appear both less likely to work and more likely to be unemployed. This last result suggests that the
irreligious have greater employment problems than the religious, but because the category excludes "atheists," "agnostics," etc., further research is needed before this interpretation should be accepted.
Our last step is to estimate elaborated models for Britain. The data per- mit an extension of geography - hence, instead of five regions, we use seven and we disaggregate South Asia into India, Pakistan and Bangladesh. In addi-
tion, we created five ethnic dummies: Black, Indian, Pakistani, Bangladeshi and Other. Again, these are highly correlated with birthplace but only mod-
erately with religion.7 We aggregated the smaller religious groups into an "Other" category; those not supplying a religion are among the "missing" on this variable and we exclude them from the analysis.
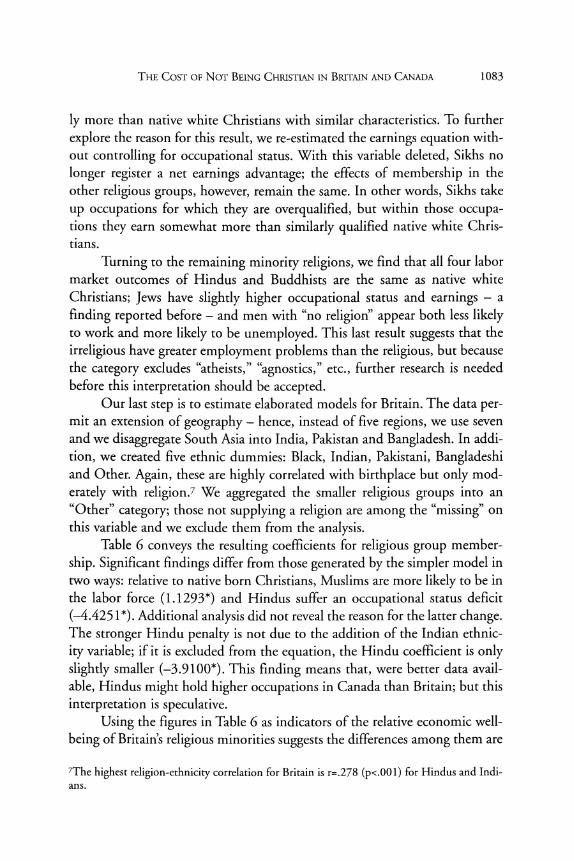
Table 6 conveys the resulting coefficients for religious group member-
ship. Significant findings differ from those generated by the simpler model in two ways: relative to native born Christians, Muslims are more likely to be in the labor force (1.1293*) and Hindus suffer an occupational status deficit
(-4.4251*). Additional analysis did not reveal the reason for the latter change. The stronger Hindu penalty is not due to the addition of the Indian ethnic-
ity variable; if it is excluded from the equation, the Hindu coefficient is only slightly smaller (-3.9100*). This finding means that, were better data avail- able, Hindus might hold higher occupations in Canada than Britain; but this
interpretation is speculative. Using the figures in Table 6 as indicators of the relative economic well-
being of Britain's religious minorities suggests the differences among them are
7The highest religion-ethnicity correlation for Britain is r=.278 (p<.001) for Hindus and Indi- ans.
1084 INTERNATIONAL MIGRATION REVIEW
TABLE 6 NET EFFECTS OF RELIGION ON FOUR LABOR MARKET
OUTCOMES OF BRITISH MEN, 1994
Labor Occ Ln Weeks Religion Force Unemployment Status Earning
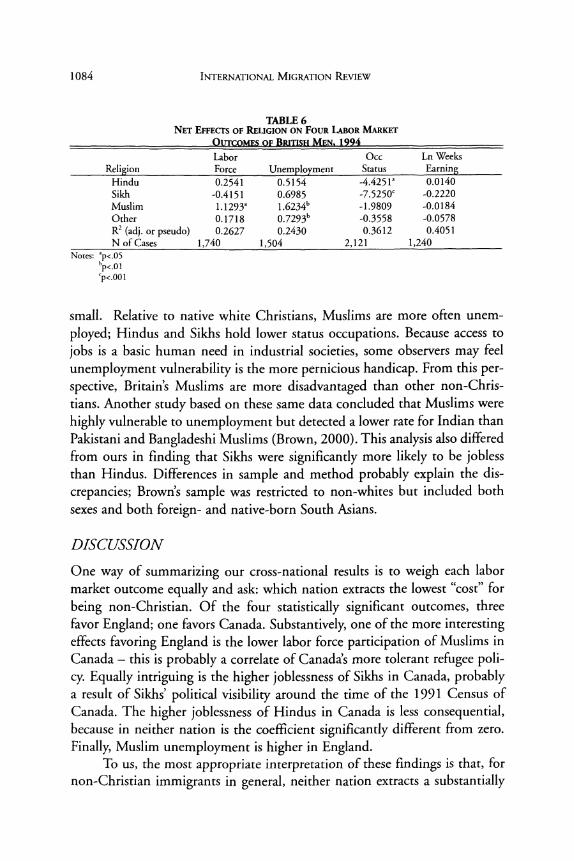
Hindu 0.2541 0.5154 -4.4251 0.0140 Sikh -0.4151 0.6985 -7.5250' -0.2220 Muslim 1.1293a 1.6234b -1.9809 -0.0184 Other 0.1718 0.7293b -0.3558 -0.0578 R2 (adj. or pseudo) 0.2627 0.2430 0.3612 0.4051 N of Cases 1,740 1,504 2,121 1,240
Notes: ap<.05
bp<.01 cp<.001
small. Relative to native white Christians, Muslims are more often unem-
ployed; Hindus and Sikhs hold lower status occupations. Because access to
jobs is a basic human need in industrial societies, some observers may feel
unemployment vulnerability is the more pernicious handicap. From this per- spective, Britain's Muslims are more disadvantaged than other non-Chris- tians. Another study based on these same data concluded that Muslims were
highly vulnerable to unemployment but detected a lower rate for Indian than Pakistani and Bangladeshi Muslims (Brown, 2000). This analysis also differed from ours in finding that Sikhs were significantly more likely to be jobless than Hindus. Differences in sample and method probably explain the dis-
crepancies; Brown's sample was restricted to non-whites but included both sexes and both foreign- and native-born South Asians.
DISCUSSION
One way of summarizing our cross-national results is to weigh each labor market outcome equally and ask: which nation extracts the lowest "cost" for
being non-Christian. Of the four statistically significant outcomes, three favor England; one favors Canada. Substantively, one of the more interesting effects favoring England is the lower labor force participation of Muslims in Canada - this is probably a correlate of Canada's more tolerant refugee poli- cy. Equally intriguing is the higher joblessness of Sikhs in Canada, probably a result of Sikhs' political visibility around the time of the 1991 Census of Canada. The higher joblessness of Hindus in Canada is less consequential, because in neither nation is the coefficient significantly different from zero. Finally, Muslim unemployment is higher in England.
To us, the most appropriate interpretation of these findings is that, for non-Christian immigrants in general, neither nation extracts a substantially

THE COST OF NOT BEING CHRISTIAN IN BRITAIN AND CANADA 1085
greater "cost" than the other. This is a surprise. We had hypothesized that, with the exception of earnings, Canada would prove the more rewarding host
society. Several political, economic and historical conditions prompted this conclusion; for instance, Canada's more stringent anti-discrimination law, its lower unemployment rate, its more modest occupational disparities, the high- er proportion of professionals among its South Asians. Indeed, we worried that our inability to control for the potentially more affluent family back-
grounds of Canada's South Asians would bias the results in Canada's favor. As already pointed out, one mechanism that seems to have undercut
these Canadian advantages is discrimination against Sikhs. We too quickly discounted the intolerance toward Sikhs that Canadians reported to Angus Reid. This would not have surprised experts on the Bogardus Social Distance Scale, which has long detected a relationship between political events and
public perceptions of immigrants and minorities (Schaefer, 1998). Were
Angus Reid to survey Canadians in the immediate post-September 11 era, Muslims would doubtless emerge the most stigmatized non-Christian reli-
gious minority. Still, Sikh disadvantage represents but one departure from our expecta-
tions. The overall pattern of our results - no significant differences by reli-
gion for occupation and earnings; no significant differences by region of birth on any of the four outcomes - implies that our theory was misspecified. In
explaining these disparities, we turn to the work of Jeffrey Reitz (1988a, b). In his comparisons of Canada and Britain as immigrant receiving soci-
eties, Reitz argues that Canada appears the more welcoming but that appear- ances are deceiving. By appearances he means that, in Canada, racist dis- course is muted and overt racial conflict is rare; whereas in Britain, public fig- ures are willing to assail foreigners and race riots appear endemic. Yet, when
comparing levels of racial discrimination rather than levels of rhetoric or con- flict, Reitz finds little difference between the two countries. For instance, field studies show about the same proportion of non-whites experience hiring dis- crimination in Britain as in Canada. Indices of segregation in housing are likewise quite similar. Reitz maintains that one reason the differences between the two countries are more apparent than real is that the goal of immigration has been very different in the two societies. "For Britain, non-white immi-
gration occurred in the context of the obligations of a declining imperial power to former colonial territories. For Canada, non-white immigration was a trend within the context of a long-term program of national development." (1988a:117). Another cross-national difference that attenuates inter-group conflict in Canada is that its newcomers are relatively skilled. Perceptible
1086 INTERNATIONAL MIGRATION REVIEW
inflows of unskilled workers tend to trigger discontent in most societies. Reitz's perspective suggests we re-evaluate some of the variables we
found supportive of Canadian advantage. For instance, although Canada has the more effective anti-discrimination law, Reitz believes that the practical effects of the difference are modest. In both countries, complaints must be initiated by individuals, not governments; in both countries, the goal of the
legislation is conciliation not coercion. Other assessments suggest that the crucial legislative distinction is whether or not discrimination is a civil
offense, as it is in both Canada and Britain, or a criminal offense, as it is in France. Civil offenses are considered more congenial to the filing of suits and the securing of redress than are criminal offenses (Banton, 1994).
A second variable deserving of scrutiny is the ethnic community con- text. Following Portes and Rumbaut (1996), we concluded that recent arrivals to Canada would benefit from the high proportion of their co-reli-
gionists in the professions, whereas, in Britain, most later arrivals were hand-
icapped in finding good jobs because most of their compatriots were factory workers. Recall, however, that by the late 1970s, political and economic events in Britain brought the closing of many factories. Moreover, by the
1980s, the Thatcher government launched several initiatives to support small businesses. These structural changes, combined with cultural traditions of
entrepreneurship, enhanced the ability of British ethnic and religious com- munities to absorb labor. Canada, too, has seen its manufacturing decline and its services increase. But its South Asians have been less entrepreneurial than Britain's. This may reflect differences in the two host countries' approach to small business or differences in the castes and denominations of the South Asians settling in the two countries. An additional factor is that Canada's South Asian small-business sector faces more competition from other entre-
preneurial groups, for example, Chinese and Vietnamese, than do Britain's South Asians. This re-evaluation suggests that substantial resources inhere in both nations' ethno-religious communities.
Nevertheless, we are unwilling to abandon the idea that general labor market indicators, such as unemployment rates, occupational structure and
earnings distributions are relevant to cross-national comparisons of minority attainment. Regional unemployment rates did contribute substantively to our understanding of cross-national differences in unemployment; occupa- tional and earnings differences did not operate as predicted. At least in part, the failure was due to our methodology, which was limited to a comparison of dummy variables for religion. As suggested by footnote 3, since the effects
THE COST OF NOT BEING CHRISTIAN IN BRITAIN AND CANADA 1087
of occupational and earnings distributions are mediated through human cap- ital, a better way to measure these effects is to compare returns to human cap- ital within groups between countries. This could be done by estimating sep- arate equations by country and group or by adding interactions between human capital and group membership in each country. Either way, these rep- resent potential next steps in cross-national research on immigrant incorpo- ration, whether that research focuses on the "cost" of national origin or of
religion. In closing, a comment on the value of Portes and Rumbaut's typology
of immigrant incorporation as a tool for cross-national comparison. The
typology directs attention to three contexts: governments, labor markets and ethnic communities. We concur that these are the appropriate contexts to
highlight; yet, the typology emphasizes only one variable within each. While this formulation may be adequate for explaining between-group variance within one nation, it is not adequate for explaining within-group variance in two or more nations. In this study, the labor market context proved the rubric of expansion. However, depending on the research question, the government context and/or the ethnic community context might also profit from expan- sion. For instance, citizenship rules might prove a useful addition to the gov- ernment context; sex ratios might prove a useful addition to the ethnic com-
munity context. Clearly, cross-national research on immigrant attainment is on the rise; scholars are increasingly in need of theoretical guidance. The Portes and Rumbaut typology has much to offer in this regard; with addi- tional refinement, it may offer even more.
1088 INTERNATIONAL MIGRATION REVIEW
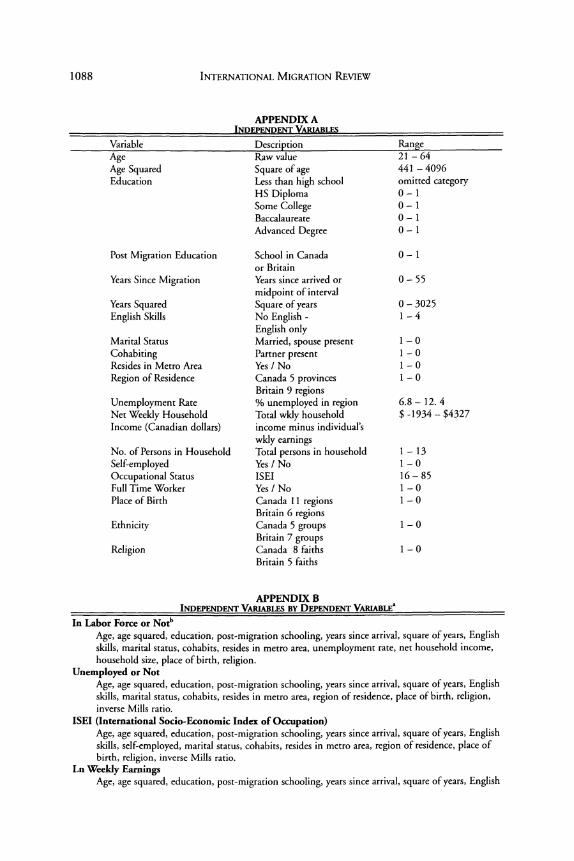
APPENDIX A INDEPENDENT VARIABLES
Variable Description Range Age Raw value 21 - 64 Age Squared Square of age 441 - 4096 Education Less than high school omitted category
HS Diploma 0- 1 Some College 0 - 1 Baccalaureate 0- 1 Advanced Degree 0 - 1
Post Migration Education School in Canada 0 - 1 or Britain
Years Since Migration Years since arrived or 0 - 55 midpoint of interval
Years Squared Square of years 0 - 3025 English Skills No English - 1 - 4
English only Marital Status Married, spouse present 1 - 0 Cohabiting Partner present 1 - 0 Resides in Metro Area Yes / No 1 - 0
Region of Residence Canada 5 provinces 1 - 0 Britain 9 regions
Unemployment Rate % unemployed in region 6.8- 12.4 Net Weekly Household Total wkly household $ -1934 - $4327 Income (Canadian dollars) income minus individual's
wkly earnings No. of Persons in Household Total persons in household 1 - 13 Self-employed Yes / No 1 -0
Occupational Status ISEI 16 - 85 Full Time Worker Yes / No 1 - 0 Place of Birth Canada 11 regions 1 - 0
Britain 6 regions Ethnicity Canada 5 groups 1 - 0
Britain 7 groups Religion Canada 8 faiths 1 - 0
Britain 5 faiths
APPENDIX B INDEPENDENT VARIABLES BY DEPENDENT VARIABLEa
In Labor Force or Notb Age, age squared, education, post-migration schooling, years since arrival, square of years, English skills, marital status, cohabits, resides in metro area, unemployment rate, net household income, household size, place of birth, religion.
Unemployed or Not Age, age squared, education, post-migration schooling, years since arrival, square of years, English skills, marital status, cohabits, resides in metro area, region of residence, place of birth, religion, inverse Mills ratio.
ISEI (International Socio-Economic Index of Occupation) Age, age squared, education, post-migration schooling, years since arrival, square of years, English skills, self-employed, marital status, cohabits, resides in metro area, region of residence, place of birth, religion, inverse Mills ratio.
Ln Weekly Earnings Age, age squared, education, post-migration schooling, years since arrival, square of years, English
THE COST OF NOT BEING CHRISTIAN IN BRITAIN AND CANADA 1089
skills, self-employed, ISEI, fulltime, marital status, cohabits, resides in metro area, region of resi- dence, place of birth, religion, inverse Mills ratio.
Notes: aCross-national models contain five regions, four birthplaces and four religions. Within-nation models contain the maximum number of regions, birthplaces, religions and ethnicities for each nation. bThis specification was also used to predict 'missing or not' on unemployment, occupational status and earnings. The results of these models provide the basis for calculating the inverse Mills ratios for the associated dependent
REFERENCES Allison, P D. 1999 "Comparing Logit and Probit Coefficients Across Groups," Sociological Methods and
Research, 28:186-208.
Anwar, M. 1979 The Myth ofReturn: Pakistanis in Britain. London: Heinemann.
Baker, M. and D. Benjamin 1997 "Ethnicity, Foreign Birth and Earnings: A Canada/U.S. Comparison." In Transition
and Structural Change in the North American Labour Market. Ed. M. G. Abbott, C. M. Beach and R. P. Chaykowski. Kingston, Ontario: John Deutsch Institute and Industri- al Relations Centre, Queens College.
Ballard, R. 1994 "Differentiation and Disjunction Among the Sikhs." In Desh Pardesh: The South Asian
Presence in Britain. Ed. R. Ballard. London: Hurst & Company. Banton, M. 1994 Discrimination. Buckingham: Open University Press.
Blau, E D. and L. W. Kahn 2000 "Gender Differences in Pay," The Journal of Economic Perspectives, 14(4):75-99.
Borjas, G. J. 1994 "The Economics of Immigration," Journal ofEconomic Literature, 32:1667-1717.
1988 International Differences in the Labor Market Performance of Immigrants. Kalamazoo, MI: W. E. Upjohn Institute.
Brown, M. S. 2000 "Religion and Economic Activity in the South Asian Population," Ethnic and Racial
Studies, 23(6):1035-1061. Card, D. and R. Freeman, eds. 1993 Small Differences That Matter: Labor Markets and Income Maintenance in Canada and
the United States. Chicago: University of Chicago. Chiswick, B. R., ed. 1992 Immigration, Language and Ethnicity: Canada and the United States. Washington: AEI
Press.
Chiswick, B. R. 1999 "Are Immigrants Favorably Self-Selected?," American Economic Review, 89(2):181-185. de Beijl, R. Z. 1995 "Labour Market Integration and Legislative Measures to Combat Discrimination
Against Migrant Workers." In The Integration ofMigrant Workers in the Labour Market: Policies and Their Impact. International Migration Papers 8. Geneva: International Labour Office.
1090 INTERNATIONAL MIGRATION REVIEW
DiMaggio, P. 1994 "Culture and Economy." In The Handbook of Economic Sociology. Ed. N. Smelser and
R. Swedberg. Princeton: Princeton University Press.
Duleep, H. O. and M. C. Regets 1999 "Immigrants and Human Capital Investment," American Economic Review,
89(2):186-191.
Eck, D. L. 2001 A New Religious America. San Francisco: HarperSanFrancisco.
Employment and Immigration Canada 1991 Immigration Statistics 1990. Minister of Supply and Services Canada.
Esping-Andersen, G., Z. Assimakopoulou and K. van Kersbergen 1993 "Trends in Contemporary Class Structuration: A Six Nation Comparison." In Chang-
ing Classes. Ed. G. Esping-Andersen. London: Sage. Ganzeboom, H. B. G., P. M. De Graaf and D. J. Treiman 1992 "A Standard Socio-Economic Index of Occupational Status," Social Science Research,
21:1-56.
Ganzeboom, H. B. G. and D. J. Treiman 1996 "Internationally Comparable Measures of Occupational Status for the 1988 Interna-
tional Standard of Classification of Occupations," Social Science Research, 25:201-236.
Gardner, K. and A. Shukur 1994 "I'm Bengali, I'm Asian, and I'm Living Here." In Desh Pardesh: The South Asian Pres-
ence in Britain. Ed. R. Ballard. London: Hurst & Company.
Gupta, T. D. 1994 "Political Economy of Gender, Race, and Class: Looking at South Asian Immigrant
Women in Canada," Canadian Ethnic Studies, 26(1):59-73.
Halliday, E 1999 "'Islamophobia' Reconsidered," Ethnic and Racial Studies, 22(5):892-902.
Hiro, D. 1971 Black British, White British. London: Eyre and Spottiswoode.
Hodge, R. W. 1973 "Toward a Theory of Racial Differences in Employment," Social Forces, 52:16-31.
Hudson, K. 1991 "Parents Seek Compromise on School Kirpah Ruling," Toronto Star. April 11. P. W8.
Huff, T. E. and W. Schluchter, eds. 1999 Max Weber and Islam. New Brunswick, NJ: Transaction.
Katz, L. E 1998 "Commentary: The Distribution of Income in Industrialized Countries." In Income
Inequality: Issues and Policy Options. Kansas City: Federal Reserve Bank of Kansas City.
Lakey, J. 1991 "Five Arrested As Two Rival Factions Battle for Control at Sikh Temple." Toronto Star.
April 8. P. A7. Lee, E. S. 1966 "A Theory of Migration," Demography, 3(1):47-57.
THE COST OF NOT BEING CHRISTIAN IN BRITAIN AND CANADA 1091
Light, I. 1984 "Immigrant and Ethnic Enterprise in North America," Ethnic and Racial Studies,
7(2):195-216.
Model, S., G. Fisher and R. Silbermann 1999 "Black Caribbeans in Comparative Perspective," Journal of Ethnic and Migration Stud-
ies, 25(2):187-212.
Nanji, A. 1983 "The Nizari Ismaili Muslim Community in North America: Background and Develop-
ment." In The Muslim Community in America. Ed. E. H. Waugh, B. Abu-Laban and R. B. Qureshi. Calgary: University of Alberta Press.
Nee, V. and J. Sanders 2001 "Understanding the Diversity of Immigrant Incorporation," Ethnic and Racial Studies,
24(3):386-411. Netherlands Interdisciplinary Demographic Institute 1994 Asylum-Seekers and Refugees: A Statistical Report. Luxembourg: Office for Official Pub-
lications of the European Communities.
Portes, A. and J. Borocz 1989 "Contemporary Immigration: Theoretical Perspectives on Its Determinants and Modes
of Incorporation," International Migration Review, 23(3):606-627. Portes, A. and R. D. Manning 1986 "The Immigrant Enclave: Theory and Empirical Examples." In Competitive Ethnic
Relations. Ed. S. Olzak and J. Nagel. Orlando, FL: Academic.
Portes, A. and R. G. Rumbaut 2001 Legacies. Berkeley: University of California Press.
1996 Immigrant America: A Portrait (2nd edition). Berkeley: University of California Press.
Rafig, M. 1992 "Ethnicity and Enterprise: A Comparison of Muslim and Non-Muslim Owned Asian
Businesses in Britain," New Community, 19(1):43-60. Reitz, J. G. 1998 Warmth of the Welcome. Boulder, CO: Westview.
1988a "The Institutional Structure of Immigration As a Determinant of Inter-Racial Compe- tition: A Comparison of Britain and Canada," International Migration Review, 22(1):117-146.
1988b "Less Racial Discrimination in Canada, or Simply Less Racial Conflict?: Implications of Comparisons With Britain," Canadian Public Policy, 14(4):424-441.
Reitz, J. G., J. Frich, T. Calabrese and G. Wagner 1999 "The Institutional Framework of Ethnic Employment Disadvantage: A Comparison of
Germany and Canada," Journal ofEthnic and Migration Studies, 25(3):397-443. Schaefer, R. T.
Racial and Ethnic Groups (7th edition). New York: Longman. Siegel, P 1965 "On the Cost of Being a Negro," Sociology Inquiry, 35:41-57.
1092 INTERNATIONAL MIGRATION REVIEW
Smith, P. and G. Prior 1996 The Fourth National Survey ofEthnic Minorities. London: Social and Community Plan-
ning Research.
Statistics Canada 1995 Occupation According to the 1991 Standard Occupational Classification. 1991 Census
Technical Reports: Reference Products Series. Ottawa: Minister of Industry, Science and
Technology.
1994 User Documentation for Public Use Microdata File on Individuals. 1991 Census of Cana- da. Ottawa: Statistics Canada.
1992 Immigration and Citizenship, 1991 Census of Canada. Ottawa: Supply and Services Canada.
Tatla, D. S. 1993 "The Punjab Crisis and Sikh Mobilisation in Britain." In Religion and Ethnicity: Social
Change in the Metropolis. Ed. R. Barot. Kampen, The Netherlands: Kok Pharos.
Weber, M. 1958 The Religion ofIndia. Ed. and translators, H. Gerth and D. Martindale. Glencoe, Illi-
nois: The Free Press.