the daft.ie rental report - c0.dmstatic.com fileintroduction by ronan lyons, assistant professor of...
TRANSCRIPT
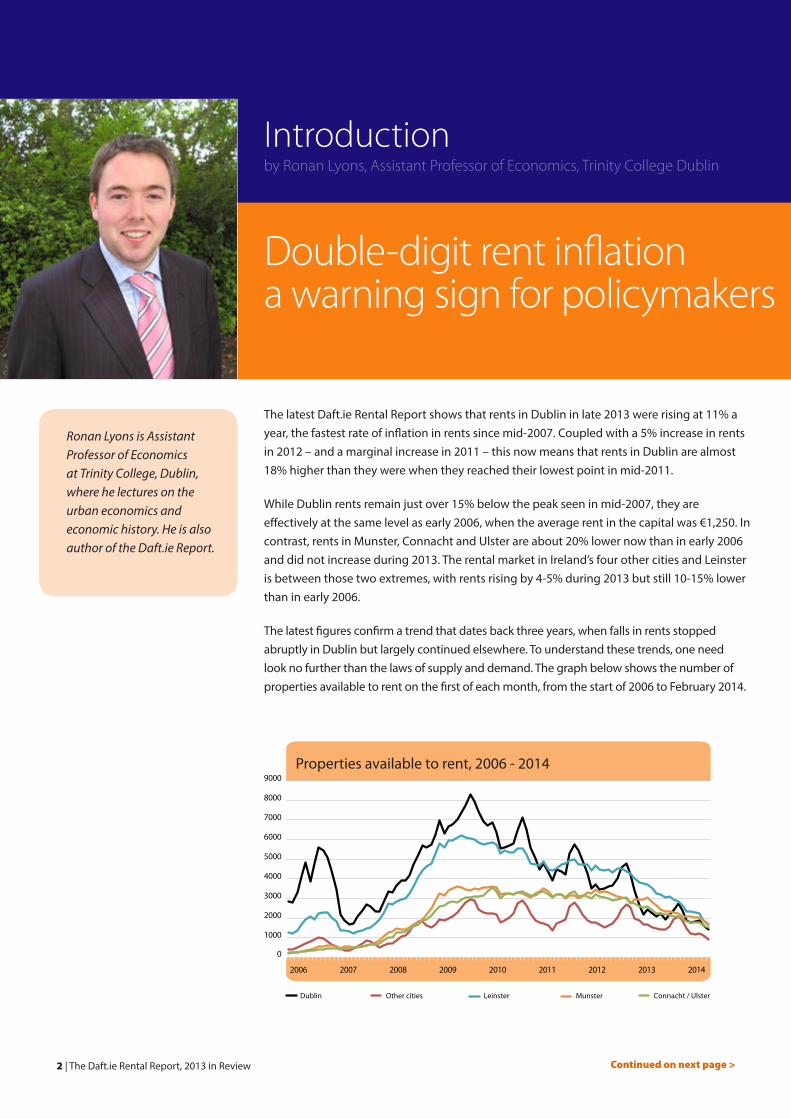
Introduction by Ronan Lyons, Assistant Professor of Economics, Trinity College Dublin
The Daft.ie Rental ReportAn analysis of recent trends in the Irish rental market
2013 in Review
Introductionby Ronan Lyons, Assistant Professor of Economics, Trinity College Dublin
Double-digit rent inflation a warning sign for policymakers
2 | The Daft.ie Rental Report, 2013 in Review
The latest Daft.ie Rental Report shows that rents in Dublin in late 2013 were rising at 11% a year, the fastest rate of inflation in rents since mid-2007. Coupled with a 5% increase in rents in 2012 – and a marginal increase in 2011 – this now means that rents in Dublin are almost 18% higher than they were when they reached their lowest point in mid-2011.
While Dublin rents remain just over 15% below the peak seen in mid-2007, they are effectively at the same level as early 2006, when the average rent in the capital was €1,250. In contrast, rents in Munster, Connacht and Ulster are about 20% lower now than in early 2006 and did not increase during 2013. The rental market in Ireland’s four other cities and Leinster is between those two extremes, with rents rising by 4-5% during 2013 but still 10-15% lower than in early 2006.
The latest figures confirm a trend that dates back three years, when falls in rents stopped abruptly in Dublin but largely continued elsewhere. To understand these trends, one need look no further than the laws of supply and demand. The graph below shows the number of properties available to rent on the first of each month, from the start of 2006 to February 2014.
Continued on next page >
Ronan Lyons is Assistant Professor of Economics at Trinity College, Dublin, where he lectures on the urban economics and economic history. He is also author of the Daft.ie Report.
Connacht / UlsterMunsterLeinsterOther citiesDublin
Properties available to rent, 2006 - 2014
0
1000
2000
3000
4000
5000
6000
7000
8000
9000
2006 2007 2008 2009 2010 2011 2012 2013 2014
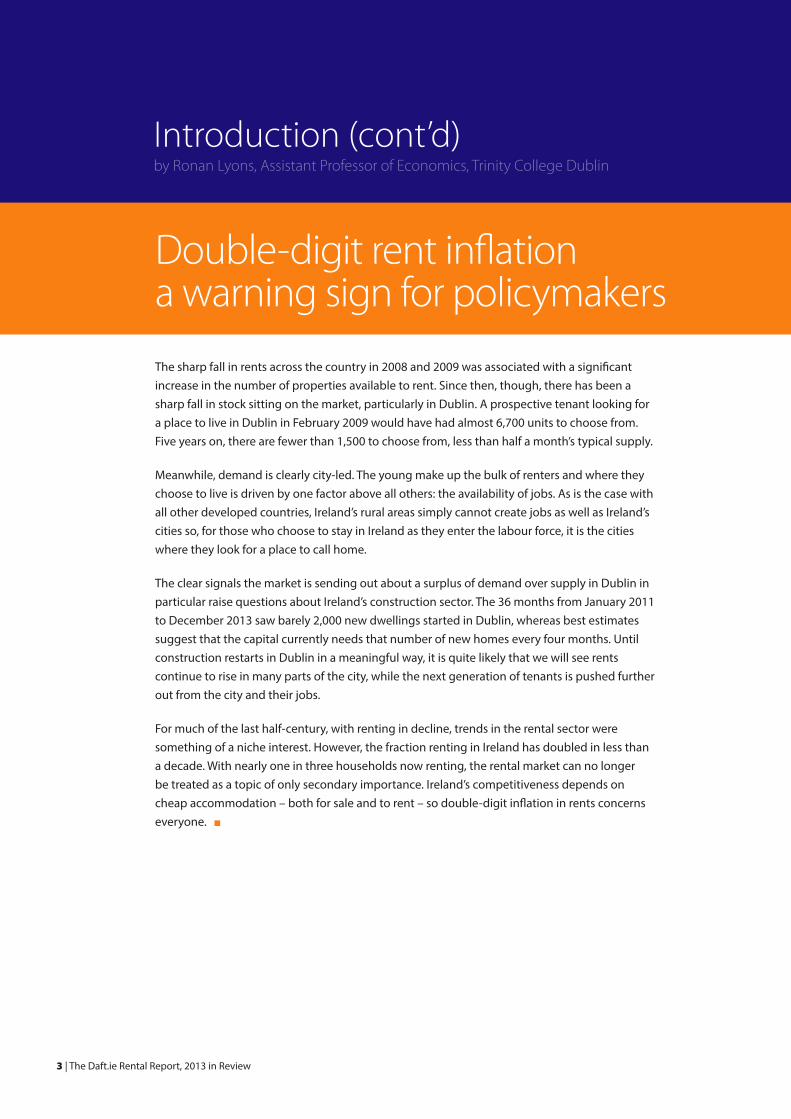
The sharp fall in rents across the country in 2008 and 2009 was associated with a significant increase in the number of properties available to rent. Since then, though, there has been a sharp fall in stock sitting on the market, particularly in Dublin. A prospective tenant looking for a place to live in Dublin in February 2009 would have had almost 6,700 units to choose from. Five years on, there are fewer than 1,500 to choose from, less than half a month’s typical supply.
Meanwhile, demand is clearly city-led. The young make up the bulk of renters and where they choose to live is driven by one factor above all others: the availability of jobs. As is the case with all other developed countries, Ireland’s rural areas simply cannot create jobs as well as Ireland’s cities so, for those who choose to stay in Ireland as they enter the labour force, it is the cities where they look for a place to call home.
The clear signals the market is sending out about a surplus of demand over supply in Dublin in particular raise questions about Ireland’s construction sector. The 36 months from January 2011 to December 2013 saw barely 2,000 new dwellings started in Dublin, whereas best estimates suggest that the capital currently needs that number of new homes every four months. Until construction restarts in Dublin in a meaningful way, it is quite likely that we will see rents continue to rise in many parts of the city, while the next generation of tenants is pushed further out from the city and their jobs.
For much of the last half-century, with renting in decline, trends in the rental sector were something of a niche interest. However, the fraction renting in Ireland has doubled in less than a decade. With nearly one in three households now renting, the rental market can no longer be treated as a topic of only secondary importance. Ireland’s competitiveness depends on cheap accommodation – both for sale and to rent – so double-digit inflation in rents concerns everyone.
Introduction (cont’d)by Ronan Lyons, Assistant Professor of Economics, Trinity College Dublin
Double-digit rent inflation a warning sign for policymakers
3 | The Daft.ie Rental Report, 2013 in Review
4 | The Daft.ie Rental Report, 2013 in Review
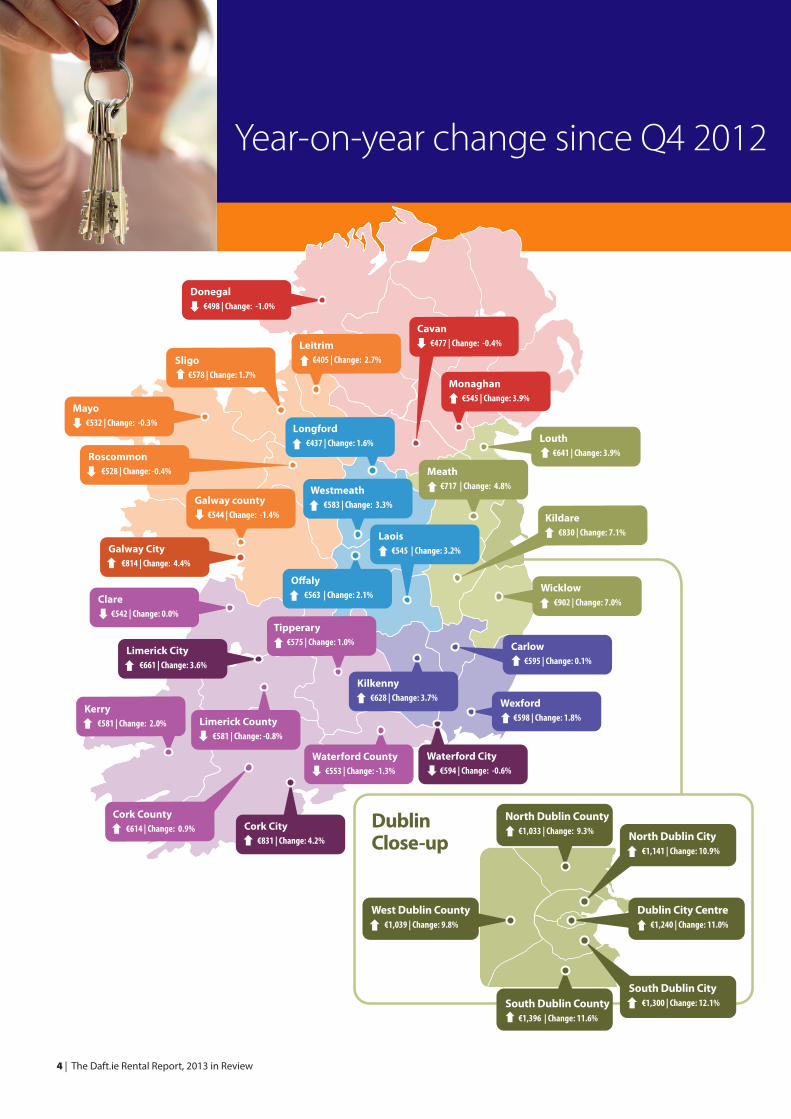
Year-on-year change since Q4 2012
Galway county €544 | Change: -1.4%
Sligo €578 | Change: 1.7%
Kerry €581 | Change: 2.0%
Cork County €614 | Change: 0.9%
Waterford County €553 | Change: -1.3%
Meath €717 | Change: 4.8%
Cork City €831 | Change: 4.2%
Laois €545 | Change: 3.2%
O�aly €563 | Change: 2.1%
Limerick County €581 | Change: -0.8%
Kilkenny €628 | Change: 3.7%
Waterford City €594 | Change: -0.6%
Galway City €814 | Change: 4.4%
Mayo €532 | Change: -0.3%
Donegal €498 | Change: -1.0%
Roscommon €528 | Change: -0.4%
Limerick City €661 | Change: 3.6%
Clare €542 | Change: 0.0%
Wicklow €902 | Change: 7.0%
Louth €641 | Change: 3.9%
Dublin City Centre €1,240 | Change: 11.0%
West Dublin County €1,039 | Change: 9.8%
North Dublin County €1,033 | Change: 9.3%
DublinClose-up North Dublin City
€1,141 | Change: 10.9%
South Dublin City €1,300 | Change: 12.1%
Wexford €598 | Change: 1.8%
Carlow €595 | Change: 0.1%
Kildare €830 | Change: 7.1%
Westmeath €583 | Change: 3.3%
Leitrim €405 | Change: 2.7%
Monaghan €545 | Change: 3.9%
Cavan €477 | Change: -0.4%
Longford €437 | Change: 1.6%
Tipperary €575 | Change: 1.0%
South Dublin County €1,396 | Change: 11.6%
!"#$%&'(%)*'(+&),+ -./012 ..32456,)7'!"#$%&'(%)* -./.1. .238496")7'!"#$%&'(%)* -./:22 .03.456,)7'(63'!"#$%& -./2:: 83:496")7'(63'!"#$%& -./:8; ..3;4<+=)'!"#$%& -./2:8 83>4(6,?'(%)* ->:. 1304@A$BA*'(%)* ->.1 1314C%D+,%E?'(%)* -;;. :3;4<A)+,F6,G'(%)* -H81 I23;4J+A)7 -K.K 13>4L%$GA,+ ->:2 K3.4<%E?$6B -820 K324C6")7 -;1. :384C6&MF6,G -1:K .3;4NFFA$* -H;: 03.4<+=)D+A)7 -H>: :3:4CA6%= -H1H :304(A,$6B -H8H 23.4L%$?+&&* -;0> :3K4<+OF6,G -H8> .3>4<A)+,F6,G'E6"&)* -HH: I.3:4L+,,* -H>. 0324(6,?'E6"&)* -;.1 2384($A,+ -H10 2324C%D+,%E?'E6"&)* -H>. I23>4P%QQ+,A,* -HKH .324@A$BA*'E6"&)* -H11 I.314JA*6 -H:0 I23:4R6=E6DD6& -H0> I23149$%M6 -HK> .3K4C+%),%D -12H 03K4!6&+MA$ -18> I.324(ASA& -1KK I2314J6&AM7A& -H1H :384
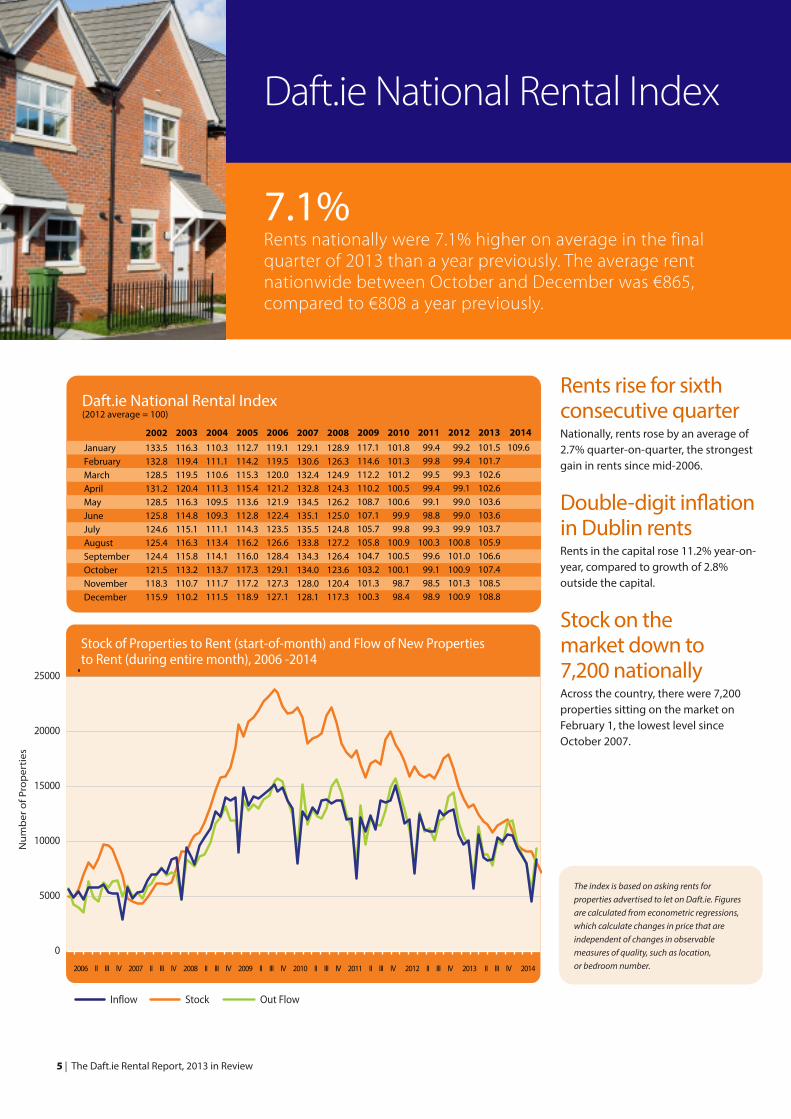
Rents rise for sixth consecutive quarter Nationally, rents rose by an average of 2.7% quarter-on-quarter, the strongest gain in rents since mid-2006.
Double-digit inflation in Dublin rents Rents in the capital rose 11.2% year-on-year, compared to growth of 2.8% outside the capital.
Stock on the market down to 7,200 nationally Across the country, there were 7,200 properties sitting on the market on February 1, the lowest level since October 2007.
-15.5
Daft.ie National Rental Index
7.1%Rents nationally were 7.1% higher on average in the final quarter of 2013 than a year previously. The average rent nationwide between October and December was €865, compared to €808 a year previously.
5 | The Daft.ie Rental Report, 2013 in Review
Daft.ie National Rental Index(2012 average = 100)
JanuaryFebruaryMarchAprilMayJuneJulyAugustSeptemberOctoberNovemberDecember
2002133.5132.8128.5131.2128.5125.8124.6125.4124.4121.5118.3115.9
2007129.1130.6132.4132.8134.5135.1135.5133.8134.3134.0128.0128.1
2008128.9126.3124.9124.3126.2125.0124.8127.2126.4123.6120.4117.3
116.3119.4119.5120.4116.3114.8115.1116.3115.8113.2110.7110.2
2003110.3111.1110.6111.3109.5109.3111.1113.4114.1113.7111.7111.5
2004112.7114.2115.3115.4113.6112.8114.3116.2116.0117.3117.2118.9
2005119.1119.5120.0121.2121.9122.4123.5126.6128.4129.1127.3127.1
2006 2010101.8101.3101.2100.5100.6
99.999.8
100.9100.5100.1
98.798.4
2009117.1114.6112.2110.2108.7107.1105.7105.8104.7103.2101.3100.3
201199.499.899.599.499.198.899.3
100.399.699.198.598.9
201299.299.499.399.199.099.099.9
100.8101.0100.9101.3100.9
2013101.5101.7102.6102.6103.6103.6103.7105.9106.6107.4108.5108.8
2014109.6
Stock of Properties to Rent (start-of-month) and Flow of New Properties to Rent (during entire month), 2006 -2014
Nu
mb
er o
f Pro
per
ties
Stock Out FlowInflow
0
5000
10000
15000
20000
25000
2006 II III IV 2007 II III IV 2008 II III IV 2009 II III IV 2010 II III IV 2011 II III IV 2012 II III IV 2013 II III IV 2014
2006
II III
IV
2007
II III
IV
2008
II III
IV
2009
II III
IV
2010
II III
IV
2011
II III
IV
2012
II III
IV
2013
II III
IV
2014
The index is based on asking rents for properties advertised to let on Daft.ie. Figures are calculated from econometric regressions, which calculate changes in price that are independent of changes in observable measures of quality, such as location, or bedroom number.
6 | The Daft.ie Rental Report, 2013 in Review
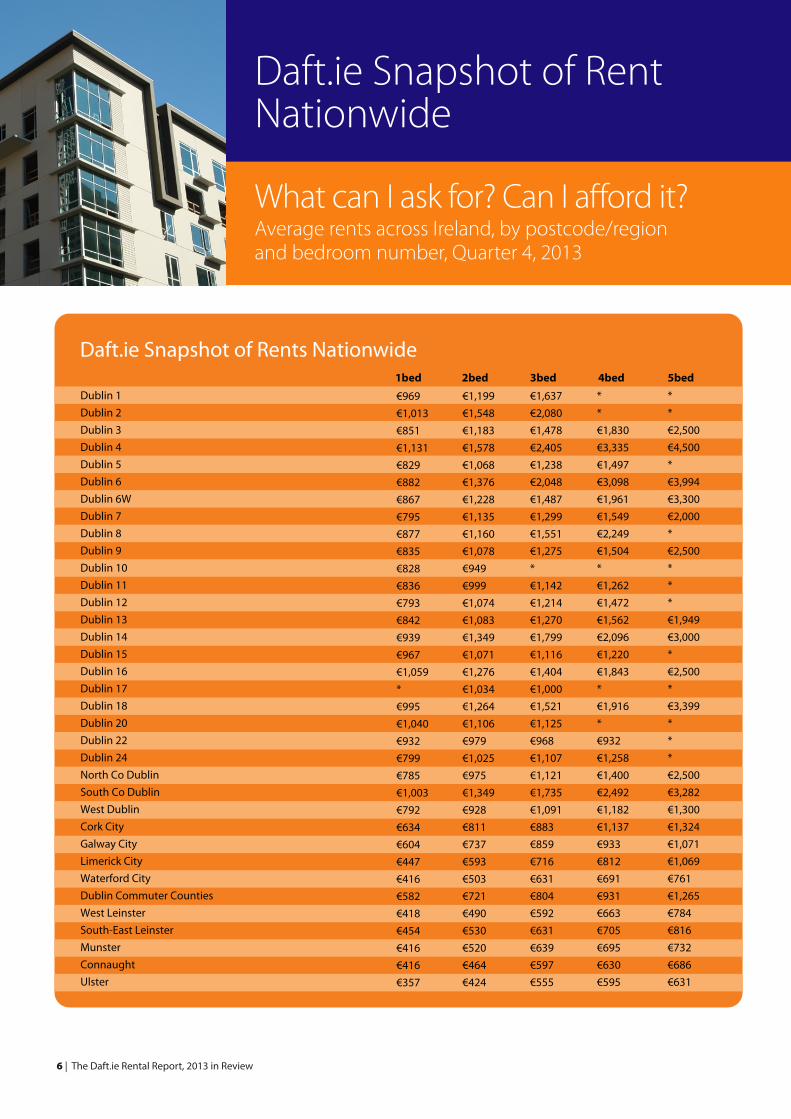
Daft.ie Snapshot of RentNationwide
What can I ask for? Can I afford it?Average rents across Ireland, by postcode/region and bedroom number, Quarter 4, 2013
Daft.ie Snapshot of Rents Nationwide 1bed 2bed 3bed 4bed 5bed
Dublin 1
Dublin 2
Dublin 3
Dublin 4
Dublin 5
Dublin 6
Dublin 6W
Dublin 7
Dublin 8
Dublin 9
Dublin 10
Dublin 11
Dublin 12
Dublin 13
Dublin 14
Dublin 15
Dublin 16
Dublin 17
Dublin 18
Dublin 20
Dublin 22
Dublin 24
North Co Dublin
South Co Dublin
West Dublin
Cork City
Galway City
Limerick City
Waterford City
Dublin Commuter Counties
West Leinster
South-East Leinster
Munster
Connaught
Ulster
€969
€1,013
€851
€1,131
€829
€882
€867
€795
€877
€835
€828
€836
€793
€842
€939
€967
€1,059
*
€995
€1,040
€932
€799
€785
€1,003
€792
€634
€604
€447
€416
€582
€418
€454
€416
€416
€357
€1,199
€1,548
€1,183
€1,578
€1,068
€1,376
€1,228
€1,135
€1,160
€1,078
€949
€999
€1,074
€1,083
€1,349
€1,071
€1,276
€1,034
€1,264
€1,106
€979
€1,025
€975
€1,349
€928
€811
€737
€593
€503
€721
€490
€530
€520
€464
€424
€1,637
€2,080
€1,478
€2,405
€1,238
€2,048
€1,487
€1,299
€1,551
€1,275
*
€1,142
€1,214
€1,270
€1,799
€1,116
€1,404
€1,000
€1,521
€1,125
€968
€1,107
€1,121
€1,735
€1,091
€883
€859
€716
€631
€804
€592
€631
€639
€597
€555
*
*
€1,830
€3,335
€1,497
€3,098
€1,961
€1,549
€2,249
€1,504
*
€1,262
€1,472
€1,562
€2,096
€1,220
€1,843
*
€1,916
*
€932
€1,258
€1,400
€2,492
€1,182
€1,137
€933
€812
€691
€931
€663
€705
€695
€630
€595
*
*
€2,500
€4,500
*
€3,994
€3,300
€2,000
*
€2,500
*
*
*
€1,949
€3,000
*
€2,500
*
€3,399
*
*
*
€2,500
€3,282
€1,300
€1,324
€1,071
€1,069
€761
€1,265
€784
€816
€732
€686
€631
7 | The Daft.ie Rental Report, 2013 in Review
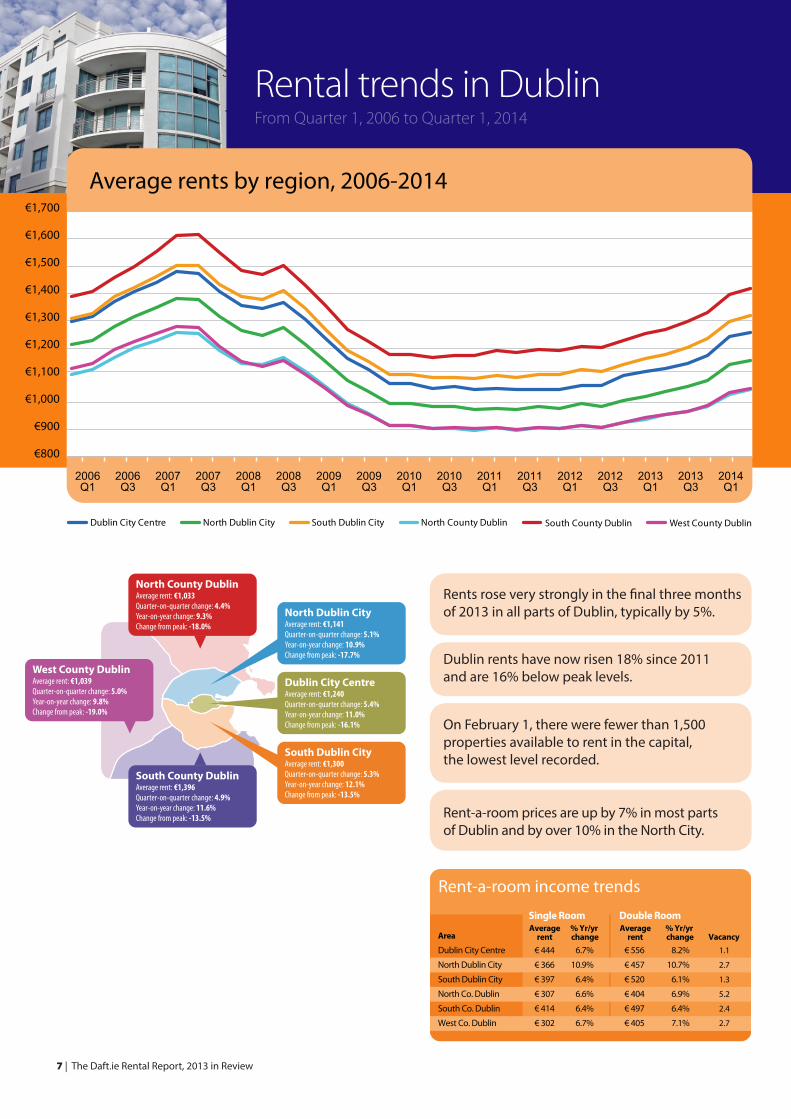
Rental trends in DublinFrom Quarter 1, 2006 to Quarter 1, 2014
Rent-a-room income trends
AreaAverage
rent% Yr/yr change
Averagerent
% Yr/yr change
Dublin City Centre
North Dublin City
South Dublin City
North Co. Dublin
South Co. Dublin
West Co. Dublin
€ 444
€ 366
€ 397
€ 307
€ 414
€ 302
6.7%
10.9%
6.4%
6.6%
6.4%
6.7%
€ 556
€ 457
€ 520
€ 404
€ 497
€ 405
8.2%
10.7%
6.1%
6.9%
6.4%
7.1%
Vacancy1.1
2.7
1.3
5.2
2.4
2.7
Single Room Double Room
Average rents by region, 2006-2014
Dublin City Centre North Dublin City South Dublin City North County Dublin South County Dublin West County Dublin
2006Q1
2006Q3
2007Q1
2007Q3
2008Q1
2008Q3
2009Q1
2009Q3
2010Q1
2010Q3
2011Q1
2011Q3
2013Q1
2013Q3
2014Q1
2012Q1
2012Q3
€800
€900
€1,000
€1,100
€1,200
€1,300
€1,400
€1,500
€1,600
€1,700
West County DublinAverage rent: €1,039 Quarter-on-quarter change: 5.0% Year-on-year change: 9.8% Change from peak: -19.0%
North County DublinAverage rent: €1,033 Quarter-on-quarter change: 4.4% Year-on-year change: 9.3% Change from peak: -18.0%
Dublin City CentreAverage rent: €1,240 Quarter-on-quarter change: 5.4% Year-on-year change: 11.0% Change from peak: -16.1%
North Dublin CityAverage rent: €1,141 Quarter-on-quarter change: 5.1% Year-on-year change: 10.9% Change from peak: -17.7%
South County DublinAverage rent: €1,396 Quarter-on-quarter change: 4.9% Year-on-year change: 11.6% Change from peak: -13.5%
South Dublin CityAverage rent: €1,300 Quarter-on-quarter change: 5.3% Year-on-year change: 12.1% Change from peak: -13.5%
On February 1, there were fewer than 1,500 properties available to rent in the capital, the lowest level recorded.
Rent-a-room prices are up by 7% in most parts of Dublin and by over 10% in the North City.
Dublin rents have now risen 18% since 2011 and are 16% below peak levels.
Rents rose very strongly in the final three months of 2013 in all parts of Dublin, typically by 5%.
8 | The Daft.ie Rental Report, 2013 in Review
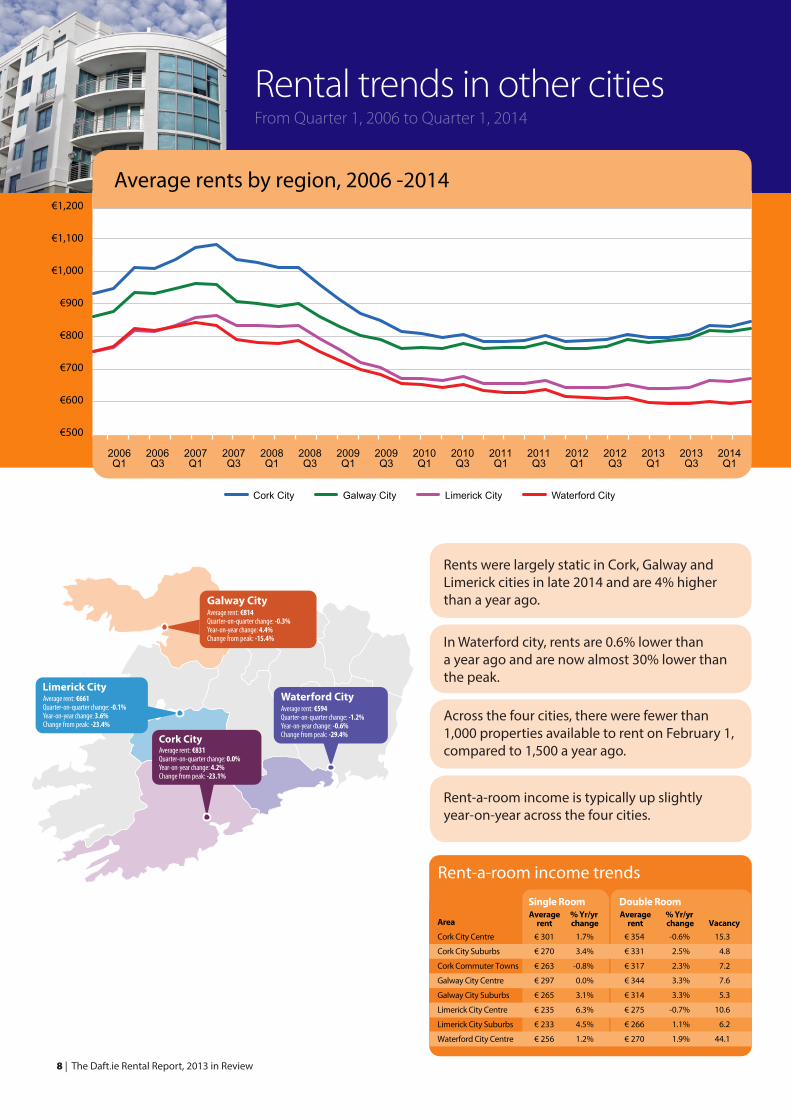
Rental trends in other citiesFrom Quarter 1, 2006 to Quarter 1, 2014
Cork City Galway City Limerick City Waterford City
Average rents by region, 2006 -2014
€500
€600
€700
€800
€900
€1,000
€1,100
€1,200
2006Q1
2006Q3
2007Q1
2007Q3
2008Q1
2008Q3
2009Q1
2009Q3
2010Q1
2010Q3
2011Q1
2011Q3
2013Q1
2013Q3
2014Q1
2012Q1
2012Q3
Rent-a-room income trends
AreaAverage
rent% Yr/yr change
Averagerent
% Yr/yr change
Cork City Centre
Cork City Suburbs
Cork Commuter Towns
Galway City Centre
Galway City Suburbs
Limerick City Centre
Limerick City Suburbs
Waterford City Centre
€ 301
€ 270
€ 263
€ 297
€ 265
€ 235
€ 233
€ 256
1.7%
3.4%
-0.8%
0.0%
3.1%
6.3%
4.5%
1.2%
€ 354
€ 331
€ 317
€ 344
€ 314
€ 275
€ 266
€ 270
-0.6%
2.5%
2.3%
3.3%
3.3%
-0.7%
1.1%
1.9%
Vacancy15.3
4.8
7.2
7.6
5.3
10.6
6.2
44.1
Single Room Double Room
Cork City
Galway City
Limerick CityWaterford CityAverage rent: €661
Quarter-on-quarter change: -0.1% Year-on-year change: 3.6% Change from peak: -23.4%
Average rent: €594 Quarter-on-quarter change: -1.2% Year-on-year change: -0.6% Change from peak: -29.4%
Average rent: €814 Quarter-on-quarter change: -0.3% Year-on-year change: 4.4% Change from peak: -15.4%
Average rent: €831 Quarter-on-quarter change: 0.0% Year-on-year change: 4.2% Change from peak: -23.1%
Rents were largely static in Cork, Galway and Limerick cities in late 2014 and are 4% higher than a year ago.
In Waterford city, rents are 0.6% lower than a year ago and are now almost 30% lower than the peak.
Across the four cities, there were fewer than 1,000 properties available to rent on February 1, compared to 1,500 a year ago.
Rent-a-room income is typically up slightly year-on-year across the four cities.
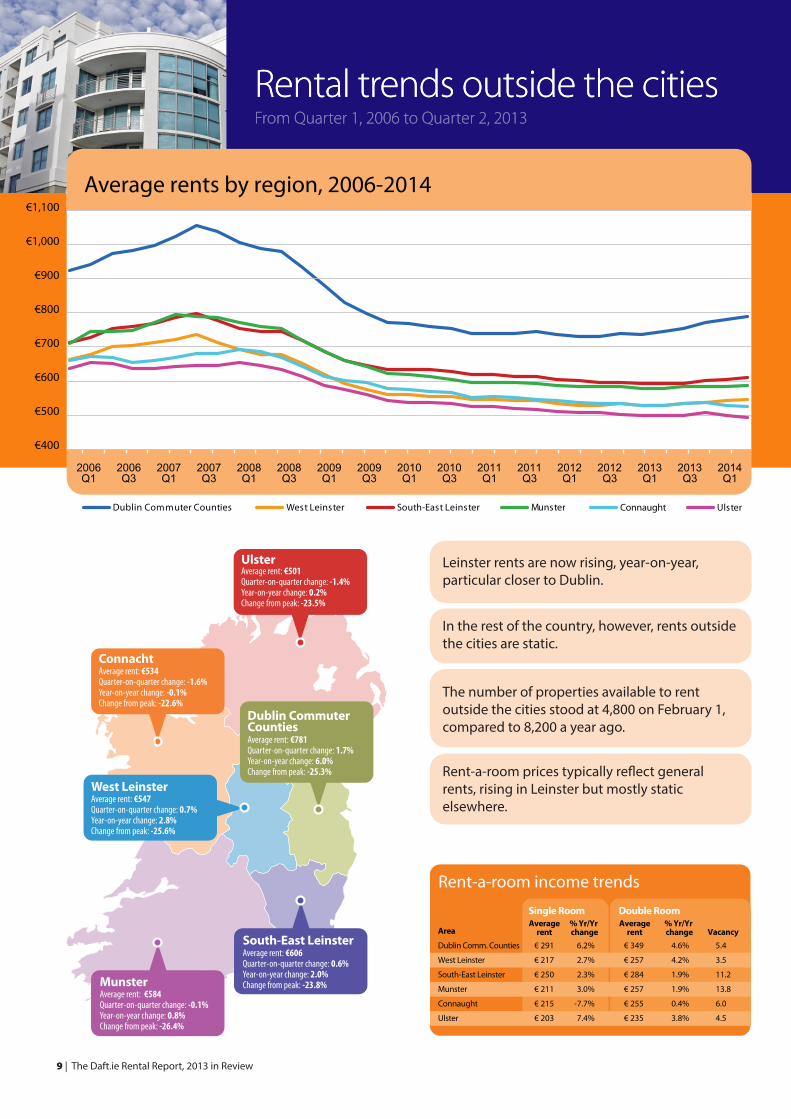
Rental trends outside the citiesFrom Quarter 1, 2006 to Quarter 2, 2013
9 | The Daft.ie Rental Report, 2013 in Review
Rental trends outside the citiesFrom Quarter 1, 2006 to Quarter 2, 2013
Average rents by region, 2006-2014
Dublin Commuter Counties West Leinster South-East Leinster Munster Connaught Ulster
€400
€500
€600
€700
€800
€900
€1,000
€1,100
2006Q1
2006Q3
2007Q1
2007Q3
2008Q1
2008Q3
2009Q1
2009Q3
2010Q1
2010Q3
2011Q1
2011Q3
2013Q1
2013Q3
2014Q1
2012Q1
2012Q3
Rent-a-room income trends
AreaAverage
rent% Yr/Yr change
Averagerent
% Yr/Yr change
Dublin Comm. Counties
West Leinster
South-East Leinster
Munster
Connaught
Ulster
€ 291
€ 217
€ 250
€ 211
€ 215
€ 203
6.2%
2.7%
2.3%
3.0%
-7.7%
7.4%
€ 349
€ 257
€ 284
€ 257
€ 255
€ 235
4.6%
4.2%
1.9%
1.9%
0.4%
3.8%
Vacancy5.4
3.5
11.2
13.8
6.0
4.5
Single Room Double Room
South-East LeinsterAverage rent: €606 Quarter-on-quarter change: 0.6%Year-on-year change: 2.0% Change from peak: -23.8%Munster
Average rent: €584 Quarter-on-quarter change: -0.1% Year-on-year change: 0.8% Change from peak: -26.4%
Connacht Average rent: €534 Quarter-on-quarter change: -1.6%Year-on-year change: -0.1% Change from peak: -22.6%
UlsterAverage rent: €501 Quarter-on-quarter change: -1.4%Year-on-year change: 0.2% Change from peak: -23.5%
West LeinsterAverage rent: €547 Quarter-on-quarter change: 0.7% Year-on-year change: 2.8% Change from peak: -25.6%
Dublin CommuterCountiesAverage rent: €781 Quarter-on-quarter change: 1.7% Year-on-year change: 6.0% Change from peak: -25.3% Rent-a-room prices typically reflect general
rents, rising in Leinster but mostly static elsewhere.
Leinster rents are now rising, year-on-year, particular closer to Dublin.
In the rest of the country, however, rents outside the cities are static.
The number of properties available to rent outside the cities stood at 4,800 on February 1, compared to 8,200 a year ago.
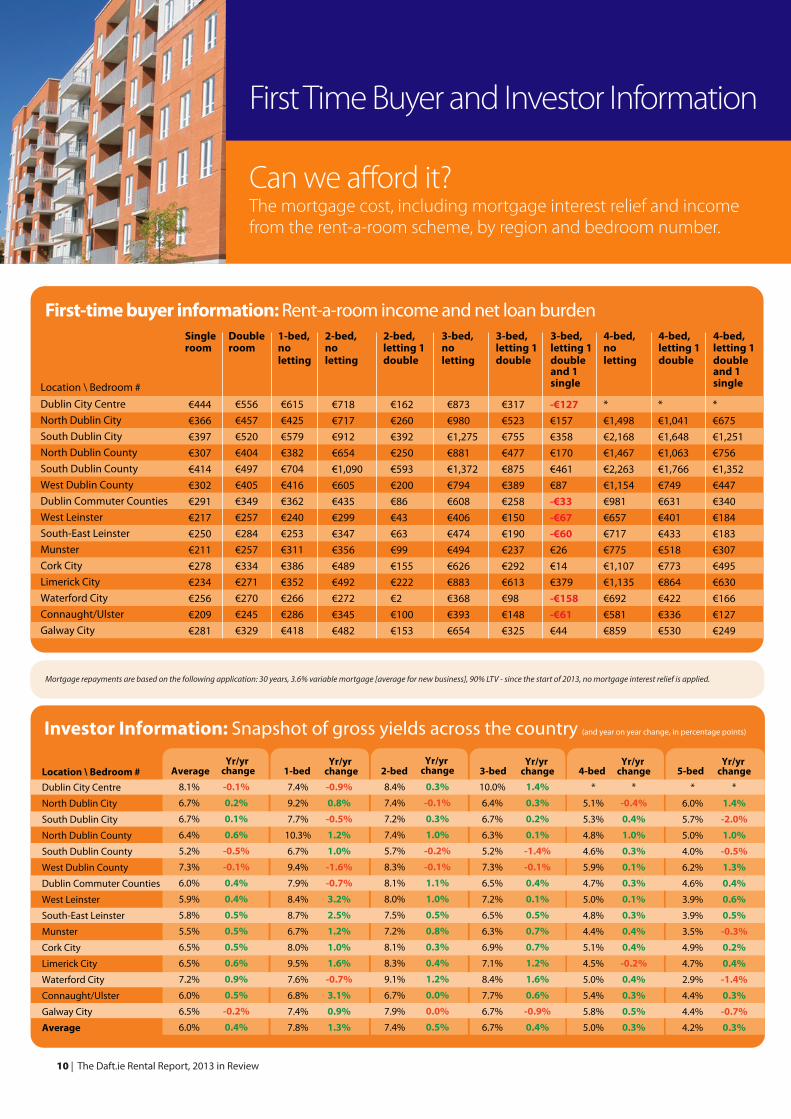
First Time Buyer and Investor Information
Can we afford it?The mortgage cost, including mortgage interest relief and income from the rent-a-room scheme, by region and bedroom number.
10 | The Daft.ie Rental Report, 2013 in Review
Investor Information: Snapshot of gross yields across the country (and year on year change, in percentage points)
Location \ Bedroom # AverageYr/yr
change 1-bed 2-bed 3-bed 4-bed 5-bed
Dublin City Centre
North Dublin City
South Dublin City
North Dublin County
South Dublin County
West Dublin County
Dublin Commuter Counties
West Leinster
South-East Leinster
Munster
Cork City
Limerick City
Waterford City
Connaught/Ulster
Galway City
Average
8.1%
6.7%
6.7%
6.4%
5.2%
7.3%
6.0%
5.9%
5.8%
5.5%
6.5%
6.5%
7.2%
6.0%
6.5%
6.0%
-0.1%
0.2%
0.1%
0.6%
-0.5%
-0.1%
0.4%
0.4%
0.5%
0.5%
0.5%
0.6%
0.9%
0.5%
-0.2%
0.4%
7.4%
9.2%
7.7%
10.3%
6.7%
9.4%
7.9%
8.4%
8.7%
6.7%
8.0%
9.5%
7.6%
6.8%
7.4%
7.8%
-0.9%
0.8%
-0.5%
1.2%
1.0%
-1.6%
-0.7%
3.2%
2.5%
1.2%
1.0%
1.6%
-0.7%
3.1%
0.9%
1.3%
*1.4%-2.0%1.0%-0.5%1.3%0.4%0.6%0.5%-0.3%0.2%0.4%-1.4%0.3%-0.7%0.3%
8.4%
7.4%
7.2%
7.4%
5.7%
8.3%
8.1%
8.0%
7.5%
7.2%
8.1%
8.3%
9.1%
6.7%
7.9%
7.4%
0.3%
-0.1%
0.3%
1.0%
-0.2%
-0.1%
1.1%
1.0%
0.5%
0.8%
0.3%
0.4%
1.2%
0.0%
0.0%
0.5%
10.0%
6.4%
6.7%
6.3%
5.2%
7.3%
6.5%
7.2%
6.5%
6.3%
6.9%
7.1%
8.4%
7.7%
6.7%
6.7%
1.4%
0.3%
0.2%
0.1%
-1.4%
-0.1%
0.4%
0.1%
0.5%
0.7%
0.7%
1.2%
1.6%
0.6%
-0.9%
0.4%
*
5.1%
5.3%
4.8%
4.6%
5.9%
4.7%
5.0%
4.8%
4.4%
5.1%
4.5%
5.0%
5.4%
5.8%
5.0%
*
-0.4%
0.4%
1.0%
0.3%
0.1%
0.3%
0.1%
0.3%
0.4%
0.4%
-0.2%
0.4%
0.3%
0.5%
0.3%
*
6.0%
5.7%
5.0%
4.0%
6.2%
4.6%
3.9%
3.9%
3.5%
4.9%
4.7%
2.9%
4.4%
4.4%
4.2%
*
1.4%
-2.0%
1.0%
-0.5%
1.3%
0.4%
0.6%
0.5%
-0.3%
0.2%
0.4%
-1.4%
0.3%
-0.7%
0.3%
Yr/yr change
Yr/yr change
Yr/yr change
Yr/yr change
Yr/yr change
First-time buyer information: Rent-a-room income and net loan burden
Location \ Bedroom #
Single room
Double room
1-bed, no letting
2-bed, no letting
3-bed, no letting
4-bed, no letting
2-bed, letting 1 double
3-bed, letting 1 double
3-bed, letting 1 double and 1 single
Dublin City Centre
North Dublin City
South Dublin City
North Dublin County
South Dublin County
West Dublin County
Dublin Commuter Counties
West Leinster
South-East Leinster
Munster
Cork City
Limerick City
Waterford City
Connaught/Ulster
Galway City
€444
€366
€397
€307
€414
€302
€291
€217
€250
€211
€278
€234
€256
€209
€281
€556
€457
€520
€404
€497
€405
€349
€257
€284
€257
€334
€271
€270
€245
€329
€615
€425
€579
€382
€704
€416
€362
€240
€253
€311
€386
€352
€266
€286
€418
€718
€717
€912
€654
€1,090
€605
€435
€299
€347
€356
€489
€492
€272
€345
€482
€162
€260
€392
€250
€593
€200
€86
€43
€63
€99
€155
€222
€2
€100
€153
€873
€980
€1,275
€881
€1,372
€794
€608
€406
€474
€494
€626
€883
€368
€393
€654
€317
€523
€755
€477
€875
€389
€258
€150
€190
€237
€292
€613
€98
€148
€325
-€127€157
€358
€170
€461
€87
-€33-€67-€60€26
€14
€379
-€158-€61€44
4-bed, letting 1 double
4-bed, letting 1 double and 1 single
*
€1,498
€2,168
€1,467
€2,263
€1,154
€981
€657
€717
€775
€1,107
€1,135
€692
€581
€859
*
€1,041
€1,648
€1,063
€1,766
€749
€631
€401
€433
€518
€773
€864
€422
€336
€530
*
€675
€1,251
€756
€1,352
€447
€340
€184
€183
€307
€495
€630
€166
€127
€249
*693
1,079774
1,213470325158157294367396228162263
Mortgage repayments are based on the following application: 30 years, 3.6% variable mortgage [average for new business], 90% LTV - since the start of 2013, no mortgage interest relief is applied.
About the Report
Over the last 10 years, Daft.ie has collected a vast amount of data on the Irish property market. In 2011 alone, more than 260,000 properties were advertised on the site.
The goal of the Daft Report is to use this information to help all actors in the property market make informed decisions about buying and selling. In addition, because it is freely available, the Daft Report can help inform the media, the general public and policymakers about the latest developments in the property market. The Daft.ie Rental Report was launched in 2005. It has already become the definitive barometer of the Irish rental market and is being used by the Central Bank, mortgage institutions, financial analysts and the general public alike. Since its introduction at the start of 2006, the Daft.ie Asking Price Index is also being recognised as the earliest available reliable indicator of developments in house prices in Ireland. This is the Daft.ie Rental Report, the partner to the Daft.ie House Price Report issued last month. Together, they give house-hunters and investors more information to help them make their decisions. These twin reports mean that Daft is the only objective monitor of trends in both rental and sales markets on a monthly basis, making the report an essential barometer for anyone with an interest in the Irish property market. Methodology and Sample SizeThe statistics are based on properties advertised on Daft.ie for a given period. The regressions used are hedonic price regressions, accounting for all available and measurable attributes of properties, with a Cooks Distance filter for outliers.
The average monthly sample size for lettings properties is over 10,000. Indices are based on standard methods, holding the mix of characteristics constant, with the annual average of 2007 used as the base. For more on the methodology, please see www.daft.ie/research.
About Daft.ieDaft.ie is Ireland’s largest property website. The latest audited report from ABC (Sep 2011) shows monthly traffic of 130 million page impressions (pages of information received) and 1.976 million unique users per month across Daft Media’s property websites (daft.ie, rent.ie, let.ie, property.ie). This makes Daft.ie the biggest property website in Ireland across all demographics.
11 | The Daft.ie Rental Report, 2013 in Review
DisclaimerThe Daft.ie Report is preparedfrom information that we believeis collated with care, but we do notmake any statement as to its accuracyor completeness. We reserve the rightto vary our methodology and to editor discontinue the indices, snapshotsor analysis at any time for regulatoryor other reasons. Persons seeking toplace reliance on any informationcontained in this report for their ownor third party commercial purposesdo so at their own risk.
CreditsEconomic Analysis:Ronan Lyons Marketing & Communications: Kieran Harte Layout and Design:Ciara Mulvany
All data is Copyright © Daft MediaLimited. The information contained inthis report may only be reproduced ifthe source is clearly credited.Please contact Daft.ie on 01-4218700for further information.
Coming Next…
The Daft.ie House Price Report 2014 Q1In early April 2014 The Daft.ie House Price Report will be published in early April 2014 and will provide a detailed regional analysis of asking prices and transaction prices as well as all the usual indices, snapshots, trends and regional analysis, providing the public with Ireland’s most up-to-date information on the housing market.