the decline of the u.s. labor share - brookings · the decline of the u.s. labor share abstract...
TRANSCRIPT

1
Michael W. l. elsbyUniversity of Edinburgh
bart hobijnFederal Reserve Bank of San Francisco
aysegül sahi.n
Federal Reserve Bank of New York
The Decline of the U.S. Labor Share
ABSTRACT Over the past quarter century, labor’s share of income in the United States has trended downward, reaching its lowest level in the postwar period after the Great Recession. A detailed examination of the magnitude, determinants, and implications of this decline delivers five conclusions. First, about a third of the decline in the published labor share appears to be an artifact of statistical procedures used to impute the labor income of the self-employed that underlies the headline measure. Second, movements in labor’s share are not solely a feature of recent U.S. history: The relative stability of the aggregate labor share prior to the 1980s in fact veiled substantial, though offsetting, move-ments in labor shares within industries. By contrast, the recent decline has been dominated by the trade and manufacturing sectors. Third, U.S. data provide limited support for neoclassical explanations based on the substitution of capital for (unskilled) labor to exploit technical change embodied in new capital goods. Fourth, prima facie evidence for institutional explanations based on the decline in unionization is inconclusive. Finally, our analysis identifies offshoring of the labor-intensive component of the U.S. supply chain as a leading potential explanation of the decline in the U.S. labor share over the past 25 years.
ever since Kaldor (1957, 1961) documented his growth facts, the con-stancy of the share of income that flows to labor has been taken to be
one of the quintessential stylized facts of macroeconomics.1 After several
1. It is important to realize, however, that the proposed stability of the labor share is as stylized now as it was controversial when Kaldor classified it as a prototypical growth fact. Kaldor’s claim was met by an extensive literature on measuring the movements in labor’s share during the first half of the 20th century.

2 Brookings Papers on Economic Activity, Fall 2013
decades of modest variation, prominent measures of labor’s share in the United States have declined significantly. The headline measure pub-lished by the Bureau of Labor Statistics (BLS) historically fluctuated around a mean of close to 64 percent from the immediate postwar period to the mid-1980s. Thereafter, aside from a brief surge surrounding the tech bubble at the turn of the 21st century, this measure has displayed a downward trend, averaging around 58 percent in recent years, 6 percent-age points below the level that prevailed during the first four decades of the postwar period.
In this paper, we examine the magnitude, determinants, and implica-tions of the movements in the U.S. labor share over the past 25 years. Our paper follows in the footsteps of an extensive literature that has investigated fluctuations and trends in labor’s share dating back to the first half of the 20th century.2 We address three main themes. First, we identify the sources of income and the underlying industry-level trends that account for the decline of the U.S. labor share. Second, we consider possible explanations for the decline. Finally, we reflect on whether the recent decline warrants a major rethink of the way the labor share is used by macroeconomists.
Section I documents the measurement of the headline labor share published by the BLS and the role played in its decline by each of its constituent income sources. We show that most of the recent downward trend in the labor share has its origins in reductions in the compensation of payroll employees as a fraction of gross value added, what we shall refer to as the “payroll share.” However, the decline in the share of the remaining source of labor income, that of the self-employed, is shown to be overstated in the headline measure. This measure is constructed under the assumption that average wages among the self-employed are the same as those of payroll employees. We provide evidence suggesting that this assumption induced the headline measure to imply a negative capital share among the self-employed during the 1980s, thereby over-estimating labor’s share and casting doubt on subsequent trends in that series. Two alternative measures proposed in the early work of Kravis (1959) have less extreme implications for the returns to capital among the self-employed. Comparison of these two alternative measures with the headline series informs our conclusion that around a third of the decline in the headline measure is a symptom of the method used to impute self-employment income.
2. For a comprehensive list of this early literature, see Gallaway (1964), footnote 1.

Michael elsby, bart hobijn, and aysegül sahi.n 3
Once the issues surrounding measurement of the labor income of the self-employed are considered, almost all of the remaining decline in the labor share is accounted for by the decline in the payroll share. For this reason, and because the payroll share is comparatively straightforward to measure and can easily be disaggregated, we focus in the remainder of the paper on understanding the movements of the payroll share.
In section II we address the sectoral origins of the decline in the pay-roll share using disaggregated industry-level data. We find that, viewed from a sectoral perspective, movements in labor’s share are not a feature solely of recent U.S. history: The relative stability of the aggregate labor share prior to the 1980s in fact veiled substantial, though offsetting, move-ments in labor shares within industries. The shift from manufacturing to services over this period served to depress the aggregate payroll share, as labor shares in manufacturing exceeded those in services. This effect was undone, however, by substantial rises in payroll shares within industries, especially healthcare, prior to the 1980s.
By contrast, these coincidental offsetting effects have not been mirrored since the late 1980s, the period in which the recent decline in the aggregate payroll share has emerged. The recent decline has instead been dominated by within-industry declines in payroll shares, particularly in manufacturing and trade, as opposed to compositional shifts.
A small group of industries also accounts for the higher-frequency rise and fall in the labor share in the late 1990s and early 2000s. Consistent with the timing of the tech bubble that arose then and with the widespread use of stock options in employee compensation in the tech sector, we find that around half of the rise and fall in the aggregate payroll share between 1998 and 2003 is accounted for by the changes in payroll shares of a small set of industries that cover investment banking and the tech sectors, despite their small share in total value added.
Thus, the results in section II reveal that aggregate movements in the payroll share owe much to underlying movements in particular indus-tries. Understanding the evolution of the aggregate payroll share therefore requires an understanding of changes in payroll shares across sectors. This insight is confirmed by our analysis in section III.
In that section we show that explanations for the decline in the labor share that rely solely on an aggregate perspective provide, at best, an incomplete account of the movements in the labor share. A leading candi-date among these explanations is the neoclassical notion that declines in the relative price of investment goods, such as computer equipment, have induced firms to replace workers with machines. This hypothesis, which

4 Brookings Papers on Economic Activity, Fall 2013
dates back to Hicks (1932), highlights the role of capital-labor substitut-ability and capital deepening in the determination of income shares, and it has recently been revived by Karabarbounis and Neiman (2013). Two corollaries of this account are not supported by U.S. data, however. First, when the decline in the labor share accelerated in the 2000s it was not accompanied by an increase in the rate of capital deepening. Second, con-trary to the predictions of simple versions of the theory, growth in real wages and output per hour actually slowed down during the 2000s rather than accelerating. We find similar tensions in other, more elaborate neo-classical explanations, such as the role played by an increasing skill-share of the labor force in the presence of capital-skill complementarity.
In section IV, we go beyond an aggregate production function repre-sentation and investigate the sources of the within-industry changes in payroll shares by exploiting cross-industry data. Our analysis identifies a strong correlation between increases in import exposure and declines in labor share at the industry level. Strikingly, we find that this statistical relationship could account for 3.3 percentage points of the 3.9 percentage- point decline in the U.S. payroll share over the past quarter century. We also revisit the capital-labor substitutability hypothesis by examining whether the industries that saw the smallest increases in equipment prices were the ones that experienced the largest declines in payroll shares. Reiterating our aggregate analysis, we find little support in the cross-industry data for this explanation. Prima facie evidence for another potential explanation—the decline in the bargaining power of workers due to deunionization—is inconclusive: there is a statistically imprecise relation between cross-industry changes in unionization rates and sectoral declines in payroll shares that includes both potentially large (and small) effects within conventional con-fidence intervals.3
In section V we conclude by considering how these facts and explana-tions affect the way macroeconomists should think about the labor share.
3. A small but growing literature has focused on understanding trends in the labor share across countries. In an early example, Blanchard (1997) focuses on the declines in labor shares in continental Europe during the period 1980 to 1995. Blanchard identifies two poten-tial explanations: the first is a shift in the distribution of rents from workers to firms; the second is the adoption of technologies that use less labor and more capital. His empiri-cal results provide weak support in favor of the second explanation. More recent studies, such as Bentolila and Saint-Paul (2003), Guscina (2006), Azmat, Manning, and van Reenen (2011), Harrison (2005), and Jaumotte and Tytell (2007), analyze the role of several factors in accounting for cross-country movements in labor shares. While there is no consensus on the drivers of these changes, deregulation, technological progress, globalization, and openness to trade emerge as potential leading explanations.

Michael elsby, bart hobijn, and aysegül sahi.n 5
We first show that, in spite of the recent movements in the labor share, the assumption of (approximate) constancy of the labor share is still useful in many applications. For example, estimates of total factor productivity (TFP) growth are almost unaffected by the recent variation in factor shares observed in the United States. Second, we argue that theories and applica-tions that use the labor share as an indicator of the state of the business cycle are affected by the decline. Such theories implicitly assume the labor share fluctuates around a constant mean; an assumption rendered invalid by the decline. Moreover, many components of the compensa-tion captured in the labor share, like self-employment income and stock options, are not part of firms’ marginal costs. This makes the labor share a highly imperfect measure of cyclical marginal cost pressures that drive inflation. Finally, we illustrate why one has to be careful to interpret the decline in the share as showing increased inequality between capital(ists) and workers. We show that the labor share in the United States has in fact been buoyed up increasingly by the rising income shares of very rich workers, such as CEOs. Thus, the decline in the labor share conceals, rather than exposes, most of the large increases in inequality that have emerged in recent decades.
Of course, our conclusions are based on the recent movements of the labor share relative to its history. If the recent steep decline continues, this would lead to a more drastic reconsideration of the use of the labor share in empirical macroeconomics than we advocate. With that in mind, we con-clude the paper by briefly discussing what forces might drive movements in labor’s share in the foreseeable future.
I. Measurement and the Impact of Self-Employment Income
A first priority of any analysis of the evolution of the labor share is to docu-ment its empirical behavior. We begin by reviewing the path of the most commonly cited headline measure of the labor share, namely the labor share for the U.S. nonfarm business sector, which is published as part of the BLS Labor Productivity and Costs release.4
4. The results in this paper are based on data through July 28, 2013, and do not include the 2013 benchmark revisions of the National Income and Product Accounts (NIPA), which affect the level and path of the labor share in two ways. First, they add part of intangible expenditures to value added, due to the capitalization of intangible invest-ments. This increase in value added shows up as an increase in net operating surplus and, by construction, a reduction in the labor share. This increase is partly offset by an increase in measured compensation due to a change in the way pension benefits are accounted for. In the end, these revisions had little effect on the trends in the labor share.

6 Brookings Papers on Economic Activity, Fall 2013
In this section, we contrast the behavior of this published series with several alternative measures of the labor share. Our findings indicate that the headline measure has overstated the decline in the labor share because of the way self-employment income is imputed in the construction of the headline number.
I.A. Evolution of the Headline Labor Share Measure
The evolution of the headline labor share measure during the postwar period is depicted by the black line in figure 1, and some related sum-mary statistics are provided in table 1. Four observations are apparent from these. First, the labor share exhibited no obvious trend during the first four decades of the postwar era. From 1948 through 1987 it hovered around a mean of 63.6 percent. Second, one can discern a trend decline in the labor share since the late 1980s. Third, the share spiked in the late 1990s
Percent
52
54
56
58
60
62
64
66
68
1953 1958 1963 1968 1973 1978 1983 1988 1993 1998 2003 2008 2013
Self-employment sharePayroll share
PublishedReplicated
Source: Bureau of Labor Statistics, Bureau of Economic Analysis, and authors’ calculations.
Figure 1. labor share, Payroll share, and replicated labor share in U.s. nonfarm business sector, 1948-2013

Michael elsby, bart hobijn, and aysegül sahi.n 7
Table 1. sources and Magnitude of the Decline in the labor share
Measure MeanMean
1948–87Mean
2010–12 Change
Composition of nonfarm business sector income1. Compensation (payroll share) 56.5 57.1 53.3 -3.92. Proprietors’ income w/o CCA and IVA 8.8 9.0 8.4 -0.63. Taxesa 9.8 9.9 9.9 0.04. Rental, interest, and depreciation 13.9 12.4 16.4 3.95. Profits 11.0 11.6 12.1 0.5Alternative measures of the labor share6. Labor basis – published 63.6 64.6 58.3 -6.47. Asset basis – MFP 62.6 62.9 59.3 -3.68. Economy-wide basis 62.0 62.7 58.1 -4.7
Source: Bureau of Economic Analysis, Bureau of Labor Statistics, and authors’ calculations.a. Sample covers 1948Q1 to 2013Q1.
and early 2000s. Finally, the trend decline that started in the late 1980s has accelerated over the last decade, with the labor share receding from its high in 2001 to a historic postwar low in the wake of the Great Recession. It averaged 58.3 percent over the period 2010 to 2012. The difference between the 1948–1987 and 2010–2012 period averages implies that the share of income that flows to workers has declined by 6.4 percentage points.
The methodology used to construct this headline measure is but one of a number of alternative approaches to measuring labor’s share, however. All these measures have one thing in common: They capture the ratio of a measure of aggregate labor compensation to an analogous measure of all factor income generated, which equals gross value added. Thus, the labor share, which we denote by l, is equal to the ratio of labor compensation to gross value added:
WL
PY(1) ,λ ≡
where W is the average compensation per hour worked, L is the total number of hours worked, P is the price, and Y is the quantity produced. While this formulation is conceptually simple, neither the numerator nor the denominator is straightforward to measure. The measurement of

8 Brookings Papers on Economic Activity, Fall 2013
labor compensation, WL, turns out to be particularly important for the decline in l.5
Labor compensation is the sum of payments to two groups of workers. The first group comprises workers who are on employers’ payrolls. Their compensation consists of their wages and salaries, as well as supplements to them in the form of employer contributions to pension and insurance funds and to social insurance. We denote the compensation of these payroll employees by WPLP. Measurement of WPLP is relatively straightforward, being based primarily on employer payroll records from the Quarterly Cen-sus of Employment and Wages, which covers 98 percent of payroll jobs in the United States.6 For this reason, it is often referred to as the “unambigu-ous” part of labor compensation (Gomme and Rupert 2004). In what fol-lows, we will refer to the share of value added paid to these employees as the payroll share, and denote it by lP = WPLP/PY.7 The dark-shaded area in figure 1 reflects this payroll share.
The second group of workers consists of those who work for themselves rather than for an employer. The income of these self-employed indi-viduals8 reflects both returns to their work effort and returns to the busi-ness property they invested in. As Krueger (1999) points out, isolating the component of self-employment income that accrues to labor (as opposed to profits or other factors of production) is fundamentally ambiguous. Con-sequently, there is no direct measure of (hourly) labor compensation for the self-employed. Thus, analysts of labor’s share must adopt a position on how to measure this second component of labor compensation.9
5. As far as the denominator is concerned, the measurement of gross value added involves the choice of what are considered intermediate inputs and what are capital goods. A change in the classification of some of these expenditures, as in the 2013 benchmark revisions of the NIPA, results in a change in the level of gross value added. It also involves the choice of which sectors to include and which not, and whether the denominator is constructed using data from the expenditure or income sides of the national accounts (Grant 1963). For the postwar period the latter turns out to be immaterial, because the statistical discrepancy was relatively small during that period.
6. Estimates for the most recent quarter are based on the more timely survey data from the Current Employment Statistics program of the BLS.
7. It is also referred to as the “employee compensation share” (Gollin 2002).8. Also known as proprietors’ income, or noncorporate business income.9. In addition, from a practical perspective, there are known measurement problems
associated with reported self-employment income. Chief among these is that available mea-sures are thought to be subject to substantial underreporting. Based on Internal Revenue Service estimates of “tax gaps” for the 2001 tax year, Slemrod (2007, table 1) reports that as much as 57 percent of nonfarm proprietors’ income is not reported on tax returns when it should have been. In addition, as Hurst, Li, and Pugsley (2010) argue, there is substantial

Michael elsby, bart hobijn, and aysegül sahi.n 9
We denote the imputed component of labor compensation paid to the self-employed by WSLS. The light-shaded area in figure 1 is the fraction of value added that is attributed to self-employment income in the headline measure of the labor share. Self-employment income in this headline mea-sure is imputed under the assumption that average hourly compensation for the self-employed is the same as for those on payroll. That is, WS = WP for all quarters in the postwar period. Under this assumption, the labor share can be constructed by rescaling the payroll share by one plus the ratio of the hours of the self-employed and payroll-employed,
L
L
S
P
P( )λ ≡ + λ(2) 1 .
The underlying source data on hours worked necessary to replicate the BLS methodology are available dating back to 1964. The dashed line in figure 1 demonstrates that, using these data, we can closely replicate the published labor share under this assumption. The share of hours of the self-employed in total hours, LS/L, has declined steadily from about 14 percent in 1948 to 8.5 percent in 2012. This is why figure 1 indicates a declining wedge between the labor and payroll shares during the postwar period. In spite of the relatively small share of self-employment hours, the treatment of self-employment income plays an important role in the recent behavior of the evolution of the labor share plotted in figure 1.
I.B. The Role of the Treatment of Self-Employment Income
The assumption of equal hourly compensation for payroll employees and the self-employed that is used to construct the headline labor share measure is only one way to impute the labor income of the self-employed. In this subsection we examine the behavior of a set of alternative measures of the labor share based on different assumptions on the measurement of WSLS. This approach was pioneered by Kravis (1959, table 1).
underreporting of self-employment income in household surveys. Changes in under reporting of self-employment income can also affect the evolution of the labor share. However, figure 4 in Hurst, Li, and Pugsley (2010) suggests that the timing of changes in underreport-ing does not coincide with the evolution of the labor share. According to their calculations, underreporting was high during the early 1980s, fell between the late 1980s and mid-1990s, and increased once again during the late 1990s and early 2000s, but still remains below its level in the early 1980s when the labor share was higher.

10 Brookings Papers on Economic Activity, Fall 2013
The basic problem that each of these alternative measures addresses is that the different sources of factor income reported in the national accounts do not map directly onto parts attributable to capital and labor. Figure 2 and table 1 summarize the distribution of all factor income generated by the non-farm business sector across five broad categories. The first is payroll compensa- tion and unambiguously reflects payments to labor. The second category is proprietors’ income, which as discussed above reflects a mixture of the labor and capital income of the self-employed. The remaining three catego-ries are better classified as either direct or implicit payments to capital.10
PercentQuarterly observations
1953 1958 1963 1968 1973 1978 1983 1988 1993 1998 2003 2008
Source: Bureau of Economic Analysis and authors’ calculations.Note: Share of gross value added of NFB sector.
40
50
60
70
80
90
Labor share, published
ProfitsTaxes
Rental, interest, and depreciationProprietors’ income w/o CCA and IVA
Compensation
Figure 2. composition of nonfarm business sector income, 1948–2013
10. The taxes that are part of this component are “taxes on production and imports” (TOPI). They include federal excise taxes and customs duties, state and local sales taxes, property taxes (including residential real estate taxes), motor vehicle licenses, severance taxes, and special assessments. Some studies, like Gomme and Rupert (2004), classify taxes as ambiguous income that reflects a mixture of payments to capital and labor as well. The replication files provided with this paper also include a measure of the labor share that divides these taxes into payments to capital and labor. This does not matter much for the implied decline in the share.

Michael elsby, bart hobijn, and aysegül sahi.n 11
Measures of the labor share thus have to take a stance on the part of pro-prietors’ income that reflects payments to labor. Kravis (1959) introduced four different assumptions that can be used to cut the Gordian knot of esti-mating the labor income of the self-employed, and we provide an update of his results. The first assumption corresponds to that underlying the headline measure—that is, equal wages for self-employed and payroll-employed. This is what Kravis calls the “labor basis” measure of self-employment income. For reference it is plotted as the “labor share” in figure 2.
Kravis’ second measure attributes all of proprietors’ income (exclusive of capital consumption allowances [CCA] and inventory valuation adjust-ments [IVA]) to the labor input of the self-employed. We call this the “all-to-labor basis” measure. The labor share that one obtains using this measure is represented by the two lightest shaded areas in figure 2. While this clearly is an overstatement of the labor compensation of the self-employed—it assumes after all that none of proprietors’ income flows to capital—it is nonetheless instructive.
A comparison of this “all-to-labor basis” share with the published labor share is particularly revealing. Figure 2 shows that the share of proprietors’ income included in the labor share implicitly increased from around 80 percent in 1948 to 100 percent in 1981. From 1981 through 1991, the level of imputed self-employment income in the headline labor share measure even exceeded the level of proprietors’ income, a point to which we shall return shortly. Crucially for recent trends in the published share, between 1987 and 2012 the share of proprietors’ income attributed to labor implicit in the headline measure has decreased from 121 percent to a postwar low of 55 percent. Consequently, as can be seen by combin-ing the first two rows of table 1, at 4.5 percentage points the decline in the “all-to-labor basis” is substantially smaller than the 6.4-percentage-point decline in the headline measure. Moreover, rows 1 through 5 of the table reveal that only a small part of the decline in the “all-to-labor basis” share is due to an increase in the share of corporate profits. Instead, the bulk of the decline can be traced back to an increase in the share of capital services as reflected in rental and interest income, as well as capital depreciation.
The fact that the headline labor share measure exceeded the “all-to-labor basis” measure from 1981 to 1991 has the pathological implication that the capital share, and hence the marginal product of capital, were in fact significantly negative during the 1980s in the proprietors’ sector. By the same token, the large movements since the 1980s in the capital share of proprietors’ income implicit in the published series imply very large swings in return to capital among proprietors. These observations indicate that the

12 Brookings Papers on Economic Activity, Fall 2013
headline number significantly overstated the actual labor share during the 1980s, which calls into question subsequent trends in that series. To get a sense of this, it is useful to compare the headline number with the remain-ing two measures proposed by Kravis (1959).
The first of these is based on the assumption that the returns to capital, as captured by its user cost, are the same for the capital used by the payroll-employed and that used by the self-employed. Kravis refers to this as the “asset basis” measure of self-employment income. Conceptually, this approach is very similar to the way self-employment labor income is inferred in the BLS Multifactor Productivity (MFP) data, and so we present that estimate here.11 This measure has, for example, been used by Fernald (2012) to construct his real-time growth accounting data set.
The second of the remaining Kravis measures instead assumes that the labor share in entrepreneurial income is the same as that for the overall economy, what Kravis names the “economy-wide basis” measure. Gomme and Rupert (2004) favor this measure, for example.
Figure 3 compares these two alternative measures with the published headline measure, and table 1 includes some related summary statistics. Three observations stand out. First, from 1948 through 1987 the published measure is, on average, more than 1.5 percentage points higher than the two alternative measures. Second, aside from a period during the 1980s, the two alternative measures lie very close to each other. Third, since the mid-1990s all three measures have converged. Rows 6 through 8 of table 1 summarize the impact of these three observations on the measured declines of the labor share. The decline in each of the alternative labor share mea-sures is at least 1.7 percentage points smaller than the 6.4 percent decline in the headline measure.
The upshot of these comparisons is that around one third of the decline in the headline measure of labor’s share appears to be a by-product of the methods employed by the BLS to impute the labor income of the self-employed. Alternative measures that have less extreme implications regarding the return to capital among proprietors are more consistent with one another and indicate a more modest decline.
I.C. Reevaluating the Headline Measure
Since the published share is constructed under the assumption of identi-cal payroll and self-employment wages, and taking the alternative series in
11. Since Kravis’s (1959) analysis predates Jorgenson’s (1963) derivation of the user-cost equation, Kravis’s “asset basis” measure is different from the one in the MFP release, which is user-cost based.

Michael elsby, bart hobijn, and aysegül sahi.n 13
figure 3 at face value, the recent convergence of these measures suggests a sharp rise in the average hourly compensation of proprietors relative to the payroll-employed since the late 1980s. Such large trend shifts in the relative wages of the self-employed therefore potentially play a crucial role in the decline of the headline labor share measure. A key question, then, is what might explain these trend shifts.
The most compelling evidence emerges from comparisons of the evolu-tion of the income distributions within, respectively, the payroll-employed and the self-employed. Following Piketty and Saez (2003), we disaggre-gate the structure of the labor share associated with wages and salaries, and proprietors’ income, by fractile of the population.12 This analysis can be implemented through 2010 thanks to updated data from the World Top
Percent
1953 1958 1963 1968 1973 1978 1983 1988 1993 1998 2003 2008 2013
Source: Bureau of Labor Statistics, Bureau of Economic Analysis, and authors’ calculations.
58
60
62
64
66
Published - Labor basisEconomy-wide basisMFP - Asset basis
Figure 3. alternative Measures of labor share based on three estimates of self-employment labor income, 1948–2013
12. Strictly speaking, Piketty and Saez emphasize that the data correspond to fractiles of the distribution of “tax units,” defined as a married couple or single adult together with their dependents, as opposed to individuals.

14 Brookings Papers on Economic Activity, Fall 2013
Incomes Database, created by Facundo Alvaredo and others, which in turn are drawn from Internal Revenue Service tax returns statistics.13
The results of this exercise are illustrated in figure 4. The aggregate series depicted by the uppermost bold black line corresponds to the sum of the compensation and proprietors’ income areas in figure 2, the “all-to-labor basis” measure of the labor share. The lower dashed black line corresponds to payroll compensation as a fraction of value added, in the previous notation. The shaded regions that these two aggregates comprise depict the portion of the labor share from each source that is accounted for by each fractile of employees and proprietors, respectively.
13. The database, authored by Facundo Alvaredo, Anthony B. Atkinson, Thomas Piketty, and Emmanuel Saez and published online in 2013 as The World Top Incomes Data-base, may be found at http://topincomes.g-mond.parisschoolofeconomics.eu (last accessed 07/29/2013).
Percent
1953 1958 1963 1968 1973 1978 1983 1988 1993 1998 2003 2008
Source: Bureau of Labor Statistics, Bureau of Economic Analysis; IRS; authors’ calculations; and Alvaredo, The World Top Incomes Database (http://topincomes.g-mond.parisschoolofeconomics.eu).
Note: Labor share here includes all proprietors’ income without IVA and CCA (“All-to-labor basis”).
Top 0.1–0.01% Top 0.5–0.1%Top 1–0.5% Top 5–1%Top 10–5% Lower 90%All-to-labor basis Payroll share
30
35
40
45
50
55
60
65
Figure 4. nonfarm business labor share split Up by income Fractile, 1948–2013

Michael elsby, bart hobijn, and aysegül sahi.n 15
Figure 4 demonstrates that the share of income accounted for by both payroll wages and salaries and by proprietors’ income has been buoyed up since the 1980s by substantial rises in the shares accounted for by the very top fractiles of households in the United States. Indeed, the majority of the stability of the aggregate series has been sustained by rises in the income shares of just the top 1 percent of taxpayers.
This rise in inequality is even more striking for proprietors’ income than it is for payroll income. In 1948 the bottom 90 percent of employees earned 75 percent of payroll compensation. By 2010 this had declined to 54 percent. For entrepreneurial income, however, this fraction declined from 42 percent in 1948 to 14 percent in 2010. Even more starkly, over the same period the share of proprietors’ income accounted for by the bot-tom 99 percent fell from 74 percent to 45 percent. This suggests that the sharp rise in the average hourly compensation of proprietors relative to the payroll-employed since the late 1980s is related to substantial increases in income inequality among proprietors that dominate even the considerable rise in inequality witnessed among the payroll-employed. Moreover, this has been driven by extreme rises in proprietors’ income at the very top of the income distribution—the top 1 percent in particular.14
I.D. Summary
In this section, we have provided evidence to suggest that part of the trend decline observed in the published headline measure of the labor share in the United States is spurious. We have highlighted the impor-tant role played by the methods used to impute the labor income of the self-employed, in particular the assumption of equal hourly compensation between employees and the self-employed. The two most commonly used alternative measures of the labor share—the “economy-wide basis” and “asset basis” measures—exhibit more modest trend declines, and provide similar depictions of movements in labor’s share. Moreover, rises in com-pensation at the very top of the distribution of proprietors have been even
14. Of course, this evidence is merely suggestive. For one, we do not have measures for hours worked for the IRS tax units. However, the trends in inequality are of a mag-nitude too large to be offset by similar differential trends in hours worked. Moreover, this increase in inequality among entrepreneurial income also could reflect an increase in inequality in income flows from capital held by entrepreneurs rather than in labor. Inequal-ity, especially for proprietors’ income, might be understated in figure 4 because, as Johns and Slemrod (2010) point out, underreporting of income is more prevalent among high income earners.

16 Brookings Papers on Economic Activity, Fall 2013
more extreme than among employees, suggesting that the average hourly compensation of the self-employed has soared in recent decades relative to the payroll-employed, violating a key assumption underlying the headline measure.15
It is important to note, however, that the measures of the labor share that we consider also have much in common. In terms of long-run movements, table 1 shows that all measures indicate a substantial decline in labor’s share since the late 1980s. In terms of short-term fluctuations, figures 1 and 3 reveal that all measures are countercyclical, with the share rising during recessions and falling during expansions.16
A convenient aspect of the common movements in the U.S. labor share measures is that they are mirrored by similar fluctuations in the payroll share (see figure 1 and row 1 of table 1). Consequently, an understanding of movements in the U.S. labor share can be gleaned by accounting for the drivers of the payroll share, which is comparatively straightforward to measure, and can also be disaggregated, for example by industry. This is the task of the next section.
II. The Composition of Economic Activity
The previous section examined the empirical behavior of the labor share from an aggregate perspective. It established that the bulk of the recent decline in the labor share can be traced back to a decline in the aggregate payroll share. That broad description, however, veils the underlying dis-aggregate origins of movements in the aggregate payroll share. In this sec-tion we take a more microeconomic perspective by exploiting data on the sectoral composition of labor compensation and production. This allows us to shed light on (i) the degree of heterogeneity in the levels of, and changes in, payroll shares across sectors; (ii) systematic movements in the sectoral
15. In light of this, we suggest that the BLS adjust its headline labor share estimate to align more closely with either of the two alternative measures considered above. A quarterly estimate of the MFP share would be preferable to be consistent with the MFP data cur-rently published by the BLS. This would imply a different path of average compensation per hour—it would grow faster after the 1980s. One could continue to produce the current compensation per hour measure and rename it “payroll compensation per hour.” In addition, the BLS could publish payroll hours as well as the payroll share in addition to the labor share. All these data already are part of current calculations but are simply not included in the official release.
16. A result of these long- and short-run properties is that none of the measures is esti-mated to be stationary around a constant mean. Dickey-Fuller tests for unit roots and KPSS tests for mean stationarity suggest that all three measures of the labor share in figure 3 are not mean-stationary.

Michael elsby, bart hobijn, and aysegül sahi.n 17
composition of the U.S. economy; and (iii) the way the interaction of (i) and (ii) affects movements in the aggregate payroll share.
II.A. Decomposing the Decline in the Payroll Share
Our starting point is the simple observation that the aggregate payroll share, lP
in the above notation, is the value-added weighted sum of the payroll shares of each of the industries in the economy:
W L
PYP i
PiP
ii i
P
i
∑ ∑λ ≡ = ω λ(3) ,
where wi ≡ PiYi /PY is the value-added share of sector i, and lPi ≡ WP
iLPi /PiYi
is its payroll share. It is possible to measure each of the components of equation 3 using the industry accounts from the Bureau of Economic Analysis. Data by detailed industry are available at an annual frequency from 1948 to 1987 under the SIC72 industry classification, and from 1987 onward based on the NAICS02 coding.17
Figure 5 depicts the evolution of the cross-industry distribution of pay-roll shares over the postwar period. Consistent with equation 3, the dis-tribution is weighted by value added so that its mean replicates the path of the aggregate payroll share illustrated in figure 1. A key impression of figure 5 is that the magnitude of the variation in the aggregate payroll share (the mean) is dwarfed by the variation in these shares across industries. For example, in the most recent data, industries at the 25th percentile of total value added have a payroll share of around 30 percent while the cor-responding number for the 75th percentile is around 70 percent.
In light of this cross-industry variation, it is remarkable that the aggre-gate share has remained as stable as it has, given the large shift in the composition of U.S. economic activity—for example, from manufacturing
17. SIC72 is the 1972 vintage of the Standard Industry Classification, and NAICS02 is the 2002 vintage of the North American Industry Classification System. We use detailed data for 59 SIC72 industries and 60 NAICS02 industries. The GDP-by-industry data do not distinguish between nonprofit institutions serving households (NISHs) and businesses. As a result, the data include the compensation of NISH employees. To make the data for our analysis as comparable to the nonfarm business sector as possible, we took compensation for all industries excluding farms from the GDP-by-industry data and then rescaled both com-pensation and value added for each industry such that they aggregate to that of the nonfarm business sector. Details are available in the online appendix. (Online appendixes for papers in this volume may be found at the Brookings Papers website, www.brookings.edu/bpea, under “Past Editions.”)

18 Brookings Papers on Economic Activity, Fall 2013
to services—over the postwar period. This observation echoes Keynes’ sentiment that the “remarkable constancy” of the aggregate labor share is “a bit of a miracle” (1939, p. 49). This miraculous constancy of the payroll share is the outcome of movements across industries offsetting one another in subtle ways. To demonstrate this, table 2 implements a “shift-share” analysis of the change in the aggregate payroll share. Using equation (3), one can decompose changes in the aggregate share into two components:
� �� �� � �� ��P
i iP
i i iP
i∑ ∑∆λ = ω ∆λ + ∆ω λ(4) .Shift Share
The “shift” component summarizes the contributions of changes in within-sector payroll shares DlP
i to the change in the aggregate payroll share. The “share” component reports the contributions of changes in sectoral com-position Dwi. Due to a change in industry coding in 1987, we perform the analysis separately for the periods before and after this break. For the sake of brevity, we present the results obtained at the major sector level using
Figure 5. cross-industry Distribution of Payroll share, 1948–2011
Percent
1953 1958 1963 1968 1973 1978 1983 1988 1993 1998 2003 2008
Source: Bureau of Labor Statistics, Bureau of Economic Analysis, and authors’ calculations.
10
20
30
40
50
60
70
80
90
NAICS-02classification
Mean
Annual data; mean, 10th, 25th, 75th, and 90th percentile

Tabl
e 2.
shi
ft-s
hare
ana
lysi
s of
cha
nges
in P
ayro
ll sh
are
by M
ajor
sec
tor,
1948
–201
1 Pe
rcen
t
A. S
IC, 1
948–
87
Maj
or s
ecto
r
Shar
e of
val
ue a
dded
Payr
oll s
hare
Shift
-sha
re a
naly
sis
1948
1987
Cha
nge
1948
1987
Cha
nge
Shif
tSh
are
Non
farm
bus
ines
s se
ctor
100
100
056
.857
.40.
63.
5-2
.7N
atur
al r
esou
rces
and
min
ing
4.7
3.0
-1.7
40.6
36.8
-3.8
-0.1
-0.7
Con
stru
ctio
n5.
35.
50.
270
.469
.9-0
.50.
00.
1D
urab
le g
oods
man
ufac
turi
ng17
.612
.9-4
.776
.678
.51.
90.
3-3
.6N
on-d
urab
le g
oods
man
ufac
turi
ng15
.37.
6-7
.761
.363
.01.
70.
2-4
.7T
rade
/Tra
nspo
rtat
ion
and
util
itie
s31
.726
.0-5
.756
.959
.22.
30.
8-3
.3In
form
atio
n4.
15.
00.
966
.151
.9-1
4.2
-0.6
0.5
Fin
anci
al a
ctiv
itie
s12
.620
.57.
920
.126
.36.
31.
01.
8P
rofe
ssio
nal a
nd b
usin
ess
serv
ices
1.3
6.2
5.0
65.0
70.7
5.6
0.2
3.3
Edu
cati
on a
nd h
ealt
h se
rvic
es2.
47.
14.
750
.083
.733
.61.
63.
1L
eisu
re a
nd h
ospi
tali
ty1.
41.
60.
255
.763
.07.
30.
10.
1O
ther
ser
vice
s3.
54.
41.
061
.661
.5-0
.10.
00.
6
(con
tinu
ed)

B. N
AIC
S, 1
987–
2011
Maj
or s
ecto
r
Shar
e of
val
ue a
dded
Payr
oll s
hare
Shift
-sha
re a
naly
sis
1987
2011
Cha
nge
1987
2011
Cha
nge
Shif
tSh
are
Non
farm
bus
ines
s se
ctor
100
100
057
.453
.7-3
.8-3
.6-0
.1N
atur
al r
esou
rces
and
min
ing
2.2
2.5
0.3
42.4
32.2
-10.
1-0
.20.
1C
onst
ruct
ion
5.2
4.1
-1.1
72.6
72.4
-0.2
0.0
-0.8
Dur
able
goo
ds m
anuf
actu
ring
12.3
7.0
-5.2
78.7
68.4
-10.
3-1
.0-3
.8N
on-d
urab
le g
oods
man
ufac
turi
ng8.
26.
3-1
.962
.340
.4-2
1.8
-1.6
-1.0
Tra
de/T
rans
port
atio
n an
d ut
ilit
ies
22.6
19.3
-3.4
58.2
53.8
-4.4
-0.9
-1.9
Info
rmat
ion
4.9
5.0
0.1
47.8
42.5
-5.3
-0.3
0.0
Fin
anci
al a
ctiv
itie
s21
.223
.62.
524
.824
.90.
10.
00.
6P
rofe
ssio
nal a
nd b
usin
ess
serv
ices
9.6
14.6
5.0
70.9
72.5
1.6
0.2
3.6
Edu
cati
on a
nd h
ealt
h se
rvic
es6.
910
.13.
285
.086
.31.
20.
12.
7L
eisu
re a
nd h
ospi
tali
ty3.
84.
60.
865
.762
.1-3
.6-0
.10.
5O
ther
ser
vice
s3.
02.
9-0
.264
.970
.05.
20.
2-0
.1
Sour
ce: B
urea
u of
Eco
nom
ic A
naly
sis,
Bur
eau
of L
abor
Sta
tistic
s, a
nd a
utho
rs’ c
alcu
latio
ns.
Tabl
e 2.
shi
ft-s
hare
ana
lysi
s of
cha
nges
in P
ayro
ll sh
are
by M
ajor
sec
tor,
1948
–201
1 (C
onti
nued
) Pe
rcen
t

Michael elsby, bart hobijn, and aysegül sahi.n 21
the unweighted averages of w and l as the expansion point for the decom-position, though neither choice affects the results materially.
The first three columns of table 2 confirm the familiar observation that the composition of U.S. economic activity has shifted away from manu-facturing toward services. The combined value added share of manufac-turing (both durable and nondurable) and trade, transportation and utilities declined by a total of 18.1 and 10.5 percentage points, respectively, between 1948 and 1987 and between 1987 and 2011. This loss is almost exactly mirrored by the gains in three service sectors: financial activities; professional and business services; and education and health services. The impact of the changing composition of economic activity on the payroll share is summarized in the share-part of the shift-share analysis.
In table 2, panel A reports results for the earlier period, 1948 to 1987. During that period, payroll shares in the services sector tended to be smaller than in manufacturing. Therefore, everything else equal, the shift in activity from manufacturing to services would have resulted in a 2.7-percentage-point decline in the labor share over that period, the “share” component of panel A. This decline did not manifest itself, however—the payroll share in fact increased by 0.9 percentage points between 1948 and 1987. The reason is that the effect of the change in the composition of economic activity was offset by an increase in within-sector payroll shares, particularly in the ser-vice sectors, the “shift” part of panel A. Absent coincidental movements in sectoral composition, the aggregate payroll share would have risen by 3.5 percentage points between 1948 and 1987. It is these coincidental movements that resulted in the “miraculous” relative constancy of the labor share in the first four decades of the postwar period.
Such coincidental movements did not take place between 1987 and 2011. This can be seen from panel B of table 2. This demonstrates that, between 1987 and 2011, the transition from manufacturing to services has had little impact in aggregate.18 The reason is that payroll shares by major sector have converged in recent decades, so that compositional shifts have been broadly offsetting.19 What has driven the decline in the aggregate payroll share has been the decline in the fraction of income paid to workers in manufacturing, trade, transportation, and utilities. These are the sectors
18. A point also made by Karabarbounis and Neiman (2013). Estrada and Valdeolivas (2012) show that the same is true for France, Germany, Italy, Japan, Spain, and the United Kingdom.
19. What has increased is the within-major-sector variation in labor shares across detailed industries. This is why figure 5 does not show a large decline in the cross-industry variation in payroll shares.

22 Brookings Papers on Economic Activity, Fall 2013
with a large negative contribution to the “shift” part of the shift-share analysis.
The results in table 2 provide an important insight, namely that the recent trend decline in the aggregate payroll share is due mostly to declines in payroll shares within particular industries. Thus, understanding the sources of the decline in the aggregate payroll share requires understanding the declines in the payroll shares of individual industries.
II.B. Cyclical Fluctuations in the Payroll Share
Although our primary focus is on trend movements in the labor share, our analysis of disaggregated industry data also uncovers striking regulari-ties in the movements of the payroll share at higher frequencies.
One regularity that stands out is that the cyclical movements in the aggregate payroll share apparent in figure 1 are accounted for entirely by cyclical fluctuations within industries; changes in industry composition are immaterial for these high-frequency fluctuations. To establish this, table 3 uses equation (4) to motivate a decomposition of the variance of changes in the aggregate payroll share (as opposed to the decomposition of long differences in table 2). Since the variance is dominated by high-frequency variation, this provides a sense of the sectoral origins of the cyclical varia-tion in the payroll share. Table 3 reveals that, for both subsamples, the “shift” part of the variance decomposition contributes essentially all of the
Table 3. Variance Decomposition of annual changes in the aggregate Payroll share, 1948–2011
Major sector
SIC 1949–87 NAICS 1987–2011
Total Shift Share Total Shift Share
Nonfarm business sector 100 102 -2 100 109 -9Natural resources and mining 4 -1 5 1 -1 2Construction 10 5 5 13 7 6Durable goods manufacturing 33 36 -3 16 19 -3Non-durable goods manufacturing 9 11 -2 3 8 -5Trade/Transportation and utilities 24 28 -5 15 20 -5Information 5 5 0 10 17 -7Financial activities 3 10 -7 11 15 -4Professional and business services 5 3 2 29 13 17Education and health services 3 2 2 -5 3 -8Leisure and hospitality 1 1 0 4 5 -1Other services 2 2 1 2 3 0
Source: Bureau of Economic Analysis, Bureau of Labor Statistics, and authors’ calculations.Note: Percentage-point contributions to the variance of changes in the aggregate payroll share.
Michael elsby, bart hobijn, and aysegül sahi.n 23
variance. Additionally, for all sectors except mining (which includes oil and gas extraction), the contribution of the shift component is positive. This indicates that for all these sectors, changes in individual payroll share move in the same direction as in the aggregate.
As noted in the previous section, a conspicuous aberration from the recent trend decline in lP is the large rise and fall observed at the turn of the 21st century. Given its timing, one might naturally conjecture that this episode was caused by the tech bubble that emerged at the time. In par-ticular, analyses by Mehran and Tracy (2001) and Himmelberg and others (2004) suggest that the extensive use of stock options in the compensa-tion of employees in the tech and investment banking industries substan-tially affected compensation and profits measures in the national accounts between 1998 and 2003. As Moylan (2008) explains, stock options gener-ally are counted as part of compensation only when employees exercise them.20 Many tech and investment banking employees decided to exercise their options at the height of the tech bubble, propping up the payroll shares in tech and investment banking.21
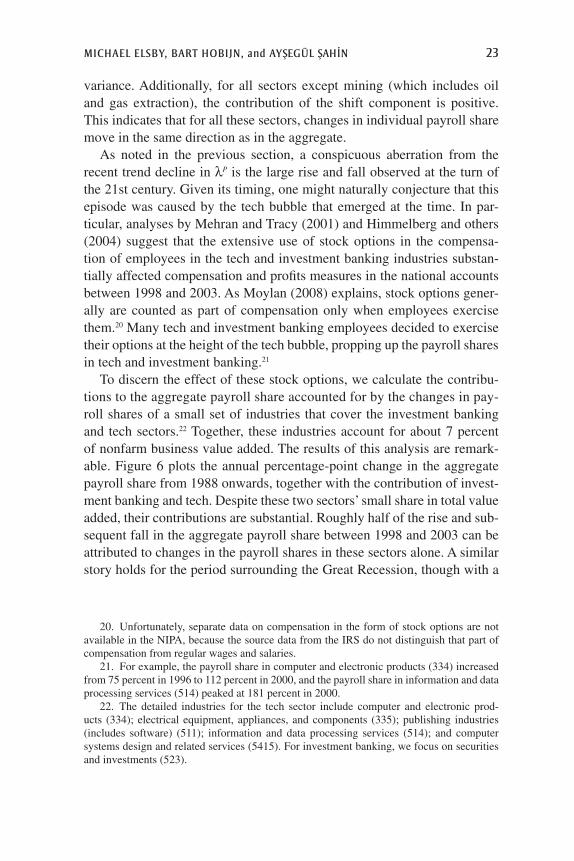
To discern the effect of these stock options, we calculate the contribu-tions to the aggregate payroll share accounted for by the changes in pay-roll shares of a small set of industries that cover the investment banking and tech sectors.22 Together, these industries account for about 7 percent of nonfarm business value added. The results of this analysis are remark-able. Figure 6 plots the annual percentage-point change in the aggregate payroll share from 1988 onwards, together with the contribution of invest-ment banking and tech. Despite these two sectors’ small share in total value added, their contributions are substantial. Roughly half of the rise and sub-sequent fall in the aggregate payroll share between 1998 and 2003 can be attributed to changes in the payroll shares in these sectors alone. A similar story holds for the period surrounding the Great Recession, though with a
20. Unfortunately, separate data on compensation in the form of stock options are not available in the NIPA, because the source data from the IRS do not distinguish that part of compensation from regular wages and salaries.
21. For example, the payroll share in computer and electronic products (334) increased from 75 percent in 1996 to 112 percent in 2000, and the payroll share in information and data processing services (514) peaked at 181 percent in 2000.
22. The detailed industries for the tech sector include computer and electronic prod-ucts (334); electrical equipment, appliances, and components (335); publishing industries (includes software) (511); information and data processing services (514); and computer systems design and related services (5415). For investment banking, we focus on securities and investments (523).

24 Brookings Papers on Economic Activity, Fall 2013
greater role played by investment banking than by the tech sectors, as one would expect.
Thus, mirroring the origins of the trend decline in the payroll share, movements in the share in individual industries also drive a large part of the cyclical movements in the aggregate. The striking lesson of figure 6 is that even very tightly defined sectors can experience such large swings in payroll shares that they leave a clear imprint on the evolution of these shares in the aggregate.
III. The Structure of Aggregate Technology
So far, we have limited ourselves to a quantitative description of what accounts for the movements of the U.S. labor share in the nonfarm business sector. In this section and the next we consider possible explanations for declines in the labor share. Our focus in this section is on models of aggre-gate technology that potentially give rise to such movements.
Percentage pointAnnual data
Source: Bureau of Labor Statistics, Bureau of Economic Analysis, and authors’ calculations. Note: Values are shift-contributions to percentage-point changes in payroll share.
–1.0
–0.5
0.0
0.5
1.0
1991 1994 1997 2000 2003 2006 2009
Securities and investments (523)Tech sector (334, 335, 511, 514, 5415)
Change in payroll share
Figure 6. contributions of changes in Payroll shares in tech and investment banking to aggregate, 1988–2012

Michael elsby, bart hobijn, and aysegül sahi.n 25
To fix ideas, we begin by investigating the simplest possible model in which movements in the labor share can be understood. Our point of depar-ture, then, is the neoclassical theory of distribution for an economy com-prising firms that operate in competitive product and factor markets and are endowed with a given technology. The historical stability of labor’s share has informed the widespread assumption in much of macroeconomics that a Cobb-Douglas technology applies. Thus, the focus of this section will be to assess the promise of alternative structures of technology in their ability to account for recent movements in labor’s share.
Before we delve further into the analysis, it is worthwhile to note the economic significance of such a neoclassical explanation, namely that it suggests that movements in factor shares are potentially informative on the structure of production and the nature of technical progress in the economy, two fundamental ingredients of macroeconomics.
III.A. The Role of Capital-Labor Substitutability
We start by investigating simple aggregative models. Imagine an economy endowed with a constant-returns-to-scale aggregate production function Y = F (AKK, ALL). Here, K is capital, L is labor (hours worked), and techni-cal progress may be either capital-augmenting (AK) or labor-augmenting (AL). Note that this nests both Harrod-neutral (purely labor-augmenting, AK ≡ 1) and Hicks-neutral (equally capital- and labor-augmenting, AK ≡ AL) technical change as special cases. These assumptions on the structure of production allow one to express labor’s share as
wL
Y
w
A f kL )(λ ≡ =(5) ,
where w is the real wage, k ≡ (AKK)/(ALL) is the ratio of efficiency units of capital to efficiency units of labor, and f (k) ≡ F (k, 1). Furthermore, if real wages and the rental rate on capital are determined competitively, then
wY
LA f k k f k r
Y
KA f kL K[ ]( ) ( ) ( )= ∂
∂= − ′ = ∂
∂= ′(6) , and .
Thus, we can write labor’s share as
kk f k
f kk( )
( )( )
( )λ = − ′ ≡ − α(7) 1 1 .

26 Brookings Papers on Economic Activity, Fall 2013
Due to the presence of competitive product markets, the remainder a(k) is of course capital’s share.
Two key implications emerge from this simple model: First, labor’s share is a function solely of the capital-labor ratio expressed in efficiency units, k. Second, it is determined exclusively by the structure of production embodied in f(). It follows that, in this simple economy, the labor share can move over time if technology is not isoelastic (that is, not Cobb-Douglas), and the ratio of efficiency units of capital to efficiency units of labor k moves over time.
Since Hicks (1932), it has been well understood that the relationship between the labor share l and the effective capital-labor ratio k can be linked generally to the elasticity of substitution between effective capital and labor, which we shall denote s:
d k
d F F k
d k
d kk
( ) ( )( )
( )σ = = +− λ
λ
′λ−
(8)ln
ln1
1
1
ln
ln1as 0.
2 1
1
� �
Thus, the labor share l (k) is predicted to decrease in k whenever the elas-ticity of substitution is greater than one (and vice versa). Put another way, whenever effective labor and capital are more substitutable than implied by a Cobb-Douglas production function, the labor share will decline in the effective capital-labor ratio k.
Eighty years after Hicks’ insight, Karabarbounis and Neiman (2013) revived this notion as a potential explanation of the evidence they pre-sent for secular declines in the global labor share. Based on cross-country variation, they infer estimates of the elasticity of substitution in the neigh-borhood of s = 1.25.23 Importantly, however, the presence of an elasticity of substitution different from one is not a sufficient condition for generat-ing long-run movements in labor’s share. For example, a standard result is that purely labor-augmenting technical change will imply that the effective capital-labor ratio k will be constant along a balanced-growth path, and thus so will the labor share, regardless of the elasticity of substitution.24 The key to this story is the generation of long-run movements in capital
23. By contrast, Antras (2004) and Chirinko (2008) suggest estimates of sigma in the range 0.4 to 0.6.
24. Movements in labor’s share could arise from transitional dynamics around the bal-anced growth path in this case, however.

Michael elsby, bart hobijn, and aysegül sahi.n 27
intensity; in the case of s >1, it is necessary for the effective capital-labor ratio to trend upward.
Neoclassical theory suggests two potential sources for capital deep-ening of this sort. The first is through capital-augmenting technical progress—that is, if AK in the above notation grows over time. A sec-ond channel is through investment-specific technical change driven by reductions in the relative price of investment associated with efficiency gains in the production of new capital goods (Greenwood, Hercowitz, and Krusell 1997). Karabarbounis and Neiman (2013) highlight the latter as a particularly promising candidate explanation for the decline in labor’s share.
A great virtue of the simple neoclassical framework is that it delivers a rich set of empirical predictions on the joint evolution of labor’s share, fac-tor prices, and productivity. These predictions can be confronted with the wealth of available data to assess the ability of this explanation to account for the evolution of labor’s share in the United States.
To demonstrate this, we begin with a simple observation. It is apparent from the alternative series in figure 3 that labor’s share has not trended downward throughout the postwar era. Despite some differences across measures, the strongest evidence of a decline emerges after the 1980s. (This, of course, is why the proposed stability of the labor share has been such a robust stylized fact of macroeconomics.) Thus, for the decline of labor’s share to be a manifestation of the structure of production and the nature of technical progress requires that one or both of these have changed at some point in time. This simple observation has interesting implications for the process by which a decline in labor’s share will emerge.
A first corollary is a qualitative one. As the preceding discussion demon-strates, if s >1, the key to a shrinking labor share must be traced to a form of capital deepening—that is, the capital-labor ratio in efficiency units k must grow. But neoclassical theory also predicts that growth in k will be associated with other adjustments in the economy. An important example in the U.S. context is that, for a given growth rate of labor-augmenting tech-nical progress, both output-per-hour Y/L = AL f (k) and real wages w = AL
[ f (k) - kf ′(k)] will be predicted to grow faster. And, consistent with a declining labor share, the additional growth in output per hour will outstrip the additional growth in real wages.
Figure 7 confronts this prediction with the path of real compensation per hour and output per hour experienced in the U.S. economy. Specifically, it plots the growth rates of these variables as measured by the BLS Labor

28 Brookings Papers on Economic Activity, Fall 2013
Productivity and Costs program for the nonfarm business sector.25 The growth rate of the labor share, of course, is simply the difference between growth in hourly compensation and output per hour. All series are plotted as 10-year centered moving averages to smooth out high-frequency varia-tion associated with business cycles, short-run adjustment dynamics, and so forth.
The decomposition of the decline in labor’s share in figure 7 suggests that the experience of the United States in recent decades is only partly
Log pointsQuarterly observations
Source: Bureau of Labor Statistics. Note: Values are 10-year centered moving averages of annualized growth rates. Real wages deflated
using the NFB output deflator.
1998 2003199319881983197819731968196319581953
0.5
1
1.5
2
2.5
3
Growth in real hourly compensation
Growth in output per hour
Figure 7. growth of real hourly compensation and output per hour in the nonfarm business sector, 1953–2008
25. Bosworth and Perry (1994) point out the sensitivity of the trend properties of the real wage compared to average labor productivity with respect to the deflator being used for the real wage. We use the nonfarm business output deflator here. Using the CPI or PCE deflator would result in slower real wage growth since the 1980s and only strengthen the point we make.

Michael elsby, bart hobijn, and aysegül sahi.n 29
consistent with a neoclassical story based on an elasticity of substitution in excess of one together with capital deepening. Viewed through this lens, two distinct episodes are apparent. The decline in the labor share from the 1980s to the mid-1990s was characterized in part by a period of rising growth in the late 1980s during which growth in average labor productiv-ity surpassed hourly compensation growth, consistent with the neoclassical story above.
By contrast, however, the substantial recent decline in the labor share that emerged at the turn of the 21st century appears wholly due to a slow-down in growth marked by a profound, and unprecedentedly sharp, stagna-tion of hourly compensation growth. This important feature of the recent U.S. experience appears hard to reconcile with a simple story based on the structure of production and technical change.
In addition to this qualitative observation, the simple theoretical analysis above also highlights quantitative implications of the timing of the decline in labor’s share. Rearranging equation 8 provides a tight link between the elasticity of substitution s and the magnitude of the response of labor’s share to the effective capital-labor ratio k:
d d k( )λ = − − λ σ −σ
(9) ln 11
ln .
Evaluating the latter at a value of s = 1.25 and a reasonable value for labor’s share, say l = 0.6, suggests a d ln l(k)/d ln k of around -0.08. Thus, to generate an 8-percent decline in the labor share—which is about the magnitude seen in the data—it is necessary for the capital-labor ratio in efficiency units, k, to double. If, as neoclassical theory suggests, the latter is the outcome of either capital-augmenting or investment-specific technical progress, growth in the capital-labor ratio K/L will be predicted to acceler-ate for a given growth rate of labor-augmenting technical progress.
This suggests an additional simple check on the neoclassical account for movements in labor’s share, namely to confront this prediction with the empirical behavior of modern estimates of the capital-labor ratio. Figure 8 implements this using the real-time growth accounting data recently devel-oped by Fernald (2012).26
Fernald provides a measure of capital input constructed from an aggre-gate of individual measures of heterogeneous capital goods based on
26. The estimates in Fernald (2012) are for the business sector rather than the nonfarm business sector.

30 Brookings Papers on Economic Activity, Fall 2013
the perpetual inventory method. Consistent with firm optimization, the aggregate capital stock is measured as a service-flow-weighted sum of the stocks of each type of capital, where the weights are based on user cost estimates for each type.
Figure 8 plots the growth rate of the capital-labor ratio implied by Fer-nald’s measure of capital input and the BLS Labor Productivity and Costs measure of hours worked for the business sector. Again, series are plotted as 10-year centered moving averages to highlight medium-run variation. It is clear from figure 8 that there have been periods of elevated growth in the capital-labor ratio. However, the timing of these periods of capital deepening does not align straightforwardly with the timing of movements in labor’s share. Although the 1990s witnessed significant growth in K/L, the period since 2000, during which labor’s share has fallen substantially, has instead been marked by a considerable slowdown in growth in capital intensity.
Log pointsQuarterly observations
Source: Fernald (2012). Note: Values are 10-year centered moving averages of annualized growth rates.
2002199719921987198219771972196819621957
0
1
2
3
4
5
Capital-labor ratio
Investment-specific technological change
Figure 8. growth of capital-labor ratio and investment-specific technological change in the business sector, 1952–2007

Michael elsby, bart hobijn, and aysegül sahi.n 31
For a given rate of labor-augmenting technical progress, then, the paths of real wages, productivity, and the capital-labor ratio since 2000 diverge from the paths implied by an account of the decline in labor’s share based on capital deepening. A potential reconciliation, of course, is that the rate of labor-augmenting technical progress fell since 2000. Two considerations add a note of caution to that interpretation. First, any such declines in the growth of AL would have to be so precipitous that they more than offset the acceleration of growth in the effective capital-labor ratio k at the heart of the capital deepening story. Second, measures of investment-specific tech-nological change have exhibited a similar slowdown since 2000. Figure 8 reveals that, although the initial acceleration in investment-specific tech-nological change coincided with the onset of the decline in the labor share, the acceleration of the decline in the labor share over the last decade was not accompanied by an acceleration in investment-specific technological change. On the contrary, investment-specific technological change slowed down during the latter period.
The evidence suggests that the origins of the falling labor share in the United States do not dovetail easily with the neoclassical theory of distribution based on a simple aggregate production function. This has two possible implications: Either neoclassical theory is unable to provide a coherent account of the decline in labor’s share, or a simple aggregate production function is too crude to capture the relevant economic forces. In the remainder of this section, we explore the latter by investigating the potential role of richer production structures and factor heterogeneity.
III.B. Skill-Biased Technological Change and Capital-Skill Complementarity
The simple aggregative benchmark analyzed above makes strong assump-tions about the nature of the production process. A prominent example is its abstraction from heterogeneity in capital and labor, for example by vintage and by skill. There are empirical reasons to suspect that such heterogene-ities have played an important role in recent decades in the U.S. economy. In particular, the substantial growth in wage inequality in the United States since the early 1980s has motivated two prominent and related hypotheses on the structure of technology.
The first hypothesis concerns skill-biased technical change, based on the notion that technical progress particularly augments the productiv-ity of high-skilled workers relative to the low-skilled, yielding rising wage inequality (Bound and Johnson 1992; Katz and Murphy 1992). The second hypothesis, based on capital-skill complementarity, explores

32 Brookings Papers on Economic Activity, Fall 2013
the possibility that the elasticity of substitution between capital and skilled labor is less than that between capital and unskilled labor (Griliches 1969; Berman, Bound, and Griliches 1994). Applied to the case at hand, declines in the relative price of new investment goods since the 1980s could have stimulated capital deepening and thereby an increased skill premium due to capital-skill complementarity (Krusell and others 2000).
In isolation, neither explanation provides an obvious account for a decline in the labor share. Skill-biased technical change can arise even in the presence of constant factor shares (for example, a Cobb-Douglas technology between capital and a constant-elasticity-of-substitution aggre-gate of labor by skill). Likewise, by operating through movements in the capital-labor ratio, the capital-skill complementarity story will affect the labor share for the same reasons noted in the subsection above—that is, if the elasticity of substitution between capital and labor (regardless of skill) differs from unity. Indeed, in their quantitative analysis of capital-skill complementarity, Krusell and others (2000) find very small effects on the labor share.
To see why, consider a constant-returns-to-scale aggregate production function with three factors, y = F (k, s, u), where capital k, skilled labor s, and unskilled labor u = 1 - s all are measured in units of effective labor. Mirroring equation (9), it is possible to show that labor’s share will move according to the following relation:
d d k
s
sd s
s ks s ku
s ku s ks }{[ ]( ) ( )
( )
λ = − − λ ω ρ + − ω ρ
+−
− ω ρ − ω ρ
(10) ln 1 1 ln
11 ln ,
where rks ≡ (sks - 1)/sks and rku ≡ (sku - 1)/sks\u measure the degree of substitutability27 between capital and labor by skill, and ws is the skill share of labor income. Equation 10 reiterates the point that the effect of capital deepening on labor’s share in this more complicated environment mirrors those noted above in equation 9, where the overall degree of substitut-
27. The ss here correspond to the so-called Hicks direct partial elasticities of substitution for this case of three inputs. While the concept of elasticity of substitution becomes more complex with more than two inputs (indeed, a variety of measures has been proposed), prac-tical implementations of capital-skill complementarity often have used production functions for which these distinctions do not matter (see, for example, the two-level CES specification used by Krusell and others 2000).

Michael elsby, bart hobijn, and aysegül sahi.n 33
ability between capital and labor takes the form of a weighted average of rks and rku.
What is new is that changes in the skill mix of the labor force can cause the labor share to move in the presence of capital-skill complementarity (rks < rku). Possible reasons for such a change include growth in the supply of highly educated workers and skill-biased technical change.
The magnitudes of such effects of “skill deepening” could be substan-tial. For example, Acemoglu and Autor (2011) present estimates of relative weekly wages and supply for college- versus high school-educated workers using March Current Population Survey data for the years 1963 to 2008. These estimates suggest that the share of college-educated workers (in effi-ciency units) s rose by around 75 log points over this period, and average values for the skill share of labor income and relative supply of around ws ≈ 0.5 and s/(1 - s) ≈ 1. Krusell and others (2000) provide estimates of capital-skill complementarity parameters of about rks ≈ -0.5 and rku ≈ 0.4.
Combining these with a reasonable value for labor’s share, l = 0.6, suggests a contribution of skill deepening to a decline in l on the order of -0.4 × (1 × 0.5 × 0.4 + 0.5 × 0.5) × 75 = 13.5 log points, similar to the order of magnitude seen in the data.
Despite this, a difficulty with this line of reasoning relates to the timing of movements in the labor share. Figure 9 illustrates the point. Rises in the skill share of labor have occurred continually since the 1960s in the United States. Thus, the implied labor share, which is computed using a rolling year-by-year implementation of equation (10), is also predicted to fall con-tinually throughout the sample period. As we have emphasized before, the reductions in the empirical labor share in figure 3 are concentrated after the 1980s, preceded by relative trend stability, in contrast to the predictions of figure 9. Put another way, the United States has not experienced a sharp acceleration in the skill share of labor in recent decades in a manner con-sistent with the timing of movements in the labor share.
III.C. Taking Stock
Our analysis of a range of neoclassical explanations suggests that they provide an incomplete account of the movements in the labor share observed in recent U.S. history. Simple aggregative stories based on a non-unit elasticity of substitution between capital and labor face difficulties in explaining the joint movements in real wages, productivity, and capital-labor ratios over the last few decades. Increases in the skill composition of the labor force combined with capital-skill complementarity have difficulty in replicating the peculiar timing of declines in the labor share.
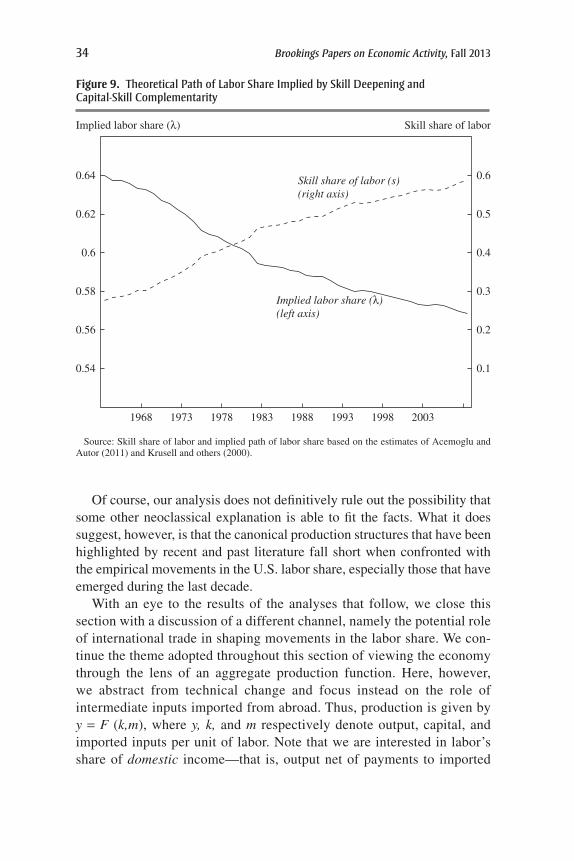
34 Brookings Papers on Economic Activity, Fall 2013
Of course, our analysis does not definitively rule out the possibility that some other neoclassical explanation is able to fit the facts. What it does suggest, however, is that the canonical production structures that have been highlighted by recent and past literature fall short when confronted with the empirical movements in the U.S. labor share, especially those that have emerged during the last decade.
With an eye to the results of the analyses that follow, we close this section with a discussion of a different channel, namely the potential role of international trade in shaping movements in the labor share. We con-tinue the theme adopted throughout this section of viewing the economy through the lens of an aggregate production function. Here, however, we abstract from technical change and focus instead on the role of inter mediate inputs imported from abroad. Thus, production is given by y = F (k,m), where y, k, and m respectively denote output, capital, and imported inputs per unit of labor. Note that we are interested in labor’s share of domestic income—that is, output net of payments to imported
Implied labor share (λ) Skill share of labor
Source: Skill share of labor and implied path of labor share based on the estimates of Acemoglu and Autor (2011) and Krusell and others (2000).
0.1
0.2
0.3
0.4
0.5
0.6
0.54
0.56
0.58
0.6
0.62
0.64
1968 1973 1978 1983 1988 1993 1998 2003
Implied labor share (λ)(left axis)
Skill share of labor (s)(right axis)
Figure 9. theoretical Path of labor share implied by skill Deepening and capital-skill complementarity

Michael elsby, bart hobijn, and aysegül sahi.n 35
factors. Under constant returns, the effect of increased use of imported intermediates is given by
)()(∂ λ∂
= − − λ µ ρ − ρ(11)ln
ln1 ,
mlm km
where rlm and rkm index the substitutability28 of labor and capital with respect to imported inputs, and µ is the income share of m in gross output y. Taken from an aggregate perspective, then, increased import exposure will reduce labor’s share if imported intermediates are more substitutable with labor than they are with capital, rlm > rkm. Intuitively, imported intermediates will be expected to induce greater substitution away from labor than from capital in this case. Our examination of disaggregated data in the ensuing sections shows that there is something to that expectation. For now, though, we note that the timing of the recent expansion of trade with developing economies accords somewhat better with the timing of the trend decline in the labor share since the late 1980s relative to accounts based on capital deepening.29 In what follows, we show that there is a parallel link between these two trends in more disaggregated data.
IV. Exploiting Cross-Industry Variation
Since the most common aggregate production function representations fail to match the recent path of the labor share, in this section we con-sider several explanations that exploit cross-industry variation in payroll share declines documented in section II. We first revisit the investment-specific technological change hypothesis from an industry perspective. Available data for the period 1987 to 2011 suggest that it is not the case that the industries that saw the smallest increases in equipment prices are also those with the highest payroll share declines. We then consider two alternative explanations for the declines in labor shares across industries: (i) declines in unionization, and (ii) increased import competition. Our data yield one robust correlation: that declines in payroll shares are more
28. As before, here rij ≡ (sij - 1)/sij, and the ss are the Hicks direct partial elasticities of substitution.
29. A recent aberration to the general trend of increased trade has been the Great Reces-sion, which was accompanied by a significant decline in trade, the so-called “trade collapse.” Nevertheless, this collapse has been almost entirely reversed since the recession; import penetration in the U.S. economy remains significantly above its pre-1990s level.

36 Brookings Papers on Economic Activity, Fall 2013
severe in industries that face larger increases in competitive pressures from imports.
IV.A. Investment-Specific Technical Change and Variation in Equipment Price Inflation
Our analysis in section 3 suggests a weak link between the decline in the labor share and investment-specific technical change. However, that analysis is based on a simple aggregate production function framework and could potentially be too crude to capture some of the changes in the production structure.
In this section, we instead exploit cross-industry variation to explore whether those industries experiencing the biggest declines in their payroll shares are also those that tend to invest in types of equipment whose prices increase more slowly. That is, if the decline in the payroll share is due to firms’ replacing workers with machines, then sectors that invest in types of equipment with slower price increases should see larger declines in their payroll shares.30 This would result in a positive relationship between the rate of equipment price increases and the change in the payroll share across industries.
Figure 10 plots this relationship using our data. On the horizontal axis is the average annual percent change in the price of equipment and soft-ware an industry invests in for 1987 through 2011. These data are taken from the Fixed Asset Tables made available by the Bureau of Economic Analysis. On the vertical axis is the percentage-point change in an indus-try’s payroll share between 1987 and 2011. We use the same sample of 60 NAICS industries that underlies the post-1987 results in section II. We exclude oil and gas extraction from the sample, since movements in that industry’s payroll share are driven almost completely by changes in the price of oil. Industries in the scatterplot are split up into manufacturing (the squares) and nonmanufacturing (the circles). The size of each of the mark-ers is proportional to the average value added share of the corresponding industry over the period 1987 to 2011. The dashed line is the weighted-least-squares regression line, where the industries are weighted by their value added shares.
30. This is most often stated in the relative price of equipment (relative to output). Here we focus on the equipment price itself. Unreported results for the relative equipment price are qualitatively similar to the ones presented here.

Michael elsby, bart hobijn, and aysegül sahi.n 37
A first interesting observation from Figure 10 is that declines in both payroll shares and equipment prices were commonplace from 1987 to 2011. Around three-quarters of industries experienced a decline in their payroll share; around half of them experienced a decline in the equipment investment price. However, substantial declines in equipment price have not always been associated with payroll share declines. For example, the three industries with the biggest investment price declines saw either a small decline, or even an increase, in their payroll share.
Consequently, as figure 10 shows, there is in fact a weak negative rela-tionship between the change in equipment prices and payroll shares across industries. This is the opposite of what one would expect if capital deep-ening due to the decline in price of equipment were the driving force of the decline in the payroll share. This evidence strengthens the findings of our aggregate analysis and suggests that a shift to more capital-intensive production methods to exploit declines in equipment prices has not been a major factor in the evolution of the payroll share over the past 25 years.
∆ Payroll share (percentage points), 1987–2011
Source: Bureau of Economic Analysis, Bureau of Labor Statistics, and authors’ calculations. Note: Data cover 59 NAICS sectors; size of circle/square reflects value added share.
–30
–20
–10
0
10
20Securities, commodity contracts, and investments
Legal services
Computer systems design and related services
–6 –5 –4 –3 –2
∆ Equipment price (percentage points), 1987–2011
–1 0 1 2
ManufacturingNon-manufacturing
Figure 10. equipment Price inflation and changes in Payroll shares by industry

38 Brookings Papers on Economic Activity, Fall 2013
IV.B. Deunionization
An important change to the institutional structure of the U.S. labor mar-ket has been the decline in unionization. The fraction of workers covered by a union or employee association contract in the private nonagricultural sector has shrunk by almost half, from 14.6 percent in 1987 to 7.7 percent in 2011.31
The bargaining power of unions tends to increase workers’ share of the surplus generated in the production process. For example, Hirsch (2012) estimates that union wage premiums in the private sector were about 25 percent in 1984.32 Given the existence of a substantial union wage premium, a large decline in union membership might be expected to result in a decline in the aggregate labor share. Such a decline would
31. The unionization data we use are described in Hirsch and Macpherson (2003).32. Hirsch (2012) finds that while there has been a modest downward trend in the union
wage premium in the private sector, it still remained at around 20 percent in 2010.
–30 –20 –10 0 10
∆ Payroll share (percentage points), 1987–2011
Source: Bureau of Economic Analysis, Bureau of Labor Statistics, and authors’ calculations. Note: Data cover 59 NAICS sectors; size of circle/square reflects value added share.
–30
–20
–10
0
10
20
∆ Union coverage rate (percentage points), 1987–2011
ManufacturingNon-manufacturing
Figure 11. Deunionization and changes in Payroll shares by industry

Michael elsby, bart hobijn, and aysegül sahi.n 39
Table 4. regressions identifying cross-industry Variation in changes in Payroll shares, 1987–2011
Dependent variable: payroll share (%-point), 1987–2011 4.1 4.2 4.3 4.4 4.5
Change in equipment price (%), 1987–2011
-1.52(0.78)
-1.03(0.72)
-0.90(0.74)
Change in unionization coverage rate (%-point), 1987–2011
0.22(0.14)
0.01(0.13)
Change in import exposure (%-point), 1993–2010
-0.87***(0.21)
-0.81***(0.22)
-0.82**(0.24)
R2 0.06 0.04 0.22 0.25 0.25No. of observations 59 56 59 59 56
Note: Statistical significance levels: * p < 5 percent; ** p < 1 percent; *** p < 0.1 percent. All results are obtained using weighted least squares with an industry’s average value added share over 1987 to 2011 as the weight.
in turn be expected to be concentrated in the industries with the largest declines in union coverage.
To explore this possibility, we make use of data on the change in union coverage rates by industry between 1987 and 2011. Figure 11 plots these data against the change in payroll shares. From the figure it can be seen that, although there is a positive correlation between the change in union-ization and the change in payroll shares across industries, the relationship is weak. The weighted least squares regression (column 4.2 in table 4) indi-cates that cross-industry variation in changes in unionization rates explains less than 5 percent of the variation in changes in payroll shares across industries. Though statistically insignificant, at 0.22, the point estimate of the effect of deunionization on the payroll share implies that in this simple regression deunionization can explain 1.5 percentage points of the drop in the aggregate payroll share.
IV.C. Globalization: The Role of Rising Imports
There has been a substantial increase in imports in the United States in the last few decades.33 Part of this rise is a consequence of vertical spe-cialization, which occurs when countries specialize in particular stages of a good’s production sequence, rather than in the production of the entire good, as discussed by Hummels, Ishii, and Yi (2001) and Yi (2003). In this
33. The ratio of imports to GDP went up from 10 percent in 1993 to around 16 percent in 2010.

40 Brookings Papers on Economic Activity, Fall 2013
subsection, we investigate the potential effects of such offshoring on recent trends in the U.S. labor share.
At the close of section III we noted that increased import penetration would be expected to depress labor’s share of domestic income if imported intermediates were more substitutable with labor than with capital from the perspective of an aggregate production technology. From a microeconomic viewpoint, there are at least two channels by which such an effect could emerge. The first is reminiscent of the capital-labor substitutability hypoth-esis outlined in section III, except that movements in capital intensity are envisioned as the outcome of international trade.34 Standard comparative advantage arguments imply that, when firms segment the production pro-cess, they will shift constituent parts to foreign countries with comparative advantage in the production of those specified parts. In many industrial-ized countries, including the United States, this shift has taken the form of moving the production of labor-intensive intermediate and final goods to labor-abundant countries with lower labor costs (see, for example, Feenstra and Hanson 1996a, 1999). By offshoring the more labor-intensive part of U.S. production, the remaining production in the U.S. economy would be expected to become more capital intensive. If, in addition, capital is more than unit-elastic with respect to labor, Hicks’ (1932) result will imply that the U.S. labor share will fall.
It is worth noting that this account is plausibly consistent with declines in labor shares not only in source countries, such as the U.S., but also in the destination countries to which production is offshored, such as China. This is important if, as Karabarbounis and Neiman (2013) suggest, declines in labor’s share have occurred globally. In particular, it is possible that off-shored production processes that are labor-intensive by U.S. standards also are capital-intensive relative to existing production in China. And, indeed, there are precedents for this type of result in prior literature. Feenstra and Hanson (1996b), for example, note the importance of increased capital flows from the United States to Mexico in reconciling wage movements associated with offshoring between these two economies.
A difficulty with this first trade-based explanation, however, is that it faces the same challenges associated with other accounts based on capital deepening, namely that the timing of such deepening in the United States does not accord well with the timing of the decline in labor’s share (see
34. Of course, it is also possible that the processes of technical change emphasized in section III and the increased penetration of imports of intermediate goods emphasized here are linked.

Michael elsby, bart hobijn, and aysegül sahi.n 41
figure 8). The second possible trade-based channel that we highlight does not rely on shifts in capital intensity, but instead takes as its point of depar-ture the abundant evidence for inter-industry wage differentials documented by Dickens and Katz (1987) and Krueger and Summers (1988), among others. Viewed from this perspective, industry differences in labor shares have a more prosaic interpretation: Industries with high shares are those for which labor is expensive relative to its average productivity. It is natural to posit that these elements of the production structure would be particu-larly sensitive to import exposure, leading to a lowering of labor’s share in such sectors. Again, note that this explanation is amenable to the possibility that labor’s share will also fall in offshoring destination economies. If, for example, offshored wages are determined in part by low market wages in the destination country and average labor productivity is determined in part by superior technologies from developed source economies, it is natural to imagine that offshored production units will have labor shares that are low relative to elsewhere in the destination economy.
In what follows, we assess the role of increased competition that U.S. workers are facing due to rising imports, leaving aside the important ques-tion of identifying the underlying economic channel for future work. To do so, we compute what we call import exposure for each of the industries that we consider. We make that computation by posing the following ques-tion: If the United States were to produce domestically all the goods that it imports,35 how much additional value added would each industry have to produce? For example, if all U.S. imports of clothes were produced domes-tically, how much would value added increase in sectors like retail, textile manufacturing, and so on.
To be able to calculate this measure of import exposure we use the annual input-output matrices that are available for the years 1993 to 2010 from the BLS. Import exposure is expressed as the percentage increase in value added needed to satisfy U.S. final demand if the United States would produce all its imports domestically.36
Figure 12 plots the relationship between changes in import exposure and changes in the payroll shares for our sample of industries. The figure
35. At current factor prices and productivity levels.36. In terms of input-output terminology, our measure of import exposure is the percent-
age difference between total domestic requirements and total requirements for an industry. One important aspect this measure does not capture is international round-aboutness of trade, where U.S. exports are used as intermediate inputs abroad for the production of goods that then end up being imported into the United States.

42 Brookings Papers on Economic Activity, Fall 2013
indicates that import exposure increased for almost all the industries; the aggregate pattern is not driven by a few sectors. It also reveals that those industries that faced the biggest rises in their import exposure also tended to experience the largest declines in their payroll share. Column 4.3 in table 4 shows that the weighted least squares regression behind the plotted regression line is significant at the 0.1 percent level. It implies that the variation in the change in import exposure explains 22 percent of the cross-industry variation in payroll-share changes.
The final column of table 4 contains the results of a multivariate regres-sion that jointly evaluates the quantitative importance of the three poten-tial explanations considered in this section: investment-specific technical change, deunionization, and globalization. This shows that the effect of increased import competition on payroll shares across industries is robust to the inclusion of the other two explanatory variables. Moreover, once the change in import exposure is included the coefficient on the change in union coverage rates becomes effectively zero. This suggests that those sec-
∆ Payroll share (percentage points), 1987–2011
Source: Bureau of Economic Analysis, Bureau of Labor Statistics, and authors’ calculations. Note: Data cover 59 NAICS sectors; size of circle/square reflects value added share.
–30
–20
–10
0
10
20
∆ Import exposure (percentage points), 1993–2010
0 10 20 30
ManufacturingNon-manufacturing
Figure 12. import competition and changes in Payroll shares by industry

Michael elsby, bart hobijn, and aysegül sahi.n 43
tors where deunionization was most prevalent are also sectors that saw the biggest increase in import exposure. The residual variation in the change in unionization rates does not explain much of the decline in the labor share.
Of course, this analysis is based on a set of simple cross-industry regres-sions and is thus subject to many caveats. Still, our results indicate a cross-industry link between the increases in import exposure and the decline in the labor share.37 While this result cannot be interpreted as causal, it is worth noting that the statistical relationship between import exposure and payroll shares across industries is large enough to account for a substan-tial fraction of the aggregate trend decline in the labor share. In particular, aggregating the results of the weighted-least-squares regression reported in column 4.3 of table 4 across industries suggests that increases in the import exposure of U.S. businesses can account for 3.3 percentage points of the 3.9 percentage point decline in the U.S. payroll share over the past quarter century.38 This suggests that a particularly fruitful avenue for future research will be to delve further into the causal channels that underlie this statistical relationship, in particular the possibility that the decline in the U.S. labor share was driven by the offshoring of the labor-intensive com-ponent of the U.S. supply chain.
V. Practical Implications and Future Developments
In the previous four sections we uncovered the main facts behind and explanations for the decline in the U.S. labor share. We conclude by con-sidering whether these facts and explanations warrant a major rethinking of how the labor share is used in empirical macroeconomics. In addition, with these factors and explanations in mind, we discuss what might drive movements in the labor share in the foreseeable future.
V.A. Reconsidering the Use and Interpretation of the Labor Share
In applied macroeconomics there are three important uses of the labor share. We discuss each of these separately in this subsection.
37. We are not the first to highlight the potential role of globalization and openness to trade: see, for example, Guscina (2006), Harrison (2005), Jaumotte and Tytell (2007) and Böckerman and Maliranta (2011). More recently, Autor, Dorn, and Hanson (2013) have established the important role of import competition in shaping local labor market outcomes in the United States.
38. This 3.3-percentage-point estimate is computed from the point estimate 0.87 times the value added weighted average increase in import exposure across industries.
44 Brookings Papers on Economic Activity, Fall 2013
Factor incoMe share The most straightforward interpretation of the labor share is as a measure of the distribution of income between the pro-ductive factors of capital and labor. It is in this context that Kaldor (1957, 1961) suggests that constancy of the share is a reasonable approximation to the data that should be replicated by models of economic growth. In prac-tice, the relative constancy of the labor share has often been interpreted as an endorsement of the use of a Cobb-Douglas representation of aggregate technology in growth models. Of course, the use of a Cobb-Douglas pro-duction function does not explain the relative constancy of factor shares; it simply postulates it.
The problem with gauging whether movements in the labor share dis-pel the stylized fact of constancy is that, as Solow (1958, p. 618) puts it, “The literature does not abound in precise definitions, but obviously literal constancy is not in question.” So, are the recent movements in the U.S. labor share of an order of magnitude that would justify reconsidering the assumption of approximate constancy of factor shares? The answer to this question depends on the context to which the labor share is applied as a measure of factor shares.
The most common application of factor income shares is in growth and development accounting, in particular in the measurement of TFP. In its simplest form, TFP growth is the difference between output growth, d ln Y, and a factor-income-share-weighted average of the growth rates of labor, d ln Y, and capital, d ln K.
Suppose that the true labor share is l but that the measured share used for the growth-accounting exercise is l* = l + e. In that case, measured TFP growth, d ln TFP*, equals
( )
( )
= − λ − − λ
= + ε −
(12) ln * ln * ln 1 * ln
ln ln ln .
d TFP d Y d L d K
d TFP d K d L
This differs from actual TFP growth, d ln TFP, by an amount equal to the measurement error, e, times the growth rate of the capital-labor ratio. The latter is depicted in figure 8 and averages 2.27 percent over the post-war period. Thus, if one were to use an estimate of the labor share consis-tently 5 percentage points higher than the actual share—around the order of magnitude of the recent decline—then, on average, one would obtain an estimate of annual TFP growth just 0.11 percentage points higher than its true counterpart.
To put into perspective the assumption of constancy of the labor share in this context, we recalculate Fernald’s (2012) measure of TFP growth

Michael elsby, bart hobijn, and aysegül sahi.n 45
with the labor share held constant at its postwar average. Figure 13 plots both the time-varying and constant labor shares used in these calculations, as well as the two implied measures of TFP growth constructed using these two labor share measures. As can be seen from the figure, to all intents and purposes both measures of TFP growth are the same.39
Therefore, in spite of the recent decline in the labor share, it is important to bear in mind that there remain prominent applications, such as growth and development accounting, for which these movements do not make an appreciable difference.
the bUsiness cycle, MarKUPs, anD resoUrce slacK There are many theo-retical and empirical applications that emphasize and exploit the cyclical
Log points
Quarterly observationsPercent
Source: Fernald (2012) and authors’ calculations. Note: Growth rates are annualized log changes; results are for the business sector.
50
55
60
65
–10
–5
0
5
10
15
20
1952 1957 1962 1967 1972 1977 1982 1987 1992 1997 2002 2007
TFP growth
Counterfactual TFP growth (dots)
Labor share (right axis)
Average labor share (right axis)
Figure 13. Measured tFP growth and counterfactual tFP growth under constant labor share, 1947–2012
39. In fact, Basu, Fernald, and Kimball (2006) use a constant labor share for their analysis.

46 Brookings Papers on Economic Activity, Fall 2013
fluctuations in the labor share. As King and Watson (2012) point out in the context of the New-Keynesian Phillips curve, such theories and applica-tions hinge on the assumption that the labor share is mean-stationary. In fact, mean-stationarity is another way of interpreting “approximate con-stancy” of the labor share. King and Watson go on to show that the recent decline in the labor share has rendered it nonstationary. As we have shown, this is true not only for the headline measure but also for its two alterna-tives as well as for the payroll share. This means that uses of the labor share as a cyclical measure will have to address which part of its movements are cyclical and which parts reflect long-run trend movements.
The most common of such uses is that of the labor share as a proxy for wage markups and resource slack. Since the work of Galí and Gertler (1999) and Sbordone (2002), the headline measure of labor share has often been used as a proxy for resource slack and marginal cost fluctuations for the estimation of the New-Keynesian Phillips curve.40 Besides the difficul-ties with the recent time-series properties of the labor share in this context, a more fundamental conceptual issue is at stake. Many parts of compen-sation captured in the numerator of the labor share arguably are not part of firms’ marginal costs, in the sense that they do not represent costs that vary with labor input. For example, it could be argued that the imputed hourly compensation of the self-employed is not part of firms’ direct pay-ments to labor and thus not part of its marginal costs. This suggests that the payroll share may be a better proxy for wage markups than the labor share. However, even some components of payroll compensation, such as stock options, are not linked directly to the quantity of labor used by a firm. Hence, the labor share is not a satisfactory measure of the wedge between the marginal cost and the marginal product of labor. For these reasons, it is important to look beyond the labor share for measures of the wage markup. One potential way forward might be to focus directly on wages instead, rather than on compensation and productivity.
ProXy For ineQUality A second interpretation of the labor share is not as a measure of the division of income between the productive factors of labor and capital, but instead between workers and capitalists. In line with this, the International Labour Organization (2013) interprets the recent decline in the labor share as an indication of inequitable growth.
As has been widely documented (and is reiterated in figure 4), the period during which the U.S. labor share declined was accompanied by a substan-
40. For example, the Federal Reserve’s FRB/US model uses such a specification for its inflation forecast (Brayton and Tinsley 1996, table 6, page 22).

Michael elsby, bart hobijn, and aysegül sahi.n 47
tial increase in income inequality. It is natural, then, to conjecture that the two processes are linked. Two aspects of figure 4 strike a note of caution, however. First, the increase in inequality within labor income dwarfs the movements in the labor share. A second, related feature of figure 4 is that the labor share has in fact been propped up by the labor income of very highly paid individuals in recent decades. That is, to some extent, labor’s share has declined despite the increased earnings of the super-rich. To give an example, executive pay is part of labor compensation and is thus included in the labor share. Thus, the $13 million in com-pensation, $7.2 million in severance payment, shares worth $3.56 million, and a performance bonus of $2.4 million that one CEO received during his 10-month stint at a major tech company in 2010 and 2011 all contributed positively to the labor share during those two years. In this sense, then, the decline in the labor share is an inadequate measure of the increase in income inequality.
By the same token, a further implication of figure 4 is that the measured decline in the labor share would be much larger if not for the gains of the top 1 percent of payroll and self-employment income. By 2010, the labor share of the bottom 99 percent of taxpayers had fallen to approximately 50 percent from just above 60 percent prior to the 1980s. Aggregate mea-sures of the labor share miss this richer detail in the income structure, so that the decline in the aggregate share significantly understates the increase in income inequality in the U.S. over the last 25 years.
V.B. Drivers of Future Movements in the Labor Share
Our analysis of a range of factors behind and explanations for the recent decline in the labor share raises the possibility that the decline in the labor share over the last 25 years has its origins in U.S. producers facing increased import competition. Based on this suggestive evidence, if globalization continues during the next decades, the labor share will continue to decline, especially in sectors that face the largest increases in foreign competition.
However, it is important to realize that sector-specific developments, such as the tech bubble at the end of the 1990s, can have a surprisingly big effect on movements in the labor share. This suggests that, going forward, it is also worthwhile to consider developments that are more sector-specific. In addition to developments in certain industries affecting the aggregate labor share, particular types of legislation are also likely to drive movements in the near future. The Affordable Care Act (ACA) is one example. Since health insurance benefits are part of payroll com-pensation, a change in the prevalence of these benefits that is not offset

48 Brookings Papers on Economic Activity, Fall 2013
by changes in wages and salaries will affect the payroll and labor shares. Moreover, since this legislation makes health insurance more accessible for the self-employed, it will likely result in an increase in the share of the labor force that is self-employed, thus changing the wedge between the labor share and the payroll share. This will affect the measured labor share, though exactly how it does so will depend on how the BLS decides to treat self-employment income in its measurement of the labor share going forward.
ACKNOWLEDGMENTS We would like to thank Mary Amiti, Susanto Basu, Mary Daly, John Fernald, Chad Jones, Andy Levin, Sylvain Leduc, Brent Neiman, Vasia Panousi, Joe Tracy, Robert Zymek, and the editors for their many suggestions and comments. We are grateful to Yifan Cao for his excellent research assistance. The views expressed in this paper solely reflect those of the authors and not necessarily those of the Federal Reserve Bank of New York, the Federal Reserve Bank of San Francisco, or the Federal Reserve System as a whole.

Michael elsby, bart hobijn, and aysegül sahi.n 49
References
Acemoglu, Daron, and David Autor. 2011. “Skills, Tasks and Technologies: Impli-cations for Employment and Earnings.” In Handbook of Labor Economics, vol. 4, edited by Orley Ashenfelter and David E. Card. Amsterdam: Elsevier.
Antras, Pol. 2004. “Is the U.S. Aggregate Production Function Cobb-Douglas? New Estimates of the Elasticity of Substitution.” B.E. Journal of Macroeconomics 4, no. 1.
Autor, David H., David Dorn, and Gordon H. Hanson. 2013. “The China Syn-drome: Local Labor Market Effects of Import Competition in the United States.” American Economic Review 103, no. 6, 2121–68.
Autor, David H., Lawrence F. Katz, and Melissa S. Kearney. 2008. “Trends in U.S. Wage Inequality: Revising the Revisionists.” Review of Economics and Statis-tics 90, no. 2: 300–23.
Azmat, Ghazala, Alan Manning, and John van Reenen. 2012. “Privatization and the Decline of Labour’s Share: International Evidence from Network Industries.” Economica 79, no. 315: 470–92.
Basu, Susanto, John G. Fernald, and Miles S. Kimball. 2006. “Are Technology Improvements Contractionary?” American Economic Review 96: 1418–48.
Bentolila, Samuel, and Gilles Saint-Paul. 2003. “Explaining Movements in the Labor Share.” Contributions in Macroeconomics 3, no. 1: 1–33.
Berman, Eli, John Bound, and Zvi Griliches. 1994. “Changes in the Demand for Skilled Labor within U.S. Manufacturing: Evidence from the Annual Survey of Manufacturers.” Quarterly Journal of Economics 109, no. 2: 367–97.
Blanchard, Olivier. 1997. “The Medium Run.” Brookings Papers on Economic Activity, no. 2: 89–158.
Böckerman, Petri, and Mika Maliranta. 2011. “Globalization, Creative Destruc-tion, and Labour Share Change: Evidence on the Determinants and Mechanisms from Longitudinal Plant-Level Data.” Oxford Economic Papers 64: 259–80.
Bosworth, Barry, George L. Perry, and Matthew D. Shapiro, 1994. “Productivity and Real Wages: Is There a Puzzle?” Brookings Papers on Economic Activity 1994, no. 1: 317–44.
Bound, John, and George Johnson. 1992. “Changes in the Structure of Wages in the 1980s: An Evaluation of Alternative Explanations.” American Economic Review 82, no. 3: 371–92.
Brayton, Flint, and Peter Tinsley. 1996. “A Guide to FRB/US.” Finance and Eco-nomics Discussion Series, no. 1996-42. Washington: Federal Reserve Board of Governors.
Chirinko, Robert S. 2008. “The Long and Short of It.” Journal of Macroeconomics 30, no. 2: 671–86.
Dickens, William T., and Lawrence F. Katz. 1987. “Interindustry Wage Differences and Industry Characteristics.” In Unemployment and the Structure of Labor Markets, edited by K. Lang and J. Leonard. New York: Basil Blackwell.

50 Brookings Papers on Economic Activity, Fall 2013
Estrada, Ángel, and Eva Valdeolivas. 2012. “The Fall of the Labour Income Share in Advanced Economies.” Occasional Paper no. 1209. Madrid: Bank of Spain.
Feenstra, Robert C., and Gordon H. Hanson. 1996a. “Globalization, Outsourcing, and Wage Inequality.” American Economic Review 86, no. 2: 240–45.
———. 1996b. “Foreign Investment, Outsourcing and Relative Wages.” In The Political Economy of Trade Policy: Papers in Honor of Jagdish Bhagwati, edited by Robert C. Feenstra, Gene M. Grossman, and Douglas A. Irwin. Cambridge, Mass.: MIT Press.
———. 1999. “The Impact of Outsourcing and High Technology Capital on Wages: Estimates for the United States, 1979–1990.” Quarterly Journal of Eco-nomics 114, no. 3: 907–40.
Fernald, John G. 2012. “A Quarterly, Utilization-Adjusted Series on Total Fac-tor Productivity.” Working Paper no. 2012-19. San Francisco: Federal Reserve Bank of San Francisco.
Galí, Jordi, and Mark Gertler. 1999. “Inflation Dynamics: A Structural Economet-ric Analysis.” Journal of Monetary Economics 44, no. 2: 195–222.
Gallaway, Lowell E. 1964. “The Theory of Relative Shares.” Quarterly Journal of Economics 78, no. 4: 574–91.
Gollin, Douglas. 2002. “Getting Income Shares Right.” Journal of Political Econ-omy 110, no. 2: 458–74.
Gomme, Paul, and Peter Rupert. 2004. “Measuring Labor’s Share of Income.” Policy Discussion Paper no. 7. Cleveland: Federal Reserve Bank of Cleveland.
Grant, Arthur. 1963. “Issues in Distribution Theory: The Measurement of Labor’s Relative Share, 1899–1929.” Review of Economics and Statistics 45, no. 3: 273–79.
Greenwood, Jeremy, Zvi Hercowitz, and Per Krusell. 1997. “Long-Run Impli-cations of Investment-Specific Technological Change.” American Economic Review 87, no. 3: 342–62.
Griliches, Zvi. 1969. “Capital-Skill Complementarity.” Review of Economics and Statistics 51, no. 4: 465–68.
Guscina, Anastasia. 2006. “Effects of Globalization on Labor’s Share in National Income.” IMF Working Paper no. 06/294. Washington: International Monetary Fund.
Harrison, Ann. 2005. “Has Globalization Eroded Labor’s Share? Some Cross-Country Evidence.” Mimeo. University of California–Berkeley.
Hicks, John R. 1932. The Theory of Wages. London: Macmillan.
Himmelberg, Charles P., James M. Mahoney, April Bang, and Brian Chernoff. 2004. “Recent Revisions to Corporate Profits: What We Know and When We Knew It.” FRBNY Current Issues in Economics and Finance 10, no. 3 (March).
Hirsch, Barry T. 2012. “Unions, Dynamism, and Economic Performance.” In Research Handbook on the Economics of Labor and Employment Law, edited by Michael Wachter and Cynthia Estlund. Northhampton, Mass.: Edward Elgar Series of Research Handbooks in Law and Economics.

Michael elsby, bart hobijn, and aysegül sahi.n 51
———, and David A. Macpherson. 2003. “Union Membership and Coverage Database from the Current Population Survey: Note.” Industrial and Labor Relations Review 56, no. 2: 349–54. [Data available at www.unionstats.com, last accessed 09/06/2013].
Hummels, David, Jun Ishii, and Kei-Mu Yi. 2001. “The Nature and Growth of Vertical Specialization in World Trade.” Journal of International Economics 54, no. 1: 75–96.
Hurst, Erik, Geng Li, and Benjamin Pugsley. 2010. “Are Household Surveys Like Tax Forms: Evidence from Income Underreporting of the Self-Employed.” Work-ing Paper no. 16527. Cambridge, Mass.: National Bureau of Economic Research.
International Labour Organization. 2013. Global Wage Report 2012/13: Wages and Equitable Growth. Geneva: International Labour Office.
Jaumotte, Florence, and Irina Tytell. 2007. “How Has the Globalization of Labor Affected the Labor Share in Advanced Countries?” Working Paper no. 07/298. Washington: International Monetary Fund.
Johns, Andrew, and Joel Slemrod. 2010. “The Distribution of Income Tax Non-compliance.” National Tax Journal 63: 397–418.
Jorgenson, Dale W. 1963. “Capital Theory and Investment Behavior.” American Economic Review (Papers and Proceedings) 53, no. 2: 247–59.
Kaldor, Nicholas. 1957. “A Model of Economic Growth.” Economic Journal 67, no. 268: 591–624.
———. 1961. “Capital Accumulation and Economic Growth.” In Theory of Capital, edited by F. A. Lutz and D.C. Hague. New York: St. Martin’s Press.
Karabarbounis, Loukas, and Brent Neiman. 2013. “The Global Decline of the Labor Share.” Quarterly Journal of Economics, October 24 (online).
Katz, Lawrence F., and Kevin M. Murphy. 1992. “Changes in Relative Wages, 1963–1987: Supply and Demand Factors.” Quarterly Journal of Economics 107, no. 1: 35–78.
Keynes, John M. 1939. “Relative Movements of Real Wages and Output.” Eco-nomic Journal 49: 34–51.
King, Robert G., and Mark W. Watson. 2012. “Inflation and Unit Labor Cost.” Journal of Money Credit and Banking 44s (December): 111–49.
Kravis, Irving B. 1959. “Relative Income Shares in Fact and Theory.” American Economic Review 49, no. 5: 917–49.
Krueger, Alan B. 1999. “Measuring Labor’s Share.” American Economic Review Papers and Proceedings 89, no. 2: 45–51.
———, and Lawrence H. Summers. 1988. “Efficiency Wages and the Inter-Indus-try Wage Structure.” Econometrica 56, no. 2: 259–93.
Krusell, Per, Lee E. Ohanian, José-Víctor Ríos Rull, and Giovanni L. Violante. 2000. “Capital-Skill Complementarity and Inequality: A Macroeconomic Analysis.” Econometrica 68, no. 5: 1029–53.
Mehran, Hamid, and Joseph Tracy. 2001. “The Effect of Employee Stock Options on the Evolution of Compensation in the 1990s.” FRBNY Economic Policy Review 7, no. 3: 17–34.

52 Brookings Papers on Economic Activity, Fall 2013
Moylan, Carol E. 2008. “Employee Stock Options and the National Economic Accounts.” Survey of Current Business, February: 7–13.
Piketty, Thomas, and Emmanuel Saez. 2003. “Income Inequality in the United States: 1913–1998.” Quarterly Journal of Economics 118, no. 1: 1–39.
Sbordone, Argia M. 2002. “Prices and Unit Labor Costs: A New Test of Price Stickiness.” Journal of Monetary Economics 49, no. 2: 265–92.
Slemrod, Joel. 2007. “Cheating Ourselves: The Economics of Tax Evasion.” Jour-nal of Economic Perspectives 21, no. 1 (Winter): 25–48.
Solow, Robert M. 1958. “A Skeptical Note on the Constancy of Relative Shares.” American Economic Review 48, no. 4: 618–31.
Yi, Kei-Mu. 2003. “Can Vertical Specialization Explain the Growth of World Trade?” Journal of Political Economy 111, no. 1: 52–102.

53
Comments and Discussion
COMMENT BYSUSANTO BASU This paper by Michael Elsby, Bart Hobijn, and Aysegül Sahin reminds me of the reasons I have always enjoyed the Brookings Papers. First, the paper does a thorough and careful job of measure-ment, and it shows that measurement really matters for understanding the trends in the U.S. labor share. Second, it does a nice job of discussing the relevant theory in the context of stylized facts from the data. Finally, it advances an interesting and reasonable hypothesis to explain the data, and supports that hypothesis with an empirical test. Putting these results together, the paper significantly advances the literature regarding the evo-lution of the U.S. labor share. In my discussion, I point out some unan-swered questions, which either these or other authors may take up as they build on the findings of this paper.
One major open question is whether the evolution of the labor share is driven almost exclusively by the general forces of globalization or techno-logical change, or whether it is driven to a significant extent by country- specific policies. Certainly, political and historical discussions of the trends in the U.S. labor share often point to the alleged bias of political leaders toward capital and away from labor over the period in which the labor share has declined.1 The paper’s finding that the labor share has declined more in industries that are more exposed to trade does not settle the issue. For it is possible that some countries adopt policies that leave workers more exposed to the forces of the marketplace, while others shelter
1. Exhibit A is usually Ronald Reagan’s action to break the strike of the Professional Air Traffic Controllers Organization (PATCO) in 1981 by firing the striking air traffic controllers. See, for example, McCartin (2011).

54 Brookings Papers on Economic Activity, Fall 2013
workers to some extent, for example by erecting trade barriers or subsidizing industries exposed to import competition.
In its recent Global Wage Report, the International Labour Organization (2013) documents that country labor shares have generally trended down over the last decade, but with significant heterogeneity even within country groups (for example, among advanced or middle-income countries). How-ever, simply documenting that heterogeneity exists also is insufficient to demonstrate that country-specific policies have a significant role in driving labor shares, since it might be the case that industry labor shares exhibit similar trends across countries and that country labor shares show different trends simply due to differences in industry composition. Only a cross-country, cross-industry study can decompose changes in labor’s share into country effects (which may be due to policies) versus industry effects (which might be due either to trade or to changes in technology). One can make further progress on the important question of decomposing industry effects between trade and technology by using observed measures of trade openness, such as the authors’ ingenious measure of trade exposure.
One of the paper’s interesting findings that inclines me toward the trade explanation is the finding that labor share declines are heavily concentrated in the goods-producing and resource-extracting industries (table 2, lower panel). Goods, of course, are easily traded, and it is reasonable that trade would affect goods more readily than services, despite the recent discus-sions of service outsourcing through call centers or “back office” support in other countries. Interestingly, one type of service that is readily traded is shipping and air transport, and this industry group also shows a significant decline in labor’s share.
While the trade explanation appears plausible at both a first and a sec-ond look, it is important to know the channels through which trade affects income distribution. The standard neoclassical theory of distribution is frankly unappealing, since a stable income distribution requires knife-edge functional-form assumptions: either production functions must be Cobb-Douglas, or technological progress must be solely labor-augmenting. Nei-ther assumption is appealing, and both are inconsistent with large bodies of empirical evidence. The state of the art in this area, in the work of Charles Jones (2005), pushes the required assumption back one step by showing that if the distribution of new ideas takes the Pareto form, then the long-run aggregate production function will be Cobb-Douglas. But of course this leaves open the question of why the distribution of ideas should take the Pareto form. Bringing in trade considerations obscures but does not change this basic criticism, since trade might lead to greater convergence in labor

comments and discussion 55
shares across countries at a point in time, but the long-run dynamics of the world labor share distribution would still be governed by the basic forces of neoclassical distribution theory.
Non-neoclassical theories of distribution, especially Marxian ones, take the perspective that income distribution, rather than being governed by marginal productivity in competitive markets, is due more to bargaining power and rent sharing. In such frameworks, the long-run labor share is stable if bargaining power is constant. While the forces that make bargain-ing power stable are not clear, the assumption of a stable détente between firms and workers seems more palatable than the knife-edge functional- form assumptions demanded by neoclassical theory. Trade could affect labor share in these frameworks as well by changing “threat points” and thus the division of rents. For example, in a world without trade, workers producing an important input in a supply chain may have more power, because a strike or work slowdown might bring the whole production pro-cess to a halt. With access to trade, the threat might be less if the good can be obtained from other countries, although perhaps with a delay. With lower bargaining power, workers could not claim as large a share of the pie. Furthermore, if trade lowers market power in the product market, there may be fewer pure profits to be split between firms and workers. If workers formerly received a disproportionate share of these rents, their reduction would also reduce labor’s share.
Thus, the view that trade could reduce labor’s share over long stretches of time is consistent with both neoclassical and non-neoclassical theories of distribution. Yet to understand where the process is headed and what (if any) policy response is appropriate, it will be important to understand the mechanisms through which trade, technology, and other forces lead to changes in income distribution. This paper has made an admirable effort to highlight the proximate reasons for the recent trends in labor’s share, but the deeper causes are still mysterious.
ReFeRences FoR the Basu comment
International Labour Organization. 2013. Global Wage Report 2012/13: Wages and Equitable Growth. Geneva: International Labour Office.
Jones, Charles I. 2005. “The Shape of Production Functions and the Direction of Technical Change.” Quarterly Journal of Economics 120, no. 2 (May): 517–49.
McCartin, Joseph A. 2011. Collision Course: Ronald Reagan, the Air Traffic Controllers, and the Strike That Changed America. Oxford: Oxford University Press.

56 Brookings Papers on Economic Activity, Fall 2013
COMMENT BYBRENT NEIMAN Labor’s share of aggregate income has declined over the past few decades in most countries around the world. This trend is seemingly at odds with one of the key stylized facts in all of macroeconom-ics and carries implications for a diverse set of issues including inequality, macroeconomic dynamics, and growth accounting. As I learned from con-versations with several attendees at the Brookings Panel, the future trend of the labor share is even a critical input into forecasting the federal budget.1
This paper by Michael Elsby, Bart Hobijn, and Aysegül Sahin offers a thorough and useful characterization of the labor share decline in the United States. The authors make three key contributions (not listed in the order of their appearance in the paper). First, they navigate the classic measurement challenges associated with adjusting the labor share to include the relevant income earned by proprietors, arguing that the method of adjustment for proprietors’ income used in an important labor share indicator mislead-ingly amplifies the underlying decline. Their preferred adjustment method reveals that the true labor share decline over the period studied is closer to 4 percentage points than to the headline measurement of 6 percentage points.
Second, they consider the implications of a labor share decline of the magnitude observed to date. They study several environments in which the labor share is used as an input to learn about other economic objects or outcomes and ask whether inferences about those outcomes would mean-ingfully change with a 4-percentage-point drop in the labor share. This is a practical way to assess quantitatively whether the decline in the labor share is “big” or not. These two contributions will play useful roles in shaping continuing work on this topic.
Their third contribution is to offer their view of what has and what has not caused the labor share decline. They argue against explanations such as the changing skill composition of the labor force, the reduced influence of unions, and the substitution away from labor in response to lower prices of investment goods. Instead, they conclude that increases in spending on imports played a critical role in generating the labor share decline. I do not find this part of the paper convincing. An explanation relating to international trade strikes me as both appealing and plausible, but I would like to see a framework formally relating trade and the labor share in a
1. Capital is generally taxed at a lower rate than labor. Taking the GDP forecast as unrelated to factor shares, as many budget forecasts do, the share of labor income is therefore critical in the determination of tax revenues.

comments and discussion 57
multi-country context that could be tested using data from exporters and importers. The paper stops short of taking these steps.
measuRement issues As discussed by Alan Krueger (1999) and Douglas Gollin (2002), one key challenge to measuring the labor share, either within a country over time or across countries at a period in time, is to account for proprietors whose income typically combines that which we would asso-ciate with labor and that which we would associate with capital. Perhaps the most common adjustment is to scale employee compensation by the ratio of total hours worked to total hours worked by payroll employees (a ratio that exceeds one due to the self-employed).2 This correction, which implicitly assumes that wages are equal for the self-employed and payroll employees, is the method used by the Bureau of Labor Statistics (BLS) in its headline measure, perhaps the most widely observed indicator of labor share movements.
The paper shows, strikingly, that the amount of labor income implic-itly attributed to proprietors by this method in some years exceeds the sum total of all proprietors’ income (including labor and capital)! While this BLS method may still be the most appropriate in many cases, the authors’ finding is a compelling indictment of the BLS’s headline methodology, at least for those particular years. The authors go on to suggest that related issues result in a 2-percentage-point overstatement in the headline BLS labor share decline.
It is useful to point out an alternative strategy to circumvent these measurement issues, used in my own work with Loukas Karabarbounis (Karabarbounis and Neiman 2014), which is to focus on labor share in the corporate sector. Gross value added in the corporate sector by construc-tion excludes the activity of most proprietors and therefore immediately bypasses many of these issues. Labor share in the corporate sector can be easily calculated each quarter for the United States using the NIPA tables. An additional benefit of this approach is that it typically allows labor share to be calculated using standard national accounting data, which makes clean international comparisons possible.3 The corporate labor share in the United States has declined by about 5 percentage points over the period studied by the authors.
2. Or, if data do not permit this, the equivalent adjustment is often made using the ratio of the number of total workers to the number of wage earners.
3. One disadvantage (or advantage, depending on the purpose) is that this measure will not reflect labor share in the government or non-corporate sectors. These omitted sectors have represented between 40 and 45 percent of GDP, in the United States and globally, respectively, since 1975.

58 Brookings Papers on Economic Activity, Fall 2013
implications oF the laBoR shaRe decline Too often, discussion of the implications of changes in the labor share focus on the direction of the changes and ignore their magnitude. Section V of the paper takes this issue head-on and asks quantitatively to what extent the labor share decline matters for inferences about growth in total factor productivity (TFP) in calculations of the Solow residual. The authors find that if one used a labor share estimate that was 5 percentage points higher than the true share, standard calculations of the Solow residual would only deviate from the true Solow residual by a trivial amount. They convince me that measured Solow residuals are relatively invariant to under- or overestimates of about 5 percentage points in the level of labor shares in growth accounting exercises for the United States.
This is a nice point, but I would caution readers interested in aggre-gate technology growth against ignoring the labor share decline. After all, the interpretation of the Solow residual may depend on the cause of the non-constant labor share. For example, if the labor share decline teaches us that the aggregate production function is not Cobb-Douglas and that technological growth has been factor-biased, or if the labor share decline is driven by an increase in markups, then standard measures of TFP may diverge from true technology, a point emphasized by Susanto Basu and John Fernald (2002).4
What caused the decline in the u.s. laBoR shaRe? I now turn to the authors’ assessment of the driver of the labor share decline. They start by ruling out other stories, including the explanation advanced in Karabarbounis and Neiman (2014) that ties the decline to reduced rela-tive prices of investment goods in an environment where capital and labor have an elasticity of substitution that exceeds unity. Elsby, Hobijn, and Sahin observe that such a story involves significant capital deepening. In their figure 8, they offer evidence that from about 1990 to about 2005, a two-sided moving average of the capital-labor ratio began a steady and nearly monotonic acceleration.
Their interpretation of the timing of this trend is that it offers support for the explanation of Karabarbounis and Neiman (2014) in the period prior to 2000 but argues against it as an explanation for a labor share decline in the more recent decade. They believe this is so because the smoothed growth rate of this series plateaus at near historically high levels from about 1998
4. In fact, Fernald and Neiman (2011) apply this point and attribute much of the earlier controversy over technology measurement in Singapore to a trend in the economic profit and labor shares at the industry level.

comments and discussion 59
to 2003 and then declines at the end of their sample. The labor share trend surely reflects multiple factors, and some additional shocks surely played an import role in determining factor shares in the run-up to and during the Great Recession.
My view is that the effects of adjustment costs, the business cycle, and variable utilization not only make high-frequency measurements of the true capital-labor ratio quite difficult but also make it more difficult to quan-titatively map these measurements to the alternative models the authors discussed. This is especially so given that the underlying series are highly volatile and only the 10-year moving average is plotted. I believe, there-fore, that one should not conclude much from these subtle comparisons of the timing of inflection points in the time series. In fact, comparing the time series of U.S. imports and the labor share would similarly cast doubt on the authors’ explanation that import competition has driven labor share downward.
U.S. imports plunged in 2009, and the timing of this trade collapse coincides with the sharpest downward movement in the U.S. labor share. Similarly, the authors note a “brief surge” in the labor share coinciding with the late 1990s tech bubble. But this latter period corresponds to a rapid rise in imports, which increased as a share of GDP by more than 2 percent-age points from 1998 to 2000, a larger increase in just 2 years than had occurred in the preceding 8 years (from 1990 to 1998).
For these reasons, I prefer the approach the authors turn to in sec-tion IV of using cross-industry variation in longer-term trends with data from detailed U.S. industries. One challenge here, however, is that such an approach relies quite heavily on homogeneity across industries. For exam-ple, the authors show in their figure 10 that there is, if anything, a nega-tive relationship between changes in the payroll share and equipment price across industries in their data. The authors infer from this that declines in the relative price of capital are not driving labor share reductions. But this inference relies on a comparison of trends in the legal and electrical equipment industries, for example, and the dynamics of the labor share in such industries might be impacted by different shocks in addition to the reduced equipment prices they face.5
We do a very similar analysis in Karabarbounis and Neiman (2014) but using data for multiple countries, which allows us to include industry (and
5. It is also worth noting that these comparisons exclude the labor income of proprietors and therefore assume that the unmeasured influence of proprietors’ labor income is ortho-gonal across sectors to the equipment price trend.

60 Brookings Papers on Economic Activity, Fall 2013
country) fixed effects.6 If we limit our regressions to include only U.S. data points, our results are quite similar to those found by the authors. If we include all countries as well as the fixed effects, however, we in fact infer from the same conceptual exercise that declining relative investment prices were indeed a primary driver of the labor share decline.
In addition to this more technical point, my view is that because the labor share decline has been a global phenomenon, an international per-spective is critical to developing an understanding of its causes. And this is particularly the case when considering explanations for the decline that involve international trade.
For example, the simplest story to explain how trade might bring about a labor share decline is that capital-abundant countries might shift produc-tion toward those sectors that use capital more intensively in production. These countries would then export those goods in exchange for imports of the labor-intensive goods that labor-abundant countries would shift their production toward. But this (Heckscher-Ohlin–based) story cannot be reconciled with the data presented in Karabarbounis and Neiman (2014), which show labor shares in labor-abundant countries like China, India, and Mexico declining even more rapidly than in capital-abundant countries like the United States, Canada, and Japan.7
Taking Elsby and coauthors’ empirical results together with those from my own work, I might speculate that sectors with more imports experienced steeper labor share declines precisely because trade was intensive in investment goods. This would mean, therefore, that reduc-tions in trade frictions in recent decades simultaneously increased import spending and decreased the relative price of investment.8
6. Our industry definitions are more aggregated than those of the authors. Unlike the authors, we use the price of investment goods relative to the price of output in each industry and scale the labor share change by the inverse of the capital share, the specification con-sistent with the existence of a constant elasticity of substitution production function in each sector. The authors note that their results are robust to the use of this alternative definition of the capital price.
7. To deal with this, the paper proposes that trade may instead be occurring in tasks that may at the same time be a relatively labor-intensive process in one country and a relatively capital-intensive process in the other. But that story would imply lower initial levels of labor share in the United States, not the higher levels actually observed.
8. Karabarbounis and Neiman (2014) report that there is generally no significant cross-sectional relationship between the change in a country’s imports, exports, or overall trade relative to GDP—both multilaterally and bilaterally with China—and the trend in its labor share. However, a comparable cross-country analysis with industry-level data might have greater power.

comments and discussion 61
The authors are aware of these challenges and admirably sketch some ideas for overcoming them in a richer framework. Hopefully, their results will encourage a literature to develop models that can be confronted with cross-country and cross-industry data, with greater attention to clarifying whether causality runs through the trade channel. This, of course, is what the authors mean when they write “leaving aside the important question of identifying the underlying economic channel for future work.” Testing their hypothesis will require a clear articulation of a mechanism linking trade and the labor share with empirical predictions for both importers and exporters.
In sum, I find this to be a well-written and useful paper on an important topic, which I hope and anticipate will have a significant impact on the literature. Among other things, the paper taught me quite a bit about the proper handling of proprietors’ income in labor share measurement and helped me formalize a sense of why the labor share decline matters in some settings that I had not considered before. Finally, the authors’ hypothesis that increasing imports are driving the U.S. labor share decline is certainly plausible and appealing. The increase in trade is a global shock that started in the early 1980s, and it is potentially consistent with the results offered in Karabarbounis and Neiman (2014) on the relative price of investment. I remain keenly interested in this story, but the evidence presented in this paper has not yet convinced me of the role of trade in the labor share decline.
ReFeRences FoR the neiman comment
Basu, Susanto, and John Fernald. 2002. “Aggregate Productivity and Aggregate Technology.” European Economic Review 46: 963–91.
Fernald, John, and Brent Neiman. 2011. “Growth Accounting with Misallocation: Or, Doing Less with More in Singapore.” American Economic Journal: Macroeconomics 3, no. 2: 29–74.
Gollin, Douglas. 2002. “Getting Income Shares Right.” Journal of Political Economy 110, no. 2: 458–74.
Karabarbounis, Loukas, and Brent Neiman. 2014. “The Global Decline of the Labor Share.” Quarterly Journal of Economics 129, no. 1: 61–103.
Krueger, Alan. 1999. “Measuring Labor’s Share.” American Economic Review 89, no. 2: 45–51.
GENERAL DISCUSSION Alan Krueger spoke up to underline how important the labor share is to budget forecasting, particularly in project-ing tax revenue, because labor income is taxed at a higher rate than capital

62 Brookings Papers on Economic Activity, Fall 2013
income. He urged researchers to think about ways to make the labor share a more useful concept for forecasters of the government budget.
Edward Glaeser expressed surprise that the payroll share in education and health services had increased by 34 percent and thought that was an interesting insight to come out of the paper. He also requested that the authors pay more attention to relative prices and quantities in order to attri-bute the change in the labor share to the increase in the number of workers or to an increase in those workers’ wages.
Valerie Ramey mentioned a Brookings Paper by Olivier Blanchard in which he sought to explain why the capital share had increased in continen-tal Europe but not in the Anglo-Saxon countries.1 Ramey suggested that it might be useful to read the current paper in connection with the Blanchard paper, since the labor share and the capital share are intrinsically linked.
Alan Blinder pointed out something that he was surprised had not been raised either by the authors or by the two commenters, namely that the emergence of India, China, and the former Soviet Union into the global economy starting in the 1980s and 1990s meant that the world labor supply had essentially doubled, while capital during the period had remained con-stant. This shift should have significant implications for the relative returns to labor and capital.
Paul Krugman challenged Blinder’s suggestion, arguing that if global-ization were the cause of the declining U.S. labor share, in the developing countries the labor share should be increasing. Instead, the labor share in those countries has been decreasing. Additionally, capital has been flowing not from north to south but from south to north, and income inequality has been increasing globally, in developing as well as developed countries. It struck him as a serious puzzle that remains to be understood.
Robert Gordon complimented the authors for doing a good job of showing that changes in labor share tell us very little about inequal-ity, since measures of labor share include the incomes of executives, including their stock options. He suggested that the authors update their numbers to reflect the latest measures of inequality by Thomas Piketty and Emmanuel Saez, which show that half the income gains since 1993 went to the top one percent. Additionally, he said that he had decomposed the labor share as reported by the BEA’s National Income and Product Accounts (NIPA), which report on the entire economy and not just on the private nonfarm share as the BLS reports. According to NIPA, there had
1. Olivier Blanchard, “The Medium Run,” Brookings Papers on Economic Activity 1997, no. 2: 89–158.

comments and discussion 63
been a sharp increase in the labor share starting in the 1960s and then a long-run decline, so that the share is now back to where it was in 1960. The BLS shows a much larger decline in the labor share than NIPA shows. Gordon said that about half of this discrepancy between the BLS and NIPA was due to the fact that the NIPA concept of labor’s share applies to the entire economy, including the government, household, and institutional sectors, whereas the BLS concept applies only to the 73 percent of the economy that excludes those sectors.
Wendy Edelberg was interested in the authors’ finding that the decline in total labor share in the United States has not been caused by a reduction in those industries that have a high labor share, though discussions about the impact of imports might lead one to assume this was the case. This led her to wonder whether the causal mechanism for the declining share could have much more to do with a decline in American workers’ bargaining power, that is, that the growing competition with foreign imports has left them with less ability to hold onto good wages.
Bart Hobijn replied that he and his coauthors had looked into inter-national labor share but they had been unable to figure out the differences in data sources. Still, he thought that the international dynamics of the labor share would be a fruitful area for future research. In response to Susanto Basu’s comment, he indicated that the industry effect could be either tech-nology or industry exposure to trade.
Michael Elsby replied by noting that as some industries were pay-ing much higher wages than others, it would be interesting to compare the inter-industry wage differential to the import exposure of those indus-tries. Looking internationally and responding to Brent Neiman’s comment, Elsby suggested that it was conceivable that outsourcing could increase the capital intensity of both the country doing the outsourcing as well as the country receiving the jobs, depending on the initial capital intensity of the host and source countries and the capital intensity of the technology being outsourced.