the recent decline in women’s labor force … recent decline in women’s ... and ryan nunn the...
TRANSCRIPT

i
The Hamilton Project • Brookings
Sandra E. Black, Diane Whitmore Schanzenbach, and Audrey Breitwieser
FRAMING PAPER | OCTOBER 2017
The Recent Decline in Women’s Labor Force Participation
ii
The Hamilton Project • Brookings
The Hamilton Project seeks to advance America’s promise
of opportunity, prosperity, and growth.
We believe that today’s increasingly competitive global economy
demands public policy ideas commensurate with the challenges
of the 21st Century. The Project’s economic strategy reflects a
judgment that long-term prosperity is best achieved by fostering
economic growth and broad participation in that growth, by
enhancing individual economic security, and by embracing a role
for effective government in making needed public investments.
Our strategy calls for combining public investment, a secure social
safety net, and fiscal discipline. In that framework, the Project
puts forward innovative proposals from leading economic thinkers
— based on credible evidence and experience, not ideology or
doctrine — to introduce new and effective policy options into the
national debate.
The Project is named after Alexander Hamilton, the nation’s
first Treasury Secretary, who laid the foundation for the modern
American economy. Hamilton stood for sound fiscal policy,
believed that broad-based opportunity for advancement would
drive American economic growth, and recognized that “prudent
aids and encouragements on the part of government” are
necessary to enhance and guide market forces. The guiding
principles of the Project remain consistent with these views.
This policy proposal is a proposal from the authors. As emphasized
in The Hamilton Project’s original strategy paper, the Project was
designed in part to provide a forum for leading thinkers across
the nation to put forward innovative and potentially important
economic policy ideas that share the Project’s broad goals of
promoting economic growth, broad-based participation in growth,
and economic security. The author(s) are invited to express their
own ideas in policy papers, whether or not the Project’s staff or
advisory council agrees with the specific proposals. This policy
paper is offered in that spirit.
MISSION STATEMENT NOTE

The Recent Decline in Women’s Labor Force Participation
Sandra E. BlackUniversity of Texas at Austin and the Brookings Institution
Diane Whitmore Schanzenbach The Hamilton Project, the Brookings Institution, and Northwestern University
Audrey BreitwieserThe Hamilton Project
OCTOBER 2017
A CHAPTER IN THE RECENTLY RELEASED HAMILTON PROJECT BOOK
The 51%: Driving Growth through Women’s Economic ParticipationThe U.S. economy will not operate at its full potential unless government and employers remove impediments to full participation by women in the labor market. The failure to address structural problems in labor markets—including tax and employment policy—does more than hold back women’s careers and aspirations for a better life. In fact, barriers to participation by women also act as brakes on the national economy, stifling the economy’s ability to fully apply the talents of 51 percent of the population. By acting to remove barriers to women’s participation, we can realize stronger economic growth that will be more broadly shared by the American people.
Driving Growth through Women’s Economic Participation
51THE %
Edited by
DIANE WHITMORE SCHANZENBACH and RYAN NUNN
THE U.S. ECONOMY will not operate at its full potential unless
government and employers remove impediments to full participation
by women in the labor market. The failure to address structural prob-
lems in labor markets—including tax and employment policy—does
more than hold back women’s careers and aspirations for a better
life. In fact, barriers to participation by women also act as brakes on
the national economy, stifling the economy’s ability to fully apply the
talents of 51 percent of the population. By acting to remove barriers
to women’s participation, we can realize stronger economic growth
that will be more broadly shared by the American people.
Bridget Ansel, Washington Center for Equitable GrowthSandra E. Black, University of Texas at Austin and The Brookings InstitutionAudrey Breitwieser, The Hamilton ProjectJason Brown, Office of Microeconomic Analysis, U.S. Department of the TreasuryHeather Boushey, Washington Center for Equitable GrowthElizabeth Cascio, Dartmouth CollegeKaren Dynan, Harvard UniversityHilary Hoynes, University of California, BerkeleySara LaLumia, Williams CollegeBridget Terry Long, Harvard Graduate School of EducationNicole Maestas, Harvard Medical SchoolMegan Mumford, The Hamilton ProjectRyan Nunn, The Hamilton Project and the Brookings InstitutionJesse Rothstein, Institute for Research on Labor and Employment, California Policy Lab, and the University of California, Berkeley Krista Ruffini, University of California, BerkeleyChristopher J. Ruhm, University of VirginiaDiane Whitmore Schanzenbach, The Hamilton Project, the Brookings Institution, and Northwestern University
SCHAN
ZENBACH
/ N
UN
NT
HE
51%
Driving Growth through Wom
en’s Economic Participation
Contributors
6 × 9 SPINE: 0.4688 FLAPS: 0
HamiltonProject_CV_WIP04.indd 1 8/29/17 8:10 PM

1
The Hamilton Project • Brookings
States appears to be an outlier in terms of women’s labor force participation; France, Canada, the United Kingdom, and Japan all continued to see positive growth in prime-age women’s labor force participation post-2000, with levels rising substantially above those in the United States. This divergence suggests a significant role for labor-market institutions.
In a companion Hamilton Project paper by Ryan Nunn and Megan Mumford, the authors focus on trends in the gender pay gap over time, while this paper will examine the trends in women’s labor force participation, highlighting the progress women have made as well as the challenges they face.1
Trends by Age GroupFigure 1 shows the overall pattern in women’s labor force participation over time. Among all women ages 16 and older, participation rates rose steadily from the early 1960s through the late 1990s, peaking at 61 percent in 2000 and declining by 3.5 percentage points since then. Investigating trends separately by age group is important, though, as trends in overall labor force participation can be misleading. For example, younger workers might reduce labor force participation because they are staying in school longer, developing additional skills that will lead to increased wages and other labor-market advantages in the future. Older workers might decide to retire earlier. Neither of these events would necessarily be cause for concern.
Participation among prime-age women (ages 25 to 54) is higher than for women overall, and increased steadily between 1962 and 2000, peaking at 78 percent before starting to retrench around 2000. Younger women (ages 16 to 24) followed a trend broadly similar to prime-age women, with a strong run-up in the 1960s and 1970s, steady participation rates in the 1980s and 1990s, but then an even sharper downturn starting in 2000.
IntroductionOver the past half century, women have made substantial progress in the labor market. One place this is most visible is in the growth of women’s labor force participation: between 1962 and 2000, women’s labor force participation—defined as the percentage of women ages 16 and older either working or actively looking for work—increased dramatically, from 37 percent to 61 percent. This increase in women’s labor force participation was enough to offset the declining labor force participation rate of men, which had been steadily falling for more than 60 years, so that overall labor force participation was actually increasing until 2000.
The economy has benefited greatly from this increase in labor force participation among women. Estimates suggest that the economy is $2.0 trillion, or 13.5 percent, larger than it would have been had women’s participation and hours worked remained at their 1970 levels. Women’s income also accounts for the majority of the increases in family income since 1970 (Council of Economic Advisers [CEA] 2015).
However, beginning in 2000, the positive trends slowed and even reversed: women’s participation fell from 60.7 percent in 2000 to 57.2 percent in 2016. While some aspects of the decline can be easily explained—younger women’s (ages 16 to 24) increasing educational attainment means that they are less attached to the labor market—others are more puzzling. For instance, it is not clear why prime-age women (ages 25 to 54) are working less. Why has the progress stopped, and even reversed, among the women who we expect to be the most attached to the labor market? Research focusing on the 2000–7 period has highlighted the importance of differential trends in employment and wages based on marital status and the presence of children (Moffitt 2012)—raising as many questions as it answers in terms of society’s expectations of the labor-market participation of women. Importantly, the United
AbstractWhile women’s labor force participation has increased substantially in the U.S. over the second half of the 20th century, this growth has stagnated and reversed since 2000, with women’s labor force participation falling by 3.5 percentage points. This pattern persists across women of varying races and ethnicities, educational backgrounds, ages, and marital statuses, and for women with and without children alike. Interestingly, this decline seems to be moving directly against the trends observed in other major OECD economies. In order to facilitate economic growth in the United States, policies should be directed toward enabling and encouraging women to participate in the labor force.

2
The Hamilton Project • Brookings
FIGURE 1.
Women’s Labor Force Participation, by Age Group
Source: Current Population Survey Annual Social and Economic Supplement 1962–2016.
Note: Sample includes women 16 and older.
25–54
16+
16–24
55+
1962 1968 1974 1980 1986 1992 1998 2004 2010 2016
Labo
r for
ce p
artic
ipat
ion
rate
(per
cent
)
20
30
40
50
60
70
80
90
FIGURE 2.
Prime-Age Labor Force Participation, by Gender
Source: Current Population Survey Annual Social and Economic Supplement 1962–2016.
Note: Prime age indicates ages 25 to 54.
1962 1968 1974 1980 1986 1992 1998 2004 2010 2016
Labo
r for
ce p
artic
ipat
ion
rate
(per
cent
)
Women
Men
40
60
80
100
50
70
90
In contrast to the other age groups, women ages 55 and older generally did not increase their participation until much later. Participation was flat from the 1960s until the mid-1990s, when it turned upward. Unlike other age groups, participation
among older women has not declined in recent years, although it is no longer increasing and has been essentially flat over the past decade.

3
The Hamilton Project • Brookings
percentage points, while prime-age men have only experienced an increase of 0.3 percentage points.
What is most striking about the pattern in recent years is how similar the decline among prime-age women is to that among to prime-age men. Prior to 2000, women’s labor force participation was moving in direct contrast to men’s. Since 2000, however, women’s progress on this dimension stopped, and women are now experiencing declines that parallel those of men.
Trends by Educational AttainmentWhen we sort prime-age women by educational attainment, as shown in figure 3, we see that, prior to 2000, women’s labor force participation was increasing for all educational attainment categories. The least-educated women were participating at the lowest levels, and a gap in participation rates grew between women with a high school degree or less and those with some college, an associate’s degree, or a bachelor’s degree. Those with a graduate degree began with the highest labor force participation—72 percent in 1962—while women with a bachelor’s degree had a labor force participation rate of 54 percent. Participation rates were similar for those with some college or an associate’s degree and those with high school or less, at 44 and 42 percent, respectively. By 2000 the divergence was clear, with labor force participation rates of
Comparing Trends in Women’s and Men’s Labor Force ParticipationFigure 2 shows trends in prime-age labor force participation by gender. These are a worker’s peak earning years, when decisions to stay out of the labor market can be particularly costly for one’s career. When we examine prime-age individuals, we see that men’s labor force participation has been declining for decades. By contrast, until recently women’s participation had increased sharply. Between 1962 and 2000 prime-age women’s labor force participation increased from 43 percent to 78 percent—an increase of 35 percentage points, or over 75 percent.
Beginning in 2000, however, we see a stark change in the trajectory of women’s labor force participation, with prime-age women’s labor force participation beginning to decline. It now appears to be declining in parallel with prime-age men’s labor force participation, albeit at a lower level. Between 2000 and 2016 prime-age women’s labor force participation fell by 4.2 percent, from 78 percent to 74 percent. Over the same period, prime-age men’s participation fell by 3.7 percent, from 91 to 88 percent. Interestingly, while men and women have seen similar declines in participation levels since 2000, very recently recently women have seen a larger percentage point increase than men. For example, between July 2015 and July 2017, prime-age women experienced an increase of 1.6
FIGURE 3.
Prime-Age Women’s Labor Force Participation, by Educational Attainment
Source: Current Population Survey Annual Social and Economic Supplement 1962–2016.
Note: Prime age indicates ages 25 to 54. Before 1992 “graduate degree” is defined as six years of college or more; after 1992 it is defined as a master’s, professional, or doctorate degree. Prior to 1992, “bachelor’s degree” is defined as 4 years of college.
40
60
80
100
50
70
90
Labo
r for
ce p
artic
ipat
ion
rate
(per
cent
)
Bachelor’s degree
Graduate degree
Some college orassociate’s degree
High school or less
1962 1968 1974 1980 1986 1992 1998 2004 2010 2016
4
The Hamilton Project • Brookings
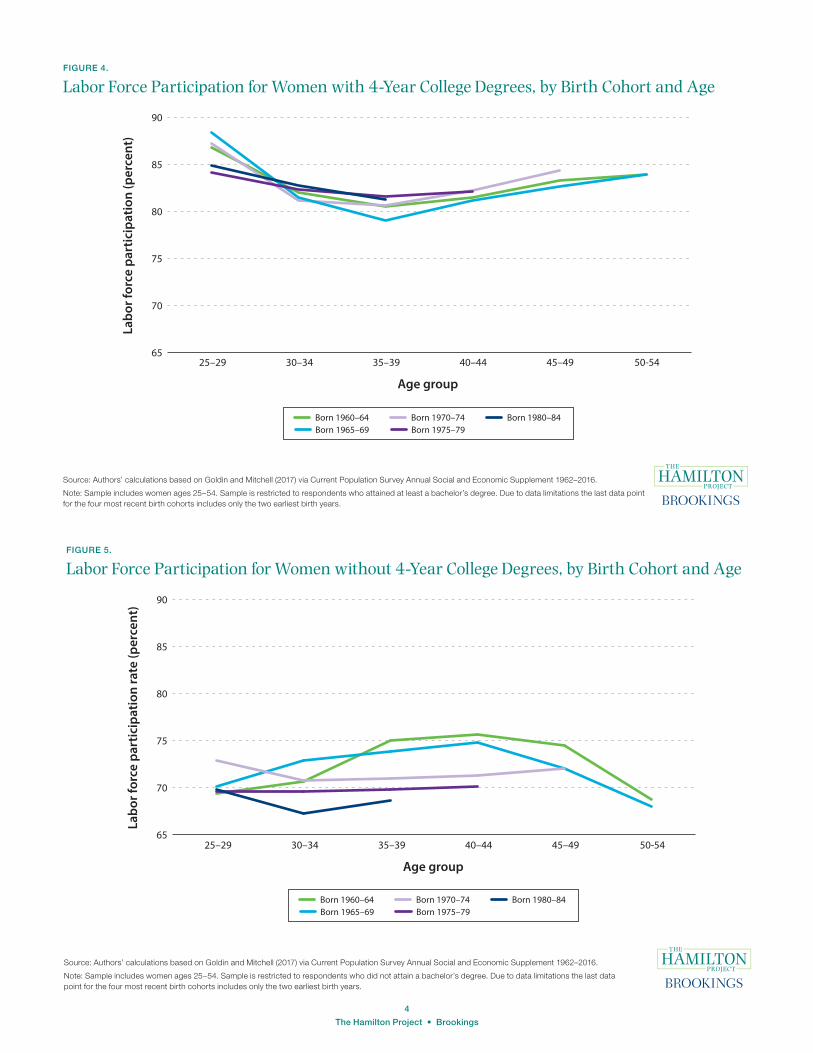
FIGURE 4.
Labor Force Participation for Women with 4-Year College Degrees, by Birth Cohort and Age
Source: Authors’ calculations based on Goldin and Mitchell (2017) via Current Population Survey Annual Social and Economic Supplement 1962–2016.
Note: Sample includes women ages 25–54. Sample is restricted to respondents who attained at least a bachelor’s degree. Due to data limitations the last data point for the four most recent birth cohorts includes only the two earliest birth years.
25–29 30–34 35–39 40–44 45–49 50-54
Age group
Born 1960–64Born 1965–69
Born 1970–74Born 1975–79
Born 1980–84
Labo
r for
ce p
artic
ipat
ion
(per
cent
)
80
75
70
90
65
85
FIGURE 5.
Labor Force Participation for Women without 4-Year College Degrees, by Birth Cohort and Age
Source: Authors’ calculations based on Goldin and Mitchell (2017) via Current Population Survey Annual Social and Economic Supplement 1962–2016.
Note: Sample includes women ages 25–54. Sample is restricted to respondents who did not attain a bachelor’s degree. Due to data limitations the last data point for the four most recent birth cohorts includes only the two earliest birth years.
Born 1960–64Born 1965–69
Born 1970–74Born 1975–79
Born 1980–84
Labo
r for
ce p
artic
ipat
ion
rate
(per
cent
)
80
75
70
90
65
85
25–29 30–34 35–39 40–44 45–49 50-54
Age group

5
The Hamilton Project • Brookings
87, 83, 81, and 71 percent for women with graduate degrees, bachelor’s degrees, some college or an associate’s degree, and a high school diploma or less, respectively.
After 2000, we see that women of all education groups experienced a decline in participation—with the most notable decline for those with less education, including some college or less, and the least dramatic for those with a bachelor’s degree or higher, similar to what we observe among prime-age men (CEA 2016). This recent decline among less-educated women has effectively wiped out their participation gains since the 1980s. Among those with a high school diploma or less, prime-age labor force participation fell from a peak of 71 percent in 2000 to 62 percent in 2016, a rate last seen by this group in 1983. Similarly, those with some college or no more than an associate’s degree saw their participation rates fall from a peak of 81 percent in 2000 to 76 percent in 2016—a level last seen in 1986.
Women with a bachelor’s degree have seen only a modest decline in their participation, from 83 percent at its peak in 2000 to 81 percent in 2016. Similarly, women with graduate degrees have seen a decrease of less than half a percentage point, from 87.5 to 87.1 percent during that time period.
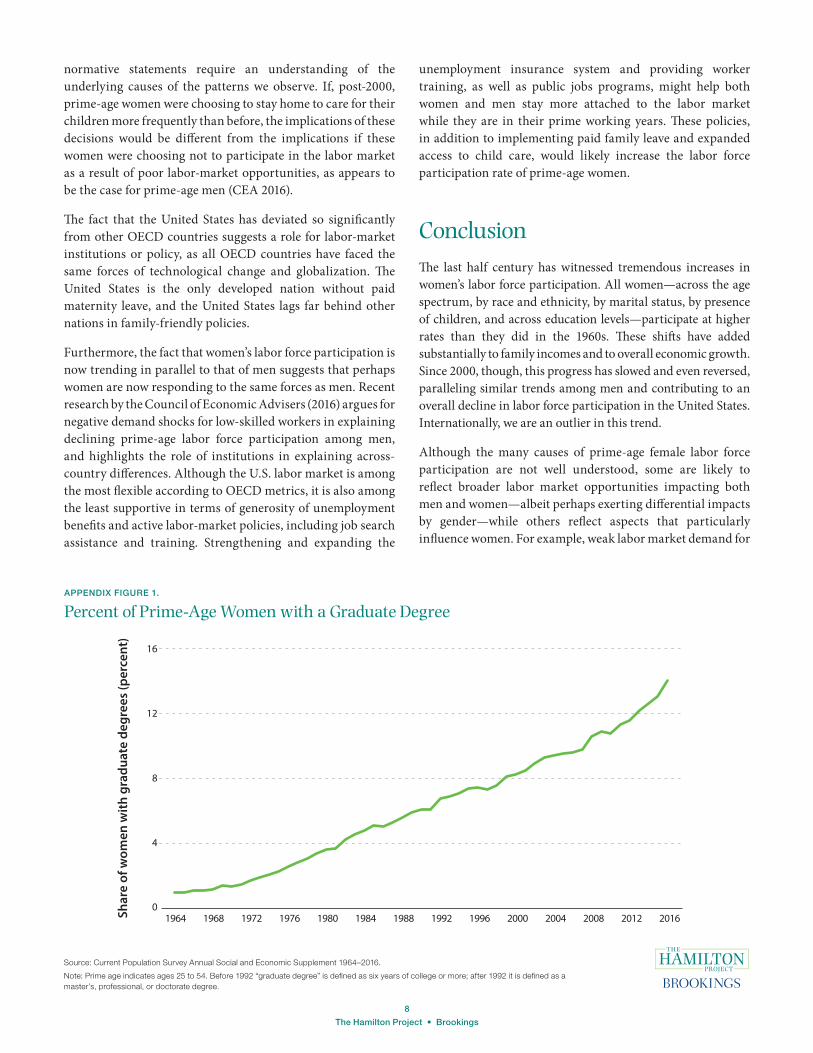
When we examine labor force participation by birth cohort, some striking patterns emerge. Successive cohorts of college graduates are shown in figure 4. Younger cohorts seem to participate in the labor force less between ages 25 and 29, which can be explained partially by increasing graduate education (see appendix figure 1), but then participate at somewhat higher rates between ages 30 to 39. Otherwise,
however, life-cycle patterns look relatively consistent across time, with participation of women at high rates early in their careers, dipping somewhat during mid career—presumably coinciding with child rearing—and then increasing again later in their careers. This U-shaped dip is less pronounced among the most recent birth cohorts.
In contrast, labor force participation rates for women without a college degree have varied substantially across birth cohorts, as shown in figure 5. The overall level is always below that of college graduates, and the life-cycle pattern is different, generally with steady or higher participation rates between ages 30 to 44, in contrast to the dip seen among college graduates at these ages. Beginning with the cohort born in 1965–69, each successive cohort has participated less than the cohort before it at the same age. The reasons for the decline in participation among younger, lower-skill women are not well understood. These trends, however, suggest that the recent decline in participation among lower-skill women likely reflects slow, steady declines over time and not a sudden change around the year 2000, similar to patterns seen for men (CEA 2016).
Trends by Race and EthnicityThe recent trends are similar among black (non-Hispanic), white (non-Hispanic), and Hispanic women, as shown in figure 6. Since the early 1970s, when data on Hispanic women are first available, women across these three groups have seen large increases in participation. At the beginning of the period,
FIGURE 6.
Prime-Age Women’s Labor Force Participation, by Race and Ethnicity
Source: Current Population Survey Annual Social and Economic Supplement 1971–2016.
Note: Prime age indicates ages 25 to 54. Race/ethnicity categories are mutually exclusive. Variable indicating Hispanic origin began in 1971.
White
Hispanic
Black
Labo
r for
ce p
artic
ipat
ion
rate
(per
cent
)
40
60
80
30
50
70
90
1971 1976 1981 1986 1991 1996 2001 2006 2011 2016

6
The Hamilton Project • Brookings
black women’s participation was over 10 percentage points higher than white women’s participation, and these rates converged over time. Labor force participation rates across these groups increased until around 1990, when participation for black and Hispanic women dipped and then quickly recovered. Since 2000, black and white women’s participation has followed a nearly identical decline, from about 80 percent each at their peaks in 2000 to about 77 percent in 2016. Hispanic women’s participation has declined in parallel, with rates that are about 10 percentage points lower than the two other groups.
Trends by Marital Status and Presence of ChildrenJuhn and Potter (2006) note that the increase in labor force participation among women beginning in the late 1960s until the end of the century was primarily driven by the increase in participation of married women. In 1969, among women ages 20 to 60, only 44 percent of all married women were participating in the labor market, while almost 75 percent of never married and 68 percent of widowed or divorced women were participating. By 1999 the labor force participation rates of these three categories of women had substantially converged, with married women participating at a rate of 72 percent, and never-married and widowed or divorced women each participating at rates of 79 percent.
Figure 7 displays participation rates for prime-age women by marital status and presence of children under age 18 in the household. Although all groups have experienced similar declines since 2000, the prior trends were somewhat different. While married women with children continue to participate at lower rates than single mothers and women without a child in the home, married women with children experienced the sharpest long-term increase in participation. In the late 1960s married mothers had participation rates about 25 percentage points lower than single mothers, 17 percentage points lower than married women without children, and 43 percentage points lower than single women without children; by 2016, these gaps were each less than 10 percentage points. Single mothers lost ground relative to married women without children from the mid-1980s through the mid-1990s, then experienced a sharp increase in participation. This coincides with an expansion of the Earned Income Tax Credit as well as the implementation of welfare reform in 1996 that introduced time limits and mandated work requirements. These factors, combined with a robust labor market, led to dramatic increases in the labor force participation of single women with children, and by 1999 their participation rate matched that of both single and married women without children.2
Although the paths upward differed by marital status and presence of children, the steady decline since 2000 has been quite similar across all categories of women.3 Note that this basic trend is not sensitive to the age of the youngest child in the family. While participation rates across these groups differ—mothers with a youngest child ages 0 to 5 have lower
FIGURE 7.
Prime-Age Women’s Labor Force Participation, by Marital Status and Presence of Children under Age 18
Source: Current Population Survey Annual Social and Economic Supplement 1968–2016.
Note: Prime age indicates ages 25 to 54. “Married” is defined by women who have a spouse in the household or not in the household. “Single” is defined as all other women, including divorced and widowed women. “With children” is defined as having at least one child in the household under the age of 18. “No children” is defined as having no children in the household under the age of 18.
Single with childrenSingle, no children
Married, no childrenMarried with children
1968 1972 1976 1980 1984 1988 1992 1996 2000 2004 2008 2012 201620
40
60
80
100
Labo
r for
ce p
artic
ipat
ion
rate
(per
cent
)

7
The Hamilton Project • Brookings
participation rates than those with a youngest child ages 6 to 13, and those with a youngest child ages 14 to 17 have the highest rates, the changes and time patterns are similar between married and single mothers for each child age group, suggesting a common force is at work. However, the relatively low participation rates of mothers of young children could potentially be increased with improvements to child care and employment policy.
Comparing Women’s Labor Force Participation in Select OECD CountriesWhile historically the United States has been an international leader with one of the highest rates of women’s labor force participation, it is no longer so, and currently the U.S. participation rate is near the OECD average. The reversal in the long-term upward trend in women’s labor force participation in the United States does not appear in other countries. Figure 8 shows the patterns of prime-age women’s labor force participation across a number of OECD countries. In 1984, the United States had one of the highest prime-age female labor-market participation rates of any OECD country. The OECD average labor force participation rate among prime-age women has risen steadily between 1984 and 2016, and, as shown in figure 8, France, Canada, the United Kingdom, and
Japan have seen particularly strong gains over this period. In contrast, U.S. women diverged from the international trend in 2000. Strikingly, out of all OECD countries, the United States ranks second to last in percentage point growth in women’s labor force participation since 2000. Appendix figure 2 shows that a higher share of women’s employment in the United States is full time, compared with other OECD countries. The share of full-time work among women in the United States has trended up somewhat over time, indicating that the relative decline of U.S. women would be less pronounced if one examined hours worked rather than participation.
As shown in appendix figure 3, the United States is similarly an outlier in prime-age men’s labor force participation. Many countries, and the OECD average, have seen declines in prime-age men’s participation over the past 30 years. Men’s participation in the United States followed a similar downward trend until 2007 but then sharply diverged downward at the onset of the Great Recession.
Potential ExplanationsWhile there has been substantial research examining the underlying causes of the progress of women over this time period, much less attention has focused on the recent decline in women’s labor force participation—with notable exceptions in Juhn and Potter (2006), Aaronson et al. (2015), and Moffitt (2012). When considering issues of labor force participation,
FIGURE 8.
Prime-Age Women’s Labor Force Participation, Select OECD Countries
Source: OECD n.d.
Note: Prime age indicates ages 25 to 54. OECD published data varies slightly from authors’ calculated labor force participation rate from the Current Population Survey Annual Social and Economic Supplement.
FranceCanadaUnited Kingdom
JapanUnited StatesOECD countries
1984 1988 1992 1996 2000 2004 2008 2012 2016
Labo
r for
ce p
artic
ipat
ion
rate
(per
cent
)
60
80
70
90
65
85
75
8
The Hamilton Project • Brookings
normative statements require an understanding of the underlying causes of the patterns we observe. If, post-2000, prime-age women were choosing to stay home to care for their children more frequently than before, the implications of these decisions would be different from the implications if these women were choosing not to participate in the labor market as a result of poor labor-market opportunities, as appears to be the case for prime-age men (CEA 2016).
The fact that the United States has deviated so significantly from other OECD countries suggests a role for labor-market institutions or policy, as all OECD countries have faced the same forces of technological change and globalization. The United States is the only developed nation without paid maternity leave, and the United States lags far behind other nations in family-friendly policies.
Furthermore, the fact that women’s labor force participation is now trending in parallel to that of men suggests that perhaps women are now responding to the same forces as men. Recent research by the Council of Economic Advisers (2016) argues for negative demand shocks for low-skilled workers in explaining declining prime-age labor force participation among men, and highlights the role of institutions in explaining across-country differences. Although the U.S. labor market is among the most flexible according to OECD metrics, it is also among the least supportive in terms of generosity of unemployment benefits and active labor-market policies, including job search assistance and training. Strengthening and expanding the
unemployment insurance system and providing worker training, as well as public jobs programs, might help both women and men stay more attached to the labor market while they are in their prime working years. These policies, in addition to implementing paid family leave and expanded access to child care, would likely increase the labor force participation rate of prime-age women.
ConclusionThe last half century has witnessed tremendous increases in women’s labor force participation. All women—across the age spectrum, by race and ethnicity, by marital status, by presence of children, and across education levels—participate at higher rates than they did in the 1960s. These shifts have added substantially to family incomes and to overall economic growth. Since 2000, though, this progress has slowed and even reversed, paralleling similar trends among men and contributing to an overall decline in labor force participation in the United States. Internationally, we are an outlier in this trend.
Although the many causes of prime-age female labor force participation are not well understood, some are likely to reflect broader labor market opportunities impacting both men and women—albeit perhaps exerting differential impacts by gender—while others reflect aspects that particularly influence women. For example, weak labor market demand for
APPENDIX FIGURE 1.
Percent of Prime-Age Women with a Graduate Degree
Source: Current Population Survey Annual Social and Economic Supplement 1964–2016.
Note: Prime age indicates ages 25 to 54. Before 1992 “graduate degree” is defined as six years of college or more; after 1992 it is defined as a master’s, professional, or doctorate degree.
1964 1968 1972 1976 1980 1984 1988 1992 1996 2000 2004 2008 2012 2016Shar
e of
wom
en w
ith g
radu
ate
degr
ees
(per
cent
)
0
12
8
4
16

9
The Hamilton Project • Brookings
Source: OECD n.d.
Note: Sample includes women 15 and older, and excludes self-employed individuals. The OECD offers a common definition, rather than national definitions, across countries of full-time vs. part-time employment, which we use in this figure.
APPENDIX FIGURE 2.
Full-time Employment as a Percentage of Total Employment among Women, Select OECD Countries
United States
OECD countriesFrance
Canada
United Kingdom
1984 1988 1992 1996 2000 2004 2008 2012 2016
Full-
time
empl
oym
ent a
s sh
are
ofto
tal e
mpl
oym
ent (
perc
ent)
60
80
50
70
90
APPENDIX FIGURE 3.
Prime-Age Men’s Labor Force Participation, Select OECD Countries
Source: OECD n.d.
Note: Prime age indicates ages 25 to 54.
France
Canada
United Kingdom
Japan
United States
OECD countries
1984 1988 1992 1996 2000 2004 2008 2012 2016
Labo
r for
ce p
artic
ipat
ion
rate
(per
cent
)
90
80
100
95
85
lower-skilled workers affects both women and men who are participating in this market, while differences in access to child care or access to paid family leave might disproportionately affect women—and among women, disproportionately those with children of different ages.
To address the troubling decline in women’s labor force participation, then, both gendered and non-gendered responses are likely to be needed. In the policy proposals in this volume, authors propose a variety of policy options to promote women’s labor force participation and overall economic well-being.
10
The Hamilton Project • Brookings
Authors
Sandra E. BlackAudre and Bernard Rapoport Centennial Chair in Economics and Public Affairs and Professor, University of Texas at Austin; Nonresident Senior Fellow, Economic Studies, The Brookings Institution
Sandra E. Black holds the Audre and Bernard Rapoport Centennial Chair in Economics and Public Affairs and is a Professor of Economics at the University of Texas at Austin. She is also a nonresident senior fellow with the Economic Studies program. She served as a Member of Obama’s Council of Economic Advisers from August 2015–January 2017. Black received her B.A. from UC Berkeley and her Ph.D. in Economics from Harvard University. Since that time, she worked as an Economist at the Federal Reserve Bank of New York, and an Assistant, Associate, and ultimately Professor in the Department of Economics at UCLA before arriving at the University of Texas, Austin in 2010. She was the Editor of the Journal of Human Resources and is currently a Research Associate at the National Bureau of Economic Research (NBER), and a Research Affiliate at IZA. Her research focuses on the role of early life experiences on the long-run outcomes of children, as well as issues of gender and discrimination.
Audrey BreitwieserSenior Research Assistant, The Hamilton Project
Audrey Breitwieser is a senior research assistant at The Hamilton Project. She graduated magna cum laude from Claremont McKenna College in 2016 with a bachelor’s degree in economics. During her time as a research assistant she has coauthored papers on topics including higher education, criminal justice reform, climate change, and labor market outcomes.
Diane Whitmore SchanzenbachMargaret Walker Alexander Professor and Director, The Institute for Policy Research, Northwestern University; Director Emeritus, The Hamilton Project; Nonresident Fellow, Economic Studies, The Brookings Institution
Diane Whitmore Schanzenbach is the director of the Institute for Policy Research at Northwestern University and the Margaret Walker Alexander Professor at the University. From 2015–2017, she was the director of The Hamilton Project. She is also a research associate at the National Bureau of Economic Research, a research affiliate of the Institute for Research on Poverty, and a nonresident senior fellow in Economic Studies at the Brookings Institution.
Schanzenbach studies issues related to child poverty, including education policy, child health, and food consumption. Much of her research investigates the longer-run impacts of early life experiences, such as the impacts of receiving SNAP benefits during childhood, the impacts of kindergarten classroom quality, and the impacts of early childhood education. She recently served on the Institute of Medicine’s Committee on the Examination of the Adequacy of Food Resources and SNAP Allotments.
AcknowledgmentsThe authors would like to thank Stephanie Aaronson and Neha Dalal for helpful comments, as well as the authors’ conference participants for their insights.

11
The Hamilton Project • Brookings
Endnotes
1. See Juhn and Potter (2006) for a comprehensive discussion of overall trends in labor force participation through 2004, and Aaronson et al. (2014) for a discussion of more-recent developments in overall labor force participation.
2. See Juhn and Potter (2006) for more discussion.3. Moffitt (2012) finds that employment declines are sharper among unmarried
women. The differences between our results and his are largely driven by his inclusion of women ages 16 to 24, who are overwhelmingly single, and our limiting the sample to prime-age women. Some of the difference also stems from the different time period covered, and the difference between employment-to-population ratios and labor force participation rates.
References
Aaronson, Stephanie, Tomaz Cajner, Bruce Fallick, Felix Galbis-Reig, Christopher Smith, and William Wascher. 2014. “Labor Force Participation: Recent Developments and Future Prospects.” Brookings Papers on Economic Activity (Fall): 197–275.
Bureau of Labor Statistics (BLS). 1962–2016. “Current Population Survey Annual Social and Economic Supplement.” Bureau of Labor Statistics, U.S. Department of Labor, Washington, DC.
Council of Economic Advisers (CEA). 2015, February. “Chapter 4: The Economics of Family-Friendly Workplace Policies.” Economic Report of the President, Council of Economic Advisers, Executive Office of the President, Washington, DC.
———. 2016, June. “The Long-Term Decline in Prime-Age Male Labor Force Participation.” Council of Economic Advisers, Executive Office of the President, Washington, DC.
Goldin, Claudia, and Joshua Mitchell. 2017. “The New Life Cycle of Women’s Employment: Disappearing Humps, Sagging Middles, Expanding Tops.” Journal of Economic Perspectives 31 (1, Winter): 161–82.
Juhn, Chinhui, and Simon Potter. 2006. “Changes in Labor Force Participation in the United States.” Journal of Economic Perspectives 20 (3): 27–46.
Moffitt, Robert A. 2012. “The Reversal of the Employment-Population Ratio in the 2000s: Fact and Explanations.” Brookings Papers on Economic Activity (Fall): 201–64.
Organisation for Economic Co-operation and Development (OECD). n.d. “OECD.Stat.” OECD Statistics, Organisation for Economic Co-operation and Development, Paris, France. Accessed July 20, 2017.
12
The Hamilton Project • Brookings
ADVISORY COUNCIL
GEORGE A. AKERLOFUniversity ProfessorGeorgetown University
ROGER C. ALTMANFounder & Senior ChairmanEvercore
KAREN ANDERSONSenior Director of Policy,Communications, and External AffairsBecker Friedman Institute forResearch in EconomicsThe University of Chicago
ALAN S. BLINDERGordon S. Rentschler Memorial Professor of Economics & Public AffairsPrinceton UniversityNonresident Senior FellowThe Brookings Institution
ROBERT CUMBYProfessor of EconomicsGeorgetown University
STEVEN A. DENNINGChairmanGeneral Atlantic
JOHN DEUTCHEmeritus Institute ProfessorMassachusetts Institute of Technology
CHRISTOPHER EDLEY, JR.Co-President and Co-FounderThe Opportunity Institute
BLAIR W. EFFRONCo-FounderCenterview Partners LLC
DOUGLAS W. ELMENDORFDean & Don K. Price Professorof Public PolicyHarvard Kennedy School
JUDY FEDERProfessor & Former DeanMcCourt School of Public PolicyGeorgetown University
ROLAND FRYERHenry Lee Professor of EconomicsHarvard University
JASON FURMANProfessor of PracticeHarvard Kennedy School
MARK T. GALLOGLYCofounder & Managing PrincipalCenterbridge Partners
TED GAYERVice President & DirectorEconomic StudiesThe Brookings Institution
TIMOTHY F. GEITHNERPresidentWarburg Pincus
RICHARD GEPHARDTPresident & Chief Executive OfficerGephardt Group Government Affairs
ROBERT GREENSTEINFounder & PresidentCenter on Budget and Policy Priorities
MICHAEL GREENSTONEThe Milton Friedman Professor in Economics and the CollegeDirector of the Becker Friedman InstituteDirector of the Energy Policy Instituteat ChicagoUniversity of Chicago
GLENN H. HUTCHINSChairmanNorth Island
JAMES A. JOHNSONChairmanJohnson Capital Partners
LAWRENCE F. KATZElisabeth Allison Professor of EconomicsHarvard University
MELISSA S. KEARNEYProfessor of EconomicsUniversity of MarylandNonresident Senior FellowThe Brookings Institution
LILI LYNTONFounding PartnerBoulud Restaurant Group
HOWARD S. MARKSCo-ChairmanOaktree Capital Management, L.P.
MARK MCKINNONFormer Advisor to George W. BushCo-Founder, No Labels
ERIC MINDICHChief Executive Officer & FounderEton Park Capital Management
SUZANNE NORA JOHNSONFormer Vice ChairmanGoldman Sachs Group, Inc.
PETER ORSZAGManaging Director & Vice Chairman ofInvestment BankingLazardNonresident Senior FellowThe Brookings Institution
RICHARD PERRYManaging Partner & Chief Executive OfficerPerry Capital
PENNY PRITZKERChairmanPSP Capital Partners
MEEGHAN PRUNTYManaging DirectorBlue Meridian PartnersEdna McConnell Clark Foundation
ROBERT D. REISCHAUERDistinguished Institute Fellow& President EmeritusUrban Institute
ALICE M. RIVLINSenior Fellow, Economic StudiesCenter for Health PolicyThe Brookings Institution
DAVID M. RUBENSTEINCo-Founder & Co-Chief Executive OfficerThe Carlyle Group
ROBERT E. RUBINFormer U.S. Treasury SecretaryCo-Chair EmeritusCouncil on Foreign Relations
LESLIE B. SAMUELSSenior CounselCleary Gottlieb Steen & Hamilton LLP
SHERYL SANDBERGChief Operating OfficerFacebook
DIANE WHITMORE SCHANZENBACHMargaret Walker Alexander ProfessorDirectorThe Institute for Policy ResearchNorthwestern UniversityNonresident Senior FellowThe Brookings Institution
RALPH L. SCHLOSSTEINPresident & Chief Executive OfficerEvercore
ERIC SCHMIDTExecutive ChairmanAlphabet Inc.
ERIC SCHWARTZChairman and CEO76 West Holdings
THOMAS F. STEYERBusiness Leader and Philanthropist
LAWRENCE H. SUMMERSCharles W. Eliot University ProfessorHarvard University
LAURA D’ANDREA TYSONProfessor of Business Administration andEconomicsDirectorInstitute for Business & Social ImpactBerkeley-Haas School of Business
JAY SHAMBAUGHDirector

13
The Hamilton Project • Brookings
ADVISORY COUNCIL
W W W . H A M I L T O N P R O J E C T . O R G
1775 Massachusetts Ave., NW Washington, DC 20036
(202) 797-6484
Printed on recycled paper.
AbstractWhile women’s labor force participation has increased substantially in the U.S. over the second half of the 20th century, this growth has stagnated and reversed since 2000, with women’s labor force participation falling by 3.5 percentage points. This pattern persists across women of varying races and ethnicities, educational backgrounds, ages, and marital statuses, and for women with and without children alike. Interestingly, this decline seems to be moving directly against the trends observed in other major OECD economies. In order to facilitate economic growth in the United States, policies should be directed toward enabling and encouraging women to participate in the labor force.
Prime-Age Labor Force Participation, by Gender
Source: Current Population Survey Annual Social and Economic Supplement 1962–2016.
Note: Prime age indicates ages 25 to 54.
1962 1968 1974 1980 1986 1992 1998 2004 2010 2016
Labo
r for
ce p
artic
ipat
ion
rate
(per
cent
)
Women
Men
40
60
80
100
50
70
90