the design of national fiscal frameworks and their budgetary impact
TRANSCRIPT

Work ing PaPer Ser ieSno 1588 / SePtember 2013
the DeSign of national fiScal frameWorkSanD their buDgetary imPact
Carolin Nerlich and Wolf Heinrich Reuter
In 2013 all ECB publications
feature a motif taken from
the €5 banknote.
note: This Working Paper should not be reported as representing the views of the European Central Bank (ECB). The views expressed are those of the authors and do not necessarily reflect those of the ECB.

© European Central Bank, 2013
Address Kaiserstrasse 29, 60311 Frankfurt am Main, GermanyPostal address Postfach 16 03 19, 60066 Frankfurt am Main, GermanyTelephone +49 69 1344 0Internet http://www.ecb.europa.euFax +49 69 1344 6000
All rights reserved.
ISSN 1725-2806 (online)EU Catalogue No QB-AR-13-085-EN-N (online)
Any reproduction, publication and reprint in the form of a different publication, whether printed or produced electronically, in whole or in part, is permitted only with the explicit written authorisation of the ECB or the authors.This paper can be downloaded without charge from http://www.ecb.europa.eu or from the Social Science Research Network electronic library at http://ssrn.com/abstract_id=2322659.Information on all of the papers published in the ECB Working Paper Series can be found on the ECB’s website, http://www.ecb.europa.eu/pub/scientific/wps/date/html/index.en.html
AcknowledgementsThe authors would like to thank the Fiscal Policies Divison of the European Central Bank for fruitful discussions, comments and the hospitality during the second author’s stay there. We would also like to thank Adrian Alter, Harald Badinger, Saleem Bahaj, Niccolo Battistini, Jesus Crespo Cuaresma, Mark Hallerberg, George Kopits, Luca Metelli, Pascal Paul, Michele Pier and Galen Sher, as well as participants at the ECB/IMF conference on Reforming EU Fiscal Governance in December 2012 and various other conferences and seminars, and the anonymous referees for helpful comments and suggestions. The views expressed in this paper are exclusively those of the authors and do not necessarily reflect those of the European Central Bank.
Carolin NerlichEuropean Central Bank; e-mail: [email protected]
Wolf Heinrich ReuterVienna University of Economics and Business; e-mail: [email protected]

Abstract
This study analyses the link between fiscal frameworks and their bud-getary impact. We look at different features of national numerical fis-cal rules in combination with fiscal councils and medium-term budgetingframeworks. We construct our own time-varying dataset for national fiscalframeworks for the period 1990-2012 covering all 27 EU Member Statesand estimate a dynamic panel on aggregate and disaggregated fiscal pol-icy variables. We find strong support that numerical fiscal rules help toimprove the primary balance, and that the budgetary impact can be fur-ther strengthened when supported by independent fiscal councils and aneffective medium-term budgeting framework.
JEL-Classification: E61, E62, H60Keywords: Fiscal policy, Fiscal rules, Fiscal framework, Fiscal Council, MediumTerm Budgeting Framework
1

Non-technical summary
As a consequence of the sovereign debt crisis many initiatives were brought for-ward to strengthen the EU’s fiscal governance framework. While most proposalsaddressed fiscal governance at the supranational level, notably in the contextof the revised Stability and Growth Pact, some of the new regulations also aimat improving the design of fiscal frameworks at the national level, namely theFiscal Compact. All these new regulations are intended to soften inherent in-centive and coordination problems which came apparent in the euro area giventhe setting of a common monetary policy and many national fiscal policies andmore generally to be able to better counteract the deficit bias of governments.Well-designed fiscal frameworks should help to lead to more sustainable publicfinances and internalise the costs of fiscal indiscipline.
The paper analyses the link between well-designed fiscal frameworks andtheir budgetary impact. It indirectly tries to provide some insights on howthese recent changes to the EU fiscal governance framework are likely to impactfiscal discipline in the future. We analyse the budgetary impact of different fea-tures of national fiscal frameworks in the EU member states over the past twodecades. Concretely, we focus on three key elements of fiscal frameworks, namelynumerical fiscal rules, fiscal councils and medium-term budgeting frameworks.The study looks at different features of national numerical fiscal rules and anal-yses whether the budgetary impact of fiscal rules can be further strengthenedwhen supported by an independent fiscal council and an effective medium-termbudgeting framework. To better understand the budgetary impact we look atboth, aggregated as well as disaggregated fiscal policy variables.
We contribute to the existing literature by first, constructing our own time-varying dataset of fiscal frameworks covering all 27 EU countries from 1990 to2012, which enables us to run dynamic panel regressions with approximatelytwice as many observations as in comparable studies. Second, we use dummyvariables instead of the composite indices employed in the existing literature,which allows us to quantify the fiscal impact of changes in fiscal frameworks.Third, we assess the budgetary consequences of fiscal frameworks by lookingat disaggregated (expenditure and revenue) data to uncover hidden effects andthe origin of the aggregated findings. Fourth, we complement the analysis byincluding fiscal councils and medium-term budgetary frameworks as explanatoryvariables.
We find that fiscal rules have mostly the intended disciplinary effect on pub-lic expenditures, which thereby helps to improve the primary balance comparedto countries without a fiscal rule. Moreover, the analysis shows that dependingon the specification of the numerical fiscal rules, their impact differs across cer-tain expenditure and revenue components. While balanced budget rules affectalmost every category of fiscal policy, debt rules seem to allow for intertem-poral shifts and thus only have a pronounced effect on specific categories. Wefind that the positive effect on the primary balance can be further strengthenedwhen numerical fiscal rules are enacted in law or constitution and supported byindependent fiscal councils and an effective medium-term budgeting framework.In general our findings suggest that well-designed fiscal frameworks provide adisciplinary device on public spending and support a better fiscal planning overthe medium-term.
2

1 Introduction
As a consequence of the sovereign debt crisis many initiatives were brought for-ward to strengthen the EU fiscal governance framework. While most proposalsaddressed fiscal governance at the supranational level, notably in the contextof the revised Stability and Growth Pact, some of the new regulations also aimat improving the design of fiscal frameworks at the national level, namely theFiscal Compact1. All these new regulations are intended to soften inherent in-centive and coordination problems that became apparent in the euro area giventhe setting of a common monetary policy and many national fiscal policies andmore generally to be able to better counteract the deficit bias of governments2.Well-designed fiscal frameworks should help to lead to more sustainable publicfinances and internalise the costs of fiscal indiscipline.
This paper indirectly tries to provide some insights on how these recentchanges to the EU fiscal governance framework are likely to impact fiscal dis-cipline in the future. We analyse the budgetary impact of different features ofnational fiscal frameworks in the EU member states over the past two decades.Concretely, we focus on three key elements of fiscal frameworks, namely nu-merical fiscal rules (as defined in Kopits and Symanski)3, fiscal councils andmedium-term budgeting frameworks. The study looks at different features ofnational numerical fiscal rules and analyses whether the budgetary impact offiscal rules can be further strengthened when supported by an independent fiscalcouncil and an effective medium-term budgeting framework. To better under-stand the budgetary impact we look at both, aggregated as well as disaggregatedfiscal policy variables.
We constructed our own time-varying dataset for national fiscal frameworks,which is largely based on four different datasets available from the EuropeanCommission (2010c, 2012b), the OECD (2003, 2008), the IMF (2012) and anESCB-internal dataset on national fiscal frameworks (2011, 2012). Our datasetcovers the period 1990-2012 for all 27 EU countries and we estimate a dynamicpanel using Kiviet (1995)’s bias corrected LSDV dynamic panel estimator forunbalanced panels.
The literature on the budgetary impact of numerical fiscal rules has grown inthe last decade as more such rules have been enacted and more data has becomeavailable.4 One of the studies most closely related to our research is the one byDebrun et al. (2008). They use a dynamic panel setting for 25 EU countries
1The Fiscal Compact (as part of the Treaty on Stability, Coordination and Governance inthe Economic and Monetary Union) entered into force on January 1, 2013 and requires all EUcountries (execpt UK and Czech Republic) to implement a balanced budget rule in nationallegislation by end-2013.
2See Ayuso-i Casals et al. (2007) or Debrun et al. (2008) for a review of the literatureabout the deficit bias.
3Kopits & Symanski (1998) define fiscal rules as ”a permanent constraint on fiscal policy,expressed in terms of a summary indicator of fiscal performance”.
4A detailed survey of the literature can be found e.g. in Ayuso-i Casals et al. (2007). Thehistoric development of fiscal frameworks is thoroughly discussed e.g. in European Commission(2006) and Schaechter et al. (2012).
3

from 1990 to 2005 and find that stricter and broader national numerical fiscalrules lead to improved cyclically adjusted primary balances. Ayuso-i Casalset al. (2007) in a similar setting find that an increase in the share of governmentfinances covered by fiscal rules leads to lower deficits. Afonso & Hauptmeier(2009) focus on government decentralisation, while Wierts (2011), Turrini (2008)and Holm-Hadulla et al. (2012) concentrate on expenditure rules. Most of thesestudies find that fiscal rules limit to some extent the deficit and/or expenditurebias. They use EU country data until 2005, rely on the composite fiscal ruleindices published by the European Commission, and look at aggregated fiscalpolicy measures like the primary balance or primary expenditures.
We contribute to the existing literature by first, constructing a larger dy-namic dataset, which includes approximately twice as many observations. Sec-ond, we use dummy variables instead of composite indices, which enables us toquantify the fiscal impact of changes in fiscal frameworks. Third, we assess thebudgetary consequences of fiscal frameworks by also looking at disaggregated(expenditure and revenue) data to uncover hidden effects and the origin of theaggregated findings. Fourth, we complement the analysis by looking at fiscalcouncils and medium term budgeting frameworks in combination with nationalnumerical fiscal rules.
On the latter aspect, Wyplosz (2012) strongly advocates this combination,and emphasises that credible fiscal institutions can help to overcome the timeinconsistency and transparency problem of numerical fiscal rules. Apart fromDebrun et al. (2012) there is to our knowledge no other empirical study usingfiscal councils or medium-term budgeting frameworks as explanatory variable.Nevertheless there are various reviews and case-studies of existing fiscal coun-cils e.g. by Calmfors & Wren-Lewis (2011) or Debrun et al. (2009). Debrun& Kumar (2007) use fiscal councils as instrumental variable for fiscal rules, im-plying that the existence of a fiscal council leads to stricter national numericalfiscal rules. Debrun et al. (2012) find in a panel setting for 7 EU countries from2003-2010 no direct effect of fiscal councils per se on the fiscal outcome and onlya weak correlation between their media impact and the changes in fiscal policy.
Our main findings suggest that the introduction of numerical fiscal ruleslowers public expenditures in countries with fiscal rules compared to their peersas well as revenues, but the latter to a smaller extent, such that indeed the pri-mary balance is improving. This budgetary impact can be further strengthenedwhen numerical fiscal rules are enacted in law or constitution and supported byindependent fiscal councils and an effective medium-term budgeting framework.On a disaggregated level we can also report on the composition of adjustmentand find that numerical fiscal rules have their strongest effects on social benefits,compensation of employees, general public services and defence expenditures.Thereby balanced budget rules have an effect on almost every expenditure cat-egory, while the effect of debt rules is strongly concentrated on a few specificcategories and expenditure rules do not have any significant impact.
The paper is structured as follows: Section 2 briefly defines our elements offiscal frameworks and summarises the different types of national fiscal frame-works prevailing in the EU. Section 3 presents the empirical framework that
4

we use to estimate the budgetary impact of fiscal rules in the EU, both at theaggregated and the disaggregated level. Our main findings are summarised insection 4 and 5. Section 6 concludes with an outlook on possible avenues forfuture research.
2 The dataset on national fiscal frameworks andstylised facts
National fiscal frameworks can have very different features and may changeover time. To assess their effectiveness, we constructed our own time-varyingdataset for national fiscal frameworks. Our dataset includes data on numericalfiscal rules, fiscal councils and medium-term budgetary frameworks. The datasetincludes dummies for certain characteristics for national fiscal frameworks. Itcovers 27 EU countries for the period 1990-2012 (except for medium-term bud-getary framework for which data is only available from 1999 onwards).
2.1 National numerical fiscal rules (NFRs)
Regarding national numerical fiscal rules (NFRs), the dataset is based on fourdifferent datasets available from the European Commission (2010c, 2012b), theOECD (2003, 2008), the IMF (2012) and an ESCB-internal dataset on nationalfiscal frameworks (2011, 2012)5. The dataset includes dummies (R) for certaincharacteristics of fiscal rules, covering the 27 EU countries for the period 1990-2012. The dummy variable is one if the country in a specific year has a nationalfiscal rule in place with certain characteristics. We look at four different char-acteristics of national fiscal rules: the type, the status, the coverage, and theenforcement. Regarding the different types of fiscal rules, we consider balancedbudget (BBR), debt (DR), expenditure (ER) and revenue rules6. Regardingthe status, we differentiate whether a fiscal rule is just stipulated in a politicalor coalitional agreement or laid down in law or constitution (LC). The coverageof a fiscal rule can relate to the central or general government (CGGG), to theregional or local government (RLG) or to the social security. And finally re-garding the enforcement, fiscal rules can be linked to the (automatic) activationof sanctions or correction mechanisms (SCM). A list of the national numericalfiscal rules dummy variables can be found in Appendix A.1.
A few interesting observations can be made when looking at the statistics ofour dataset. First, as shown in Figure 1, the number of countries with any kindof fiscal rule in place increased steadily between 1990 and 2012. By now almost
5Although these databases often cover the same pool of countries and similar time periodsthey show several differences in the existence and characteristics of numerical fiscal rules inthe EU. They were only considered, when the majority of data sources showed similar featuresof NFRs in year t.
6Our data set does not include information about the content of the fiscal rules, e.g. ifvariables are used in cyclically adjusted or un-adjusted terms, the numerical value of theconstraints or exact definitions of the targets.
5

05
1015
20N
o. o
f cou
ntrie
s
1990 1995 2000 2005 2012
BBR
05
1015
20N
o. o
f cou
ntrie
s
1990 1995 2000 2005 2012
DR
05
1015
20N
o. o
f cou
ntrie
s
1990 1995 2000 2005 2012
ER
05
1015
20N
o. o
f cou
ntrie
s
1990 1995 2000 2005 2012
RR
Figure 1: Number of countries for different types of NFRs (per year)
all EU27 countries have some kind of fiscal rule in place, either at the centralgovernment level, the regional level or at the level of social security7. Second,expenditure rules and balanced budget rules are the most common fiscal rulesin place among EU countries. In turn, less than half of the countries have debtrules in place, of which only some relate to the general or central government,while there are generally only very few revenue rules in place. For this reason,our empirical analysis will not focus on revenue rules separately. Third, thestatus of fiscal rules has changed over time, thereby increasing the credibilityof fiscal rules. While at the beginning of the sample period most countriesonly had fiscal rules which were based on political or coalition agreement, thishas shifted to almost 90% of the countries having a numerical fiscal rule beingsettled in law or constitution in 2012. Of those countries having fiscal rulesat the central or general government level, in particular in the non-euro areacountries, the rules are mostly at statutory or constitutional level. Fourth, withrespect to the coverage of the fiscal rules in place, there are as many countrieshaving rules that cover the central or general government as countries with rulesthat cover the local or regional level. However, there are large differences acrosscountries regarding the coverage of different types of rules: while in 2012 almosttwice as many countries have balanced budget rules linked to regional or local
7The number of fiscal rules increased particularly strongly between 1996 and 1999 andbetween 2001 and 2004.
6

governments instead of the central or general government, the contrary is true inthe case for expenditure rules, which are mostly linked to the central or generalgovernment.
2.2 Fiscal councils (FCs)
Our dataset also includes data on fiscal councils.8 We base our dataset onthe information available from the European Commission (2010a), Calmfors& Wren-Lewis (2011) and the ESCB-internal dataset on national fiscal frame-works (2011, 2012). The dataset covers dummies (FC) for the same time andcountry sample as for numerical fiscal rules. It distinguishes between some keycharacteristics of fiscal councils which were generally found to be important9:i) preparation of macroeconomic or fiscal forecasts, ii) issuance of normativestatements, iii) public assessment of government programs, iv) obligation fora government to comply or react to assessments, v) legal status, vi) freedomfrom influence of the finance ministry, and vii) independent resources and nom-ination of staff. We assume that the characteristics of a fiscal council stay thesame over its lifetime, i.e. from the establishment of the fiscal council until itstermination or the end of the sample period, as those are often predefined inthe law establishing the institution.10
We have information on 14 fiscal councils in our sample. The number offiscal councils has increased strongly in recent years (from five in 2007 to 14 by2012). In half of the countries with fiscal councils the governments are obligedto comply with their recommendations or, if this is not the case, they need topublicly explain why they do not comply. Moreover, around half of the fiscalcouncils have independent resources and access to information.11 However forthe empirical analysis we only use a general dummy for fiscal councils and adummy for fiscal councils with independent resources, appropriate access toinformation and independent nomination of staff, as data availability on theother specifications is too limited.
2.3 Medium-term budgetary frameworks (MTBFs)
Effective medium-term budgeting frameworks (MTBFs) should entail the fol-lowing elements12: i) a planning horizon of at least three years; ii) provisions ofmedium-term fiscal developments and a multi-annual character of budget plan-ning; iii) a binding character; and iv) medium-term fiscal plans should be made
8We only focus on fiscal councils as opposed to fiscal agencies (to which parts of fiscalpolicy is delegated) or fiscal monitoring agencies (like courts of auditors).
9See e.g. Debrun & Kumar (2007). These characteristics are partly reflected in EU Councilregulation No. 473/2013 on draft budgetary plans, which entered into force on 30 May 2013.
10We abstract from the case of Hungary as a notable exception.11According to Debrun & Kumar (2007) independent resources and access of information are
the most important characteristics of a fiscal council, i.e. they found a positive relationshipbetween a fiscal council with de jure guarantees of independence and the impact on fiscalpolicy.
12See also the Council Directive 2011/85/EU on medium-term budgetary frameworks.
7

public annually. To our knowledge no time-varying database on medium termbudgeting frameworks is available13. Therefore we construct a proxy variablewhich closely covers the above mentioned four elements.
In the context of the Stability and Growth Pact the EU member countries areobliged to publish ”stability or convergence programmes” (SCP), which includebudgetary forecasts for a three-year horizon, which can be interpreted as theirmedium-term budgetary strategy. Thus points i) and iv) seem to be fulfilled byall EU member states. Now we assume that a country which fulfils points ii)and iii) has a good estimate of future primary expenditures (unless there areunexpected changes in the business cycle). We use this to construct a proxyvariable for MTBFs by calculating the estimation error of primary expendituresas percentage of GDP adjusted by unexpected changes in the business cyclefor every year and country submitting a SCP, i.e. the smaller the estimationerror the more effective is the medium-term budgetary frameowork.14 Our con-structed proxy is broadly in line with the index constructed by the EuropeanCommission (2010b) for the year 2010. If we compare the two measures, we geta reassuringly high negative correlation of -0.6815. And as one would expect thecorrelation gradually declines when comparing the 2010 index of the EuropeanCommission with our measure for the years 2009, 2008 and earlier.
2.4 Effects of national numerical fiscal rules: stylised facts
The impact of numerical fiscal rules can be already observed directly in thedata. Figure 2 shows the average accumulated difference of countries after theintroduction of a numerical fiscal rule to the mean of all countries in the mainfiscal policy aggregates for different types of fiscal rules. At first glance wenotice that expenditures as well as revenues are lower than the mean after theintroduction of any type of numerical fiscal rule. The effect on the primarybalance is positive for balanced budget and debt rules, as revenues are loweredto a smaller extent than expenditures. Contrary after the introduction of anexpenditure rule both expenditures and revenues are lower than the mean tothe same extent which leaves the primary balance similar to the mean. Asthese results can also be driven by several factors outside of this simple analysiswe investigate the relationship between numerical fiscal rules and fiscal policyvariables in an econometric exercise in Section 3.
13The European Commission (2010b) published a non-time varying database coveringmedium-term budgeting frameworks for 2010 and Hallerberg et al. (2009) present data onmulti-annual targets for 1991 and 2000/2004.
14Concretely the estimation error is derived from the difference between the estimatednominal level of primary expenditures and the actual nominal level of primary expenditures aspercentage of GDP for every year and country and adjusted by the difference of the estimatednominal GDP and actual nominal GDP. From that we construct our MTBF dummy variablebeing one if the five-year-average of the error is below 1% of GDP. A more detailed descriptionis given in Appendix A.5.
15For the dummy index we still get a quite high correlation of 0.59.
8

−1.
5−
1−
.50
.5C
umul
ated
diff
eren
ce %
of G
DP
t t+1 t+2 t+3 t+4 t+5
All Rules
−1.
5−
1−
.50
.5C
umul
ated
diff
eren
ce %
of G
DP
t t+1 t+2 t+3 t+4 t+5
Balanced Budget Rules
−1.
5−
1−
.50
.5C
umul
ated
diff
eren
ce %
of G
DP
t t+1 t+2 t+3 t+4 t+5
Debt Rules
−1.
5−
1−
.50
.5C
umul
ated
diff
eren
ce %
of G
DP
t t+1 t+2 t+3 t+4 t+5
Expenditure Rules
Note: Average cumulated difference to year mean of all countries; t is the year when rule is in place for first time, t+1 the following year, etc.;NFR are constitutional or statutory (CL); fiscal variables are cyclically adjusted; countries with rule already in place before 1991 or introducedafter 2006 are ignored.
Primary Expenditures Revenues Primary Balance
Figure 2: Average cumulated difference (% of GDP) to year mean over allcountries of change in cyclically adjusted primary budgetary variables
3 The baseline model
We use a standard empirical setup often used in the literature (see e.g. Debrunet al., 2008; Hallerberg et al., 2009; de Haan et al., 2012), which describes abasic fiscal reaction function. We estimate the following Equation 1 for the 27EU member states for the period 1990 to 2012, in which we regress various fiscalpolicy aggregates on numerical fiscal rules:
F∗i,t = β0 + β1F∗i,t−1 + β2R∗i,t + x′i,tγ + ηi + εi,t (1)
with the dependent variable F being the respective fiscal policy variable, R be-ing the dummy of the numerical fiscal rule and x being a set of control variables.εi,t is the standard time and country specific error.
The fiscal policy variable is in our analysis either the primary balance (FPB),primary expenditures (FPE), revenues (FR) or various disaggregated expendi-ture and revenue components. All fiscal policy variables are cyclically adjusted(as common in this strand of literature to capture discretionary fiscal policy in-stead of the working of automatic stabilizers, see e.g. Debrun et al., 2008 or Gali& Perotti, 2003) in line with the potential GDP method used by the EuropeanCommission (2012a), described in Appendix A.6. The fiscal policy variables are
9

taken from Eurostat and the dummy variable is taken from our dataset16. Aspast fiscal policy outcomes can be expected to determine the current ones weinclude the lagged dependent variable.
In principle also the reverse causality could hold as countries might changetheir numerical fiscal rules in reaction to the government’s fiscal performance.This would imply an endogeneity bias.17. However, as it is a very cumber-some and lengthy process to change fiscal frameworks (in particular if they arestrengthened), we assume this bias to be relatively small. There can be assumedto be a significant time lag between the decision to introduce a fiscal rule andthe time the rule entered into force. Thus to address the potential issue of anendogeneity bias due to reverse causality, we use - similar to other studies, e.g.de Haan et al. (2012) - annual data while the dummy for the fiscal rules relatesto the time the rule already entered into force. Furthermore e.g. Debrun et al.(2008) did not find strongly differing results when doing robustness checks withinstrumental variable estimation techniques.
Similar to other studies our set of control variables x contains three dif-ferent categories of variables: i) economic, ii) political and iii) institutionalvariables18. The economic variables control for changes in fiscal policy that gobeyond cyclical developments. They include the (lagged) debt level, as fiscalpolicy in countries with higher debt levels might be geared towards debt reduc-tion to contain fiscal sustainability risks. They also contain, the (lagged) outputgap, as governments might try to close the output gap via e.g. expansionaryfiscal policy in times of crisis. We also include inflation and the dependencyratio (i.e. the percentage of population aged below 15 or above 64 to totalpopulation) as some parts of public expenditures or revenues of the general gov-ernment might be indexed or relate on the number of people depending on thesocial security system. Furthermore we include population, as there might beeconomies of scale in public services, and the degree of openness, as more opencountries might be confronted with lower tax and expenditure elasticities.
The political variables control for differences in the countrie’s preferencesfor fiscal soundness which could explain national differences in fiscal institu-tions and fiscal outcomes, and thus be another source of biased estimates dueto omitted variables. As argued e.g. by Inman (1996), if political variablesare not included, this would make cross-sectional (or panel) studies with sev-eral countries subject to endogeneity concerns due to omitted variables19. Weaddress this issue similar to Debrun et al. (2008), by including a variety of con-trol variables to approximate political tastes of voters, as well as by includingcountry fixed effects (ηi)
20. Dafflon & Pujol (2001) and Krogstrup & Walti
16A detailed list of variable sources is given in Appendix A.4.17The reverse causality problem has been raised by Poterba (1994) and empirically shown
for several European countries in de Haan et al. (1999). Both studies rely on cross-sectionalmodels.
18All data sources are given in Appendix A.4.19In particular, Besley & Case (2003) argue that differences in fiscal institutions and fiscal
policy outcomes (across US states) are related simply as a result of an underlying correlationbetween voter tastes and fiscal policies.
20Including country fixed effects is also confirmed by the Hausman test on systematic dif-
10

(2008) show that voters’ fiscal preferences are largely time-invariant, thus alsocaptured by country fixed effects, unless there are significant electorate changes.To account for those time variations in the electorates’ or voters’ fiscal prefer-ences we specifically add the following political control variables, which are alsoused in similar studies: i) the ideology of the government (on a left - center -right scale), ii) the ideological distance of the parties in government, iii) the sizeof government (to capture a country’s preference regarding the government’sinvolvement), iv) the fragmentation of the government (as an indication of howfragmented the preferences of the voters are), v) a dummy for election years toaddress a political business cycle and vi) the district magnitude (i.e. the num-ber of representatives elected from one district, as an indicator of how detailedthe voters’ preferences are represented in parliament). Following Hallerberg &Marier (2004) we also add the district magnitude variable linked to a variabledescribing countries’ representation system, i.e. whether a country uses closedor open list representation systems.21
The third part of our control variables describes the institutional setting of acountry. In line with the approach followed by Hallerberg et al. (2009) we includetwo (of the three available) variables which indicate if a country follows thedelegation or the contract approach22 in centralising budgetary decisions. Thedelegation approach favours a strong finance minister making central decisionswhile the contract approach favours strong contracts between the various playersin budgetary decisions. Both variables are also added in interaction with thefragmentation of the government, as more fragmented governments require thecontract approach while single-party or homogenous governments prefer thedelegation approach to increase the effectiveness of fiscal policy(Hallerberg et al.,2009). Furthermore we include a variable reflecting the quality of a country’sinstitutions (apart from fiscal institutions). We also add a dummy indicatingwhether a country is part of the euro area in the respective year to capture towhat degree the country is exposed to the provisions of the Stability and GrowthPact (SGP). In addition, we include a variable which measures the differencebetween the fiscal deficit to GDP ratio five years before joining the euro areaand the 3%-benchmark, to capture the countrys fiscal effort required prior tojoining the euro area23.
Finally, when analysing different specifications of fiscal rules (i.e. regardingthe type, status, coverage and enforcement of a fiscal rule) we control for thecountries, which in the respective year are not in the specific subgroup, but inthe same main group. For example, if we investigate the impact of balancedbudget rules in law or constitution (RBBRLC ), we control for the countries havinga balanced budget rule which are not in law or constitution (RBBR − RBBRLC )
ference in coefficients of random and fixed effects models.21Hallerberg & Marier (2004) show that if countries have open list proportional representa-
tion systems, a high district magnitude increase the deficit bias caused by the common poolproblem, while under closed lists a low district magnitude decreases the bias.
22A third variable available, which is not included here, captures the countries which followneither a clear delegation nor a contract approach, but some mixture of both.
23See also Hallerberg et al. (2009).
11

and the countries having a fiscal rule which is not a balanced budget rule (R−RBBR). We proceed in a similar way for interacted fiscal framework variables24
and fiscal rule variables with more than one specification.As the standard fixed effects estimator might be biased in a dynamic model,
we use Kiviet (1995)’s bias corrected LSDV dynamic panel estimator for unbal-anced panels, as described in Bruno (2005a) with the bias correction initializedby a standard fixed effects estimation25. As shown e.g. in Bruno (2005b) thebias corrected LSDV estimator outperforms the original LSDV and widely usedIV and GMM consistent estimators in relatively small macro panels similar toours. But for robustness check purposes we also estimate our model using fixedeffects, pooled OLS or Arellano-Bond estimators. Similar to Debrun & Kumar(2007), we find very similar or even higher coefficients and significance levels, es-pecially for the coefficient of the fiscal framework variable we are most interestedin26.
4 Baseline model findings
The main results of the baseline estimation of Equation 1 are shown in Table 1.The three columns display the results for different dependent variables, namelythe primary balance, the primary expenditures and revenues (all in cyclical-adjusted terms). We find that the coefficient of the numerical fiscal rule dummyR, which is one if a country has some kind of numerical fiscal rule in place in therespective year, is significant and positive for the primary balance and negativefor primary expenditures and revenues. The coefficient suggests that countrieswith a numerical fiscal rule have a yearly cyclically adjusted primary balancewhich is 0.55 percentage points of GDP higher than that of their peers. Likewise,primary expenditures are 1.27 and revenues are 0.80 percentage points of GDPlower compared with their peers. Thus, if numerical fiscal rules are in place theprimary balance is significantly improved, because expenditures are decreasedto a stronger extent than revenues - a phenomenon we observe throughout thepaper. If we account for the auto-correlation of the dependent variable we findthe long-run impact27 of fiscal rules to be +1.49 pp of GDP for the primarybalance, -7.06 pp of GDP for the primary expenditures and -4.71 pp of GDPfor the revenues.
24If we report for example the coefficient for interacted variables FC ×R we include in thecontrol variables (R−FC ×R) and (FC − FC ×R).
25As standard errors of the bias corrected LSDV estimator can be severely downward biasedwhen not initialized by one of the Arellano-Bond, Blundell-Bond or Anderson-Hsiao estimatorswe check for robustness of our results in this respect. Indeed our standard errors turn outto be lower than when using another estimator, but only very slightly such that none of thesignificance levels would change.
26The respective regression results are presented in Appendix A.7 and the differences inthe coefficients for the numerical fiscal rule index mainly stem from different auto-correlationcoefficient, but thus the long-term effects stay approximately the same.
27We calculate the long-run impact by dividing the short-run coefficient by one minus thecoefficient of the lagged dependent variable.
12

Table 1: Panel data estimation of the effects of NFRs on fiscal performanceDependent Variable: FPB FPE FR
Lagged Dependent Var. 0.63∗∗∗ 0.82∗∗∗ 0.83∗∗∗
(0.04) (0.03) (0.03)R 0.55∗ −1.27∗∗∗ −0.80∗∗
(0.33) (0.47) (0.39)Debt level (-1) 0.02∗∗∗ −0.01 0.01
(0.01) (0.01) (0.01)Output Gap (-1) −0.05∗ 0.07∗∗ 0.02
(0.03) (0.04) (0.03)Inflation rate 0.03 −0.04 −0.02
(0.02) (0.03) (0.03)Dependency Ratio −0.02 −0.13∗∗ −0.19∗∗∗
(0.04) (0.06) (0.05)Population −0.14 0.23 0.20
(0.13) (0.17) (0.14)Openness 0.30 −2.74∗∗ −2.33∗∗∗
(0.77) (1.08) (0.89)Ideology 0.09 −0.05 0.04
(0.06) (0.09) (0.07)Ideology Range 0.01 −0.25 −0.30∗
(0.15) (0.21) (0.16)Government Size 0.06 −0.22 −0.16
(0.14) (0.21) (0.17)Government Fragmentation −2.02 3.68 1.21
(1.86) (2.61) (2.13)Majority Fragmentation 0.37 1.20 1.40
(1.54) (2.16) (1.77)Year of Parliamentary Election −0.33∗∗ −0.09 −0.43∗∗
(0.17) (0.24) (0.19)District Magnitude −0.02 0.08∗∗ 0.06∗∗
(0.02) (0.03) (0.03)District Magnitude x Open/Closed List 0.06 −0.11 −0.06
(0.05) (0.07) (0.06)Delegation −0.94 0.51 −0.77
(0.70) (0.97) (0.80)Delegation x Government Fragmentation 2.25 −2.75 −0.02
(1.49) (2.06) (1.70)Contract −0.32 −0.40 −1.36
(0.90) (1.29) (1.06)Contract x Government Fragmentation 2.40∗∗ −2.82∗ 0.54
(1.17) (1.70) (1.39)Institutional Quality 0.47∗ −1.17∗∗∗ −0.97∗∗∗
(0.26) (0.37) (0.30)SGP −0.63∗∗ 0.48 −0.26
(0.26) (0.38) (0.32)RunUp to EMU 0.30∗∗ 0.04 0.37∗∗∗
(0.12) (0.16) (0.13)
R2 (within) 0.457 0.710 0.734Obs 490 490 490
Notes: Results of estimation of Equation 1 using Kiviets corrected LSDV estimator for unbalanced dynamicpanels as in Bruno (2005a); Constants are included in every regression but not shown. Dependent variables:
FPB - cyclical adjusted primary balance, FPE - cyclical adjusted primary expenditures, FR - cyclical adjustedrevenues; An overview of the fiscal framework dummy variables can be found in Appendix A.1. Bootstrapped
standard errors (using 100 repetitions) are in parentheses. R2 is taken from fixed effects estimation. Signifi-cance at the 10%, 5% and 1% level is indicated by ∗, ∗∗ and ∗∗∗ respectively.
13

Looking at the primary balance, the coefficients and significance of the laggeddependent and the control variables are in line with the results in the existingliterature. In particular, we find high autocorrelation of the dependent variableand a significantly positive, although small reaction to past debt levels. Weobserve a significant negative effect of the electoral business cycle and a positiveeffect in countries with highly fragmented government which use the contractapproach for budgetary decisions. Furthermore we find a negative effect of themembership in the euro area (i.e. the SGP) and a positive effect of deficits above3% of GDP in the run-up to EMU. This suggests that the disciplinary device forcountries that wish to join the euro area is considerably stronger than for thosealready in the euro area. Only weakly significant we also find a positive effectof the institutional quality and a negative effect of the output gap. The R2 iswell within the range of similar estimations in other studies and the F-Test forkeeping the fixed effects is significant.
Turning to the columns on primary expenditure and revenues, we can ob-serve that expenditures and revenues are often influenced at the same magni-tude, which might explain that some effects of fiscal rules could not be identifiedat the budget balance level. Our baseline estimation results on revenues andexpenditures find an even higher auto-correlation of the dependent variables.The positive effect of the lagged debt level on the primary balance can be ex-plained by a negative effect on primary expenditures and a positive effect onrevenues. The output gap has a significant positive impact on primary expen-ditures but not on revenues. A significant effect on primary expenditures andrevenues can be observed for the dependency ratio, openness, district magni-tude and institutional quality. In all those cases the respective control variablessignificantly influences expenditures and revenues in the same direction and ina similar magnitude. Finally, the negative impact of the electoral cycle on theprimary balance suggests to be mainly due to a negative impact on revenues(e.g. caused by tax cuts). Likewise, the better primary balance explained bythe run-up to EMU is due to higher revenues.
5 Impact of different specifications of fiscal frame-works
In the previous section we showed that fiscal rules in general have a significantimpact on fiscal variables such as the primary balance, primary expenditureand revenues. In the following we are interested in assessing and comparing theimpact of different features of fiscal frameworks (in particular related to fiscalrules) on fiscal variables. We first look at the impact of different specificationsof fiscal rules. Then we apply the model to disaggregated components of publicexpenditures and revenues. Finally, we extend the model by also includingfiscal councils and the effectiveness of medium-term budgetary framework intothe analysis.
We first apply the baseline model with different specifications of fiscal rules,
14

Table 2: Impact of fiscal rules on fiscal policy aggregatesFPB FPE FR FPB FPE FR
R 0.55∗ −1.27∗∗∗ −0.80∗∗ RLC 0.63∗ −1.44∗∗∗ −0.87∗∗
(0.33) (0.47) (0.39) (0.36) (0.50) (0.41)RBBR 0.60 −1.45∗∗∗ −0.86∗ RBBR
LC 0.84∗∗ −1.76∗∗∗ −1.05∗∗
(0.40) (0.56) (0.46) (0.41) (0.59) (0.48)RDR 0.71 −1.66∗∗ −1.04∗ RDR
LC 0.79 −1.42∗∗ −0.71(0.47) (0.65) (0.53) (0.50) (0.70) (0.56)
RER 0.46 −1.17∗∗ −0.76∗ RERLC 0.36 −1.31∗∗ −0.92∗∗
(0.37) (0.50) (0.42) (0.39) (0.54) (0.45)
RCGGG 0.56∗ −1.31∗∗∗ −0.83∗∗ RSCM 0.34 −0.92∗ −0.58(0.33) (0.47) (0.39) (0.39) (0.55) (0.46)
RBBRCGGG 1.21∗∗∗ −1.68∗∗ −0.58 RBBR
SCM 0.30 −1.14∗ −0.84(0.42) (0.61) (0.50) (0.45) (0.64) (0.52)
RDRCGGG 0.75 −1.60∗∗ −0.93∗
(0.49) (0.68) (0.56)RER
CGGG 0.46 −1.21∗∗ −0.79∗
(0.37) (0.50) (0.42)Notes: Results using Kiviets corrected LSDV estimator for unbalanced dynamic panels as in Bruno (2005a);
Dependent variables: FPB - cyclical adjusted primary balance, FPE - cyclical adjusted primary expenditures,
FR - cyclical adjusted revenues; An overview of the fiscal framework dummy variables can be found in AppendixA.1; Only coefficients for national numerical fiscal rules indices R are reported out of full estimation resultsof Equation 1 similar to Table 1. Bootstrapped standard errors (using 100 repetitions) are in parentheses.Significance at the 10%, 5% and 1% level is indicated by ∗, ∗∗ and ∗∗∗ respectively.
which reflect the type (balanced budget, debt or expenditure rule), the status(political commitment or enshrined in law/constitution), the coverage (generalgovernment or regional/local government), the existence of enforcement mecha-nism or combinations of all these specifications (see Table 2). Each specificationof a fiscal rule is represented by a dummy variable and we estimate their im-pact on the primary balance, primary expenditures and revenues. We find, asgenerally expected, that for countries with numerical fiscal rules enshrined inlaw or constitution the impact on fiscal variables is larger than when lookingat all fiscal rules. Likewise, for fiscal rules enshrined in law or constitution thecoefficient indicates that primary expenditures are lower by 1.44 pp of GDP andrevenues by 0.87 pp of GDP lower compared to its peers.
When distinguishing between different types of rules (BBR, DR, ER) wefind the strongest effects for balanced budget rules and in particular when theyare enshrined in law or constitution. Some significant effects can also be foundfor the debt rule (on expenditure and revenues), while the results for expenditurerules are weak and mostly not significant. Overall, these result are broadly inline with other findings in the literature. For example Debrun et al. (2008)found that balanced budget and debt rules significantly determine fiscal policy,while the impact of expenditure rules is not significant.
At first sight it is surprising that expenditure rules have only a limitedimpact on the fiscal variables. One explanation for the limited impact on theprimary budget balance could be, however, that expenditure rules only constrain
15
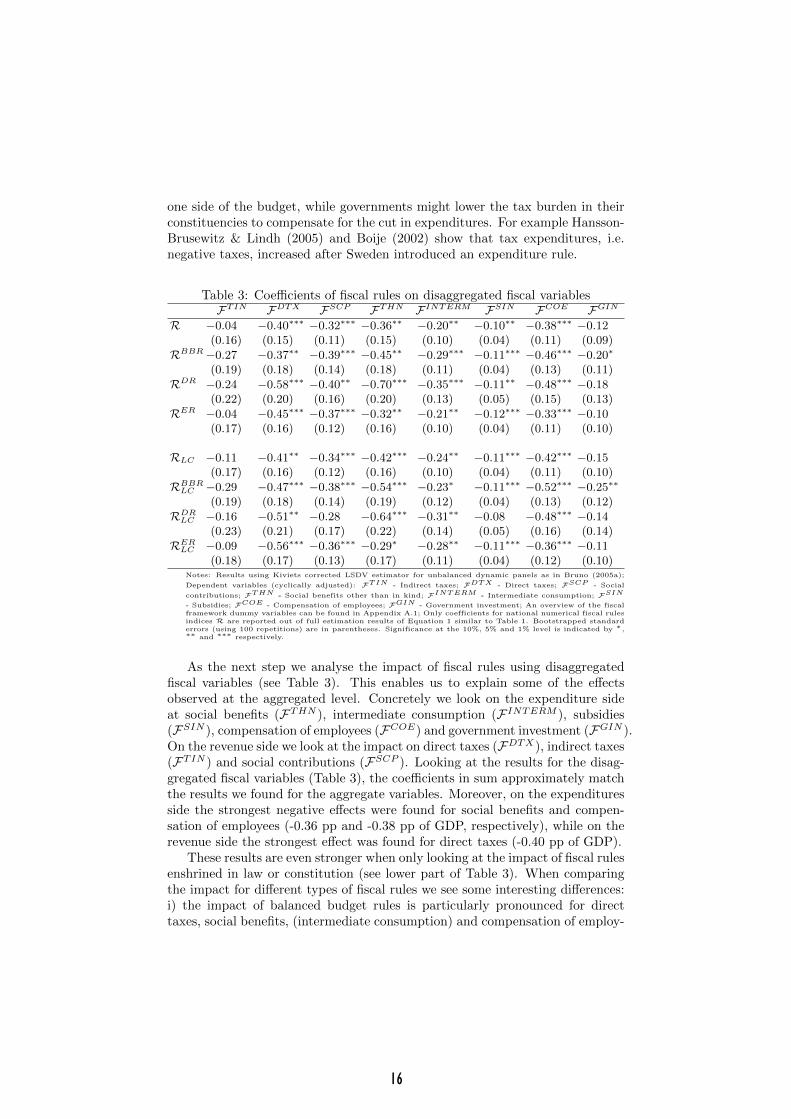
one side of the budget, while governments might lower the tax burden in theirconstituencies to compensate for the cut in expenditures. For example Hansson-Brusewitz & Lindh (2005) and Boije (2002) show that tax expenditures, i.e.negative taxes, increased after Sweden introduced an expenditure rule.
Table 3: Coefficients of fiscal rules on disaggregated fiscal variablesFTIN FDTX FSCP FTHN FINTERM FSIN FCOE FGIN
R −0.04 −0.40∗∗∗ −0.32∗∗∗ −0.36∗∗ −0.20∗∗ −0.10∗∗ −0.38∗∗∗ −0.12(0.16) (0.15) (0.11) (0.15) (0.10) (0.04) (0.11) (0.09)
RBBR−0.27 −0.37∗∗ −0.39∗∗∗ −0.45∗∗ −0.29∗∗∗ −0.11∗∗∗ −0.46∗∗∗ −0.20∗
(0.19) (0.18) (0.14) (0.18) (0.11) (0.04) (0.13) (0.11)RDR −0.24 −0.58∗∗∗ −0.40∗∗ −0.70∗∗∗ −0.35∗∗∗ −0.11∗∗ −0.48∗∗∗ −0.18
(0.22) (0.20) (0.16) (0.20) (0.13) (0.05) (0.15) (0.13)RER −0.04 −0.45∗∗∗ −0.37∗∗∗ −0.32∗∗ −0.21∗∗ −0.12∗∗∗ −0.33∗∗∗ −0.10
(0.17) (0.16) (0.12) (0.16) (0.10) (0.04) (0.11) (0.10)
RLC −0.11 −0.41∗∗ −0.34∗∗∗ −0.42∗∗∗ −0.24∗∗ −0.11∗∗∗ −0.42∗∗∗ −0.15(0.17) (0.16) (0.12) (0.16) (0.10) (0.04) (0.11) (0.10)
RBBRLC −0.29 −0.47∗∗∗ −0.38∗∗∗ −0.54∗∗∗ −0.23∗ −0.11∗∗∗ −0.52∗∗∗ −0.25∗∗
(0.19) (0.18) (0.14) (0.19) (0.12) (0.04) (0.13) (0.12)RDR
LC −0.16 −0.51∗∗ −0.28 −0.64∗∗∗ −0.31∗∗ −0.08 −0.48∗∗∗ −0.14(0.23) (0.21) (0.17) (0.22) (0.14) (0.05) (0.16) (0.14)
RERLC −0.09 −0.56∗∗∗ −0.36∗∗∗ −0.29∗ −0.28∗∗ −0.11∗∗∗ −0.36∗∗∗ −0.11
(0.18) (0.17) (0.13) (0.17) (0.11) (0.04) (0.12) (0.10)Notes: Results using Kiviets corrected LSDV estimator for unbalanced dynamic panels as in Bruno (2005a);
Dependent variables (cyclically adjusted): FTIN - Indirect taxes; FDTX - Direct taxes; FSCP - Social
contributions; FTHN - Social benefits other than in kind; FINTERM - Intermediate consumption; FSIN
- Subsidies; FCOE - Compensation of employees; FGIN - Government investment; An overview of the fiscalframework dummy variables can be found in Appendix A.1; Only coefficients for national numerical fiscal rulesindices R are reported out of full estimation results of Equation 1 similar to Table 1. Bootstrapped standarderrors (using 100 repetitions) are in parentheses. Significance at the 10%, 5% and 1% level is indicated by ∗,∗∗ and ∗∗∗ respectively.
As the next step we analyse the impact of fiscal rules using disaggregatedfiscal variables (see Table 3). This enables us to explain some of the effectsobserved at the aggregated level. Concretely we look on the expenditure sideat social benefits (FTHN ), intermediate consumption (FINTERM ), subsidies(FSIN ), compensation of employees (FCOE) and government investment (FGIN ).On the revenue side we look at the impact on direct taxes (FDTX), indirect taxes(FTIN ) and social contributions (FSCP ). Looking at the results for the disag-gregated fiscal variables (Table 3), the coefficients in sum approximately matchthe results we found for the aggregate variables. Moreover, on the expendituresside the strongest negative effects were found for social benefits and compen-sation of employees (-0.36 pp and -0.38 pp of GDP, respectively), while on therevenue side the strongest effect was found for direct taxes (-0.40 pp of GDP).
These results are even stronger when only looking at the impact of fiscal rulesenshrined in law or constitution (see lower part of Table 3). When comparingthe impact for different types of fiscal rules we see some interesting differences:i) the impact of balanced budget rules is particularly pronounced for directtaxes, social benefits, (intermediate consumption) and compensation of employ-
16

ees. The impact on direct taxes, social benefits and intermediate consumptionis even stronger with a debt rule. In contrast, for compensation of employeesthe impact of balanced budget rules is relatively stronger than that of debtrules; ii) only balanced budget rules significantly lower government investment;iii) expenditure rules have a pronounced effect on revenue variables (in partic-ular direct taxes), while on the expenditure side in particular compensation ofemployees is impacted.
Table 4: Coefficients of fiscal rules on expenditure areasFDEF FEDU FGPS FHEA FHOU FPOS FSOC
R −0.21∗∗∗−0.14∗∗∗−0.25∗∗∗−0.16∗∗∗−0.10∗∗∗−0.08∗∗∗−0.50∗∗∗
(0.04) (0.05) (0.09) (0.06) (0.03) (0.02) (0.16)RBBR−0.23∗∗∗−0.16∗∗∗−0.25∗∗ −0.16∗∗ −0.12∗∗∗−0.08∗∗∗−0.50∗∗∗
(0.04) (0.06) (0.11) (0.07) (0.04) (0.03) (0.18)RDR −0.25∗∗∗−0.06 −0.41∗∗∗−0.17∗ −0.11∗∗ −0.09∗∗∗−0.83∗∗∗
(0.05) (0.07) (0.13) (0.09) (0.05) (0.03) (0.22)RER −0.19∗∗∗−0.08 −0.27∗∗ −0.08 −0.09∗∗ −0.07∗∗ −0.34∗
(0.04) (0.07) (0.11) (0.08) (0.04) (0.03) (0.19)
RLC −0.22∗∗∗−0.16∗∗∗−0.26∗∗∗−0.17∗∗ −0.11∗∗∗−0.08∗∗∗−0.53∗∗∗
(0.04) (0.05) (0.10) (0.07) (0.04) (0.02) (0.16)RBBR
LC −0.25∗∗∗−0.22∗∗∗−0.29∗∗∗−0.19∗∗ −0.20∗∗∗−0.11∗∗∗−0.68∗∗∗
(0.04) (0.07) (0.11) (0.08) (0.04) (0.03) (0.19)RDR
LC −0.29∗∗∗−0.01 −0.48∗∗∗−0.24∗∗ −0.09 −0.10∗∗ −0.80∗∗∗
(0.06) (0.09) (0.17) (0.11) (0.06) (0.04) (0.28)RER
LC −0.20∗∗∗−0.09 −0.45∗∗∗−0.10 −0.08 −0.09∗∗∗−0.40∗
(0.05) (0.08) (0.13) (0.09) (0.05) (0.03) (0.23)Notes: Results using Kiviets corrected LSDV estimator for unbalanced dynamic panels as in Bruno (2005a);
Dependent variables (cyclically adjusted): FDEF - Defence, FEDU - Education, FGPS - General public
services, FHEA - Health, FHOU - Housing and community amenities, FPOS - Public Order and Safety,
FSOC - Social protection; No significant results for economic affairs, environmental protection, recreation,culture and religion (not shown here). An overview of the fiscal framework dummy variables can be found inAppendix A.1; Only coefficients for national numerical fiscal rules indices R are reported out of full estimationresults of Equation 1 similar to Table 1. Bootstrapped standard errors (using 100 repetitions) are in parentheses.Significance at the 10%, 5% and 1% level is indicated by ∗, ∗∗ and ∗∗∗ respectively.
To complement the analysis we also look at the impact of fiscal rules ondifferent areas of expenditures, such as defence (FDEF ), general public services(FGPS), health (FHEA) and social protection (FSOC), see Table 4. Also heredoes the sum of the significant coefficients approximately resemble the coeffi-cient found at the aggregate level. The by far highest effect can be seen forexpenditures on social protection, which is by -0.50 pp of GDP lower in coun-tries with numerical fiscal rules compared to their peers. Also expenditures ondefence and general public services are significantly lower (by -0.21 pp and -0.25pp of GDP, respectively). Balanced budget rules have a significant impact onalmost every category, while debt rules affect only specific categories (especiallysocial benefits and general public services). One possible explanation is the factthat with a balanced budget rule governments have to obey a specific limit everyyear, while other rules also allow for some inter-temporal shifts of expenditures.
Finally, we analyse how the impact of fiscal rules changes when comple-
17

Table 5: Coefficients of fiscal rules combined with fiscal councils and MTBFsFPB FPE FR
FC ×R 1.10∗∗ −1.58∗∗ −0.25(0.56) (0.78) (0.63)
FCINDEP ×R 1.46∗∗ −2.30∗∗∗ −0.42(0.60) (0.83) (0.68)
FCINDEP ×RBBR 1.67∗∗ −2.62∗∗∗ −0.51(0.69) (0.96) (0.78)
FCINDEP ×RLC 1.53∗∗ −2.42∗∗∗ −0.47(0.60) (0.84) (0.68)
MTBF ×FC ×R 2.13∗∗ −1.22 1.51(1.22) (1.56) (1.19)
MTBF ×FCINDEP ×RLC 2.39∗∗ −1.16 1.81(1.36) (1.71) (1.31)
Notes: Results using Kiviets corrected LSDV estimator for unbalanced dynamic panels as in Bruno (2005a);
Dependent variables: FPB - cyclical adjusted primary balance, FPE - cyclical adjusted primary expenditures,
FR - cyclical adjusted revenues; An overview of the fiscal framework dummy variables can be found in AppendixA.1; Only coefficients for national numerical fiscal rules indices R are reported out of full estimation resultsof Equation 1 similar to Table 1. Bootstrapped standard errors (using 100 repetitions) are in parentheses.Significance at the 10%, 5% and 1% level is indicated by ∗, ∗∗ and ∗∗∗ respectively.
mented with fiscal councils and medium-term budgeting frameworks (see Table5). Fiscal councils and an effective medium-term budgeting framework are -together with fiscal rules - widely acknowledged as important elements of agood fiscal framework. Therefore, by including fiscal councils and medium-termbudgeting frameworks in the analysis, a more pronounced effect on the fiscalvariables can be expected. Due to the relatively small number of countries hav-ing a fiscal council in place and the relatively small time span (2000 - 2009)for which we could construct the MTBF proxy variable we can only look atthe aggregated fiscal rule indices. We use the dataset for fiscal councils andmedium-term budgeting frameworks (MTFBs) as described in Section 228. Onfiscal councils, we only look at the summary indicator of fiscal councils and fis-cal councils with independent resources and nomination of staff, due to limiteddata availability.29 The results are shown in Table 5.
Indeed we find that the effects of fiscal rules are stronger when combinedwith a fiscal council, in particular if the fiscal council is considered independentin terms of resources and nomination of staff and has appropriate access toinformation. The effect on the primary balance is twice as strong as in the casewithout a fiscal council and even three times as strong when complementedwith an independent fiscal council and an effective medium term budgetingframework. With a combination of fiscal rules in law or constitution and anindependent fiscal council there is a positive impact on the primary balance of1.53 pp of GDP, which is achieved through a strong reduction in expenditures(by -2.42 pp of GDP). As shown in Figure 3 which compares the coefficients for
28For the estimation method using interaction effects see also Section 3 and Footnote 2429All fiscal councils in our database have their status in law or constitution. Thus we omit
this variable from our analysis.It should be noted, however, that the fiscal council differ interms of mandate, capacity and visibility across countries.
18

the various fiscal frameworks, the main difference between countries with a fiscalcouncil and countries which do not have a fiscal council, is that in the formercase there is no simultaneous significant effect on the revenues. Fiscal councilsare assumed to increase the transparency of fiscal policy making. Therefore, theexistence of an independent fiscal council might limit the ability of governmentsto compensate any expenditure cuts with tax expenditures or cuts in the taxburden. Effective MTBFs, in turn, are likely to strengthen the predictability andaccountability of public finances. As a consequence fiscal council in combinationwith fiscal rules enshrined in law or constitution and effective MTBF can beexpected to strongly contribute to fiscal consolidation in a sustainable manner.
Figure 3: Comparison of estimated coefficients for various fiscal frameworks
−2
−1
01
2D
iffer
ence
in %
of G
DP
/ ye
ar
PB PE R PB PE R PB PE R PB PE R PB PE R
Fiscal Rule + in LC + FC + indep. FC + MTBF
To check the robustness of our results with respect to the time and countryselection we looked at a range of different sub-samples. Two of those are pre-sented in Table 6: a sub-sample without the financial and sovereign debt crisisand a sub-sample looking only at the EU15. Overall, our results are broadlyconfirmed. The only difference is that our baseline results are sometimes lesssignificant or have lower coefficients than the results with different sub-samples.The same holds true for all other robustness checks.30 Thus, the results pre-
30In Appendix A.7 we show the robustness regarding the estimation method and whenusing the dependent variables in differences - as another robustness check - the same fiscalrule indices turn out to be significant as in our baseline results and the signs of the coefficients
19

sented in our baseline specification can be seen as being at the lower end asregards significance and quantitative effects.
Table 6: Coefficients for Subsamples1990-2007 EU15FPB FPE FR FPB FPE FR
R 0.57∗ −1.46∗∗∗ −0.96∗∗ 0.83∗∗ −1.67∗∗∗ −0.91∗∗∗
(0.31) (0.48) (0.39) (0.37) (0.44) (0.34)RLC 0.62∗ −1.55∗∗∗ −1.00∗∗ 0.85∗∗ −1.90∗∗∗ −1.10∗∗∗
(0.33) (0.51) (0.41) (0.40) (0.47) (0.37)RBBR
LC 0.64∗ −1.58∗∗∗ −1.06∗∗ 0.91∗ −2.03∗∗∗ −1.20∗∗∗
(0.37) (0.57) (0.46) (0.44) (0.52) (0.41)RDR
LC 0.62 −2.49∗∗∗ −1.68∗∗ 1.14 −2.67∗∗∗ −1.72∗∗
(0.55) (0.80) (0.67) (0.74) (0.91) (0.70)RER
LC −0.15 −1.21 −1.60∗∗ 0.59 −2.11∗∗∗ −1.67∗∗∗
(0.55) (0.86) (0.68) (0.54) (0.67) (0.51)Notes: Results using Kiviets corrected LSDV estimator for unbalanced dynamic panels as in Bruno (2005a);
Dependent variables: FPB - cyclical adjusted primary balance, FPE - cyclical adjusted primary expenditures,
FR - cyclical adjusted revenues; An overview of the fiscal framework dummy variables can be found in AppendixA.1; Only coefficients for national numerical fiscal rules indices R are reported out of full estimation resultsof Equation 1 similar to Table 1. Bootstrapped standard errors (using 100 repetitions) are in parentheses.Significance at the 10%, 5% and 1% level is indicated by ∗, ∗∗ and ∗∗∗ respectively.
6 Outlook
The study analyses the link between well-designed fiscal frameworks and theirbudgetary impact. Based on a newly constructed time-varying dataset on fis-cal frameworks covering the period 1990 to 2012 for 27 EU countries, we rundynamic panel regressions of various fiscal framework variables on aggregatedand disaggregated fiscal policy variables. We find that fiscal rules have mostlythe intended reducing effect on public expenditures, which thereby helps to im-prove the primary balance. Moreover, the analysis shows that depending on thespecification of the numerical fiscal rules, their impact differs across certain ex-penditure and revenue components. While balanced budget rules affect almostevery category of fiscal policy, debt rules seem to allow for intertemporal shiftsof fiscal policy and thus only have a pronouned effect on specific categories. Wefind that the positive effect on the primary balance can be further strengthenedby supporting the numerical fiscal rules with independent fiscal councils andan effective medium-term budgeting framework. In general our findings sug-gest that well-designed fiscal frameworks provide a disciplinary device on publicspending and support a better fiscal planning over the medium-term.
Against this background, our analysis is reassuring with respect to the FiscalCompact, which requires as of 2014 the implementation of a national balancedbudget rule - preferably at constitutional level - with an automatic correctionmechanism in place. Moreover, in line with our findings it would be also ben-eficial to further advance with on-going discussions to establish independent
show in the same direction.
20

national fiscal councils and to strengthen the effectiveness of medium-term bud-getary frameworks.
Looking ahead, there are also other elements of national fiscal frameworksfor which the budgetary impact would be worthwhile to analyse. This relatesin particular to the role of independent forecasts and the importance of bud-get co-ordination between different governmental layers. Additional areas offuture research could be the analysis of the impact of fiscal frameworks on othereconomic variables like output, unemployment and sovereign bond spreads.
References
Afonso, A., & Hauptmeier, S. 2009. Fiscal behaviour in the European Union -rules, fiscal decentralization and government indebtedness. European CentralBank Working Paper Series, 1054.
Ayuso-i Casals, J., Gonzalez, D., Moulin, L., & Turrini, A. 2007. Beyond theSGP: Features and Effects of EU National-level Fiscal Rules. In: Commis-sion, European (ed), The Role of Fiscal Rules and Institutions in ShapingBudgetary Outcomes. Economic Papers.
Besley, T., & Case, A. 2003. Political Institutions and Policy Choices: Evidencefrom the United States. Journal of Economic Literature, 41(1), 7–73.
Boije, R. 2002. Should Tax Expenditures be Integrated into the Budget Process?Sveriges Riksbank Economic Review, 2.
Bruno, G.S.F. 2005a. Approximating the bias of the LSDV estimator for dy-namic unbalanced panel data models. Economics Letters, 87, 361–366.
Bruno, G.S.F. 2005b. Estimation and inference in dynamic unbalanced paneldata models with a small number of individuals. Universit Bocconi-CESPRIWorking Paper, 165.
Calmfors, L., & Wren-Lewis, S. 2011. What Should Fiscal Councils do? Eco-nomic Policy, 26(68), 649–695.
Dafflon, B., & Pujol, F. 2001. Fiscal preferences and fiscal performance: Swisscantonal evidence. International Public Management Review, 2, 54–76.
de Haan, J., Moessen, W., & Volkerink, B. 1999. Budgetary Procedures -Aspects and Changes: New Evidence for Some European Countries. Pages265–299 of: Poterba, J., & von Hagen, J. (eds), Fiscal Institutions and FiscalPerformance. Chicago: University of Chicago Press.
de Haan, J., Jong-A-Pin, R., & Mierau, J.O. 2012. Do budgetary institutionsmitigate the common pool problem? New empirical evidence for the EU.Public Choice.
21

Debrun, X., & Kumar, M. 2007. Fiscal Rules, Fiscal Councils and All That:Commitment Devices, Signaling Tools or Smokescreens? Pages 479–512 of:d’Italia, Banca (ed), Fiscal Policy: Current Issues and Challenges. Paperspresented at the Banca d’Italia workshop held in Perugia.
Debrun, X., Moulin, L., Turrini, A., i Casals, J. Ayuso, & Kumar, M.S. 2008.Tied to the mast? National fiscal rules in the European Union. EconomicPolicy, 23, 297362.
Debrun, X., Hauner, D., & Kumar, M. 2009. Independent Fiscal Agencies.Journal of Economic Surveys, 23, 44–81.
Debrun, X., Gerard, M., & Harris, J. 2012. Fiscal Policies in Crisis Mode: Hasthe Time for Fiscal Councils Come at Last? paper presented at the OECD4th annual meeting of OECD Parliamentary Budget Officials and independentfiscal institutions (Paris).
Denis, C., McMorrow, K., & Roger, W. 2002. Production function approach tocalculating potential growth and output gaps - estimates for the EU MemberStates and the US. European Economy, Economic Papers, 176.
European Commission. 2006. Public Finances in EMU. European Economy, 3.
European Commission. 2010a. Database on independent fiscal institutions inthe EU Member States.
European Commission. 2010b. Database on medium-term budgetary frameworkin the EU Member States.
European Commission. 2010c. Fiscal rules database.
European Commission. 2012a. Cyclical adjustment of budget balances. Direc-torate General ECFIN, Spring.
European Commission. 2012b. Fiscal frameworks across Member States: Com-mission services country fiches from the 2011 EPC peer review. EuropeanEconomy, Occasional Papers, 91.
Gali, J., & Perotti, R. 2003. Fiscal policy and monetary integration in Europe.Economic Policy, 18(37), 533–72.
Gwartney, J., Hall, J., & Lawson, R. 2011. Economic Freedom Dataset. publishedin Economic Freedom of the World: 2010 Annual Report, Economic FreedomNetwork.
Hallerberg, M., & Marier, P. 2004. Executive Authority, the Personal Vote, andBudget Discipline in Latin American and Caribbean Countries. AmericanJournal of Political Science, 48(3), 571–87.
Hallerberg, M., Strauch, R., & von Hagen, J. 2009. Fiscal Governance in Europe.Cambridge: Cambridge University Press.
22
Hansson-Brusewitz, U., & Lindh, Y. 2005. Expenditure Ceilings and FiscalPolicy the Sweden Experiences. In: d’Italia, Banca (ed), Public Expenditure.Papers presented at the Banca d’Italia workshop held in Perugia.
Holm-Hadulla, F., Hauptmeier, S., & Rother, P. 2012. The impact of expendi-ture rules on budgetary discipline over the cycle. Applied Economics, 44(25),3287–3296.
IMF. 2012. IMF Fiscal Rules Dataset.
Inman, R.P. 1996. Do Balanced Budget Rules Work? U.S. Experience andPossible Lessons for the EMU. NBER Working Paper, 5838.
Kiviet, J.F. 1995. On Bias, Inconsistency and Efficiency of Various Estimatorsin Dynamic Panel Data Models. Journal of Econometrics, 68, 53–78.
Kopits, G., & Symanski, S. 1998. Fiscal Policy Rules. International MonetaryFund, Occasional Paper, 162.
Krogstrup, S., & Walti, S. 2008. Do fiscal rules cause budgetary outcomes?Public Choice, 136, 123–136.
OECD. 2003. International Budget Practices and Procedures Database 2003.
OECD. 2008. International Budget Practices and Procedures Database2007/2008.
Poterba, J. 1994. State responses to fiscal crises: The effects of budgetaryinstitutions and politics. Journal of Political Economy, 102, 799–821.
Schaechter, A., Kinda, T., Budina, N., & Weber, A. 2012. Fiscal Rules inResponse to the Crisis - Toward the ’Next-Generation’ Rules. A New Dataset.IMF Working Paper, 12(187).
Turrini, A. 2008. Fiscal policy and the cycle in the Euro Area: The role ofgovernment revenue and expenditure. European Economy - Economic Papers,323.
Wierts, P. 2011. How do expenditure rules affect fiscal behaviour? DNB Work-ing Paper, 166.
Wyplosz, C. 2012. Fiscal Rules: Theoretical Issues and historical Experiences.National Bureau of Economic Research Working Paper, 17884.
23

A Appendix
A.1 List of national fiscal framework dummy variables
Table 7: Fiscal framework dummy variables
Dummy variable is one (zero otherwise), if the respective country has in therespective year in place at least one national ...
R numerical fiscal rule of any kind
RBBR numerical balanced budget rule
RDR numerical debt rule
RER numerical expenditure rule
RRR numerical revenue rule
RLC numerical fiscal rule enshrined in law or constitution
RCGGG numerical fiscal rule covering the central or general government
RSCM numerical fiscal rule enforced by sanctions or an automatic correction mech-anism
RBBR/DR/ERLC numerical balanced budget / debt / expenditure rule enshrined in law or
constitution
RBBR/DR/ERCGGG numerical balanced budget / debt / expenditure rule covering the central
or general government
RBBR/DR/ERSCM numerical balanced budget / debt / expenditure rule enforced by sanctions
or an automatic correction mechanism
FC fiscal council of any type
FCINDEP fiscal council with independent resources and nomination of staff
24

A.2 Dataset of national numerical fiscal rules
Table 8: National numerical fiscal rulesCtry Numerical Fiscal Rule Ctry Numerical Fiscal RuleAT BBR, GG, LC, NSCM (08-10) IE BBR, RLG, PC, SCM (04-12)
BBR, GG, LC, SCM (11-12) ER, CG, LC, NSCM (00-09)BBR, CG, LC, NSCM (99-04) ER, CG, LC, SCM (10-12)BBR, CG, LC, SCM (05-12) IT BBR, RLG, LC, SCM (01-12)BBR, RLG, LC, SCM (05-12) ER, CG, LC, SCM (01-07)BBR, RLG, LC, NSCM (99-04) ER, RLG, LC, SCM (99-12)ER, GG, LC, NSCM (09-12) LT BBR, RLG, LC, SCM (90-12)
BE BBR, RLG, LC, NSCM (82-12) RR, CG, LC, SCM (08-12)RR, CG, PC, NSCM (95-99) DR, CG, LC, NSCM (97-12)ER, CG, PC, NSCM (93-98) ER, CG, LC, NSCM (08-12)
BG BBR, GG, LC, NSCM (12) LU DR, GG, PC, NSCM (04-12)BBR, GG, PC, NSCM (06-11) ER, CG, PC, NSCM (90-12)DR, GG, LC, SCM (03-12) LV BBR, GG, LC, NSCM (12)ER, GG, LC, NSCM (12) DR, GG, LC, NSCM (12)ER, GG, PC, NSCM (06-11) ER, GG, LC, NSCM (12)
CZ ER, CG, LC, NSCM (05-12) NL RR, GG, PC, SCM (94-12)DE BBR, CG, LC, SCM (11-12) ER, GG, PC, SCM (94-12)
BBR, CG, LC, NSCM (69-10) PL BBR, CG, PC, SCM (06-07)BBR, RLG, LC, SCM (90-12) DR, GG, LC, SCM (97-12)BBR, SS, LC, SCM (09-12) ER, CG, LC, SCM (11-12)ER, CG, PC, NSCM (82-12) PT BBR, GG, LC, NSCM (12)ER, RLG, PC, NSCM (82-12) BBR, CG, LC, NSCM (02-11)
DK BBR, GG, PC, NSCM (92-12) BBR, RLG, LC, NSCM (03-06)RR, GG, PC, NSCM (01-11) BBR, RLG, LC, SCM (07-11)ER, GG, PC, NSCM (94-12) ER, CG, LC, NSCM (12)
EE BBR, GG, PC, NSCM (93-12) RO ER, GG, LC, SCM (10-12)DR, RLG, LC, NSCM (97-12) SE BBR, GG, LC, NSCM (07-12)
ES BBR, GG, LC, SCM (03-05, 10-12) BBR, RLG, LC, NSCM (00-12)BBR, GG, LC, NSCM (06-09) BBR, GG, PC, NSCM (00-06)ER, CG, LC. NSCM (11-12) ER, CG, LC, SCM (10-12)ER, RLG, LC, NSCM (11-12) ER, CG, PC, SCM (97-09)
FI BBR, RLG, LC, NSCM (95-12) ER, SS, LC, SCM (10-12)BBR, CG, PC, NSCM (99-12) ER, SS, PC, SCM (97-09)DR, CG, PC, NSCM (95-07) SI DR, RLG, LC, NSCM (-90-12)ER, CG, PC, NSCM (03-12) DR, GG, PC, NSCM (00-04)
FR BBR, RLG, LC, NSCM (83-12) ER, GG, LC, NSCM (11-12)RR, CG, LC, NSCM (06-12) SK BBR, RLG, LC, SCM (02-08)DR, SS, LC, NSCM (08-12) BBR, RLG, LC, NSCM (09-12)ER, CG, PC, NSCM (98-12) DR, GG, LC, NSCM (12)ER, SS, LC, NSCM (06-12) DR, RLG, LC, SCM (02-12)ER, SS, PC, NSCM (97-05) ER, CG, LC, SCM (02-12)
HU BBR, GG, LC, NSCM (04-09) UK BBR, GG, LC, SCM (97-08)BBR, CG, LC, NSCM (10-11) BBR, GG, LC, NSCM (10-12)BBR, SS, LC, NSCM (10-11) DR, GG, LC, SCM (97-08)ER, CG, LC, NSCM (10-11) DR, GG, LC, NSCM (10-12)ER, SS, LC, NSCM (10-11) CY NoneDR, GG, LC, NSCM (10-12) GR NoneDR, CG, LC, NSCM (09-11) MT NoneDR, SS, LC, NSCM (09-11)
Notes: BBR: Balanced Budget Rule, DR: Debt Rule, ER: Expenditure Rule, RR: Revenue Rule; GG: GeneralGovernment, CG: Central Government, RLG: Regional or Local Government, SS: Social Security; LC: Law orConstitution, PC: Political or Coalitional Agreement; [N]SCM: [no] (possibility of) sanctions and/or automaticcorrection mechanism. Years the rule has been in place are stated in brackets.
25

A.3 Dataset of national fiscal councils
Table 9: Fiscal CouncilsCountry Est. FOREC NORM ASSES OBLIG STAT FREE NOM INDEP
AT 1970 1 1 1 1 1 0 1 1BE 1989 0 1 1 0 1 0 0 0BG NoneCY NoneCZ NoneDE 1963 1 0 0 1 1 1 1 1DK 1962 1 1 0 0 1 1 1 1EE NoneES NoneFI None
FR NoneGR NoneHU 2008-2010 1 1 1 0 1 1 1 1
2012 0 1 1 0 1 0 0 0IE 2011 0 1 1 0 1 0 1 1IT NoneLT NoneLU NoneLV None
MT NoneNL 1945 1 1 1 1 1 1 1 0PL NonePT 2012 0 1 1 1 1 1 1 1RO 2010 0 1 1 1 1 1 1 1SE 2007 0 1 1 0 1 0 1 1SI 2009 0 1 1 0 1 0 1 0
SK 2012 0 1 1 0 1 0 1 1UK 2010 1 1 1 0 1 1 1 1
Notes: Est.: Year of establishment of fiscal council; FOREC: provision of independent macroeconomic and/orbudgetary forecasts; NORM: normative statements; ASSES: public assessments over if development is proceed-ing in accordance with national rules and plans; OBLIG: Government is obliged to comply with, or alternativelyexplain publicly why they are not following the assessments of the fiscal council; STAT: Status, i.e. Law orConstitution; FREE: Freedom from interference, i.e. No politicians in Council, council members not appointedby Government; NOM: nomination procedures, staff is selected by experience and competence; INDEP: inde-pendent resources from MF and appropriate access to information
26

A.4 Data Sources
Table 10: Data SourcesVariable Source
Fiscal Policy Variables AMECO, European Commission (vintage spring 2012)Debt level AMECO, European Commission (vintage spring 2012)Output Gap AMECO, European Commission (vintage spring 2012)Inflation rate AMECO, European Commission (vintage spring 2012)Dependency Ratio Population structure and ageing, EC (spring 2012)Population Population structure and ageing, EC (spring 2012)
Openness(Imports + Exports) / GDPAMECO, European Commission (vintage spring 2012)
Ideology World Bank Political DatabaseIdeology Range World Bank Political DatabaseGovernment Size Gwartney, J., J. Hall, and R. Lawson (2011)Government Fragmentation World Bank Political DatabaseMajority Fragmentation World Bank Political DatabaseParliamentary Election World Bank Political DatabaseDistrict Magnitude World Bank Political DatabaseOpen/Closed List World Bank Political Database & authors inputDelegation Hallerberg et al. (2009), Ylaoutlinen (2004)Contract Hallerberg et al. (2009), Ylaoutlinen (2004)Institutional Quality Gwartney, J., J. Hall, and R. Lawson (2011)SGP Authors inputRunUp to EMU % of GDP government deficit above 3% target in five
years before joining Euro, AMECO, European Commis-sion (vintage spring 2012)
Potential GDP AMECO, European Commission (vintage spring 2012)Nominal GDP AMECO, European Commission (vintage spring 2012)
Most of the variables i.e. all fiscal policy and economic variables are fromthe AMECO database of the EU Commission using the ESA 95 variants whereapplicable. Exceptions are data on the fiscal rules, fiscal councils and mediumterm budgeting framework described in Appendix A.2, A.3 and A.5 respectively,as well as a group of control variables described below.
Data on Ideology, Ideology Range, Government Fragmentation, MajorityFragmentation, District Magnitude, open and closed list election systems andParliamentary Elections are all taken from the World Bank Political Databaseand updated for the year 2011-2013 by using the European Election and Refer-endum Database until 2012 and www.electionguide.org for 2013 election dates.The classification of parties (left right center) was taken from previous years.The district magnitude variable significantly changed only for 6 countries from2000-2010. Five of them changed the variable shortly before or after joiningthe European Union: Poland (2001), Czech Republic (2003), Hungary (2006),Lithuania (2007), Romania (2007). Thus we just prolonged the time series andassumed the same district magnitude for 2011-2012 as in 2010.
The Government Size variable is an indicator of General government con-
27

sumption spending, Transfers and subsidies as a percentage of GDP, Govern-ment enterprises and investment and the top marginal tax rate which is pub-lished by the Economic Freedom Network (Gwartney et al., 2011). The institu-tional quality variable is also taken from the same database and covers Judicialindependence, Protection of property rights, Military interference in rule of lawand the political process, Integrity of the legal system and Legal enforcement ofcontracts.
A.5 Medium Term Budgeting Variable
We obtain the following variables from the ”stability and convergence pro-grammes” (SCP), which are available from 1998 (for the old EU Member States;2004 for the new EU Member States) to 2012: i) expected primary expendituresas share of expected nominal GDP for the following three to five years (varyingover the SCPs); ii) expected nominal GDP (growth) for the next three to fiveyears. We denote FPEi,f,t as the expected primary expenditure for year t as shareof expected nominal GDP as stated in the SCP of year f for country i, i.e.FPEAT,2006,2008 is the expected primary expenditure as share of expected nominalGDP of the year 2008 which is stated in the SCP of Austria in year 2006. Asimilar notation is used for the expected nominal GDP: Yi,f,t. The actual valuesfor primary expenditures and nominal GDP for country i and year t are denotedas FPEi,t and Yi,t respectively. As a first step we calculate the difference betweenthe expected and actual primary expenditures as share of actual GDP:
dFPE
i,f,t =
(FPEi,f,t · Yi,f,t −FPEi,t · Yi,t
)Yi,t
(2)
This way we already adjusted for the denominator effect of an error in theexpected nominal GDP. But as parts of the level of primary expenditures alsodepend on the business cycle (e.g. unemployment benefits), we also adjust forthe error in the forecasts of nominal GDP of the governments by running thefollowing OLS regressions for every country i and every year f :
dFPE
i,f,t = β(Yi,f,t − Yi,t
)+ εi,f (3)
Our measure of the quality of the medium term budgeting framework of a coun-try is now the five-year average of the residual εi,f , i.e.
MTFi,t = 0.2εi,t−2 + 0.2εi,t−1 + 0.2εi,t + 0.2εi,t+1 + 0.2εi,t+2 (4)
The dummy variable, which represents our proxy for the MTBF, is 1 if |MTFi,t| ≤1 and 0 otherwise, i.e. if the absolute five-year average is below 1% of GDP.
A.6 Cyclical Adjustment
For the cyclical adjustment of the various components of the fiscal policy ag-gregates we rely on the same production function method used (see e.g. Denis
28

et al., 2002; European Commission, 2012a) by the EU Commission to cyclicallyadjust the total expenditures, total revenues and overall balance. Together withthe other variables used in this paper the AMECO database also publishes thepotential GDP estimates Y Pot for the EU Member States, which can be usedto calculate the cyclically adjusted fiscal policy variables F ∗CA as follows:
F∗CA = F∗(Y Pot
Y
)εF∗(5)
where F∗ is the not cyclically adjusted fiscal policy variable, Y is the actualoutput and εF∗ is the elasticity of the fiscal policy variable with respect to theoutput gap. This elasticity is estimated for every country separately relying onOLS according to the following equation:
logF∗ = α+ εF∗ log
(Y
Y Pot
)+ u (6)
where α is a constant and u the error term. The cyclically adjusted primarybalance, primary expenditures and revenues aggregates calculated using thismethod have a correlation of 0.999 with their counterparts published by the EUCommission in the AMECO database.
29

A.7 Robustness regarding estimation method
Table 11: Effects of NFRs on primary balance (Dep. Variable: FPB)FE1 Pooled OLS2 LSDVC3 AB4 BB5
Lagged Dependent Var. 0.55∗∗∗ 0.66∗∗∗ 0.63∗∗∗ 0.39∗∗∗ 0.43∗∗∗
(0.06) (0.04) (0.04) (0.07) (0.06)R 0.62∗∗ 0.51∗∗∗ 0.55∗ 1.07∗∗ 1.46∗∗∗
(0.27) (0.15) (0.33) (0.45) (0.53)Debt level (-1) 0.03∗∗∗ 0.02∗∗∗ 0.02∗∗∗ 0.05∗∗∗ 0.04∗∗∗
(0.01) (0.00) (0.01) (0.01) (0.01)Output Gap (-1) −0.05∗ −0.07∗∗ −0.05∗ −0.03 −0.06∗
(0.03) (0.03) (0.03) (0.04) (0.04)Inflation rate 0.04∗∗ 0.02 0.03 0.09∗ 0.08∗
(0.02) (0.02) (0.02) (0.05) (0.05)Dependency Ratio −0.01 −0.03∗∗ −0.02 −0.09 −0.12∗∗∗
(0.04) (0.02) (0.04) (0.08) (0.04)Population −0.17∗ 0.00 −0.14 −0.12 −0.02
(0.09) (0.00) (0.13) (0.17) (0.03)Openness 0.34 0.04 0.30 1.36 0.82
(0.67) (0.30) (0.77) (1.14) (0.94)Ideology 0.10 0.09 0.09 0.18 0.12
(0.07) (0.06) (0.06) (0.14) (0.11)Ideology Range 0.04 −0.09 0.01 −0.07 0.11
(0.15) (0.12) (0.15) (0.22) (0.28)Government Size 0.12 −0.06 0.06 0.49 0.03
(0.17) (0.07) (0.14) (0.38) (0.24)Government Fragmentation −2.08 −2.01∗∗∗ −2.02 −2.89 −5.55∗∗∗
(1.82) (0.86) (1.86) (2.78) (1.68)Majority Fragmentation 0.48 −1.18 0.37 2.02 −1.86
(1.31) (0.83) (1.54) (1.28) (1.85)Parliamentary Election −0.32∗∗ −0.37∗∗∗ −0.33∗∗ −0.29∗∗ −0.43∗∗∗
(0.15) (0.16) (0.17) (0.14) (0.14)District Magnitude −0.03 0.00 −0.02 −0.08∗∗∗ −0.02
(0.03) (0.00) (0.02) (0.02) (0.02)Dist. Magn. x Open/Closed List 0.07∗ 0.01 0.06 0.11∗ 0.01
(0.04) (0.03) (0.05) (0.07) (0.08)Delegation −0.95 −0.59 −0.94 −2.31∗ −1.51
(0.61) (0.37) (0.70) (1.26) (0.97)Delegation x Government Frag. 2.27 0.93 2.25 4.14∗∗ 4.43∗∗
(1.65) (0.85) (1.49) (1.97) (1.82)Contract −0.33 −0.70∗ −0.32 −1.17 −1.32
(1.01) (0.36) (0.90) (1.74) (1.21)Contract x Government Frag. 2.35∗∗ 2.04∗∗ 2.40∗∗ 3.35 3.48∗
(1.20) (0.67) (1.17) (2.45) (2.04)Institutional Quality 0.56∗∗∗ 0.30∗∗∗ 0.47∗ 0.84∗∗ 0.72∗∗∗
(0.20) (0.07) (0.26) (0.40) (0.24)SGP −0.70∗∗∗ −0.52∗∗ −0.63∗∗ −1.58∗∗ −1.71∗∗∗
(0.22) (0.19) (0.26) (0.58) (0.58)RunUp to EMU 0.29∗∗ 0.26 0.30∗∗ 0.31∗ 0.33∗
(0.14) (0.16) (0.12) (0.17) (0.20)
R2 0.457 0.657Obs 490 490 490 463 490
Notes: Results of estimation of Equation 1 using: 1Fixed Effects, robust standard errors in parentheses.2Pooled OLS, standard errors clustered by country, robust standard errors in parentheses. 3Kiviets correctedLSDV estimator for unbalanced dynamic panels as in Bruno (2005a), Bootstrapped standard errors (using 100
repetitions) in parentheses; 4Arellano Bond, robust standard errors in parentheses. 5Arellano-Bover/Blundell-Bond, robust standard errors in parentheses. Constants included in every regression but not shown. Dependent
variable: FPB - cyclical adjusted primary balance; Significance at the 10%, 5% and 1% level is indicated by∗, ∗∗ and ∗∗∗ respectively.
30