the determinants of high performance work …the determinants of high performance work systems:...
TRANSCRIPT

Submitted to the 1997 Academy of Management Annual Meetings, Human Resource ManagementDivision.
THE DETERMINANTS OF HIGH PERFORMANCE WORK SYSTEMS:CROSS-SECTIONAL AND LONGITUDINAL ANALYSES
Mark A. HuselidSchool of Management and Labor Relations (SMLR)
Rutgers UniversityP.O. Box 5062
New Brunswick, NJ 08903-5062(908) 445-5445
email: [email protected]
And
Barbara L. RauSchool of Management and Labor Relations (SMLR)
Rutgers UniversityP.O. Box 5062
New Brunswick, NJ 08903-5062(908) 445-5447
email: [email protected]
January 3, 1996
----------------The authors are grateful to Brian Becker for his comments on an earlier version of this
manuscript. This study was partially funded by grants from the Human Resource Planning Society, the
Society for Human Resource Management (SHRM) Foundation, the Mark Diamond Research Fund,and the SUNY-Buffalo School of Management. The interpretations, conclusions, andrecommendations, however, are ours and do not necessarily represent the positions of theseinstitutions.

1
(48)The Determinants of High Performance Work Systems:
Cross-Sectional and Longitudinal Analyses
Abstract
In this paper we examined factors hypothesized to facilitate and constrain the adoption of a
High Performance Work Systems (HPWS). In 2,410 firms across diverse industries and three time
periods we found both organizational characteristics and external environmental contingencies to be
associated with the adoption of a HPWS.

2
The Determinants of High Performance Work Systems:Cross-Sectional and Longitudinal Analyses
Prior conceptual work in the field of personnel and human resource (HR) management hastraditionally focused on the development, implementation, and evaluation of the wide range oforganizational practices associated with this function. In recent years this largely “micro” orientationhas been augmented by an increasing interest in what might be called the strategic role of humanresources. Unlike the early work in strategic human resources (Fombrun, Tichy, & DeVanna, 1984),this new literature stream is not confined to the strategic management of the HR function. Rather,greater emphasis is given to the strategic impact of human resources at the level of the firm;namely, the impact of the firm’s HR strategy on overall firm performance (Cappelli & Singh, 1992). This trend is reflected in recent work that reframes the role of the HR function as a partner in themanagement of the business (Jackson & Schuler, 1995; Ulrich 1996). Within this context, firm HRstrategy, whether driven by formalized HR structures or embedded within general management, iscomprised of an internally consistent system of HR management (HRM) practices that is alignedwith and helps to implement the firm’s competitive strategy (Baird & Meshoulam, 1988; Jackson &Schuler, 1995).
Reflecting recent calls for the application of meso or cross-level research methodologies(Cappelli & Sherer, 1991), the recent empirical work in this field is expanding to embrace a moreholistic or “macro” orientation as well. Rather than focusing on one HR function or practice, the levelof analysis has become clusters or “bundles” of High Performance Work Practices (HPWP)(MacDuffie, 1995). For example, Pfeffer (1994) advocates the adoption of sixteen HPWP includingemployment security, selectivity in recruiting, work teams, incentive compensation, and employeeownership. Similarly, Huselid (1995) describes thirteen HPWP including comprehensive employeeselection and development procedures, organizational work structures that encourage employeeinvolvement, and performance management and incentive compensation systems that align theinterests of employees with those of the shareholders. Conceptually, firm efforts to developcomplementarities or synergies among HRM practices, and thereafter between the HRM system andfirm competitive strategy, should lead to enhanced firm performance (Jackson & Schuler, 1995;Milgrom & Roberts, 1995).
Collectively, the adoption of an operationally appropriate HPWP comprises an organizationalHigh Performance Work System (HPWS). In a dynamic and highly competitive marketplace, theintent of such a system is to develop a workforce with the appropriate skills and motivation and toprovide an organizational structure that allows employees to influence how their roles are performed(Bailey, 1993). Indeed, prior work focusing on the firm-level impact of HPWS finds substantialeconomic returns associated with the adoption of such systems. Arthur (1994), Cutcher-Gershenfeld(1991), Delaney (in press), Delaney & Huselid (1996), Ichniowski, Shaw, & Prennushi (1994),Huselid (1995), Huselid & Becker (1995; 1996a; 1996b), MacDuffie (1995) and Youndt, Snell, Dean,and Lepak (1996) all found that the adoption of a HPWS to have an economically and statisticallysignificant impact on employee turnover, productivity, or corporate financial performance. Morerecently, special issues devoted to this topic have appeared in the Academy of Management Journaland Industrial Relations. The impact of this work has been to amplify earlier conclusions about theimportance of HRM systems in the determinants of firm performance.
As the empirical evidence supporting the existence of a HPWS-firm performancerelationship accumulates, the moderate rate of HPWS diffusion observed by a number of authorsbecomes a more salient subject for inquiry (Johns, 1993). Indeed, if HPWS are so successfuleconomically, why haven’t all firms adopted them? The literature in the field of strategicmanagement presents one plausible explanation. For a firm’s HRM system to generate sustainablecompetitive advantage, its organizational structures must not be easily imitated by competitors(Hamel and Prahalad, 1994). Moreover, to the extent that different firm competitive strategiesrequire different role behaviors from employees, we should expect that the form and structure of theHRM system to reflect these requirements (Schuler & Jackson, 1987). In short, while firms shouldhave an incentive to adopt HPWS, there are likely to be sufficient barriers to implementation that we

3
should be unsurprised by considerable variability in the diffusion of these practices across firms. Beyond these explanations, however, little is hypothesized or known about the factors influencing afirm's decision to adopt a HPWS. As the field of HR incorporates a more macro focus, this issue willbecome increasingly important for scholars interested in understanding the determinants of HRMsystems and for practitioners attempting to implement them. Drawing on three unique nationalsamples of publicly-held firms across a wide range of U.S. industries, this study extends a verynascent literature that has attempted to identify factors influencing the decision to adopt HPWS.
We begin with a review of the limited conceptual and empirical literature on the subject. From this literature we develop a set of hypotheses, focusing not only on the correlates of theadoption of HPWS, but also on the factors associated with changes in firm deployment of HPWSacross time. We rely on a large national sample of firms across three data collection periods (1992,1994, and 1996) and focus on the role of firm and environmental contingencies as predictors ofHPWS adoption. We conclude with some remarks for practitioners wishing to adopt HighPerformance Work Systems, and also for scholars wishing to advance this emerging line ofresearch.
PRIOR WORKBecause academic interest in High Performance Work Systems represents a very new area
and one that focuses more on the effects of such systems than their determinants, there is very littleconceptual work devoted to the diffusion of these practices. Existing studies draw from severalliteratures. For example, Jackson, Schuler and Rivero (1989) used a behavioral perspective(grounded in I/O psychology) to develop a model of HRM practices as a function of organizationalcharacteristics. They argued that HR practices are designed to influence employee behaviors andattitudes, and the focus of their analyses is on the organizational characteristics that have sucheffects. Jackson et al. include both organizational characteristics involving the firm directly(competitive strategy, technology, structure, size, unionization) as well as characteristics of the firm’senvironment (industry). Much of the Jackson et al. paper provides support for the conventionalwisdom that despite the diffusion of information about HPWP, there remains considerable interfirmand interindustry variation in the adoption of these practices. Jackson et al. do not, however, directlytest a model of the determinants of a HPWS, but rather provide a series of discriminant functionsshowing that individual personnel practices are systematically different in firms grouped by strategy,industrial sector, etc.
Though touching on dimensions similar to Jackson et al., Osterman (1994) examines a morenarrow set of work practices while developing an interdisciplinary conceptual basis for “workplacetransformation” within the manufacturing sector. Rather than focusing on a broad system of HighPerformance Work Practices, Osterman examines specific innovative methods of work organizationthat include self-directed work teams, job rotation, quality circles, and Total Quality Management. Drawing on the prior conceptual work in industrial relations, sociology, and management, heconsiders the adoption of these practices to be a function of markets and strategy, technology,management values, and firm environment. Firm environment would include firm size, age, branchstatus, and time horizon for decision. Across several transformations of the dependent variablereflecting the diffusion of these practices within the firm, Osterman finds that management valuesfavoring employee welfare, the degree of international competition, and employee skill requirementshave an important influence on the adoption of innovative forms of work organization.
Similarly, Arthur (1992) found in a sample of steel “minimills” that HRM systems conformedto a strategy of either cost reduction or enhanced employee commitment. He also found thatminimills adopted HRM systems consistent with their business strategies, although none of the otherhypothesized determinants of the HRM systems (firm age, firm size, union coverage, location, andlocal labor market) was confirmed. And Snell (1992) found in a sample of 102 manufacturing plantsthat firms tended to link the form and structure of their administrative control systems with theircompetitive and manufacturing strategies.
At least two studies have adopted a systems perspective and consider the adoption ofHPWP in clusters or “bundles,” rather than as individual practices. Their focus on HRM systems
4
reflects the growing theoretical and empirical evidence that a portion of the firm-level impact ofHPWS is created through complementarities and synergies among practices, as well as betweensystems of practices and the firm’s competitive strategy. Ichniowski and Shaw (1995), drawing onan economic model of firm decisionmaking, cast the adoption of workplace innovation as aninvestment decision. The costs and benefits of such innovations were posited to be a function ofplant technology and production methods, managerial and labor force experience, and productmarket characteristics. Based on panel data from 35 production lines in 21 steel companies, twenty-six individual practices (e.g., incentive pay, recruiting, teamwork, employment security, job flexibility,training, and labor management communication) were combined into one index reflecting the HRsystem for each line. The results supported their “adoption hypothesis” that organization change willbe more difficult in older plants due to inadequate information about appropriate HR clusters andbecause workers in older plants will find such investments less appealing.
Pil and MacDuffie (1996) hypothesized that firms with poor performance relative tocompetitors, longer employee tenures, no recent lay-offs or downsizings, and firms that wereundergoing significant environmental “disruptions” (e.g., deregulation) would be more likely to adoptinnovative work systems. Their two-period study of the worldwide automobile industry (the MITInternational Assembly Plant Study) found a general trend toward the adoption of innovative worksystems from 1989 to 1993-94. They did not find the adoption of such systems to be linked to eitherhigh or low levels of prior firm performance, nor did they observe a link between employee layoffsand tenure and the adoption of innovative work systems. Their conclusion was that the externaleconomic imperatives in this industry (i.e., intense global competition) might be the predominantfactor affecting the adoption of HPWS.
Finally, in a review of the prior work in this area, Johns (1993) explained the adoption ofHRM innovations through the lens of the organizational innovation-diffusion literature. He showedthat the technical merit inherent in a HRM innovation accounts for relatively little variance in theextent to which is it adopted, and argued that the adoption of HRM innovations is strongly influencedby perceptions of uncertainty, politically processes, governmental regulation, and imitationprocesses across organizations.
In sum, the prior empirical literature draws on a largely ad hoc conceptual framework forguidance. Each paper cited above adopts a somewhat different theoretical perspective, which isunsurprising given the necessarily interdisciplinary nature of the subject. Indeed, as the interest inthis topic follows directly from its relationship to the larger HR strategy-firm performance linkage, it isappropriate that the empirical work in this area be informed by a broader conceptual foundationrather than developing a unique theoretical framework of its own. Our work continues in that veinand develops a model of HPWS as a function of firm and environmental characteristics. It tooshould be considered exploratory, though it extends prior empirical work in several important ways. Most importantly, it utilizes a comprehensive, multi-dimensional measure of a firm’s HR system anddraws these data from three samples of firms that are broadly representative of U.S. industry.
Estimation Model and HypothesesAs a relatively nascent empirical literature, there is little guidance with respect to the proper
specification of the estimation models. However, given that the limited conceptual (Bailey, 1993)and empirical (Arthur, 1994; Huselid, 1995; MacDuffie, 1995) work that considers the effects ofmultiple dimensions of the HR system on firm performance, we likewise examine the determinantsof multiple dimensions of the HR system. Therefore, while our theory is not developed enough togenerate separate hypotheses for each dimension, our empirical analyses will examine eachhypothesis by dimension. As such we consider the dimensional elements of the analysis largelyexploratory.
As we describe in detail in the methods section, our conceptualization of the HRM system isbased on a multidimensional model. Drawing on the prior empirical literature we develop a simpleestimation model, such that;
HPWS = f(External Environment, Organizational Characteristics),i

5
where HPWS is one of the elements of the HR system that will serve as dependent variables. i
Consistent with earlier work, the independent variables are broadly categorized as external orinternal to the organization. Their hypothesized effects on the adoption of HPWS are described inthe following sections.
External Environmental FactorsPrior conceptual work suggests that the industry in which a firm operates exerts considerable
influence over the form and structure of its HRM system. Keats and Hitt (1988), for example,suggested that at least three industry characteristics are influential. First, the degree of industrycomplexity should have a positive impact on the use of a HPWS. A highly competitive productmarket with many potential threats presents a relatively more complex environment which shouldbenefit from the functional flexibility among employees generated by a HPWS. In more highlyconcentrated product markets, in contrast, the environment is less complex as there are fewerpotential rivals to track and less need for a HPWS. Additionally, firms in concentrated industries(which, on average, are larger than firms in unconcentrated industries) may be more likely to becharacterized by the traditional bureaucratic command and control structures that are inconsistentwith a HPWS. Second, industry munificence (Keats & Hitt, 1988), reflected in the relative level ofindustry profitability, should signal the presence of resources available to invest in HPWS. Hence,all else equal, firms operating in more profitable industries should be more likely to adopt HPWS.Finally, the degree of uncertainty in the firm's cash flow or revenue stream should be negativelyrelated to the propensity to adopt a HPWS. Typically operationalized as the variance in industryprofitability over time (Keats & Hitt, 1988), industry dynamism should make investments in any typeof asset more risky, and therefore less probable. To the extent that an organizational HPWS isconsidered an investment, a view that is consistent with the recent strategic view of HR, such addedrisk will diminish its appeal. Alternatively, one of the hallmarks of a HPWS is flexibility in both theskills of the labor force and the reward system. To the extent HPWS can effectively hedge some ofthis environmental risk, they may be relatively more appealing to firms confronting such uncertainty. It is not clear which of these effects will dominate.
Hypothesis 1: Industry complexity and munificence will have a positive impact whileindustry dynamism will have either a positive or a negative impact on the use of HPWS.
Internal Organizational FactorsConsistent with the diverse results reported in prior work, we examine a variety of
organizational characteristics that should influence the adoption of a HPWS. Generally, weanticipate that these variables will reflect the economic benefits and costs of the HPWS, or theorganizational constraints on the adoption of such a system.
We expect that firm size will have a positive effect on the adoption of HPWS. All else equal,larger firms should be more likely to have the resources, experience, and organizational slackrequired to make considerable investments in a HPWS. Moreover, the relative costs of investmentsin human capital-enhancing HPWS should be more easily amortized across greater numbers ofemployees, making their costs per-employee lower.
Hypothesis 2: Larger firms (i.e., those with more employees) should be more likely to investin a HPWS.
In addition, we expect the composition of the firm’s HRM function to have an importantimpact on the adoption of a HPWS. Given that facilitating the adoption of many HRM innovationsrequires technical expertise among practitioners (Huselid, Jackson, & Schuler, in press), we expectthe relative proportion of HRM employees within a firm to be positively associated with the adoptionof a HPWS. We recognize the potential for an omitted variable bias in this relationship, however:investments in a HPWS and the presence of significant numbers of HRM employees may both bedue to an HR strategy requiring significant investments in people. Hence, our hypothesis is simply

6
associational:
Hypothesis 3: The relatively number of HRM department employees will be associated withthe deployment of a HPWS.
The composition of the firm’s broader workforce should also affect the adoption of a HPWS,based on the expectation that the returns from investments in such systems are likely to vary acrosscategory of employee. In fact, there is considerable support in the literature for the notion that theeconomic returns from investments in human capital-enhancing HRM systems increase with joblevel and complexity. For example, Hunter, Schmidt, & Judiesch (1990) found the standard deviationof employee performance in dollars (SD ) to be proportionally greater for higher level organizationaly
employees than for lower level employees, while Becker & Huselid (1992) found the same result foremployee salary level. This suggests that we would be likely to see more extensive investments inHPWS as the proportion of the managerial labor force (i.e., exempt employees) within the firmincreases. However, this assumes that the firm is “right sized”. Firms with an inappropriately largecadre of middle management may well have a higher managerial proportion in their labor force, yetnot have adopted commensurate HPWS. Thus, while we expect a positive relationship, to the extentthat our sample includes such firms the effect will be attenuated.
Hypothesis 4: Firms with a larger proportion of managerial employees (exempt) should bemore likely to invest in HPWS.
The presence of a unionized labor force would be expected to reduce the prospects forobserving a HPWS for three reasons. First, union contracts have historically sought to limit the managerial discretion and flexibility in staffing and reward management that typify a HPWS. Second, unions, by virtue of their bargaining power, threaten to appropriate a substantial portion ofthe returns associated with such practices (Ichniowski & Shaw, 1995), thus diminishing their appealto the firm. While there is some support for the argument that unions can facilitate the adoption ofHPWS (Eaton & Voos, 1992), empirically, Dimick & Murray (1978), Kaufman & Kaufman (1987), andJackson, Schuler, & Rivero (1989) all found that unionized firms were substantially less likely toadopt progressive HRM practices. Third, union avoidance has also been hypothesized as amotivation for adopting progressive HRM practices. For example, Fiorito, Lowman, & Nelson (1987)and Kochan, McKersie, & Chalykoff (1986) found that the HRM practices used by firms had asubstantial effect on the probability of union formation and expansion. Thus, the presence of anemployee union may diminish organizational investments in HPWS, and/or more progressive HRpolicies may act as a deterrent to union formation. Unfortunately, there is little prior work concerningthe direction of causality. However, since the bargaining units in most large firms were establishedlong ago and the significant attention directed towards HPWS is a relatively recent phenomenon, it ismore likely the unions influence the adoption of HRM practices than the reverse (Becker & Olson,1992; Clark, 1984). Thus, we hypothesize:
Hypothesis 5: Union coverage will be negatively associated with the use of HPWS.
Previous research has considered neither the impact of labor productivity nor the relativeimportance of labor costs on the adoption of a HPWS. Standard economic theory predicts that laborproductivity will increase as human capital is matched with more physical capital and technology. Allelse equal, more intensive investments in capital and equipment would mean that investments inHPWS will be highly “leveraged”. Therefore, any improvement in the work system through a HPWSwill be likely to have a larger financial impact in highly capital intensive firms (i.e., those withrelatively greater property, plant, & equipment per employee). Additionally, highly capital intensivefirms may in general be more motivated to improve labor productivity to justify their capitalinvestments. Less clear is the effect of relative labor costs on investments in HPWS. Holdingcapital intensity constant, as labor costs comprise a larger share of total revenue, firms might
7
anticipate greater benefit from investments in HPWS, particularly when the labor force highly isskilled. Offsetting these benefits, however, is the relatively higher cost of HPWS implied by greaterlabor intensity. Hence, our hypothesized overall effect of relative labor costs is nondirectional.
Hypothesis 6: Capital intensivity will be positively associated with the use of HPWS.
Hypothesis 7: Relative labor costs will affect the use of HPWS.
The development and preservation of firm-specific intellectual capital has been of substantialrecent interest among academics and practitioners. One tangible measure of the degree to whichfirms attempt to develop intellectual capital is through investment in research and development(R&D) activities. Following Hamel and Prahalad (1994), a HPWS should represent an importantmethod through which firms that rely on R&D can support such a strategy by developing andreinforcing their core competencies in these areas. Indeed, a HPWS can play an important role instructuring an organizational environment that appropriately rewards innovation and creativity andfocuses those efforts in way that serves the interests of the organization (e.g., Gerhart & Milkovich,1992; Balkin & Gomez-Mejia, 1984). Hence, we expect that firms with greater emphasis on R&Dactivities will be more likely to invest in HPWS.
Hypothesis 8: R&D intensity will be positively associated with the use of HPWS.
The degree of financial risk assumed by a firm is also likely to affect the use of a HPWS. Firm-specific risk can arise from a number of factors, including the use of more debt (relative toshareholder’s equity) in the firm’s capital structure as well as the firm’s underlying level business riskas assessed by the capital markets. We focus on that element of the overall business risk borne byshareholders (systematic risk) because top management will have an incentive to shift that risk toemployees where possible (Becker & Olson, 1989). To the extent that employees are risk averseand will require a premium to bear this risk, management’s ability to shift risk is not unlimited. Riskshifting in the form of reward management systems that link employee performance to firmperformance is one way to improve the alignment of interests between employees and shareholderswhile mitigating increased risk premiums (Balkin & Gomez-Mejia, 1984; Eisenhardt, 1989; Gerhart &Milkovich, 1992). More generally, where firm systematic risk is high, firms will have more incentiveto improve employee skill levels, increase functional flexibility and reduce fixed labor costs andtherefore have greater incentive to use HPWS. Thus, we expect:
Hypothesis 9: Firm systematic risk (beta) will be positively associated with the adoption ofHPWS.
The competitive strategy a firm pursues should also have an impact on the adoption of aHPWS. The concept of strategic HRM is based on the premise that human capital issues should beincorporated in the development of the firm’s competitive strategy, and once this strategy has beendeveloped, the HR function should design a system of internally consistent policies and practicesthat help to support and implement that competitive strategy. Within this context, Schuler & Jackson(1987; 1989), Jackson, Schuler, & Rivero (1989) and Jackson & Schuler (1995) describe theimportance of employee role behaviors in the implementation of firm competitive strategy. Based onthe work of Michael Porter (1985), the premise of Schuler, Jackson and their colleagues is that apredominantly differentiation or a focus strategy will require more intensive investments in a HPWSthan will a cost leadership strategy. For example, Jackson, Schuler, & Rivero (1989) and Schuler &Jackson (1989) found in a sample of 267 firms that firms using innovation, differentiation, and costleadership competitive strategies used HRM practices that were consistent with these strategies. Similarly, Arthur (1992) found that the use of a cost leadership competitive strategy was associatedwith diminished investments in human resources. Thus, we expect:

8
Hypothesis 10: Emphasis on a cost leadership competitive strategy in favor of either adifferentiation or a focus competitive strategy will be negatively associated with the use ofHPWS.
We expect the intrafirm variability of HRM strategies across business units within firms toalso be related to the adoption of a HPWS. On one hand, firms with demonstrably differentcompetitive strategies across business units could be expected to reflect this valiance in HRstrategies across these units (Schuler & Jackson, 1987). On the other hand, firms that recognize thevalues of a HPWS may well be likely to attempt to adopt them widely throughout the firm. Weexpect the latter effect to predominate. Thus:
Hypothesis 11: Firms consistent in the adoption of HPWS throughout the firm will be morelikely to adopt a HPWS.
We also expect that the values espoused by senior management to have an impact on theadoption of a HPWS. Senior management teams successful in the formulation and socialization of abroad organizational “vision” highlighting the role of people (as opposed to focusing on controllingcosts or controlling bottom-line results) should be more likely to adopt a HPWS (Osterman, 1994).
Hypothesis 12: Managerial values will be related to the adoption of a HPWS.
Finally, the provision of employment security is one tangible way that senior managementcan communicate their human capital strategy to employees. Employment security has been widelyhypothesized to increase the returns from investments in a HPWS, as employees cannot provide thepotential benefits to firms if they are more likely to turnover. In short, job security is thought to lowerthe risks for both the employer and employee for investing in firm-specific human capital (Pfeffer,1994).
Hypothesis 13: The provision of job security will be positively related to the adoption of aHPWS.
METHODSSample and Respondents
Our study draws on three waves of data collected in 1992, 1994, and 1996, and focuses onthe HRM systems used by firms in calendar years 1991, 1993, and 1995, respectively. In each casethe sample was drawn from Compact Disclosure, a commercial database comprised of annualcorporate 10-K filings. The sampling frame consisted of all publicly-held domestic firms with more1
than 100 employees and $5 million dollars in sales. For 1992 there were 3,452 firms in our sample;for 1994, there were 3,847 firms; and for 1996 there were 3,840 firms. After extensive pretestingand piloting of all survey materials, data on organizational HPWS were solicited from the chiefhuman resources officer within each firm. As we describe in greater detail below, the surveysshared a number of questions in common, but also differed in many items. In 1992 968 firmsrepresenting all major domestic industries returned usable questionnaires, for an overall responserate of 28 percent. In 1994 740 questionnaires were returned, for a 20 percent response rate. In1996 702 respondents completed questionnaires, for an overall response rate of 18 percent. 294firms provided usable data for both 1992 and 1994; 248 firms provided data for both 1994 and 1996;224 firms provided data for both 1992 and 1996, and 114 firms provided data for all three years.
Informants responded to each survey item separately for exempt and nonexempt employees,indicating the proportion of employees in each category who were affected by each practice. Toderive a measure of the degree to which the practices were used by a particular firm, responses toeach question were weighted by the proportion of employees in the exempt and nonexemptcategories and summed. Survey responses were then matched with capital market and accountingdata taken from Compact Disclosure. Substantial care was taken to ensure that all data were

9
matched to the same accounting periods. Missing data on some or all variables (primarily firmfinancial performance) reduced the sample for which complete data were available to 787 firms in1992, 685 firms in 1994, and 673 firms in 1996. The data collection procedures employed as well asthe development and validation of the HPWS scales are described in greater detail in Huselid (1995)and in Huselid and Becker (1995; 1996a).
Dependent Variables Our High Performance Work Systems measures were taken from Huselid (1995) and
Huselid & Becker (1995). In Huselid (1995) a two factor model of HPWS was developed based ondata collected in 1992, including thirteen HPWP widely found to be effective in prior empirical work(Delaney et al.,1989; U.S. Department of Labor, 1993; see Table 1). From these items, two factorsemerged, and a scale for each was constructed using the questions that loaded at .30 or greater on asingle factor. The first factor, Employee Skills and Organizational Structures (ESOS), focuses on theacquisition and deployment of employee skills throughout the organization. The second factor,Employee Motivation (EM), largely focuses on the firm’s reward management system. The policiesand practices that comprise these two factors are generally consistent with the “bundles” of HighPerformance Work Practices developed in other studies (Arthur, 1992; 1994; Delaney, Lewin, &Ichniowski, 1989; Ichniowski & Shaw, 1995; and MacDuffie, 1995) and have a demonstratedrelationship with intermediate (turnover, productivity) and capital market measures of firmperformance (Huselid, 1995; Huselid & Becker, 1995; 1996a; 1996b).
[Insert Table 1 About Here]
Using data from the 1994 survey, Huselid and Becker (1995) sought to improve on thescales developed in Huselid (1995). The same 13 questions used in the 1992 survey were alsoincluded in the 1994 survey, allowing for a cross validation of the original results. However, the2
1994 survey also focused more specifically on the strategic architecture of the HRM system andincluded measures not available in 1992. These same questions were also included in the 1996survey. Therefore, one of the purposes of this paper is to report the results for the expandedmeasure available in 1994 and 1996 and to compare those results with the more limited measuresavailable in Huselid (1995). Specifically, in our analyses of the 1994 and 1996 data we combine nineitems from the 1992 survey with eight new items. These items were chosen in light of the recentconceptual work describing the importance of aligning HR and business strategies and the importantrole of compensation, performance management, and training systems in facilitating these goals(Jackson & Schuler, 1995). In all, seventeen items are included in our subsequent analyses. Thefactor structure for these items is presented in Table 2.
[Insert Table 2 About Here]
Thirteen of the seventeen items loaded unambiguously on one of three factors denoted inTable 2. The first factor, which we named HR Strategy (alpha = .75) reflects efforts on the part ofthe firm to link HR and business strategies. The second factor, Performance Management (alpha =.75), represents those elements of the HR system that link individual employee behaviors with firmlevel outcomes. The third factor is relatively more heterogeneous, but in general contains itemspertaining to the selection and development of employees. Reflecting this heterogeneity, Selectionand Development had a much lower alpha (.47).
Thus the 1992 survey has two dimensions; ESOS and EM. The 1994 and 1996 surveyshave three dimensions, S&D, PM, & HR Strategy. Across the samples there is a large degree ofsimilarity and conceptual overlap between the ESOS and S&D variables. The items contained inthese scales reflect investments in training & development activities and the provision of workstructures intended to take advantage of those investments. Similarly, there is significant overlapbetween the EM and PM variables that reflect the reward management dimension of a firm’s HPWS. As described above, the HR Strategy variable was not available in the 1992 dataset.

10
Independent VariablesExternal Environmental Factors. Complexity, dynamism, and munificence are each
measured at the industry level. Following Keats & Hitt (1988), complexity was defined as the four-firm industry concentration ratio, where a higher ratio indicates lower complexity. Munificence wasdefined as the five-year growth in industry sales, calculated by regressing the log of net sales ontime. Industry dynamism, reflecting the degree of volatility in industry sales growth, is measured withthe antilogarithm of the standard error of the regression coefficient in the equation described above(Keats & Hitt, 1988). Since these three variables have unique values at the 2 digit SIC industry level,we do not use industry dummy variables as an additional control. However, we have included abroad control for industry type (manufacturing) that takes the value one if the firm is located in SIC2000 - 3999, and zero otherwise.
Internal Organizational Factors. Additional variables were constructed by combining datafrom several sources. Total employment and the number of employees located within the HRfunction were taken from the original mailed questionnaire. The value of property, plant and3
equipment was taken from Compact Disclosure. Each of these variables were measured inlogarithms. R&D intensity is also calculated based on data from Compact Disclosure and measuredas annual R&D expenditures divided by net sales. Firm systematic risk (beta) was calculated forwith data taken from the Center for Research on Security Prices (CRSP) database, using a 250trading-day period. This is a conventional measure used in finance and reflects the regressioncoefficient from the regression of each firm’s daily shareholder return on the daily market return. Thepercentage of the firm’s employees who are unionized, the percentage of firm employees who are inmanagement (exempt positions), and the relative emphasis on cost leadership, differentiation, andfocus competitive strategies are all taken from data on the survey questionnaire. From the 19944
and 1996 surveys we also included three items intended to reflect the leadership activities andunderlying focus of senior executive teams. Vision reflects the extent to which these teams attemptto formulate and communicate basic organizational direction. Motivation reflects the extent to whichsenior executive teams attempt to challenge people with new goals, emphasize company values,and get people to become enthusiastic. Finally, Employment Security reflects the extent to which anexplicit effort is made to provide employment security to the firm’s employees. Each of these itemswas taken from the questionnaire, and was scaled from 1 - 6.
No direct measure of labor cost intensity is available from either the questionnaire orsecondary sources for most firms. However, two income statement items together reflect total firmspending on labor. One is cost of goods sold (including production labor costs) and the other isselling, general, and administrative expenses (including administrative labor). To calculate totallabor costs for each firm, the log of each of these variables was regressed on the log of totalemployment and control variables. The results of these analyses allowed us to estimate the percentof those costs that were attributable to labor expenses. These values were summed to calculatelabor expenses, and labor cost intensity was then calculated with the ratio of labor expenses tosales.5
ANALYSES AND RESULTSDescriptive statistics and intercorrelations for all variables were calculated for each survey
year. For each year, separate OLS regressions were performed using each of the HPWSdimensions as dependent variables. For the majority of the regression models we present threeequations, each representing our 1992, 1994, and 1996 datasets. After completing the cross-sectional (OLS) regressions, longitudinal regression models were estimated to capitalize on thepanel data. While a significant advantage of our analyses is the reliance on longitudinal data,unreliability in our measures of the HRM system increases the potential for inconsistency in ourfindings, especially in the panel regression models (Huselid & Becker, 1996).
Descriptive statistics and intercorrelations for all variables are presented by year in Tables 3,4, & 5. Our measures of HPWS in each case reflect an average of standard scores, hence theirmeans are very near zero. The descriptive statistics for each of the other variables were consistentwith prior empirical work on this topic. As expected, all of the HPWS scales were significantly
11
intercorrelated (p < .001), yet the magnitude of the interrelationships was sufficiently small to warrantseparate exploration of each. Intercorrelations between variables were similar across each surveyyear.
[Insert Tables 3, 4 & 5 About Here]
Cross-Sectional (OLS) Regression ResultsTable 6 presents the regression of each High Performance Work System dimension common
to the 1992, 1994 & 1996 surveys on the independent variables, while Table 7 shows similarspecifications for the three dependent variables common to the 1994 and 1996 surveys (HRStrategy, PM, and S&D). The models shown in Table 7 also contain three additional independentvariables only available in the 1994 and 1996 surveys (Vision, Motivation, and Employment Security). Each equation reached significance at conventional levels.
[Insert Tables 6 and 7 About Here]
The first hypothesis posited a link between a firms' external or operating environment and theprevalence of a HPWS. As shown in Tables 6 and 7, industry complexity had a negative andsignificant effect (indicating the hypothesized positive relationship) in just 3 of 12 equations. Theresults for industry munificence were more differentiated. Munificence was significantly andpositively related to the reward management dimensions in 4 of 5 comparisons. However,munificence was negatively related to staffing & development in 2 of 5 comparisons. Munificencewas unrelated to the HR strategy variable in either 1994 or 1996. Our prediction for Dynamism wasnondirectional. However, we found industry dynamism, reflecting volatility in industry profitability, tobe significantly negatively related to the presence of HPWS in 8 of 12 comparisons across the threetime periods. Thus, it would appear that volatility in industry profitability reduces the propensity forfirms to invest in HPWS, perhaps because it leaves the potential returns from these investmentsmore risky as well.
Overall these results suggest limited support for the first hypothesis. Across each of themodels the variable with the largest practical and statistically significant effects is industrydynamism, while industry munificence had positive effects on reward management and negativeeffects on the remainder of the HRM system. While industry complexity (concentration) has beengenerally found to be an important determinant of firm profitability, we observed no systematicrelationships between this variable and a firm’s HPWS. The results partially supported the second and third hypotheses as well. Larger firms (i.e.,those with more employees) were somewhat more likely to employ each of the dimensions ofHPWS. A relatively greater presence of employees within the HR function is associated with morestaffing and development, but not reward management. More HR employees were negativelyassociated with reward management in one of two models. This may simply reflect the fact thatcompensation policies and programs are often influenced by those outside the function (e.g.,consultants, line managers) than are other elements of a firm’s HRM system. Surprisingly, relativelymore employees within the HR function was only weakly related to HR Strategy. This is inconsistentwith our expectation of strong links between the presence of employees within the HR function andan HR strategy - competitive strategy link.
In Hypothesis 4 we anticipated that a labor force with a relatively larger percentage ofexempt (managerial) workers would benefit from greater investments in the HR system, and wouldtherefore invest more extensively in a HPWS. We found just such an effect for 3 of 5 comparisonsfor the reward management dimensions. However, just the opposite effects were found for staffing& development. For 3 of 5 equations, a greater proportion of nonexempt employees was associatedwith more extensive ESOS and S&D. Apparently, firms judge such systems to be more appropriatefor nonexempt populations. There were no systematic relationships between HR Strategy and theworkforce composition.
The fifth hypothesis stated that unions would have a negative effect on the use of a HPWS.

12
Consistent with this expectation, the union coverage coefficient was negative and significant for thereward management and ESOS dimensions in 8 of 10 comparisons. Interestingly, unions exhibiteda positive effect on the adoption of the other staffing & development factor, S&D, perhaps reflectingthe items contained in this factor (internal promotion, attitude surveys, employment testing, and paylevel), which are often subject of union negotiations. The sixth and seventh hypotheses concerned the relative impact of capital and labor intensityon the use of a HPWS. We anticipated that greater capital intensity would mean a potentially moreproductive work force and greater gains from investments in a HPWS. Alternatively, we anticipatedthat relative labor costs would affect the use of HPWS, although it was unclear in which direction. The results in the staffing and development models were consistent with this hypothesis in 4 of 5comparisons. However, more capital intensive firms were significantly less likely to adopt rewardmanagement in 4 of 5 comparisons. Considering that our models control for firm industry, thissuggests that firms in less capital intensive industries (e.g., services) are more likely to adopt theperformance management and incentive compensation elements inherent in reward management. Our measure of labor cost intensity is strongly negative for both reward management and staffing &development dimensions across 7 of 10 comparisons, which is consistent with the arguments that aHPWS helps to lower overall labor costs or that these practices are more likely to be observed in lowwage firms, or both. Although the presence of a HPWS is associated with significantly lower overalllabor costs, perhaps unexpectedly, our HR Strategy variable was unrelated with overall labor costs.
Hypotheses eight and nine posited a positive link between R&D intensity, firm systematic risk(beta), and the presence of a HPWS. The results were positive and significant for only 3 of 10comparisons for R&D intensity. Although firm systematic risk was unrelated to staffing &development and HR Strategy, it was positively and significantly related to reward management. Thus, although firms in more dynamic industries are less likely to use performance management andincentive compensation programs, more firm specific risk is associated with the greater use ofincentives. We expect that this simply reflects efforts on the part of the shareholders to transfer riskto employees.
The tenth hypothesis stated that an emphasis on a cost leadership competitive strategywould likely be negatively associated with the use of a HPWS. Our results showed a statisticallysignificant negative effect on staffing & development in 2 of 5 comparisons, indicating moderatesupport for this hypothesis. The impact of a cost leadership strategy on reward management wasmuch stronger, showing statistically significant negative effects in 5 of 5 comparisons. Firmsfollowing a cost leadership strategy were also found to be significantly less likely to align businessand HR strategies in 1 of 2 comparisons. Thus, it would appear that there is a linkage between firmHR and competitive strategies, but that this linkage is strongest for the reward managementdimensions of a firm’s HPWS.
The eleventh hypothesis suggests that firms consistent in the deployment of their HRMsystems will be more likely to adopt a HPWS. The results strongly supported this hypothesis, with10 of 12 comparisons showing significant and positive effects. We acknowledge, however, that thisresult is in part an artifact of the scale used to measure the dependent variable, in that firms withhigh scores on the HPWS variable by construction would have deployed HPWS widely.
The final two hypotheses could only be tested in the 1994 and 1996 datasets (Table 7). Hypothesis twelve predicted that the “values” espoused by senior management concerning HRwould be related to a firm’s HPWS. As expected, each of our measures of managerial values(vision and motivation) had a positive and significant effect on HR Strategy. The results for PM (1 of6) and for S&D (2 of 6) were much weaker, although directionally correct, where significant.
Hypothesis thirteen suggested that the provision of employment security would have apositive effect on the adoption of HPWS. We found positive and significant results for HR Strategyin both 1994 and 1996, and positive effects for S&D in one of two comparisons. In retrospect, it isperhaps unsurprising that firms with accountabilities and incentive compensation would not need to,or want to, provide extensive job security.

13
Panel (Longitudinal) RegressionsThe OLS regression equations shown above presume an equilibrium relationship among the
variables in the models, such that the impact of the independent variables is largely reflected in thedependent variables. Such an assumption raises at least two broad concerns about conclusionsdrawn from our cross-sectional results. The first is the potential for simultaneity, or reversecausation, between the independent and dependent variables. For example, it could be the casethat large firms are more likely to have both the resources and the inclination to adopt a HPWS, as ispresumed in our models. However, it may also be the case that firms with more extensive HPWSbecome larger over time. While a number of econometric procedures are available to model andcorrect for this form of simultaneity, such alternative explanations can never be completely ruled outwith cross-sectional data.
The second type of concern reflects the potential for heterogeneity, or omitted variable, bias. Variables unobserved by the researcher which are correlated with both the independent anddependent variables have the potential to bias the results. For example, the quality of a firm’smanagement may be related to a number of the independent variables, such as firm size or relativelabor costs, as well as the adoption of a HPWS. If this is so, then our estimates of the magnitude ofthe impact of the independent variables on the dependent variables is likely to be biased upward. Each of these concerns can be mitigated to a large extent through the use of longitudinal, orpanel, data. Moreover, such analyses can be considered a check on the OLS results, although ourpanel results can be expected to differ from our cross-sectional results for several reasons. The firstreason is that the relationships being modeled in the OLS and panel regressions differ, in that theOLS models presented above reflect equilibrium relationships, in that the impact of the independentvariables is presumed to be reflected in the dependent variables, as described above. In contrast,the panel or first-difference regression models reflect the extent to which changes in the independentvariables are related to changes in the dependent variables. Another way of conceptualizing thisrelationship is to think of the OLS models as reflecting levels of relationships, which the panelregressions will model growth or changes in a firm’s HPWS. A second source of divergence isassociated with differences in sample sizes, as we have multiple responses for only a subset of thefirms in our sample. A third source of expected differences in our results arises from the finding thatunreliability in our measures of the HRM systems will bias the results of the fixed-effects modelsdownward, and that this effect is exacerbated when these variables are measured multiple times (cf.Huselid & Becker, 1996).
[Insert Table 8 About Here]
Table 8 presents the panel analyses for the three categories of comparisons possible in ourdata: (1) 1992 and 1994 [n=278], (2) 1992 and 1996 [n=245], and (3) 1994 and 1996 [n=214]. Weestimated the relationships between HPWS and the independent variables using both random- andfixed-effects regression models. While the random effects models are conceptually moreappropriate when the inferences will extend to the population, fixed effects models are moreappropriate when the inferences are intended to apply to the sample under study. While randomeffects models will generally provide more efficient estimates, random effects regression modelsassume that the firm-specific intercepts are uncorrelated with the regressors (Greene, 1990, p. 495). The inherent tradeoff between efficiency and consistency in the random and fixed effects modelsprovides an empirical basis on which to choose between these competing models. The Hausman(1978) test provides a test of whether the bias inerrant in the random effects models exceeds thegain in efficiency. For our data, the Hausman tests generally reject the random effects model infavor of the more conservative estimates provided by the fixed effects models. We thereforepresent the more conservative pooled (with fixed effects controls) results for the ESOS variables(Equations 13 - 15), the EM variables (Equations 16-18), and the HR Strategy, PM, and S&Dvariables collected in 1994 and 1996 (Equations 19 - 21).
For staffing & development (ESOS), the most consistent results were related to changes infirm size, when measured as either total employment or employment within the HRM function.

14
Consistent with our expectations, firms becoming larger over the period under study were highlylikely to adopt a more elaborate HPWS. In addition, firms becoming more consistent in thedeployment of their work systems were also more likely to adopt higher levels of ESOS. There wasa slight tendency (in 1 of 3 equations) for firms increasing in systematic risk and in union coverage toreduce the level of ESOS they employ.
For the reward management dimension of a firm’s work system (EM), increasing volatility ina firm’s external environment was linked to lower levels of EM. As the external economicenvironment in which a firm operates becomes more volatile, it would seem, firms shift from morecontingent to more fixed compensation systems. There was a slight tendency for firms whoseindustries are increasing in profitability over this period to increase their use of EM, while firmsincreasing in size over this period were likely to reduce their level of EM. Consistent with ourexpectations, there was a slight tendency (in 1 of 3 equations) for firms increasing the proportion ofexempt employees to expand their use of EM, while an increase in union coverage over this periodwas also significantly related to a decrease in the deployment of EM. Finally, a shift toward thedeployment of a cost-leadership competitive strategy was also associated with decreasing use ofEM.
Finally, Models 19-21 show the fixed-effects panel regressions for the HR Strategy, PM, andS&D variables (collected in 1994 and 1996). For HR Strategy, increased industry complexity(concentration) was negatively associated with a shift towards matching HR and business strategies,while increasing industry munificence was positively associated with such a shift in emphasis. Anincrease in firm size was positively associated with an increased emphasis on HR strategy, althoughcontrolling for firm size, more employees within the HR function was negatively associated with HRStrategy. Paradoxically, firms increasing their R&D intensity decreased their emphasis on HRStrategy over this period, while an increase in systematic risk (beta) was positively linked with theuse of HR strategy. An increase in HR policy consistency was positively associated with the use ofHR Strategy. Finally, firms where management is increasingly seen as “visionary” as well as thosefirms offering more employment security were also likely to increase their use of HR Strategy.
For the Performance Management (PM) variable, firms in increasingly munificentenvironments were more likely to adopt PM, while those increasing their HR staffs were less likely todo so. Firms shifting to PM paid significantly lower wages, while firms moving to a low costcompetitive strategy were significantly less likely to deploy PM.
For the Selection & Development (S&D) variable, increasing complexity in the externalenvironment was positively associated with the deployment of S&D, while a greater proportion ofexempt employees in the firm was less so. Consistent with the results for HR strategy, firmsincreasing their R&D intensity decreased their emphasis on HR Strategy over this period, while anincrease in systematic risk (beta) was positively linked with the use of HR strategy.
DISCUSSIONRecent empirical work has found the adoption of progressive or High Performance Work
Systems to have an economically and statistically significant impact on employee turnover,productivity, and corporate financial performance. Yet, substantial variation exists in the prevalenceof such systems across firms; a puzzle given such dramatic economic returns. In this paper weexamined factors hypothesized to facilitate and constrain the adoption of a HPWS. In 2,410 firmsacross diverse industries and three time periods, we found both organizational characteristics andexternal environmental contingencies to be associated with HPWS. Furthermore, both of thesecontingencies had considerably greater effects on the reward management (EM and PM)dimensions of a HPWS than on the dimensions capturing staffing development (ESOS and S&D), oron the extent of the linkage between HRM and business strategies.
With regard to the external environment, and consistent with our expectations, the resultssuggest that firms in more profitable (munificent) industries are more likely to adopt incentive andperformance management dimensions of a HPWS, while those firms in more volatile or dynamicindustries were less likely to do so. Interestingly, it is in a volatile or dynamic environment that firmswould most like to shift such risk on to employees through variable compensation systems, and

15
concurrently, it is in just such environments that variable compensation systems are the leastattractive to employees. Apparently, the latter’s preferences predominate the former’s. This linkagebetween external environmental factors and incentive compensation systems may have importantimplications for practitioners wishing to implement such systems, and is deserving of furtherconceptual and empirical research.
In general our hypotheses regarding the impact of internal, organizational factors on HPWSwere supported. In our cross-sectional results the percentage of exempt employees was positivelyassociated with the use of performance management and incentive compensation systems (EM andPM), consistent with the expectation that such systems are more prevalent among exempt workers. The negative association between the proportion of exempt employees and the staffing developmentdimensions, however, may in part reflect firm efforts to invest more heavily in training and skilldevelopment for their nonexempt employees. Whether this is out of necessity, in response to lowskill levels in the incoming workforce, or by choice (because the economic returns are relativelygreater for these employees) is for future work to explore. However, the finding that firms maystructure their HRM systems differently for exempt and nonexempt employees suggests the potentialfor differential returns for these practices across these categories of employees. While preliminary,this may suggest the need for more specific theoretical and empirical work that differentiatesbetween categories.
As a whole the degree of unionization was negatively associated with the adoption of aHPWS. This finding is consistent with much of the previous work on this topic. While it has beenargued that the negative union effects on employee productivity observed in the prior empirical workare exaggerated (Freeman and Medoff, 1984; Eaton & Voos, 1992) our results support the view thatunion bargaining objectives are in conflict with the types of organizational policies that have beenshown to improve employee productivity. This finding may reflect the fact that the practicesassociated with HPWS are generally inconsistent with the traditional limitations on managementimposed in the collective bargaining process. Indeed, union contracts traditionally place greateremphasis on member job security and control than labor performance and productivity. Our resultsmay provide illumination to prior work unionization had a negative effect on firm performance(Becker & Olson, 1987; 1992; Hirsch, 1991), suggesting that one of the ways unions affect firmperformance may be through their negative impact on the adoption of a HPWS.
The results for capital and labor intensity are more difficult to interpret. Capital intensityreflects the amount of property, plant, & equipment deployed per employee, while labor intensityindicates labor expenses as a share of total revenue. We found capital intensive firms to be morelikely to adopt staffing development dimensions, but less likely to adopt the reward managementdimensions, of a HPWS. The positive relationship we observed between capital intensity andESOS/S&D may simply reflect the greater “leverage” afforded such systems in capital intensivefirms, while the negative impact of capital intensity on EM/RM may suggest that individual rewardsystems are more appropriate in labor intensive (e.g., service) industries. It may also be that whilemore capital intensive firms receive greater returns from the use of a HPWS, less capital intensivefirms (holding labor intensity constant) have a greater need for a HPWS because the organization isrelatively more dependent on labor. Our measure of labor cost intensity is strongly negative acrossthe reward management models. Apparently, given a fixed level of capital intensity, firms with higherlabor costs invest less extensively in HPWS. While a HPWS may have greater payback potential forthese firms, it appears their greater relative costs discourage investments in them.
Both R&D intensity and systematic risk represent firm characteristics that in the former thefirm hopes to leverage, and in the latter it would prefer to mitigate. The results from this studysuggest that the most effective approach to these objectives may be through the firm’s rewardmanagement system (EM and PM). This is unsurprising given the importance of reward systems toR&D noted in previous research on strategic compensation (Balkin & Gomez-Mejia, 1984; Milkovich,Gerhart, & Hannon, 1991). Similarly, the finding with regard to firm risk is consistent with existingtheoretical and empirical work in the area of agency theory (e.g., Eisenhardt, 1989; Jensen &Murphy, 1990), in that firms exhibiting greater systematic risk are more likely to attempt to alignemployee and shareholder interests through the use of incentive compensation and performance

16
management systems. It is also unsurprising because, as we argue below, it may be considerablyeasier to manipulate reward systems than a firm’s skill base or work structure.
The results presented here are also consistent with earlier work suggesting that a costleadership competitive strategy does not require that the HRM system create value in the way that adifferentiation or focus strategy might. While there has been limited empirical support for a HRstrategy-firm strategy contingency in the firm performance relationship (Arthur, 1994; Huselid, 1995),these results are consistent with such a contingency. This linkage between HR and businessstrategies has been a central tenet in the strategic HRM literature, and the specific form andstructure of these relationships is an area deserving of further study. For example, while our resultsprovide some evidence of a HRM-business strategy linkage, they provide little insight into thespecific types of HRM policies and practices that are most effective for each strategy.
In addition to the individual hypothesis results, there is an unmistakable pattern showing thatexternal and internal influences have a greater impact on the reward management (EM and RM)dimensions than on other HPWS dimensions. Normally we might expect that this is due to lessvariability in the dependent variables, but in this case EM and RM have nearly twice the variationthan the ESOS/S&D dimensions, even considering that these dimensions reflect an average ofstandard scores. There are several possible explanations for this pattern of findings. The lowerexplained variance in staffing development dimension and HR Strategy suggest that firms expendmore energy in “customizing” these practices to their specific circumstances, and thereforeunobserved firm-specific or idiosyncratic variables not included in our analyses may account for ourfindings. Alternatively, it is perhaps the case that we are better able to explain the rewardmanagement dimensions of HPWS because of the prior empirical support for an incentivecompensation - corporate financial performance link (Gerhart & Milkovich, 1992), which maysuggest that greater attention is afforded such systems. If incorporating changes in thecompensation system has a large enough impact on the firm's bottom line, investments in otherHPWP may be overlooked or delayed. Moreover, parties external to the HR function (linemanagers, general managers, and consultants) are also more likely to be involved in itsdetermination. Additionally, as a practical matter, employee compensation systems are likely to beapplied broadly throughout the firm (i.e., affect all employees), while practices aimed at managingstaffing & development (e.g. a training program) might be targeted to a single group of people. Finally, the job search and signaling literature suggests that the organization's reward system maymake one of the strongest organizational statements with regard to policy and strategy (Rynes,1991). In consideration of these possibilities, it does not seem surprising that our strongestrelationships were found between independent variables and the reward management dimension ofHPWS. However, it is for future work to explore our conjectures in greater detail.
Limitations and ConclusionsOurs is the first study to match firm level data on HPWS with internal and external objective
data across three time periods and more than 2,400 firms. Thus, this study has a number ofstrengths relative to the prior empirical research on this topic. The large sample, multiple timerperiods, broad industry representation, mixture of survey and objective firm-level data, and extensivecontrol variables help to establish the plausibility of our results across a wide range of organizationalexperience. Moreover, the consistency of our results across a variety of alternative specificationssuggests to us that our findings are likely to be robust.
The primary limitation of this study is concerned with the measurement of HRM systems. Future work should be concerned with the development and validation of better instruments tomeasure HRM systems, with an explicit focus on the impact of measurement error on the results(Huselid & Becker, 1996a). Given the relatively low reliabilities of our HPWS dimensions we couldexpect the relationships found here to be attenuated. More specifically, while our panel regressionresults were generally consistent with our cross-sectional findings, the considerable variabilityexhibited in these results suggests that this is an area requiring additional conceptual and empiricalclarification.
In addition, although this study focused on the adoption of three distinct dimensions of an

17
organizational HPWS, the degree of “internal fit” among a firm’s HPWS, as well as the degree of“external fit” between a firm’s entire HRM systems and its competitive strategy are also important“dependent variables” in this line of research. Future work should focus on the development ofbetter measures of “fit”, as well as develop theoretical and empirical models of the antecedents ofthis construct.
These caveats notwithstanding, our results suggest that the use of an organizational HPWSis linked to a variety of firm and environmental contingencies. As we noted above, the firm-levelimpact of the existence of an organizational HPWS has been documented in a number of recentstudies. In addition, recent empirical work (Huselid, Jackson, & Schuler, 1995) has alsodemonstrated the importance of implementing such systems effectively. Within the context of theneed to both select an operationally appropriate HPWS and implement it effectively, this studyreinforces the importance of an understanding of the factors that facilitate and constrain the use ofHRM systems. Our point is that despite whatever attraction a HPWS may hold for practitioners, HRmanagers can be both constrained and facilitated in their attempts to adopt such systems by factorsin their internal and external environments. Thus managers must become increasingly aware ofthese factors if they hope to implement HPWS effectively. Firm financial performance is determinedby a myriad of factors, most of which are well beyond the control of the average manager. However,HRM systems enjoy both a large potential firm-level impact as well as a relatively low level ofgeneral competence within many firms. That is to say, the recent attention paid to HPWS suggeststo us that the markets for these practices may not yet be “efficient,” and that managers may enjoy asignificant opportunity to enhance their firm’s performance through workforce management systems. For example, in the short run there is very little that HR managers can do to change the firm’s levelof financial leverage (capital intensity), yet the amount of this type of risk adopted by the firm has asubstantial impact on the adoption of HRM systems. Recognition of such constraints should assistacademics in the development of theoretical models and empirical research that will assist HRmanagers to cope in such environments.
As the field of HRM matures into the role of a true “business partner,” the links betweenHRM systems and the firm’s broader strategic and environmental contingencies represents anincreasingly important field of inquiry. Future work should embrace this line of research with vigor.
18
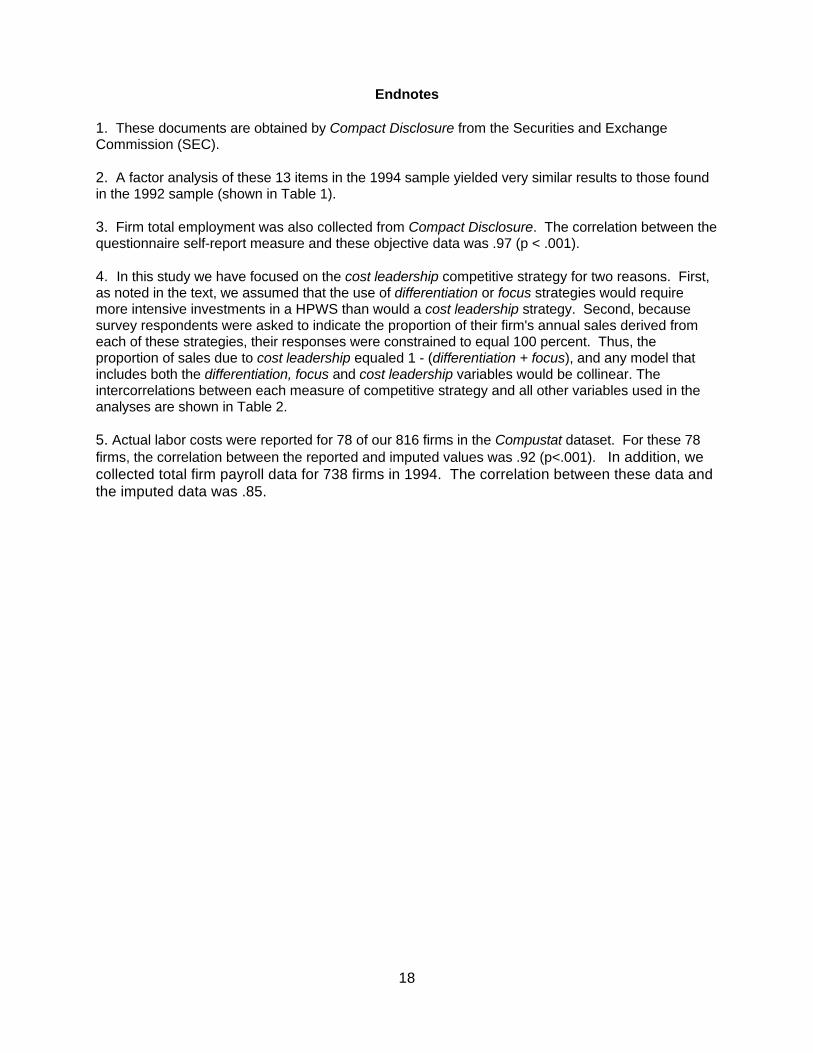
1. These documents are obtained by Compact Disclosure from the Securities and ExchangeCommission (SEC).
2. A factor analysis of these 13 items in the 1994 sample yielded very similar results to those foundin the 1992 sample (shown in Table 1).
3. Firm total employment was also collected from Compact Disclosure. The correlation between thequestionnaire self-report measure and these objective data was .97 (p < .001).
4. In this study we have focused on the cost leadership competitive strategy for two reasons. First,as noted in the text, we assumed that the use of differentiation or focus strategies would requiremore intensive investments in a HPWS than would a cost leadership strategy. Second, becausesurvey respondents were asked to indicate the proportion of their firm's annual sales derived fromeach of these strategies, their responses were constrained to equal 100 percent. Thus, theproportion of sales due to cost leadership equaled 1 - (differentiation + focus), and any model thatincludes both the differentiation, focus and cost leadership variables would be collinear. Theintercorrelations between each measure of competitive strategy and all other variables used in theanalyses are shown in Table 2.
5. Actual labor costs were reported for 78 of our 816 firms in the Compustat dataset. For these 78firms, the correlation between the reported and imputed values was .92 (p<.001). In addition, wecollected total firm payroll data for 738 firms in 1994. The correlation between these data andthe imputed data was .85.
Endnotes
19
References
Arthur, J.B. 1992. The link between business strategy and industrial relations systems in American steelminimills. Industrial and Labor Relations Review, 45: 488-506.
Arthur, J.B. 1994. Effects of human resource systems on manufacturing performance and turnover.Academy of Management Journal, 37: 670-687.
Bailey, T. 1993. Discretionary Effort and the Organization of Work: Employee Participation and WorkReform since Hawthorne. Working Paper, Columbia University.
Baird, L., & Meshoulam, I. 1988. Managing two fits of strategic human resource management. Academyof Management Review, 13: 116-128.
Balkin, D.B., & Gomez-Mejia, L.R. 1984. Determinants of R & D compensation strategies in the hightech industry. Personnel Psychology, 37: 635-650.
Becker, B.E., & Huselid, M.A. 1992. Direct estimates of SD and the implications for utility analysis.y
Journal of Applied Psychology, 77: 227-233.
Becker, B.E., & Olson, C.A. 1992. Unions and firm profits. Industrial Relations, 31: 395-415.
Becker, B.E., & Olson, C.A. 1989. Unionization and shareholder interests. Industrial and Labor RelationsReview, 42: 246-261.
Becker, B.E., & Olson, C.A. 1987. Labor relations and firm performance. In M.M. Kleiner, R.N. Block, M.Roomkin, & S.W. Salsburg (Eds.), Human Resources and the Performance of the Firm.Washington, DC: BNA Press.
Cappelli, P., & Sherer, P.D. 1991. The missing role of context in OB: The need for a meso-levelapproach. Research in Organizational Behavior, 13, 55-110.
Cappelli, P., & Singh, H. 1992. Integrating strategic human resources and strategic management. InLewin, D., Mitchell, O.S., & Sherer, P. (Eds.) Research Frontiers in Industrial Relations andHuman Resources. Industrial Relations Research Association; Madison, WI.
Clark, K.B. 1984. Unionization and firm performance: The impact on profits, growth, and productivity.The American Economic Review, December: 893-919.
Cutcher-Gershenfeld, J. 1991. The impact on economic performance of a transformation in industrialrelations. Industrial and Labor Relations Review, 44: 241-260.
Delaney, J.T. In Press. Unions, human resource innovations, and organizational outcomes. Advances inIndustrial and Labor Relations.
Delaney, J.T., & Huselid, M.A. 1996. The firm-level impact of high performance work practices infor-profit and nonprofit organizations. Academy of Management Journal, 39, 949-969.
Delaney, J.T., Lewin, D., & Ichniowski, C. 1989. Human Resource Policies and Practices in AmericanFirms. Washington, DC: U.S. Government Printing Office.
Dimick, D.E., & Murray, V.V. 1978. Correlates of substantive policy decisions in organizations: The caseof human resource management. Academy of Management Journal, 611-623.
Eaton, A.E., & Voos, P.B. 1992. Unions and contemporary innovations in work organization,compensation, and employee participation. In L. Mishel & P. Voos (Eds.), Unions and EconomicCompetitiveness. New York: M.E. Sharpe Inc.
20
Eisenhardt, K.M. 1989. Agency theory: An assessment and review. Academy of Management Review,14: 57-74.
Fiorito, J., Lowman, C., & Nelson, F.D. 1987. The impact of human resource policies on unionorganizing. Industrial Relations, 26:113-126.
Fombrun, C.J., Tichy, N.M, & DeVanna, M.A. 1984. Strategic Human Resource Management. Wiley:New York.
Freeman, R.B., & Medoff, J.L. 1984. What Do Unions do? New York: Basic Books.
Gerhart, B., & Milkovich, G.T. 1992. Employee compensation: Research and practice. In M.D. Dunnette& L.M. Hough (Eds.), Handbook of Industrial and Organizational Psychology, Volume III, 481-569. Palo Alto, CA: Consulting Psychologists Press.
Hamel, G., & Prahalad, C.K. 1994. Competing for the Future. Boston, MA: Harvard Business SchoolPress.
Hirsch, B.T. 1991. Labor Unions and the Economic Performance of Firms. Kalamazoo, MI: W.E. UpjohnInstitute for Employment Research.
Hunter, J.E., Schmidt, F.L., & Judiesch, M.K. 1990. Individual differences in output variability as afunction of job complexity. Journal of Applied Psychology, 75: 28-42.
Huselid, M.A. 1995. The impact of human resource management practices on turnover, productivity,and corporate financial performance. Academy of Management Journal, 38: 635-672.
Huselid, M.A. & Becker, B.E. 1996a. Methodological issues in cross-sectional and panel estimates ofthe HR-firm performance link. Industrial Relations, 35, 400-422.
Huselid, M.A. & Becker, B.E. 1996b. The Strategic Impact of High Performance Work Systems.Working paper, School of Management & Labor Relations, Rutgers University.
Huselid, M.A., Jackson, S.E., & Schuler, R.S. 1995. The Significance of Human Resource ManagementImplementation Effectiveness for Corporate Financial Performance. Working paper, School ofManagement & Labor Relations, Rutgers University.
Ichniowski, C., & Shaw, K. 1995. Old Dogs and New Tricks: Determinants of the Adoption ofProductivity-enhancing Work Practices. In Brooking Papers on Economic Activity:Microeconomics. Washington, DC: Brookings Institute.
Ichniowski, C., Shaw, K., & Prennushi, G. 1994. The Effects of Human Resource ManagementPractices on Productivity. Working Paper: Columbia University.
Jackson, S.E., & Schuler, R.S. 1995. Understanding human resource management in the context oforganizations and their environments. Annual Review of Psychology, 46: 237-264.
Jackson, S.E., Schuler, R.S., & Rivero, J.C. 1989. Organizational characteristics as predictors ofpersonnel practices. Personnel Psychology, 42: 727-786.
Jensen, M.C., & Murphy, K.J. 1990. Performance pay and top management incentives. Journal ofPolitical Economy, 98: 225-264.
Johns, G. 1993. Constraints on the adoption of psychology-based personnel practices: Lessons fromorganizational innovation. Personnel Psychology, 46, 569-592.

21
Kaufman, R.S., & Kaufman, R.T. 1987. Union effects on productivity, personnel practices, and survivalin the auto parts industry. Journal of Labor Research, 8: 333-350.
Keats, B.W., & Hitt, M.A. 1988. A causal model of linkages among environmental dimensions, macroorganizational characteristics, and performance. Academy of Management Journal. 31: 570-598.
Kochan, T.A., McKersie, R.B., & Chalykoff, J. 1986. The effects of corporate strategy and workplaceinnovations on union innovations. Industrial and Labor Relations Review, 39: 487-501.
MacDuffie, J.P. 1995. Human resource bundles and manufacturing performance: Organizational logicand flexible production systems in the world auto industry. Industrial and Labor RelationsReview, 48: 197-221.
Milkovich, G.T., Gerhart, B., & Hannon, J. 1991. The effects of research and development intensity onmanagerial compensation in large organizations. Journal of High Technology ManagementResearch, 2: 133.
Milgrom, P., & Roberts, J. 1995. Complementarities and fit: Strategy, structure, and organizationalchange in manufacturing. Journal of Accounting and Economics, 19: 179-208.
Osterman, P. 1994. How common is workplace transformation and how can we explain who adopts it?:Results from a national survey. Industrial and Labor Relations Review, 47: 173-188.
Pfeffer, J. 1994. Competitive Advantage Through People. Boston: Harvard Business School Press.
Pil, F.K., & MacDuffie, J.P. 1996. The adoption of high-involvement work practices. IndustrialRelations, 35, 423-455.
Porter, M.E. 1985. Competitive Advantage: Creating and Sustaining Superior Performance. New York:The Free Press.
Rynes, S. L. 1991. Recruitment, job choice, and post-hire consequences: A call for new researchdirections. In M. Dunnette & L. Hough (eds.), Handbook of industrial and organizationalpsychology (Vol. 2, pp. 399-444). Palo Alto, CA: Consulting Psychologists Press.
Schuler, R.S., & Jackson, S.E. 1987. Linking competitive strategies with human resource managementpractices. The Academy of Management EXECUTIVE, 1: 207-219.
Schuler, R.S., & Jackson, S.E. 1989. Determinants of human resource management priorities andimplications for industrial relations. Journal of Management, 15: 89-99.
Snell, S.A. 1992. Control theory in strategic human resource management: The mediating effect ofadministrative information. Academy of Management Journal, 35, 292-327.
Ulrich, D. 1996. Human Resource Champions. Harvard Business School Press: Boston.
U.S. Department of Labor. 1993. High Performance Work Practices and Firm Performance.Washington, DC: U.S. Government Printing Office.
Wright, P.M., & McMahan, G.C. 1992. Theoretical perspectives for strategic human resourcemanagement. Journal of Management, 18, 295-320.
Youndt, M.A., Snell, S.A., Dean, J.E., & Lepak, D.P. 1996. Human resource management,manufacturing strategy, and firm performance. Academy of Management Journal, 39, 836-866.

22
Table 1a
Questionnaire Items and Factor Structure for HR Strategy Measures - 1992 Sample
Questionnaire Item Factor 1 Factor 2
Employee Skills and Organizational Structures Alpha=.67
What is the proportion of the workforce who are included in a formalinformation sharing program (e.g. a newsletter)?
What is the proportion of the workforce whose job has been subjected toa formal job analysis?
What proportion of non-entry level jobs have been filled from within inrecent years?
What is the proportion of the workforce who are administered attitudesurveys on a regular basis?
What is the proportion of the workforce who participate in Quality ofWork Life (QWL), Quality Circles (QC), and/or labor managementparticipation teams?
What is the proportion of the workforce who have access to companyincentive plans, profit-sharing plans, and/or gain-sharing plans ?
What is the average number of hours of training received by a typicalemployee over the last 12 months?
What is the proportion of the workforce who have access to a formalgrievance procedure and/or complaint resolution system?
What proportion of the workforce is administered an employment testprior to hiring?
.54
.53
.52
.52
.50
.39
.37
.36
.32
.02
.18
-.36
-.07
-.04
.17
-.07
.13
-.04
Employee Motivation Alpha=.66
What is the proportion of the workforce whose performance appraisalsare used to determine their compensation ?
What proportion of the workforce receives formal performance appraisals?
Which of the following promotion decision rules do you use mostoften? (a) merit or performance rating alone; (b) seniority only if merit isequal; ( c) seniority among employees who meet a minimum meritrequirement; (d) seniority. Reverse scored.
For the five positions that your firm hires most frequently , how manyqualified applicants do you have per position (on average)?
.17
.29
-.07
-.15
.83
.80
.56
.27
Eigenvalue 2.19 1.76Proportion of variance accounted for 16.80 13.60
n = 826. From Huselid (1995). Bold indicates the item loaded unambiguously at .30 or greater on a single factor. a

23
Table 2a
Questionnaire Items and Factor Structure for the 1994 HR Strategy Measures
Questionnaire Item Factor Factor Factor1 2 3
HR Strategy Alpha = .75To what degree is the HR department involved in your firm’s strategic planningprocess?
To what degree do you align business and HR strategies?
To what degree does your firm have a clear strategic mission that is wellcommunicated and understood at every level throughout the firm?
How many hours of training per year are typically received by an experiencedemployee (i.e., someone employed more than one year)?
What proportion of the workforce has access to a formal grievance procedureand/or complaint resolution system?
What proportion of your training efforts are devoted to skill enhancement?
.85 .14 -.03
.83 .18 -.01
.71 .02 .02
.37 .14 .21
.22 -.09 .17
.09 -.02 .04
Performance Management Alpha = .75What proportion of the workforce has their merit increase or other incentive paydetermined by a performance appraisal?
What proportion of the workforce receives formal performance appraisals?
What proportion of the workforce is promoted based primarily on merit (asopposed to seniority)?
What proportional change in total compensation could a low performernormally expect as a result of a performance review?
.09 .78 -.12
.09 .66 -.01
.11 .47 -.09
-.04 .25 .10
Selection & Development Alpha = .47What proportion of the workforce is eligible for cash bonuses based onindividual performance or company-wide productivity or profitability?
What proportion of non-entry level jobs have been filled from within in recent(i.e., over the past five) years?
If profits were to increase (decrease) by 50% below their average level, by whatproportion would the bonus pool be increased (decreased)? (items reflects themean of the responses to these two items).
What proportion of the workforce is regularly administered attitude surveys?
What proportion of the workforce is administered an aptitude, skill, or work-sample test prior to employment?
If the market rate for total compensation (Base + Bonus + Benefits) is consideredto be the 50th percentile, what is your firm’s target percentile for totalcompensation?
What proportion of the workforce has any part of their compensation determinedby a skill-based compensation plan?
.00 .45 .61
.06 -.26 .57
-.01 .44 .55
.21 .02 .51
.05 -.31 .39
.07 .00 .36
-.06 -.07 .07
EigenvalueProportion of variance accounted for
2.63 1.70 1.4115.50 10.0 8.30
n = 632. Bold type indicates that the associated question loads unambiguously on a single factor. a

24
Table 3Means, Standard Deviations, and Intercorrelations for 1992 Variablesa
Variables Mean S.D. 1 2 3 4 5 6 7 8 9 10 11 12 13 14 15 16 17
1. Employee Skills & Org. Struct. .01 .53 2. Employee Motivation -.04 .95 19 3. Complexity .39 .17 -12 -19 4. Dynamism 1.09 .05 -11 -29 58 5. Munificence 1.10 .06 -02 05 04 20 6. Manufacturing/Service .47 .50 00 -06 23 05 -38 7. Ln of Total Employment 6.88 1.62 14 -13 16 22 11 03 8. Ln of HR Employment 2.37 1.22 24 -05 -01 05 -01 03 71 9. Proportion Exempt Employees .37 .20 -01 21 -16 -13 -10 08 -17 0010. Union Coverage 12.28 24.96 -06 -39 01 15 -07 05 21 17 -1911. Ln of PP&E 10.54 2.11 16 -19 02 21 10 -06 75 65 -06 3312. Labor Cost Intensity .74 .74 -09 -08 22 11 11 00 14 -08 -22 -09 -1713. R&D/Sales .02 .06 -01 15 02 -10 -08 21 -13 -08 32 -14 -09 -0314. Systematic Risk (Beta) 1.06 .33 03 15 18 02 -04 16 06 05 07 -20 -11 08 1015. Cost Leadership 22.35 22.20 -08 -18 05 11 -02 -02 04 01 -14 15 13 -05 -10 -0616. Differentiation 37.32 23.11 04 13 02 -03 -01 13 -02 -02 18 -09 -11 14 21 08 -4817. Focus 40.33 23.04 04 04 -07 -08 03 -11 -01 01 -05 -06 -01 -09 -11 -03 -48 -5418. HR Policy Consistency 4.51 1.10 11 22 -13 -18 -02 -13 -11 -06 -02 -12 -11 -03 04 -03 -04 -02 06
n = 815. All correlations >= .05 are significant at the .05 level, those >= .07 are significant at the .01 level, and those >= .10 are significant at the .001 level (one-tail test). a

25
Table 4Means, Standard Deviations, and Intercorrelations for 1994 Variablesa
Variables Mean S.D. 1 2 3 4 5 6 7 8 9 10 11 12 13 14 15 16 17 18 19 20 21 22 23
1. Emp. Skills/Org.Struct. .00 .54 2. Employee Motivation .00 .87 16 3. HR Strategy .00 1.00 39 11 4. Performance Mgmt. .00 .99 19 89 12 5. Selection & Development .00 1.00 47 -07 17 -03 6. Complexity .40 .17 -02 -07 -04 -06 -08 7. Dynamism 1.07 .04 -04 -11 -04 -11 00 74 8. Munificence 1.08 .06 -07 13 -01 09 -06 -02 17 9. Manufacturing/Service .43 .50 10 -13 01 -15 -08 07 -07 -2410. Ln of total employment 6.78 1.53 20 -13 18 -11 22 09 15 07 0011. Ln of HR employment 2.59 1.30 25 -07 18 -11 26 04 08 03 02 6612. % Exempt Emps. .39 .23 -06 20 01 17 -15 -14 -13 19 -03 -24 -0113. Union Coverage 10.28 22.53 -02 -40 -07 -43 17 -07 03 -03 08 26 21 -2014. Ln of PP&E 10.50 2.11 19 -20 14 -16 27 03 10 01 -04 72 56 -16 3615. Labor Cost Intensity .72 .73 -12 03 03 -01 -14 13 11 08 -07 08 -03 -13 -13 -1816. R&D/Sales .03 .06 00 13 01 13 -12 -12 -13 09 18 -11 -04 38 -13 -14 0117. Systematic Risk (Beta) 1.08 .21 01 10 -02 10 -03 13 06 -02 14 -09 -05 09 -22 -18 04 0818. Cost Leadership 28.69 25.32 03 -24 03 -21 15 -10 -09 -04 03 19 13 -18 26 30 -09 -07 -1419. Differentiation 35.75 25.71 01 19 06 16 -13 12 08 07 08 -07 -05 23 -17 -18 11 13 14 -5320. Focus 34.83 24.36 -05 04 -10 05 -03 00 02 -06 -10 -13 -10 -05 -10 -16 -01 -05 01 -45 -4721. HR Policy Consistency 4.52 .68 02 05 03 05 -03 -04 -03 -01 -08 -07 -08 01 -07 -08 -01 02 -06 00 030 -0322. Managerial “Vision” 3.08 1.17 23 01 43 03 14 -01 -05 02 -01 10 07 -03 -05 09 -01 01 -03 01 307 -05 -0123. Managerial “Motivation” 3.07 1.10 22 04 50 04 09 07 02 -03 03 12 10 -02 -06 07 05 -01 -02 01 05 -08 -02 50224. Employment Security 4.35 1.18 09 04 20 04 03 05 08 -01 02 04 -05 -09 -10 00 01 -07 -05 -04 00 06 4 24
n = 726. All correlations >= .05 are significant at the .05 level, those >= .07 are significant at the .01 level, and those >= .10 are significant at the .001 level (one-tail test). a

26
Table 5Means, Standard Deviations, and Intercorrelations for 1996 Variablesa
Variables Mean S.D. 1 2 3 4 5 6 7 8 9 10 11 12 13 14 15 16 17 18 19 20 21 22 23
1. Emp. Skills/Org.Struct. .01 .55 2. Employee Motivation .00 .92 11 3. HR Strategy .00 1.00 43 13 4. Performance Mgmt. .00 1.00 12 91 14 5. Selection & Development .00 1.00 50 -01 28 03 6. Complexity .46 .18 -14 00 -10 02 -14 7. Dynamism 1.07 .03 -13 -12 -09 -10 -09 63 8. Munificence 1.06 .03 -06 08 -06 08 -04 09 -19 9. Manufacturing/Service .47 .50 -02 -04 00 -08 -07 11 -11 1710. Ln of total employment 6.69 1.88 19 -14 21 -12 24 03 12 -02 -0811. Ln of HR employment 2.65 1.32 12 -12 13 -14 17 -15 -03 01 -05 4712. % Exempt Emps. .42 .23 -01 22 -04 23 -08 -11 -17 12 01 -31 -0813. Union Coverage 11.98 24.83 06 -41 00 -45 22 -14 00 -07 02 24 17 -2614. Ln of PP&E 10.59 2.11 20 -20 17 -20 34 -06 05 -09 -12 59 47 -20 3715. Labor Cost Intensity .67 .80 -08 -04 03 -04 -10 19 26 05 -05 19 00 -20 -08 -1716. R&D/Sales .03 .09 -01 09 01 09 -08 00 -10 12 19 -19 -09 32 -10 -15 1217. Systematic Risk (Beta) .79 .33 05 12 08 12 03 06 03 -01 09 13 07 13 -11 06 -01 1118. Cost Leadership 29.27 25.53 01 -19 -09 -20 07 -04 -02 03 01 13 09 -16 22 23 -06 -13 -1319. Differentiation 39.83 25.56 03 11 14 12 -05 06 -01 02 10 -05 -03 12 -17 -15 08 16 13 -6320. Focus 31.25 21.62 -05 08 -05 08 -03 -02 04 -07 -12 -10 -05 04 -07 -10 -03 -04 00 -40 -4121. HR Policy Consistency 4.40 1.08 13 10 17 13 05 00 -03 00 -06 -07 -07 -05 -05 -07 -06 -06 03 -03 030 -0122. Managerial “Vision” 4.11 1.32 21 08 53 07 11 -10 -05 -07 -03 11 09 -05 -04 09 03 -04 00 -02 611 -04 16123. Managerial “Motivation” 3.90 1.24 23 10 61 11 13 -02 -01 -04 00 10 07 -06 -04 05 05 -05 02 -07 08 -04 719 67224. Employment Security 3.65 1.40 21 05 33 09 15 -10 -09 -07 -01 -06 -08 -04 -01 -01 00 03 -03 -09 01 8 30
n = 688. All correlations >= .05 are significant at the .05 level, those >= .07 are significant at the .01 level, and those >= .10 are significant at the .001 level (one-tail test). a

27
Table 6OLS Regression Analysis for the Common 1992, 1994, & 1996 Dependent Variables
(Standard Errors in Parentheses)
Independent Variables
Dependent Variables
1 2 3 4 5 6
1992 1994 1996 1992 1994 1996Emp. Skills & Emp. Skills & Emp. Skills & Employee Employee Employee
Org. Structures Org. Structures Org. Structures Motivation Motivation Motivation
Constant 0.437 1.073 2.198* 2.094*** 4.303*** 1.886
External Environment Complexity
Dynamism
Munificence
Manufacturing/Service (1 if Manufacturing)
Internal Environment ln of Total Employment
ln of HR employment
Management proportion of the labor force Unionization
ln of PP&E
Labor Cost Intensity
Research and Development Intensity
Systematic Risk (Beta)
Relative Emphasis on Cost Leadership
HR Policy Consistency
(0.625) (0.860) (1.251) (1.006) (1.309) (1.962)
-0.201* -0.016 -0.148 -0.234 0.329 0.098 (0.143) (0.176) (0.157) (0.230) (0.268) (0.246)
-0.633 -1.491* -1.828* -3.614*** -5.826*** -2.778*(0.521) (0.889) (0.864) (0.839) (1.354) (1.355)
-0.095 -0.183 -1.051* 1.397** 1.790*** 0.971(0.369) (0.358) (0.638) (0.593) (0.545) (1.001)
0.032 0.114*** 0.020 -0.059 -0.175*** -0.125*(0.042) (0.042) (0.044) (0.067) (0.064) (0.069)
-0.019 0.028 0.053*** 0.036 0.043 † 0.030(0.023) (0.022) (0.016) (0.040) (0.034) (0.025)
0.109*** 0.081*** -0.001 0.045 0.033 -0.023(0.025) (0.020) (0.020) (0.040) (0.030) (0.031)
-0.19485* -0.190* -0.080 0.336* 0.152 0.294* (0.099) (0.100) (0.105) (0.159) (0.152) (0.165)
-0.003* -0.003* -0.001 -0.011*** -0.012*** -0.013***(0.001) (0.001) (0.001) (0.001) (0.001) (0.001)
0.021 † 0.016 0.025* -0.061** -0.040* -0.029 †(0.016) (0.015) (0.014) (0.025) (0.023) (0.023)
-0.038 † -0.094*** -0.031 -0.135*** -0.044 -0.074*(0.029) (0.030) (0.030) (0.047) (0.046) (0.048)
-0.112 0.053 0.184 0.937* 0.627 0.285(0.317) (0.341) (0.261) (0.509) (0.518) (0.410)
0.041 0.001 0.025 0.240* 0.087 0.175*(0.059) (0.099) (0.063) (0.094) (0.151) (0.099)
-0.002** -0.001 -0.001 -0.003* -0.005*** -0.003*(0.001) (0.001) (0.001) (0.001) (0.001) (0.001)
0.049*** 0.066*** 0.068*** 0.130*** 0.023 0.058*(0.017) (0.017) (0.019) (0.027) (0.026) (0.030)
Sample size 787 695 673 787 695 673
R 0.117 0.138 0.097 0.293 0.242 0.2192
F 7.282*** 7.795*** 2.279** 22.869*** 15.549*** 13.143***
† p < .10; * p < .05 ** p < .01; *** p < .001. All significance levels reflect one-tail tests.

28
Table 7 - OLS Regression Analysis for the 1994 & 1996 Dependent Variables
Independent Variables
7 8 9 10 11 12
1994 1996 ‘94 Performance ‘96 Performance ‘94 Selection ‘96 Selection &HR Strategy HR Strategy Management Management & Developmnt Development
Constant -5.931* -0.120 10.822*** 2.400 -2.565 -0.474
External Environment Complexity
Dynamism
Munificence
Manufacturing/Service (1 if Manufacturing)
Internal Environment Ln of Total Emp.
Ln of HR Emp.
Management % of the labor force
Unionization
Ln of PP&E
Labor Cost Intensity
R&D Intensity
Systematic Risk (Beta)
Relative Emphasis on Cost Leadership
HR policy consistency
Managerial “vision”
Managerial “motivation”
Degree of Employment Security
(3.353) (4.567) (3.260) (4.837) (3.491) (4.756) -0.977 † -0.263 0.822 0.541 -1.842** -0.659(0.685) (0.572) (0.666) (0.606) (0.713) (0.596)
-0.529 -5.675* -14.064*** -6.477* 3.331 -4.168(3.472) (3.135) (3.376) (3.320) (3.615) (3.265)
-0.719 -2.514 3.030* 3.187 † -2.619* 0.321(1.389) (2.321) (1.351) (2.458) (1.446) (2.417)
0.125 0.125 -0.579*** -0.502*** -0.351* -0.081(0.164) (0.159) (0.159) (0.169) (0.171) (0.166)
0.130 † 0.180*** 0.208** 0.126* -0.027 0.095 †(0.087) (0.058) (0.085) (0.061) (0.091) (0.060)
0.161* 0.045 -0.082 -0.140* 0.326*** 0.019(0.078) (0.072) (0.076) (0.076) (0.081) (0.075)
0.456 0.227 0.267 0.928* -1.155*** 0.163 (0.387) (0.382) (0.376) (0.404) (0.403) (0.398)
-0.007* -0.001 -0.034*** -0.036*** 0.005 † 0.010**(0.004) (0.003) (0.004) (0.004) (0.004) (0.004)
0.042 0.106* -0.044 -0.075 † 0.092 † 0.255***(0.059) (0.052) (0.058) (0.056) (0.062) (0.055)
0.051 0.035 -0.267** -0.250* -0.356** -0.091(0.117) (0.110) (0.114) (0.117) (0.122) (0.115)
-0.308 1.413 † 2.563* 0.728 -1.355 -0.440(1.323) (0.950) (1.287) (1.006) (1.378) (0.989)
-0.118 0.231 0.283 0.422 † 0.551 † 0.129(0.386) (0.230) (0.375) (0.243) (0.402) (0.239)
0.000 -0.008** -0.011*** -0.007* 0.004 † -0.001(0.003) (0.003) (0.003) (0.003) (0.003) (0.003)
0.370*** 0.160* 0.103 † 0.146* 0.047 0.063(0.068) (0.072) (0.066) (0.076) (0.071) (0.075)
0.444*** 0.348*** -0.021 -0.008 0.222** -0.033(0.075) (0.078) (0.073) (0.082) (0.078) (0.081)
0.766*** 0.854*** 0.040 0.160* 0.055 0.153*(0.079) (0.082) (0.077) (0.087) (0.082) (0.085)
0.108 † 0.251*** -0.003 0.073 -0.006 0.174**(0.068) (0.057) (0.066) (0.061) (0.070) (0.060)
Sample size 685 673 685 673 685 673 R 0.368 0.467 0.263 0.277 0.168 0.1812
F 23.142*** 33.692*** 14.203*** 14.754*** 8.013*** 8.537***† p
< .10; * p < .05 ** p < .01; *** p < .001. All significance levels reflect one-tail tests.
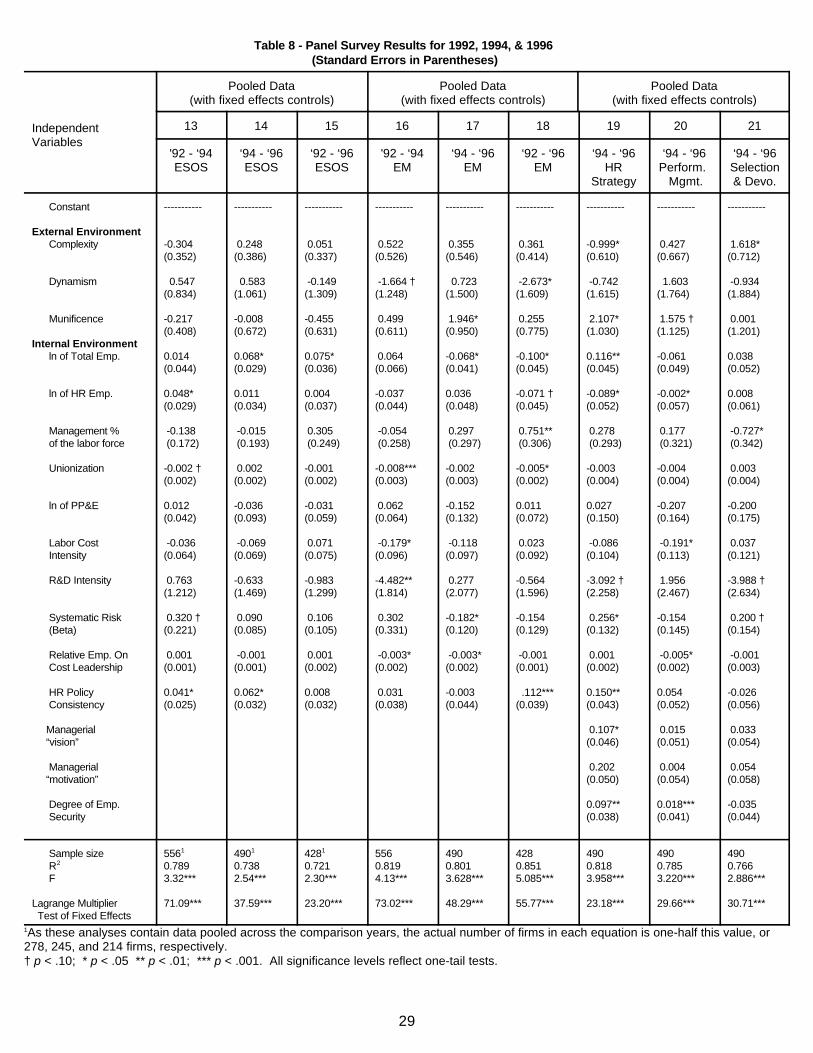
29
Table 8 - Panel Survey Results for 1992, 1994, & 1996(Standard Errors in Parentheses)
IndependentVariables
Pooled Data Pooled Data Pooled Data(with fixed effects controls) (with fixed effects controls) (with fixed effects controls)
13 14 15 16 17 18 19 20 21
'92 - ‘94 ‘94 - ‘96 ‘92 - ‘96 '92 - ‘94 ‘94 - ‘96 ‘92 - ‘96 ‘94 - ‘96 ‘94 - ‘96 ‘94 - ‘96ESOS ESOS ESOS EM EM EM HR Perform. Selection
Strategy Mgmt. & Devo.
Constant ----------- ----------- ----------- ----------- ----------- ----------- ----------- ----------- -----------
External Environment Complexity -0.304 0.248 0.051 0.522 0.355 0.361 -0.999* 0.427 1.618*
Dynamism 0.547 0.583 -0.149 -1.664 † 0.723 -2.673* -0.742 1.603 -0.934
Munificence -0.217 -0.008 -0.455 0.499 1.946* 0.255 2.107* 1.575 † 0.001
Internal Environment ln of Total Emp. 0.014 0.068* 0.075* 0.064 -0.068* -0.100* 0.116** -0.061 0.038
ln of HR Emp. 0.048* 0.011 0.004 -0.037 0.036 -0.071 † -0.089* -0.002* 0.008
Management % -0.138 -0.015 0.305 -0.054 0.297 0.751** 0.278 0.177 -0.727* of the labor force (0.172) (0.193) (0.249) (0.258) (0.297) (0.306) (0.293) (0.321) (0.342) Unionization -0.002 † 0.002 -0.001 -0.008*** -0.002 -0.005* -0.003 -0.004 0.003
ln of PP&E 0.012 -0.036 -0.031 0.062 -0.152 0.011 0.027 -0.207 -0.200 (0.042) (0.093) (0.059) (0.064) (0.132) (0.072) (0.150) (0.164) (0.175)
Labor Cost -0.036 -0.069 0.071 -0.179* -0.118 0.023 -0.086 -0.191* 0.037 Intensity (0.064) (0.069) (0.075) (0.096) (0.097) (0.092) (0.104) (0.113) (0.121) R&D Intensity 0.763 -0.633 -0.983 -4.482** 0.277 -0.564 -3.092 † 1.956 -3.988 †
Systematic Risk 0.320 † 0.090 0.106 0.302 -0.182* -0.154 0.256* -0.154 0.200 † (Beta) (0.221) (0.085) (0.105) (0.331) (0.120) (0.129) (0.132) (0.145) (0.154)
Relative Emp. On 0.001 -0.001 0.001 -0.003* -0.003* -0.001 0.001 -0.005* -0.001 Cost Leadership (0.001) (0.001) (0.002) (0.002) (0.002) (0.001) (0.002) (0.002) (0.003)
HR Policy 0.041* 0.062* 0.008 0.031 -0.003 .112*** 0.150** 0.054 -0.026 Consistency (0.025) (0.032) (0.032) (0.038) (0.044) (0.039) (0.043) (0.052) (0.056) Managerial 0.107* 0.015 0.033 “vision” (0.046) (0.051) (0.054)
Managerial 0.202 0.004 0.054 “motivation” (0.050) (0.054) (0.058)
Degree of Emp. 0.097** 0.018*** -0.035 Security (0.038) (0.041) (0.044)
(0.352) (0.386) (0.337) (0.526) (0.546) (0.414) (0.610) (0.667) (0.712)
(0.834) (1.061) (1.309) (1.248) (1.500) (1.609) (1.615) (1.764) (1.884)
(0.408) (0.672) (0.631) (0.611) (0.950) (0.775) (1.030) (1.125) (1.201)
(0.044) (0.029) (0.036) (0.066) (0.041) (0.045) (0.045) (0.049) (0.052)
(0.029) (0.034) (0.037) (0.044) (0.048) (0.045) (0.052) (0.057) (0.061)
(0.002) (0.002) (0.002) (0.003) (0.003) (0.002) (0.004) (0.004) (0.004)
(1.212) (1.469) (1.299) (1.814) (2.077) (1.596) (2.258) (2.467) (2.634)
Sample size 556 490 428 556 490 428 490 490 490 R 0.789 0.738 0.721 0.819 0.801 0.851 0.818 0.785 0.7662
F 3.32*** 2.54*** 2.30*** 4.13*** 3.628*** 5.085*** 3.958*** 3.220*** 2.886***
Lagrange Multiplier 71.09*** 37.59*** 23.20*** 73.02*** 48.29*** 55.77*** 23.18*** 29.66*** 30.71*** Test of Fixed Effects
1 1 1
As these analyses contain data pooled across the comparison years, the actual number of firms in each equation is one-half this value, or1
278, 245, and 214 firms, respectively. † p < .10; * p < .05 ** p < .01; *** p < .001. All significance levels reflect one-tail tests.