the development process research of wireless bridge vibration
TRANSCRIPT

Abstract—This research focuses on the study of the
developing process of wireless sensor network (WSN) monitoring system. In addition, problems confronted during the developing process are also reviewed and solved. In the WSN platform development, Supernode and accelerometers are used to collect the acceleration data and examine the safety of bridges. A global-position-system (GPS) chip is also used to obtain high-precision time information to promote the accuracy of the examination. Moreover, IEEE 802.15.4 was chosen for the communication protocol in the WSN platform as it complies with the demand of low cost and low power consumption.
For the experiment requirement and the stability of the WSN system, this research has undergone 3 versions of modification. Moreover, this system is employed to monitor the vibration of Chung-Sha Bridge in Taiwan for the field- implementation experiment.
Index Terms—Wireless sensor network, bridge monitoring,
Supernode, IEEE 802.15.4
I. INTRODUCTION Recently the wireless transmission techniques have been
developed vigorously. To monitor the structure stably, by comparison, the pipeline planning is unnecessary; only the stableness of establishing network collecting data and power supply are necessary to be considered. Therefore our goal is to introduce the wireless transmission techniques into civil engineering monitor system, replace the old wired sensor techniques, hoping to develop a wireless monitor system to achieve the purpose of low cost, short installing time and convenient relocation.
In this research, accelerometer is chosen as the sensor to measure the vibrating frequency of the bridge in order to calculate the scouring depth of bridge piers, the using the scouring depth of bridge piers to evaluate the health level of the bridge and the stableness during extreme weather.
We hope to develop a low cost wireless sensor system that can be generally applied to structures in the future. This study would describe the developing process of the wireless monitoring system in detail and the obstacles confronted to how to improve the system, hoping to provide useful information to reader who intends to apply wireless sensor network in the future.
Manuscript received February 7, 2013; revised May 29, 2013. Hui-Ping Tserng, Jen-Yu Han, Shi-Ming Wang, and Shu-yi Lee are with
the Department of Civil Engineering of National Taiwan University, Taiwan (Email: [email protected]; [email protected]; [email protected]; [email protected]).
Chih-Ting Lin and Chia-Hao Hsu are with the Department of Electrical Engineering of National Taiwan University, Taiwan (Email: timlin@ ntu.edu.tw; [email protected]).
II. LITERATURE REVIEW
A. Origin and Application of Wireless Sensor Network Wireless Sensor Network, which is also called WSN, is
formed by a bunch of sensor nodes. Via wireless network, data was transmitted between nodes. Nodes usually have sensor unit, process unit, communicate unit and power supply unit according to demand, therefore human operation is unnecessary during the process of data transmission.
Wireless Sensor Network is normally arranged in the environment by a large amount of sensor nodes. Data is transmitted to the computer, user or database through a gateway, as shown in the Fig. 1. The feature of WSN is that it’s low-cost and energy saving; also it’s easy to be arranged in the environment.
Fig. 1. Data transmission from nodes through coordinator to PC
WSN can be divided into the hardware part and the
software part. The hardware part includes sensor, microprocessor, wireless transmission chip (RF) and power supply device, etc. The software part includes the selected communication protocol, operating system of the sensor and the code set of network transmission, etc. In next section, the selected communication protocol IEEE 802.15.4 will be introduced in detail.
B. Communication Protocol IEEE 802.15.4 The communication protocol selected in this research is
IEEE 802.15.4. It is a standard designed for short-distance and low power system. It utilizes 2.4GHz band as its wireless transceiving frequency. And it has 250kps data transmission rate [1],[2]. Since IEEE 802.15.4 supports the communication with different topologies, it is widely used to support the communication between wireless sensors nodes. It should be noted that the long-distance communication is achieved by multi-hop capability of IEEE 802.15.4. Utilizing this wireless communication protocol, these sensor nodes can be formed a sensor network system for different applications. In this system, in brief, it contains end device (sensor), router
The Development Process Research of Wireless Bridge Vibration Monitoring
Hui-Ping Tserng, Chih-Ting Lin, Jen-Yu Han, Shi-Ming Wang, Chia-Hao Hsu, and Shu-Yi Lee
IACSIT International Journal of Engineering and Technology, Vol. 5, No. 4, August 2013
508DOI: 10.7763/IJET.2013.V5.607
and gateway (also called coordinator)[1]. The coordinator is in charge of establishing the whole
network; it establishes an independent ID for routers and end devices to access. In addition, the coordinator can connect to a computer for data processes and storages. This also offers users to remote monitor all the activities of the sensor network system. For the router in WSN system, it plays the role as information relay station. It allows other routers or end devices to join the system via its connection. And end device is the sensing element for the entire system. It needs to collect and transmit the data. Based on requirements of the system performance, an end device should consume less power and memory compared with other two components, e.g. coordinator and router.
Beside IEEE 802.15.4, there are other two candidates, Wi-Fi (IEEE 802.11b) and Bluetooth [5], [6], for this WSN bridge monitoring system. The comparison table can be shown in Table I. Although both IEEE 802.11b and Bluetooth have the advantage of high data-rate and long transmission distance, it only supports the star topologies in wireless communications. In the application scenario in bridge vibration monitoring, the system needs different network topologies to fulfill the complexity in the field. Therefore, IEEE 802.15.4 is superior to IEEE 802.11b at this work.
TABLE I: THE COMPARISON OF COMMUNICATION PROTOCOLS [7], [8]
IEEE 802.11.b 802.15.1 802.15.4
Name Wi-Fi Bluetooth
Frequency 2.4GHz 24.GHz 2.4GHz
Transmission Rate 11Mbps 1Mbps 250kbpsTransmission
Distance in Free Space
300m 100m 70-100m
Actual Transmission Distance @Electric
Power
100m@100mW
100m@100mW [email protected]
10m@1mW
Network Capacity 32 nodes 7 nodes 65536 nodes
Battery Life Several hours Several days Several years
III. THE STRUCTURE OF WSN SENSOR NETWORK MONITORING SYSTEM
This research focuses on developing a WSN system that adopts accelerometer to monitor, which is usually applied to structures such as bridges. However, for the bridges with longer span, the transmission distance of WSN is not long enough. And how to transmit data to the remote database will be another challenge, too. Therefore in this research, Chung-Sha Bridge was chosen as the subjects. With the collocation of other hardware devices, the data collected by the WSN system should be completely transmitted to the database in Taipei.
They are set respectively on the top of three piers. However to make the data more reliable, a node was added to be set on the lower structure. (As shown in the Fig. 2) The on-site WSN system adopts the star network topology, which is the simpler transmission pattern. The hardware structure under the test includes 4 nodes and 1 coordinator.
Fig. 2. WSN system on site- the star network topology
Fig. 3 is the schematic diagram of the on-site WSN system
in this research. We established WSN’s own local area network on the bridge, then the collected data signal would be transmitted to a control center that is 2 kilometers away from the bridge in the form of Wi-Fi 5G.
圖
Wi-Fi 5G
Houses the control center
W S Nsystem
2 km
Fig. 3. Schematic diagram of system
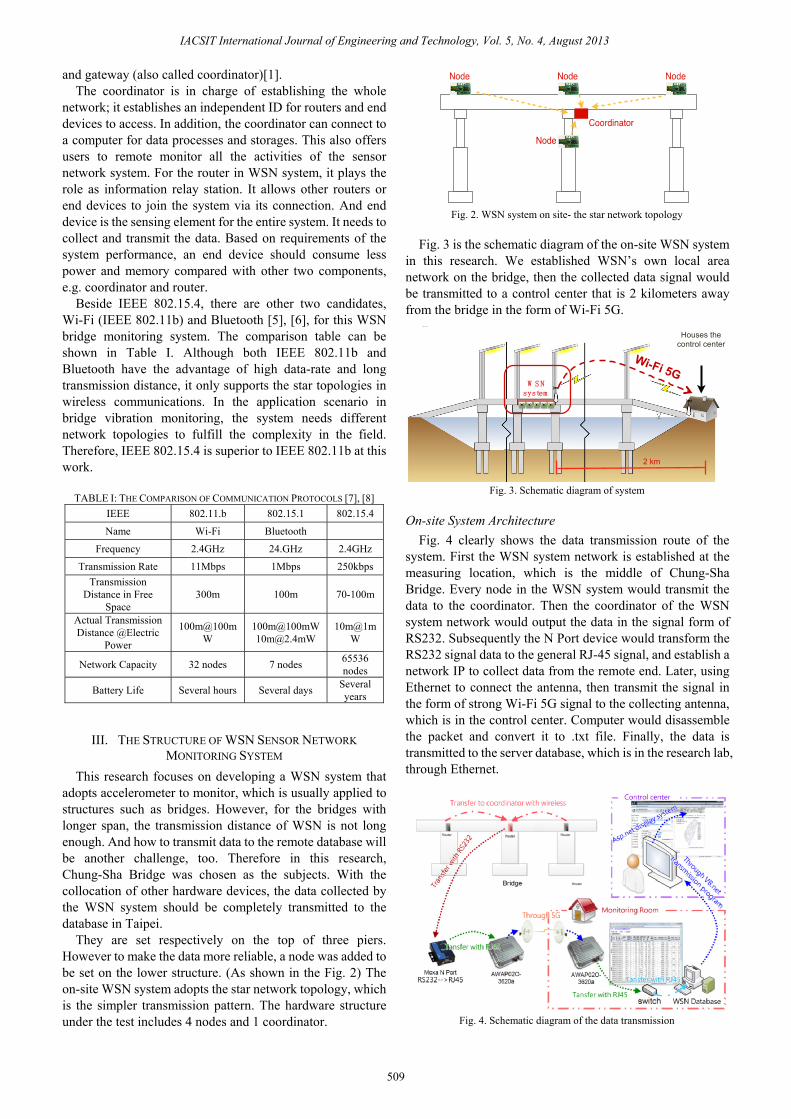
On-site System Architecture Fig. 4 clearly shows the data transmission route of the
system. First the WSN system network is established at the measuring location, which is the middle of Chung-Sha Bridge. Every node in the WSN system would transmit the data to the coordinator. Then the coordinator of the WSN system network would output the data in the signal form of RS232. Subsequently the N Port device would transform the RS232 signal data to the general RJ-45 signal, and establish a network IP to collect data from the remote end. Later, using Ethernet to connect the antenna, then transmit the signal in the form of strong Wi-Fi 5G signal to the collecting antenna, which is in the control center. Computer would disassemble the packet and convert it to .txt file. Finally, the data is transmitted to the server database, which is in the research lab, through Ethernet.
Fig. 4. Schematic diagram of the data transmission
IACSIT International Journal of Engineering and Technology, Vol. 5, No. 4, August 2013
509

Fig. 5. Inside of WSN node
IV. INTRODUCTION OF NODE MODULE
A. Supernode In this research, we use the Supernode Wireless Sensor
Network platform developed by Department of Engineering Science and Ocean Science, National Taiwan University (as shown in Fig. 6). The platform is equipped with the UZ2400 wireless radio frequency chip developed by Uniband Electronic Corporation (UBEC) and uses the communication protocol of IEEE 802.15.4, which is suitable for establishing large scale sensor network.
Fig. 6. Supernode sketch [9], [10]
B. Accelerometer As shown in Fig. 7, the accelerometer adopted in this
research is Silicon design model2210-002. It’s a uniaxial accelerometer with features of high sensitivity and low noise. We’ve purchased the type with waterproof packing in order to suffer from extreme weather.
Fig. 7. Model 2210 accelerometer
C. Design of Interface Circuit The research team used the usual EE software: Lay Out to
draw the circuit board pin (as shown in Fig. 8) in order to connect all hardware equipment. The functions of rectifiers, amplifiers and ADC analog-to-digital converter are also arranged on the circuit board, to ensure the stability and convenience of data transmission.
Fig. 8. Circuit board pin drawing [10]
D. Applied firmware: U-net In this research, U-net was chosen as the software for
WSN. It’s a program developed for IEEE 802.15.4 by Uniband Electronic Corporation (UBEC). The Physical layer (or Media Access Control layer) is in accordance with IEEE 802.15.4 and the Network layer (or Application layer) is similar to Zigbee. It meets the requirement of small file size and low complexity, and is on the basis of C language. Its hugest advantage is that it could be easily transplant to other platform, such as microprocessor 8051 or MSP430.
E. Operation Process of the System After the system start supplying power, coordinator would
first establish the network. Then the end device in the domain would try to communicate with coordinator. In this research, we let ADC continually acquire the output signals of sensor, then data would be transmitted via Supernode by wireless to the gateway node played by coordinator. Once the gateway received data, data would be transmitted to computer end immediately. Later, the receive end interface programmed by us would interpret data and display data in graph. Also the data would be saved into text file, so that the system recognition software could access and analyze.
V. EXPERIMENT ENVIRONMENT AND REQUIREMENT The node in this research means the accelerometer
mentioned previously as the sensor, used to monitor the vibration frequency of the bridge. The monitoring data could be used to analyze the scouring depth so that the safety and reliability of the bridge could be evaluated. Since data-receiving frequency for vibration is higher, the team’s goal for data transmission frequency is 128Hz. Such high frequency data transmission is different from the traditional low frequency sensor node. The transmission frequency is around 30 Hz, thereby common WSN system can meets its requirement. To maintain the stability of signal, AC is adopted instead of battery power in the experiment stage, since the continuous high-frequency transmission is without dormancy mechanisms, the power consumption is large.
A. Development Process of WSN System In the beginning of the experiment, we need to develop the
circuit board for WSN system. Therefore the main goal of developing the system is to design a circuit board that could combine the Supernode transmission platform, accelerometer and GPS equipment and meet the experiment requirement.
IACSIT International Journal of Engineering and Technology, Vol. 5, No. 4, August 2013
510
1) First version (Initial develop design) Research team used Lay Out to draw the circuit board pin.
After discussion and correction, the output drawing would be delivered to the manufacturer to customize the circuit board. Initially, we had arranged pin for three sensor units: GSP, accelerometer and inclinometer. Data required in this research is the vibration frequency, especially that the sampling rate is the higher the better. However, the memory capacity of Supernode is 10 Kbyte, but the most part of capacity was already burned into firmware U-NET to establish network. If the sampling rate is too high, then the programs for establishing network and ensuring network status are prone to errors, and caused the network stop working. 2) Second version(The modified part)
In this version, the main goal is to increase the sampling rate of each sensor from 64Hz to 128Hz, and also to reduce the memory usage of firmware so as to release more temporary memory space; then to increase the one-to-many network stability of coordinator to end devices. Following are the main modification:
a) Remove the pin for inclinometer Due to lack of memory, we decided to remove the pin for
inclinometer after discussion. b) Remove the function of “automatically rebuild
network” The built-in function of “automatically rebuild network”
of the generic U-NET would check the network connection in the form of packets at any time. If packets were found interrupted, then it would ask data re-transmit. There is one more checking packet for each piece of data, it would be a significant burden for the amount of data transmission. The numbers of packets might grow in in multiples. Therefore we had modified the U-NET firmware, remove the function of “automatically rebuild network” in order to release more memory and increase sampling rate.
c) Change the sampling mode of accelerometer In the case of not increasing memory, we had changed the
sampling mode of accelerometer from simultaneous access to alternate access. Discard intercepting vibration signals from two accelerometers simultaneously. One accelerometer would be measured for a period of time, then switched to another one. In this research, the period was set for 32 seconds. Thus a single node could maintain the output data amount of 10.25Kbps, yet the monitoring data is 128 Hz; meanwhile the condition of two axes vibration was still fulfilled.
Fig. 9. The case of discontinuous time data
The x-axis accelerometer would take data for 32
milliseconds then switched to it’s y-axis. Fig. 9 shows the feature of alternate sampling that the time is discontinuous. There are 9 output data in each row, the first eight is the voltage value measured by accelerometer; the ninth data is the time value in milliseconds. In the sampling rate of 128Hz,
it means that there would be one data output every 8 milliseconds. 3) Third version ( the final version)The modified part
a) Do not adopt U-NET for firmware We’ve made a huge change in the firmware part. In order
to release more memory, we finally decided not to adopt U-NET developed by Uniband Electronic Corporation (UBEC). There are too many U-NET built-in functions that involve network connection procedure and confirmation procedure, which took up too much memory. Thus the research team has developed a transceiver program according to the research’s need using IAR. The logic of the program is quite simple, only ask the end device to send back the accelerometer data and GPS time. Without all the network confirmation procedure, a large amount of memory was released and the sampling rate that the coordinator can receive is also increased dramatically.
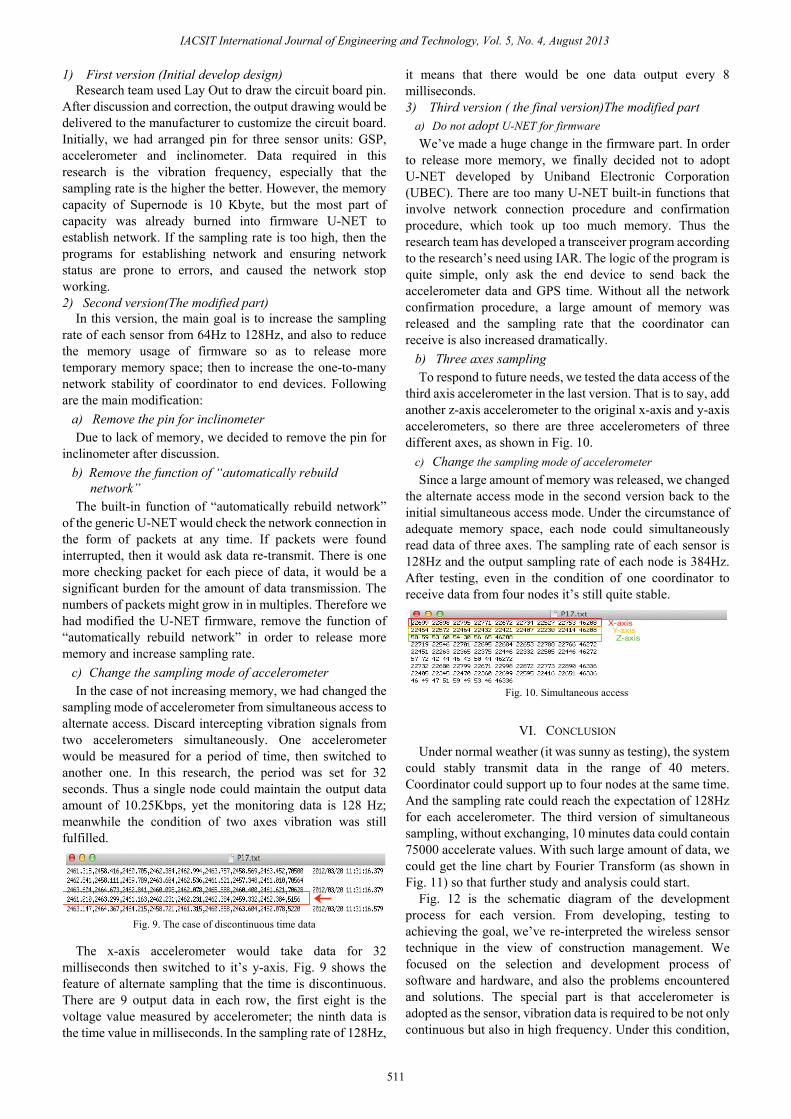
b) Three axes sampling To respond to future needs, we tested the data access of the
third axis accelerometer in the last version. That is to say, add another z-axis accelerometer to the original x-axis and y-axis accelerometers, so there are three accelerometers of three different axes, as shown in Fig. 10.
c) Change the sampling mode of accelerometer Since a large amount of memory was released, we changed
the alternate access mode in the second version back to the initial simultaneous access mode. Under the circumstance of adequate memory space, each node could simultaneously read data of three axes. The sampling rate of each sensor is 128Hz and the output sampling rate of each node is 384Hz. After testing, even in the condition of one coordinator to receive data from four nodes it’s still quite stable.
Fig. 10. Simultaneous access
VI. CONCLUSION Under normal weather (it was sunny as testing), the system
could stably transmit data in the range of 40 meters. Coordinator could support up to four nodes at the same time. And the sampling rate could reach the expectation of 128Hz for each accelerometer. The third version of simultaneous sampling, without exchanging, 10 minutes data could contain 75000 accelerate values. With such large amount of data, we could get the line chart by Fourier Transform (as shown in Fig. 11) so that further study and analysis could start.
Fig. 12 is the schematic diagram of the development process for each version. From developing, testing to achieving the goal, we’ve re-interpreted the wireless sensor technique in the view of construction management. We focused on the selection and development process of software and hardware, and also the problems encountered and solutions. The special part is that accelerometer is adopted as the sensor, vibration data is required to be not only continuous but also in high frequency. Under this condition,
IACSIT International Journal of Engineering and Technology, Vol. 5, No. 4, August 2013
511

we had made a lot of modification until the last version met the requirement. We suggest that the sampling rate should be considered in the planning stage. For the hardware, selecting suitable hardware or improving existing one are both feasible to enlarge the memory of system. There are a lot of details in the process that other researchers could refer to. Hope that this research could introduce the wireless monitor techniques to construction industry.
Fig. 11. Data after Fourier Transform [9]
Fig. 12. Development process of each version
REFERENCES [1] Institute of Electrical and Electronics Engineers 802.15 WPANTM
Task Group 4 (TG4). [Online]. Available: http://www.ieee802.org/15/pub/TG4.html, 2012
[2] IEEE Std 802.15.4d™-2009, IEEE Computer Society, Amendment 3. [3] H. T. Chen, “The development of wireless sensor network system in
structure health monitoring,” Master thesis, National Taiwan University graduate institute of Electronic Engineering, 2010.
[4] J. P. Huang, “Development of wireless sensor network for structural health monitoring,” Master thesis, National Taiwan University department of civil engineering, 2010.
[5] A. Sikora, “Design challenges for short-range wireless networks,” Communications, IEEE Proceedings, vol. 151, pp. 473-479, 2004.
[6] J. Wollert et al., “Bluetooth-Sicherheit,” Elektron. Wirel., pp. 30–35, 2004.
[7] P. Ferrari, A. Flammini, D. Marioli, and A. Taroni, “IEEE802.11 sensor networking,” IEEE Transactions on Instrumentation and Measurement, vol. 55, no. 2, pp. 615-619, 2006.
[8] H. L. Ren, M. Q. H. Meng, and X. J. Chen, “Physiological information acquisition through wireless biomedical sensor networks,” in Proc.
2005 IEEE International Conference on Information Acquisition, 2005.
[9] H. T. Tseng, “The research for data transmission and test of wireless monitoring system for bridge management,” Master thesis, National Taiwan University Department of Civil Engineering College of Engineering, 2012.
[10] N. C. Wang, “ The implementation of wireless sensor network system technology for structure health monitoring,” Master Thesis, National Taiwan University Graduate Institute of Electronic Engineering College of Electrical Engineering and Computer Science, 2012.
Hui-Ping Tserng is a professor at the Department of Civil Engineering of National Taiwan University. He has a Ph.D degree in Construction Engineering and Management from University of Wisconsin-Madison and he is an official reviewer or editorial board member of several international journals. His research interests include advanced techniques for project management, construction finance, knowledge management, management information
system, GPS/Wireless Sensor Network, and automation in construction.
Chih-Ting Lin is an assistant professor of the Department of Electrical Engineering of National Taiwan University. He received the MS. and Ph.D degree in Electrical Engineering and Computer Science from the University of Michigan, Arbor. His current research interests include bio-MEMS, bio-chips, nano fabrication, and biomolecular detection technology.
Jen-Yu Han is an associate professor at the Department of Civil Engineering of National Taiwan University. He received the Ph.D. degree in School of Civil Engineering from Purdue University. His research interests in applied satellite geodesy, deformation analysis, Time-variant Terrestrial Reference Frame and integrated analysis of hybrid spatial information.
Chia-Hao Hsu received his bachelor degree from the Department of Electrical Engineering of National Chiao Tung University. He is now a graduate student of the Department of Electrical Engineering of National Taiwan University.
Shi-Ming Wang received his bachelor degree from the Department of Construction Engineering of National Taiwan University of Science and Technology. He is now a graduate student at the Department of Civil Engineering of National Taiwan University.
Shu-Yi Lee received her bachelor and master degree from the Department of Civil Engineering of National Taiwan University. She is now working as research assistance in the Department of Civil Engineering of National Taiwan University.
IACSIT International Journal of Engineering and Technology, Vol. 5, No. 4, August 2013
512