the doha round - united nationsunstats.un.org/unsd/trade/globalforum/publications/mgt/gem... ·...
TRANSCRIPT
Policy Brief
October 2010
The Doha Round
Patrick A. Messerlin 1
I. Introduction
The “Doha Round” may be finished in 2011, more than ten years after having
been officially launched.2 A detailed description of the negotiations over such a long
period goes far beyond the scope of a chapter, and would require a book.3 Rather, this
chapter focuses on the four key questions faced by the Doha Round, and indeed by every
future Round.
Firstly, what is the “value” of a Round? The long negotiating process has fueled
the wide perception that the Doha Round is not worth it. Section I shows that this
perception is wrong by looking at the three alternative dimensions capturing the value of
a Round; (1) a Doha Round concluded by 2010−2011 would be as productive as the
previous Rounds; (2) the existing draft texts of a Doha Agreement would bring welfare
gains amounting to roughly USD 300 to 700 billion if one includes all the topics under
negotiation; and (3) the Doha Round has this unique capacity to deliver legally binding
commitments, that is, to provide the certainty so crucial to the business community
(Wallenberg, 2006). This capacity is reflected by the costs that a definitive failure of the
Doha Round would impose on world trade (a fall of 8 to 10 percent) and on the world
GDP (a loss of USD 900 billion).
1 Forthcoming in A. Lukauskas, R. M. Stern, and G. Zanini (eds.), Handbook of Trade Policy for Development, Oxford University Press. 2 Strictly speaking, there is no Doha Round as such. The negotiations are being held under an awkward title—the “Doha Development Agenda” (DDA)—as explained below. However, for simplicity sake, this chapter will use both the terms DDA and Doha Round. 3 See, in particular, Ismael (2009) from an insider perspective and Blustein (2009) from an outsider perspective. See also the huge amount of detailed information provided on a regular basis by a few websites, in particular of the WTO and ICTSD.
2
Secondly, should one tightly link trade negotiations with broader concepts—
development in the case of the Doha Round (it could be climate change in the next
Round)? Section III argues that this is a costly and ultimately disappointing approach. It
has absorbed the first four years of the Doha Round (from the 1999 Seattle Ministerial to
the 2003 Cancun Ministerial) with little, if any, result. It has generated excessive
expectations ending up in unnecessary disillusionment. Last but not least, it is still
imposing costly constraints on the current negotiations. A Round is above all a
negotiating process. That does not mean that development (or climate change) concerns
should not be present in the minds of the trade negotiators. But the multilateral trade
framework has enough means to address such concerns, without injecting them directly
into the core of the negotiations.
Thirdly, which is the objective of a Round? The answer looks obvious: trade
liberalization. But the Doha Round shows that this answer is not precise enough. In
sharp contrast with the previous Rounds, the Doha Round has been preceded by years of
unilateral and preferential liberalization. Should then the Round deliver additional
liberalization, or should it mostly consolidate (“bind” in the WTO jargon) the huge stock
of past liberalizations? Section II shows that this question puts the focus on the
“technology” to be used by trade negotiators. Developing such a technology has been the
main task of the trade negotiators from the July 2004 Framework and the 2005 Hong
Kong Ministerial to the July and December 2008 mini-Ministerials. The resulting 2008
“draft texts” are generally seen as the “best estimates” of a possible Doha Round
Agreement.4
Fourthly, how could one negotiate on services, a still largely uncharted territory of
the Doha Round despite the fact that services represent 50 to 70 percent of the GDP of
the WTO Members? Section V argues that there are good reasons—the specificity of
protection in services and, more importantly, the political economy of liberalization in
services—to believe that multilateral negotiations in services will be largely confined to
binding unilateral liberalizations undertaken before a Round. Taking into account these
4 For simplicity sake, this chapter refers to the draft texts of the July and December mini-Ministerials as the 2008 draft texts.
3
factors suggests that a plurilateral approach involving only the ten or so largest WTO
Members may be the necessary pre-requisite for concluding a Doha deal in services.
The concluding section addresses briefly two issues which are likely to dominate
the world-trade debate after a successful conclusion of the Doha Round. Firstly, to what
extent has the current global economic crisis strengthened the chances to conclude the
Doha Round? Secondly, which improvements does the crisis suggest for the WTO
machinery itself—as distinct from a Round?
II. The “Values” of the Doha Round
How should the “value” of the Doha Round (as of any Round) be assessed?
There are several dimensions—complementing each other—to this question. First is to
compare the outcome of the Doha Round with the outcomes of the Rounds held under the
aegis of the General Agreement on Trade and Tariffs (hereafter GATT) during the last 60
years. Such a long term comparison shows a surprisingly good performance of the Doha
Round on the one issue that is common to all these Rounds, that is, tariff cuts on
industrial products. A second dimension is provided by the estimated impact of a
successful Doha Round on world welfare, the traditional measure of economists. This
approach shows that most of the gains from the Doha negotiations come from its wide
scope of issues, much broader than the scope of its GATT predecessors. Lastly, the value
of the Doha Round mirrors another specific feature. As it occurs after a long period of
unilateral liberalization by many countries, its capacity to deliver “certainty” by legally
binding all these unilateral commitments in a multilateral setting is a source of potentially
huge benefits.
The Value in “Productivity” Terms: The Doha Round and Its Predecessors
Most observers give a low value to the Doha Round because of the endless
negotiations. However, using as an input, the length of the negotiations, for assessing an
outcome in terms of the value of the Doha Round is not appropriate. Rather, one needs to
have some sense of the “productivity” of the Doha Round. The most obvious, albeit
crude, measure of a “Round productivity,” is the average worldwide tariff cut agreed on
during a Round divided by the number of year of negotiations for the Round (Messerlin,
2007a). This measure has the additional merit to allow a comparison with all previous
Rounds.
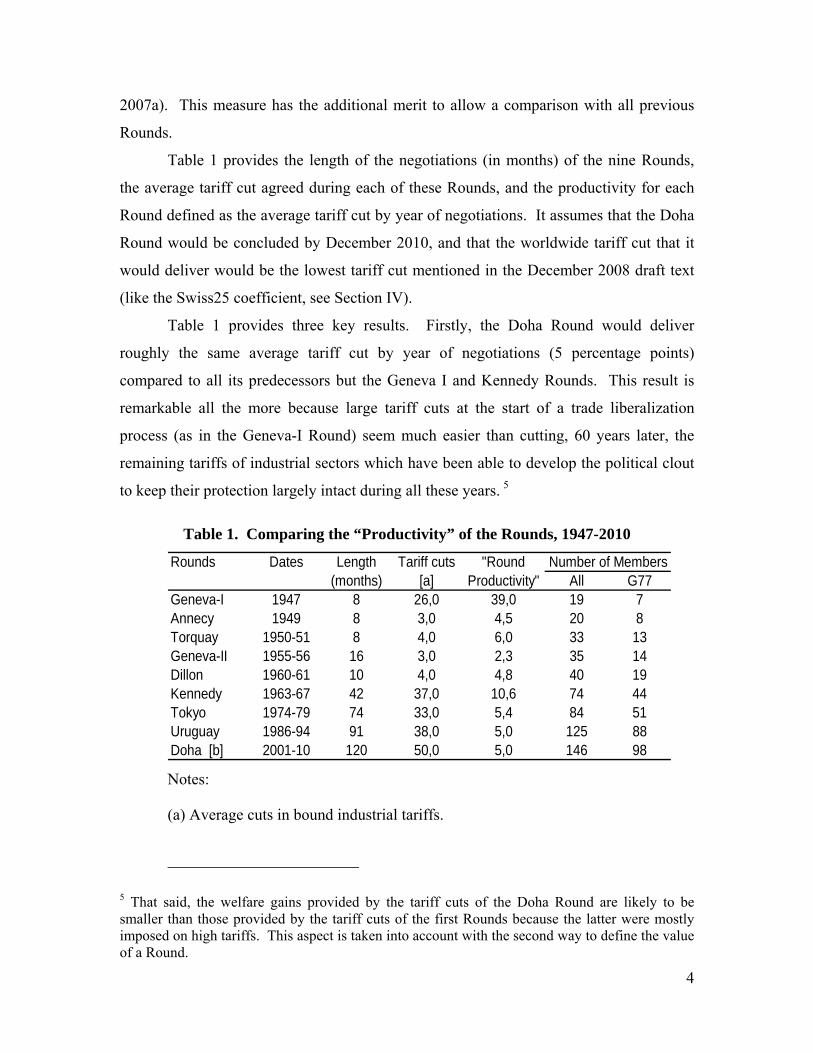
Table 1 provides the length of the negotiations (in months) of the nine Rounds,
the average tariff cut agreed during each of these Rounds, and the productivity for each
Round defined as the average tariff cut by year of negotiations. It assumes that the Doha
Round would be concluded by December 2010, and that the worldwide tariff cut that it
would deliver would be the lowest tariff cut mentioned in the December 2008 draft text
(like the Swiss25 coefficient, see Section IV).
Table 1 provides three key results. Firstly, the Doha Round would deliver
roughly the same average tariff cut by year of negotiations (5 percentage points)
compared to all its predecessors but the Geneva I and Kennedy Rounds. This result is
remarkable all the more because large tariff cuts at the start of a trade liberalization
process (as in the Geneva-I Round) seem much easier than cutting, 60 years later, the
remaining tariffs of industrial sectors which have been able to develop the political clout
to keep their protection largely intact during all these years. 5
Table 1. Comparing the “Productivity” of the Rounds, 1947-2010
Rounds Dates Length Tariff cuts "Round(months) [a] Productivity" All G77
Geneva-I 1947 8 26,0 39,0 19 7Annecy 1949 8 3,0 4,5 20 8Torquay 1950-51 8 4,0 6,0 33 13Geneva-II 1955-56 16 3,0 2,3 35 14Dillon 1960-61 10 4,0 4,8 40 19Kennedy 1963-67 42 37,0 10,6 74 44Tokyo 1974-79 74 33,0 5,4 84 51Uruguay 1986-94 91 38,0 5,0 125 88Doha [b] 2001-10 120 50,0 5,0 146 98
Number of Members
Notes:
(a) Average cuts in bound industrial tariffs.
5 That said, the welfare gains provided by the tariff cuts of the Doha Round are likely to be smaller than those provided by the tariff cuts of the first Rounds because the latter were mostly imposed on high tariffs. This aspect is taken into account with the second way to define the value of a Round.
4
5
(b) Assuming that the Doha Round will conclude in December 2010, with
the implementation of a Swiss25 tariff reduction for the emerging
economies and a Swiss10 for the developed countries (for details, see
Section IV).
Source: Updated from Messerlin (2007a).
Secondly, the size of the WTO membership or its structure (the share of
developing countries in the total WTO membership) has no visible impact on the
productivity of a Round. Leaving aside the Geneva-I and Kennedy Rounds, the Round
productivities are surprisingly stable over the years.6 Such a result, confirmed by
experienced negotiators (Groser, 2007), reflects the fact that GATT Rounds are
dominated by large countries. Up to the Uruguay Round concluded in 1995 once the
United States and European Community were close to agreement on the key issues at
stake, the other Members were strongly induced to join the emerging agreements, though
of course they tried their best to influence the final outcome (if only at the margin).
Lastly, two Rounds (Geneva-I and Kennedy Round) have an outstanding
productivity. The case of Geneva-I is easy to explain. The immediate post-WWII years
witnessed redundant tariffs, pervasive quotas, exchange-rate constraints, all factors that
made it easy to decide a first set of large tariff cuts. By contrast, the high productivity of
the Kennedy Round is puzzling at a first glance, and seems mostly due to improved
negotiating “technology” (see Section IV).
The Value in Terms of Welfare Gains: The Wider Scope of the Doha Round
The preceding assessment of the value of a Round has two limits. It does not
reflect necessarily well the welfare gains (the preferred measure of economists) delivered
by a Round. And it ignores that the Doha Round has a much wider scope of issues than
its GATT predecessors since, in addition to tariffs imposed on industrial goods (an issue
dealt with by all the Rounds), it also covers tariffs imposed on agricultural products, non-
tariff barriers imposed on industrial goods, barriers to trade and investment in services,
and trade facilitation—to mention the most important topics.
6 The Kennedy Round witnessed a doubling of the GATT membership and was the first Round with a majority of developing Members—and yet, it was the second most productive Round.

6
The potential world welfare gains to be delivered by the Doha Round are thus a
combination of the welfare gains of all these various components (and of improved rules,
if any). As of today, no modeling exercise is able to take into account all these
components, if only because of a lack of adequate data. Available estimates are limited
to the tariffs in the goods sector, hence substantially underestimate the value of the whole
Doha Round. Before leaving this narrow context of tariff cuts in agricultural and
industrial goods, it is worth mentioning two studies (Laborde, Martin, and van der
Mensbrugghe, 2009a; 2009b), which suggest global welfare gains amounting to US
dollars 160 billion from trade liberalization in goods alone, even after allowing for all the
exceptions to liberalization (see Section IV). Such gains are substantially larger (up to
twice) the gains generally mentioned. The reason is that these two exercises use much
more disaggregated trade and tariff data. Hence, they take into account high tariffs as
compared to the previous exercises, since cutting high tariffs is the main source of
welfare gains.7
Getting a better sense of such a value thus requires an ad hoc approach that
calculates the welfare gains associated with each of the four components covered by the
Doha Round, without trying to integrate them into one global and interactive approach.
Such a piecemeal approach provides the following results (Adler et al., 2009). Tariff cuts
in agricultural and industrial goods would have an estimated impact of trade gains on
GDP amounting to roughly USD 100 billion. Full liberalization (tariffs and non-tariff
barriers) in three industrial sectors (chemicals, electronic and environmental goods)
would generate an impact of similar size (USD 100 billion). A modest liberalization in
services would also have an impact of similar size (USD 100 billion).
Lastly, the potential gains from improvement in trade facilitation (which covers
all the trade costs, such as transit, border fees and formalities, trade regulations, etc.—all
issues related to the Doha Round because they have a substantial component of services)
would amount to USD 385 billion of gains. An alternative way to express the importance
of trade facilitation in the Doha Round context is to say that reducing trade costs by 2 to 4
7 Economic analysis shows that welfare losses are a function of the square of the tariffs.
7
percent would have the same effect on trade volumes as a successful Doha Round
(Hoekman, Martin, and Mattoo, 2010; Hoekman and Nicita, 2010).
In sum, the welfare gains from a successful Doha Round (defined on the basis of
the 2008 draft texts) would range from USD 300 to 700 billion.
The Value in Terms of Certainty: The Doha Round as a “Binding Round”
Coming back to the context of trade in goods, looking at the applied tariffs for
assessing the value of the Doha Round overlooks another aspect of the value of a
Round—indeed, the most important aspect of GATT for its founding fathers.
GATT/WTO negotiators conclude agreements in terms of “bound” tariffs. WTO
Members can apply tariffs that are lower than their bound tariffs, but the bound tariffs are
the only ones that, according to WTO rules, an importing country cannot raise without
compensating its affected trading partners. In short, bound tariffs are the only ones that
deliver the legal certainty that the business community values so much.
Table 2 shows that the average applied tariff of the 34 countries that account for
roughly 90 percent of world trade and GDP under WTO rules is roughly 7 percent in the
manufacturing sector in 2007.8 Such a moderate level mirrors the substantial unilateral
tariff cuts that were implemented in the 1990s and early 2000s by many developing and
emerging countries, following China’s successful liberalization. To a much smaller
extent, it also mirrors the tariff cuts generated by preferential trade agreements.9 In short,
there are less and/or smaller tariffs to cut left to the Doha Round (and to its successors,
see the concluding section).10
8 These numbers leave aside only three large economies: Algeria (not yet a WTO Member); Russia (still negotiating WTO accession, but imposing an average tariff of 10.5 percent), and Vietnam (still implementing WTO accession, with a targeted average bound tariff of 10.4 percent at the end of its accession period). 9 Preferential agreements have a limited impact for a host of reasons: most of them are recent, are on a bilateral basis, have complex rules limiting their impact on trade flows, etc. Such agreements are estimated to amount to 10 percent only of the liberalization effort (World Bank, 2005). 10 This evolution explains that the successive estimates of the welfare gains to be delivered by the Doha Round negotiations in goods have declined as time went on. The gains calculated in the mid-2000s are smaller than those calculated a few years before. For instance, they would amount to an increase of world welfare of 0.5 percent (Polanski, 2006) compared to a 1,5 percent increase
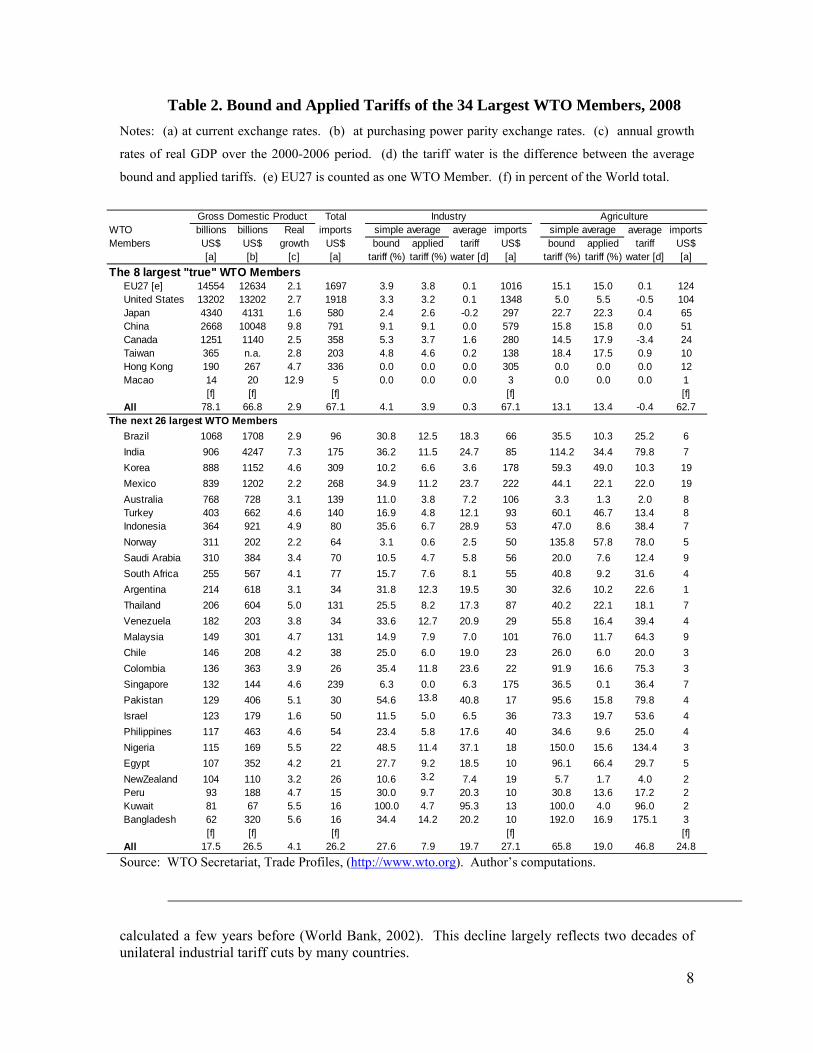
Table 2. Bound and Applied Tariffs of the 34 Largest WTO Members, 2008 Notes: (a) at current exchange rates. (b) at purchasing power parity exchange rates. (c) annual growth
rates of real GDP over the 2000-2006 period. (d) the tariff water is the difference between the average
bound and applied tariffs. (e) EU27 is counted as one WTO Member. (f) in percent of the World total.
TotalWTO billions billions Real imports average imports average importsMembers US$ US$ growth US$ bound applied tariff US$ bound applied tariff US$
[a] [b] [c] [a] tariff (%) tariff (%) water [d] [a] tariff (%) tariff (%) water [d] [a]The 8 largest "true" WTO Members
EU27 [e] 14554 12634 2.1 1697 3.9 3.8 0.1 1016 15.1 15.0 0.1 124United States 13202 13202 2.7 1918 3.3 3.2 0.1 1348 5.0 5.5 -0.5 104Japan 4340 4131 1.6 580 2.4 2.6 -0.2 297 22.7 22.3 0.4 65China 2668 10048 9.8 791 9.1 9.1 0.0 579 15.8 15.8 0.0 51Canada 1251 1140 2.5 358 5.3 3.7 1.6 280 14.5 17.9 -3.4 24Taiwan 365 n.a. 2.8 203 4.8 4.6 0.2 138 18.4 17.5 0.9 10Hong Kong 190 267 4.7 336 0.0 0.0 0.0 305 0.0 0.0 0.0 12Macao 14 20 12.9 5 0.0 0.0 0.0 3 0.0 0.0 0.0 1
[f] [f] [f] [f] [f]All 78.1 66.8 2.9 67.1 4.1 3.9 0.3 67.1 13.1 13.4 -0.4 62.7
The next 26 largest WTO MembersBrazil 1068 1708 2.9 96 30.8 12.5 18.3 66 35.5 10.3 25.2 6India 906 4247 7.3 175 36.2 11.5 24.7 85 114.2 34.4 79.8 7Korea 888 1152 4.6 309 10.2 6.6 3.6 178 59.3 49.0 10.3 19Mexico 839 1202 2.2 268 34.9 11.2 23.7 222 44.1 22.1 22.0 19Australia 768 728 3.1 139 11.0 3.8 7.2 106 3.3 1.3 2.0 8Turkey 403 662 4.6 140 16.9 4.8 12.1 93 60.1 46.7 13.4 8Indonesia 364 921 4.9 80 35.6 6.7 28.9 53 47.0 8.6 38.4 7Norway 311 202 2.2 64 3.1 0.6 2.5 50 135.8 57.8 78.0 5Saudi Arabia 310 384 3.4 70 10.5 4.7 5.8 56 20.0 7.6 12.4 9South Africa 255 567 4.1 77 15.7 7.6 8.1 55 40.8 9.2 31.6 4Argentina 214 618 3.1 34 31.8 12.3 19.5 30 32.6 10.2 22.6 1Thailand 206 604 5.0 131 25.5 8.2 17.3 87 40.2 22.1 18.1 7Venezuela 182 203 3.8 34 33.6 12.7 20.9 29 55.8 16.4 39.4 4Malaysia 149 301 4.7 131 14.9 7.9 7.0 101 76.0 11.7 64.3 9Chile 146 208 4.2 38 25.0 6.0 19.0 23 26.0 6.0 20.0 3Colombia 136 363 3.9 26 35.4 11.8 23.6 22 91.9 16.6 75.3 3Singapore 132 144 4.6 239 6.3 0.0 6.3 175 36.5 0.1 36.4 7Pakistan 129 406 5.1 30 54.6 13.8 40.8 17 95.6 15.8 79.8 4Israel 123 179 1.6 50 11.5 5.0 6.5 36 73.3 19.7 53.6 4Philippines 117 463 4.6 54 23.4 5.8 17.6 40 34.6 9.6 25.0 4Nigeria 115 169 5.5 22 48.5 11.4 37.1 18 150.0 15.6 134.4 3Egypt 107 352 4.2 21 27.7 9.2 18.5 10 96.1 66.4 29.7 5NewZealand 104 110 3.2 26 10.6 3.2 7.4 19 5.7 1.7 4.0 2Peru 93 188 4.7 15 30.0 9.7 20.3 10 30.8 13.6 17.2 2Kuwait 81 67 5.5 16 100.0 4.7 95.3 13 100.0 4.0 96.0 2Bangladesh 62 320 5.6 16 34.4 14.2 20.2 10 192.0 16.9 175.1 3
[f] [f] [f] [f] [f]All 17.5 26.5 4.1 26.2 27.6 7.9 19.7 27.1 65.8 19.0 46.8 24.8
Gross Domestic Product Industry Agriculturesimple averagesimple average
Source: WTO Secretariat, Trade Profiles, (http://www.wto.org). Author’s computations.
calculated a few years before (World Bank, 2002). This decline largely reflects two decades of unilateral industrial tariff cuts by many countries.
8
9
Delivering certainty is particularly important in the case of the Doha Round
because the 1990s and 2000s have witnessed substantial liberalizations that are not yet
bound. Table 2 shows that, out of the 34 largest economies, only eight impose applied
tariffs at their bound level (Messerlin, 2008). The 26 other largest economies—more
than one fourth of world trade and GDP, and growing at rates twice those of the U.S. or
the EC—have bound tariffs higher than their applied tariffs, often by 20 to 40 percentage
points. Hence, these economies are potential major defaulters in tariff matters at any time
and with no penalty. Moreover, the “tariff water” (the difference between bound and
applied tariffs) is likely to be higher for the high tariffs, meaning that binding such tariffs
would bring even greater welfare gains in terms of certainty.
It is difficult to estimate the “value of binding” aspect of the Doha Round because
it requires to define the “default” policies that the 26 countries listed in Table 2 could
implement, if these countries would decide to increase their applied tariffs up to their
bound rates. World trade is estimated to decline by 8 to 10 percent (Bouët and Laborde,
2009; Australian Productivity Commission, 2009) and the world GDP by US$ 900 billion
(2 percent)—strongly suggesting that the value of binding of the Doha Round is its most
outstanding contribution to the world trade regime.
This conclusion is reinforced by the fact that such estimates do not take into
account two key factors. First, they do not reflect the fact that the unexpected magnitude
of the current economic crisis has increased the value of binding of the Doha Round to
the extent that it has substantially increased the risks of default. Second, the above
estimates ignore the opportunity costs imposed on the world trade regime by the fact that
trade officials are so busy with the Doha negotiations that they have no time to look at
other pressing major issues, such as the relations between climate change and trade policy
(a point briefly evoked in the concluding section).
III. Wasted Early Years (2001-2004) and Long-lasting Mistakes
The Doha Round is generally seen as very similar to GATT Rounds. This
apparent continuity hides major differences that have made very difficult the launch of
the Round, and are still imposing costs on its negotiating process.
10
The core of these differences is as follows. GATT was deeply conscious of the
fragility of the world trade regime that it established, and of its many limits—a narrow
membership, a scope limited to industrial goods, the absence of a robust litigation
process, etc. In sharp contrast, the WTO was conceived with a boundless confidence in
the new regime. It seemed that no issue could escape the WTO reach—services, trade-
related intellectual property rights, strong litigation, the principle of linking together all
the topics discussed during a Round (the so-called “Single Undertaking”), etc. Including
new topics and new disciplines was simply seen as a matter of time.
These major differences reflect the very different environments prevailing when
the two fora were conceived. The GATT birth witnessed a deep fragmentation of the
world economy, divided between market-oriented (not necessarily free trade-inclined)
countries, autarkic centrally planned economies, and developing countries fascinated by
import-substitution policies. By contrast, the WTO birth was witnessing the fall of the
Berlin Wall, the unilateral liberalization of former centrally-planned Central European
economies (in such a very bold way, as in Czechoslovakia or Estonia, that it eroded the
reluctance to more liberalization that characterized the EC approach until the Uruguay
Round) and, last but not least, the even bolder market opening of China that led a notable
group of developing countries to become supporters of the GATT “liberal” trade regime,
including its traditional leading opponents (Brazil and India).
This boundless confidence in the WTO machinery has been the source of severe
difficulties for launching the Doha Round. It largely explains the failure of the Seattle
Ministerial (1999). It induced the WTO Members to link trade negotiations and
“development” in a tight rhetoric during the 2001 Doha Ministerial. After a short-lived
success, this rhetoric has been a source of bitter disillusionment at the 2003 Cancun
Ministerial. Finally, it has imposed costly constraints that the Doha negotiators have still
to abide by, as explained below.
Launching a New Round: The Failure of the Seattle Ministerial (1999)
During the GATT years, launching a Round was done on an ad hoc basis, if and
when a leading GATT Member (de facto the U.S.) felt that time was ripe for making
further progress in opening markets. In sharp contrast, the launch of the Doha Round
was pre-committed by the 1995 Uruguay Agreement that explicitly scheduled the launch
11
of talks on agriculture and services by 2000. The choice of the year 2000 deserves a
remark. It was before the full implementation of two highly contentious Uruguay Round
agreements—the opening of developed country markets in clothing and textiles by 2005,
and the enforcement of the developing country obligations in trade-related intellectual
property rights (hereafter TRIP) by 2010. Opening a new Round when key concessions
of the previous Round are not even close to be fully enforced was a sure recipe for
serious troubles.
Troubles were fast to emerge, with the collapse of the Seattle WTO Ministerial in
1999. During this Ministerial, the U.S. and the EC were still in the mid-1990s mood, and
wanted to expand the WTO to new topics, particularly trade and labor. At the same time,
developing countries became increasingly divided. At one end of the spectrum, the
emerging economies were building an offensive agenda adapted to their mounting export
capacities, targeting in particular the U.S. and EC reluctance to open their markets in
agriculture, in some industrial sectors (those still highly protected against goods exported
by the developing countries), and in services (including labor movement). At the other
end of the spectrum, the least-developed economies (LDC) were hanging on to their
exemptions from GATT/WTO disciplines. These divisions were increased by the rapidly
fading hopes of many developing countries to benefit from the scheduled increased
openness of the textiles and clothing markets in developed countries, because of the fast
and strong rise of China’s productive capacities in these products.
All these difficulties were greatly magnified when non-governmental
organizations (NGOs) discovered the WTO’s capacity to attract media, a feature ignored
by the GATT. Many NGOs appointed themselves as champions of the developing
countries, often advocating for simplistic solutions to such complex issues as the true
impact of the Uruguay Round TRIP Agreement on drugs, or the need of more “policy
space” for the developing countries (see below). It took a few years for the trade
negotiators of developing countries to reassert themselves, and make clear that they did
not need help from NGOs often based in, or funded by developed countries.
12
Development: The Rallying Cry at the Doha Ministerial (2001)
Following the Seattle debacle, the WTO negotiators put the negotiating process
back on track in less than two years.11 Such a haste had a price. The 2001 Doha
Ministerial felt short to launch a fully fledged “Doha Round.” Rather, it launched a
“Doha Development Agenda” (DDA) with an initially very ambiguous status—for a long
time, it was not even clear whether the DDA discussions were mere exploratory talks or
true negotiations. More crucially, injecting the “development” term directly into trade
negotiations created serious problems. It was driven by two very different reasons.
First was a quite usual feature of the GATT negotiating process that consists in
including in a Round all the topics of interest for all the participants, before dropping
some of them and concluding the deal with the “surviving” topics. The rationale for such
an approach is to enlarge the possibilities of trade-offs among participants in order to
facilitate the final shaping of the deal.12
The second reason was quite new. It was the realization of how it has become
easy for developing countries to block WTO negotiations, as illustrated at the Seattle
Ministerial. This capacity was generated by the principle of a “Single Undertaking”
much more than by the sheer number of developing country WTO Members.13 The
Single Undertaking principle states that concluding a Round requires the agreement of all
the Members on all the topics under negotiations. Ironically, this rule was imposed by
the developed countries (most notably, the U.S.) during the Uruguay Round in order to
11 This rapidity was in part related to the 9/11 terrorist attacks. But, it was also (mostly?) pre-determined by the WTO approach, much less conscious of the fragility of the trade regime than GATT. In this respect, it is worth noting that four years were necessary to recover from the failed attempt to launch a Round in 1982 and to launch what becomes the Uruguay Round at the 1986 Punta-del-Este conference. 12 This negotiating technique reached a climax when the Uruguay Round negotiators “traded” better access to the textile and clothing markets of the developed countries with the implementation by developing countries of stricter laws and regulations in TRIPs. 13 That the number of development countries is not a key parameter is suggested by the fact that, as soon as by late 1960s, developing countries represented more than half the GATT membership. By the way, it should be reminded that there is no official list of developing countries in the WTO. Being such a country is a decision left to each WTO Member. Proxy lists are the membership of the G77 Group of non-aligned countries, or of the countries with medium or low GDP per capita. Both lists do not include developed countries that still tend to consider themselves as developing countries in the WTO forum (Singapore, Korea, etc.).
13
force developing countries to make commitments on new trade issues (services and
TRIPs) as a trade-off for the commitments in textiles, clothing, and agriculture that
developed countries were ready to take. A few years later, this principle was backfiring
and working in favor of the developing countries—now in the position to force the
developed countries to take into account the developing countries’ requests if they
wanted to see their own requests accepted.14
Development: Bitter Disillusionment at the Cancun Ministerial (2003)
The success of “development” as a rallying cry for the Doha negotiations was
short lived. Before explaining the reasons for such a fate, it should be made clear that the
ultimate objective of countries is growth and development, not trade per se. Trade policy
is a necessary instrument for achieving such objectives, but not a sufficient one: many
other domestic policies are needed. That said, trade policy has many ways to take on
board development concerns (as illustrated in Section III). Explicit and multiple
references to a broad development goal may then be more harmful than helpful, as
illustrated by the first years of negotiations.
The main reason is that, behind the apparent consensus on the words
“Development Agenda,” WTO Members were quick to re-discover their disagreements
on the relative role of trade policy and other policies in development.
For developed WTO Members, development was seen as requiring all the aspects
of modern governance, from market opening to the so-called Singapore issues—
competition law and policy, transparency in public procurement, disciplines in
investment—and to issues such as labor and environmental regulations. In particular, the
EC was pushing hard for making the Singapore issues part of the final Doha deal. The
2003 Cancun Ministerial resulted in the abandonment of this approach.
By contrast, most developing countries interpreted “development” as a way to
restore and reinforce the notions of “special and differential treatment” (SDT) and
14 At the end of the Uruguay Round, developed countries were able to impose the Single Undertaking to developing countries by creating a new institution (the WTO), leaving to the developing countries willing to benefit from the opening of the developed country markets in textiles and clothing, no other option than to join the WTO. Such “blackmail” is not an available option in the Doha Round.
“policy space.” The Uruguay Round negotiations on GATT Article XVIII (the key legal
basis for SDT) almost succeeded in reducing the notion of SDT to the narrow dimension
of longer periods of implementation. By contrast, the late 1990s witnessed the increasing
recognition that development does require some policy space.
The key question is then: which type of policy space? Economic analysis insists
on a policy space centered on domestic policies, such as regulatory reforms, domestic
taxes and subsidies in markets of goods, services and factors of production. It repeatedly
shows that policy space narrowly defined as trade barriers (tariffs or non-tariff barriers) is
rarely the appropriate instrument to deal with the vast majority of development issues.
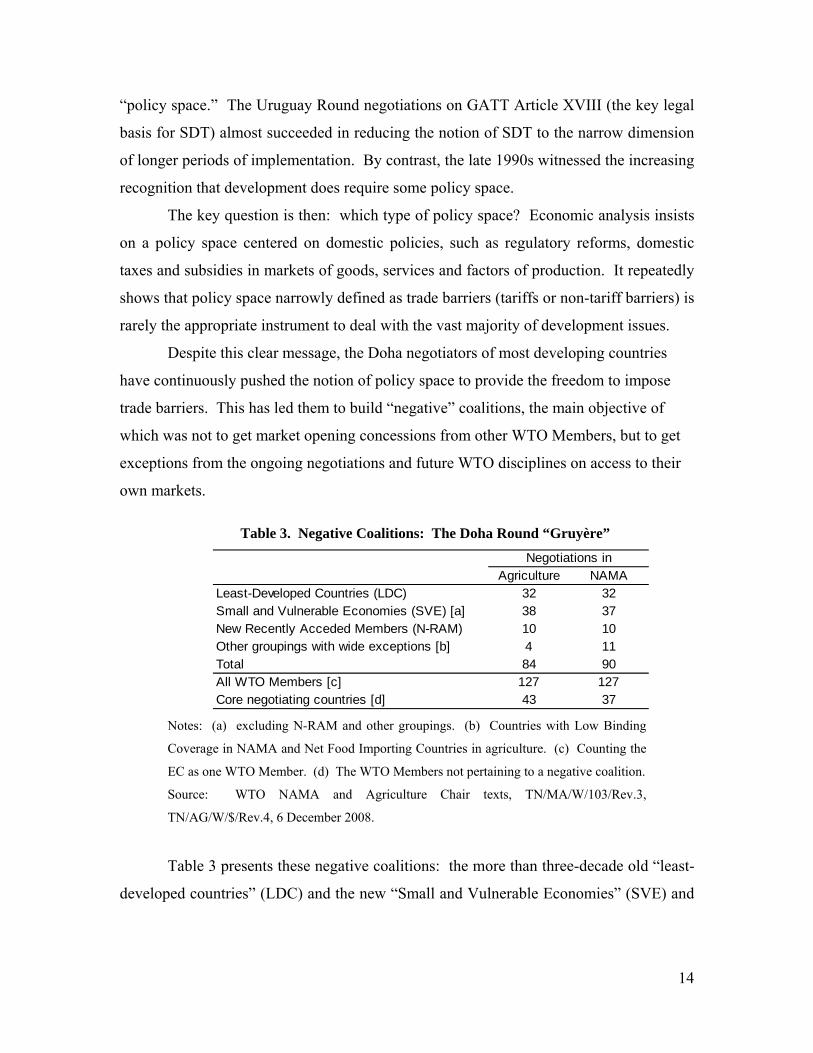
Despite this clear message, the Doha negotiators of most developing countries
have continuously pushed the notion of policy space to provide the freedom to impose
trade barriers. This has led them to build “negative” coalitions, the main objective of
which was not to get market opening concessions from other WTO Members, but to get
exceptions from the ongoing negotiations and future WTO disciplines on access to their
own markets.
Table 3. Negative Coalitions: The Doha Round “Gruyère”
Agriculture NAMALeast-Developed Countries (LDC) 32 32Small and Vulnerable Economies (SVE) [a] 38 37New Recently Acceded Members (N-RAM) 10 10Other groupings with wide exceptions [b] 4 11Total 84 90All WTO Members [c] 127 127Core negotiating countries [d] 43 37
Negotiations in
Notes: (a) excluding N-RAM and other groupings. (b) Countries with Low Binding
Coverage in NAMA and Net Food Importing Countries in agriculture. (c) Counting the
EC as one WTO Member. (d) The WTO Members not pertaining to a negative coalition.
Source: WTO NAMA and Agriculture Chair texts, TN/MA/W/103/Rev.3,
TN/AG/W/$/Rev.4, 6 December 2008.
Table 3 presents these negative coalitions: the more than three-decade old “least-
developed countries” (LDC) and the new “Small and Vulnerable Economies” (SVE) and
14
15
“New Recently Acceded Members” (N-RAM).15 In addition, several to a dozen of
Members have succeeded in creating groupings with wide exceptions in manufacturing
and agriculture. Altogether, these negative coalitions include roughly 84 to 90 Members
which are totally or substantially exempted from the possible results of the Doha Round.
In short, the current Doha negotiations are fully involving only 40 Members or so,
half of them being developing and emerging economies (out of a total WTO membership
amounting to 127 Members, the EC being one Member). As these 40 Members represent
more than 80 percent of world trade and GDP, the Doha Round looks like a “gruyère”
full of small holes.
The Doha negotiators often claim that this situation does not create sub-categories
of negotiating Members among developing countries. But, of course, it does. Negative
coalitions reduce or eliminate the incentives of small developing countries to participate
actively in the Doha negotiations, hence to block them since most of these small
countries are wary of further liberalization. Ironically, they can be seen as a pragmatic
solution to the Single Undertaking constraint offered by the small countries to the large
WTO Members.
From a development perspective, negative coalitions have two opposite faces.
For their own members, they are disastrous. They impose self-inflicted damages on the
“opting out” countries since they substantially reduce potential trade among all their
members and between them and the rest of the world. By contrast, negative coalitions
are positive for the large developing and emerging economies. From a diplomatic
perspective, such coalitions represent a large reservoir of small allies while, at the same
time, they leave the large developing and emerging economies free to focus their
offensive interests on trade with developed economies, without harming much their
economic interests since negative coalitions represent too small a share of world trade
and GDP.
15 SVE are developing WTO Members that, in the period 1999-2004, had an average share of (a) world merchandise trade of no more than 0.16 percent, (b) world trade in NAMA of no more than 0.1 percent, and (c) world trade in agricultural products of no more than 0.4 percent.

16
Development: A Source Of Long-Lasting Constraints On The Doha Negotiating
Process
Amidst all these expectations and disillusionment, the WTO negotiators have
defined four concrete guidelines defining “development-friendly” negotiations.
Firstly, paragraph 16 of the 2001 Doha Declaration states: “The negotiations
shall take fully into account the special needs and interests of developing and least-
developed country participants, including through less than full reciprocity in reduction
commitments (..)” (author’s emphasis). The “less than full reciprocity” provision does
not make economic sense from a development perspective if one remembers that the
Doha negotiations deal with bound tariffs. Almost all the developing countries—with the
notable exception of China—have much higher bound tariffs than developed countries.
If they want to boost their growth by guaranteeing access to their markets, developing
countries should thus cut their bound tariffs more than the developed countries. Cutting
bound tariffs more severely than developed countries does not necessarily mean that
developing countries would cut their current applied tariffs, or that they could not have
longer implementation periods than the developed countries—two simple and usual ways
to take into account the relative fragility of the development process within the trade
negotiating framework.
Secondly, paragraph 24 of the 2005 Hong Kong Declaration states: “(..) we
instruct our negotiators to ensure that there is a comparably high level of ambition in
market access for Agriculture and NAMA.” This statement links the liberalization of the
industrial markets of the developing countries to the liberalization of the agricultural
markets of the developed economies. From a purely economic perspective, this second
criterion seems neutral. But, combined with the “less than full reciprocity” provision, it
could constitute a strong incentive for creating a large and powerful “unholy coalition”
between developed countries reluctant to liberalize their agriculture and developing
countries reluctant to liberalize their industry.
Thirdly, the Doha negotiators have imposed on themselves a “sequencing” in the
timing of the negotiations: agreements on agriculture and NAMA should precede serious
negotiations in services. This sequencing reflects the widely held view among
developing countries that development is associated with the growth of the goods sectors
17
and not the services sectors. It also mirrors the intrinsic difficulties in negotiating
liberalization in services (in the WTO forum or elsewhere). For instance, how to measure
the concessions that a country is ready to give in some services and those that the trade
partners are ready to offer in other services? In goods, the technique is well oiled: it is
generally based on comparing the country’s trade-weighted tariff cuts with the trade-
weighted tariff cuts offered by the country’s trading partners. In services, such an
approach is impossible because there are no tariff equivalents of the barriers to trade in
services. The constraint on sequencing has greatly contributed to put services on a
sideline, a counter-productive situation for the whole Doha Round since services are such
a large share of domestic GDP in all the countries.
Lastly, development has been an excuse for not requesting any commitment from
the LDC—the so-called “Round for free” for the LDC. Sadly, developed countries led by
the EC have supported such a view as a way to get LDC support for their own agenda. A
“Round for free” imposes a heavy cost on the LDC. From an economic perspective, it
deprives them from the progressive liberalization that they need for increasing their
growth and development. From a negotiating perspective, the “Round for free” has
allowed developed countries not to offer to the LDC a fully free access to their own
markets, but to limit their commitments to offer a “duty free-quota free” (DFQF) to only
97 percent of their tariff lines (at the 2005 Hong Kong Ministerial). Such a proposal is of
very limited interest for the LDC that export only a few goods, often covering less than 3
percent of the tariff lines.
IV. At Last on Track (2004-2008) and Improving the Negotiating Technology
The Doha negotiators have spent endless hours on trying to define the
“modalities” of the negotiations—that is, the broad framework of the Doha Agreement in
terms of cuts in trade barriers, exceptions to agreed cuts, time schedules of the cuts, etc.
Such a debate has often been confused and seen as a waste of time. This criticism is
justified only to a limited extent. It ignores the fact that the Doha negotiators have faced
two unprecedented challenges.
First, they have had to relax tight initial constraints—the constraint subjecting
every aspect of the trade negotiations to a divisive “development” goal, and the constraint
18
of the Single Undertaking. They needed four years to do these tasks—by eliminating
some topics (“Singapore issues”) by generating some broadly agreed criteria for taking
into account the development goal, and by progressively allowing “negative” coalitions
of many small WTO Members.
Second, and even more crucially, the Doha Round has been preceded by years of
unilateral and preferential liberalization undertaken by many countries, mostly in
industrial goods. This situation, unknown by previous Rounds, raised a key question:
how to take into account these liberalizations in the Doha Round?
Both unprecedented challenges must be addressed to improve the technology of
multilateral trade negotiations in order to address the following question: how to
liberalize and make exceptions in a forum as large as the WTO that makes country-
specific solutions inadequate, hence requires generic solutions under the form of
“formulas.” It took four years to provide answers to this question—starting from the
early efforts to design the (imperfect) liberalization formula in agriculture in the 2004
July Framework and the 2005 Hong Kong Ministerial (both events were the turning
points of the Doha Round, and witnessed the return to the pure logic of trade
negotiations) to the 2008 mini-Ministerials “draft texts,” which provide a complete set of
formulas, often presented as the “best estimates” of what could be a fully-fledged
outcome of the Doha Round in trade in goods.
The remarkable productivity of the Kennedy Round (see Table 1) reveals the
importance of the negotiating technologies in a Round. Before the Kennedy Round,
GATT negotiations on tariff cuts relied mostly on offers and requests expressed on a
tariff line by tariff line basis, a very cumbersome process. The Kennedy Round made a
technological leap-frog by substituting a liberalization formula to the offer-and-request
approach undertaken until then, enabling the Kennedy negotiators to be the most
productive of the GATT history (Baldwin, 1986).
But, liberalization formulas require exception formulas that provide to each
negotiating country the degree of freedom needed by its government in order to get the
domestic political support necessary for the signature and the ratification of the
19
agreement. 16 The Kennedy Round did not generate such exception formulas for two
reasons. First, exceptions against exports from other developed countries have been
provided ex post under the form of many non-tariff barriers (voluntary export restraints,
subsidies or antidumping measures) forcing the following Round (the Tokyo Round) to
try to discipline all these measures. In addition, the Kennedy Round negotiators did not
need to discuss exception formulas against developing countries’ exports simply because,
in sharp contrast with the current Doha Round, these countries were not interested in
defending their offensive interests, while the then emerging economies (Japan, Hong
Kong, Korea, Singapore and Taiwan) realized quickly the large rents they could get from
voluntary export restraints and similar measures imposed ex post on their exports by
developed countries.
The Doha negotiators have thus been the first to have to look for a whole set of
liberalization and exception formulas acceptable to the whole WTO membership. If they
could rely on the previous Rounds for designing the liberalization formula in
manufacturing, they are the pioneers for the liberalization formula in agriculture and for
the exception formulas for all the goods. In this respect, the future WTO Rounds will
have to draw lessons from the Doha negotiating technology—its successes and its
failures.
Negotiations in Manufacturing (NAMA)
Contrary to a wide belief, the discussions on “non-agricultural market access”
(NAMA) have been as difficult as those on agricultural products. (NAMA is an awkward
expression allowing to exclude the food industry from negotiations on industrial goods
and to include it in the “agricultural” negotiations.17) But, contrary to the case of
agriculture, the Doha negotiators have benefited from the use of an efficient liberalization
16 In the Doha Round parlance, exception formulas are described as “deviations” from the liberalization formula or as “flexibilities.” This section uses the term “exception formulas” for deviations defined in a systematic way and for a broad range of WTO Members. It keeps the term “flexibilities” for exceptions specific to a very small group of countries or to individual countries. 17 Note that fish products are part of the NAMA negotiations, not of those on agriculture.
20
formula tested by previous Rounds. Difficulties were thus concentrated on defining the
desirable role of the Doha Round since this definition determines, to a large extent, the
type and magnitude of the exception formulas.
The choice of an efficient liberalization formula
The 2005 Hong Kong Ministerial confirmed the use of the “Swiss formula” as the
key liberalization formula in NAMA. A Swiss formula defines the post-Round tariff (T)
for a product as a function of two parameters only: the initial tariff (t) imposed on the
product and the reduction coefficient (c, hereafter the “Swiss coefficient”).18 More
precisely, it takes the following form: T = (ct)/(c+t). The Swiss coefficient has an
interesting feature: it gives the highest possible post-Round tariff. For instance, a Swiss
formula with a coefficient of 25 implies that the highest possible post-Round tariff will be
25 percent.
The efficiency of the Swiss formula has three dimensions: economic (items 1 to 3
below) domestic politics (item 4) and negotiating tactics (items 5 to 8).19 More precisely,
the Swiss formula:
1. Cuts high tariffs more deeply than small tariffs, hence delivering most of the
gains to be expected from freer trade (such gains come mostly from cutting
high tariffs).
2. Reduces the dispersion among tariffs, hence the magnitude of the distortions
generated by tariffs in the domestic economy—contributing to a more
efficient allocation of resources of the country.
3. Enlarges the tax base (when high tariffs are high enough to prevent or sharply
inhibit imports), hence can maintain or even increase public revenues.
18 For simplicity sake, what follows uses the term tariff as equivalent to tariff rate. 19 An interesting variant of this basic formula is T = ct/(cα + tα)1/α where ‘α’ is a “political” coefficient (to be negotiated) aiming to reduce tariff cuts in the low tariff range, hence to boost political support—a feature that could be particularly useful for negotiating on agricultural products (see below). I would like to thank Jean Messerlin for having suggested this variant.
21
4. Does not change the ranking of the existing tariffs (since it cuts all of them by
the same factor), hence minimizing the conflicts among domestic firms about
the new tariff schedule under negotiation.
5. Makes the Swiss coefficient the only element to be negotiated since initial
tariffs are given, except in case of specific tariffs (see next item).
6. Requires to shift from specific tariffs (tariffs in the domestic currency by
physical quantities of the products in question) to ad valorem tariffs (tariffs in
percent of the world price), which are much more transparent, especially when
world prices are volatile.
7. Makes easy to calculate the post-Round tariff structure, hence reducing
uncertainty for foreign and domestic negotiators and operators.
8. Allows a differentiated approach to trade liberalization by offering the
possibility to modulate the Swiss coefficients according to countries’ specific
needs.
All these points present the Swiss formula as a good illustration of the intrinsic
capacities of trade negotiations to be pro-development, without the need to make multiple
specific references to a “Development Agenda.” For instance, the Swiss formula
combines cuts of the high tariffs (high welfare gains for the liberalizing country) and the
capacity of public budget to support the domestic policy space (public investment,
domestic subsidies, etc.). It removes an implicit bias against developing countries that
tend to export products with lower unit values than developed countries’ exports, a bias
magnified when importing countries are using specific tariffs instead of ad valorem
tariffs. By providing an immediate, almost costless information on post-Round tariffs,
the Swiss formula is friendly to the small negotiating teams of most developing countries.
Last but not least, the possibility to have different Swiss coefficients for different
countries allows to take easily into account the various level of development of the WTO
Members.
That said, it took several years for many Doha negotiators from developing
countries to recognize these pro-development features and to back up the use of the Swiss
formula.
22
The Painstaking Definition of the Target of the NAMA Negotiations
Should the Doha Round focus on currently applied tariffs, and cut those tariffs in
order to provide “new additional market access”? Or should it focus on cuts in bound
tariffs (bringing them down to the level of the existing applied tariffs) and consolidate the
substantial cuts of applied tariffs already delivered by the unilateral and preferential tariff
liberalizations of the 1990s and 2000s?
Negotiators from the developed countries favor the first target, while those of the
developing countries favor the second goal. However, the business community of the
developed countries has been more ambivalent than their own negotiators. In the early
years of the Doha Round, the European business community issued a statement saying
that post-Doha tariffs should not exceed 15 percent (Businesseurope, 2001) a position de
facto consistent with the second goal since this figure is often lower than the average
current applied tariff on industrial products in many developing countries. By contrast,
the U.S. business community has been insisting on cuts in currently applied tariffs. As
years went on, the European business community has been increasingly less comfortable
with its initial position. The reason was the slowness of the negotiating process which
implied that tariffs lower than 15 percent would be enforced only by 2020 (would the
Doha Round be concluded by 2010) and not by 2010, as initially expected by the
European business community.
That said, the 2008 mini-Ministerial draft text on NAMA appears clearly tilted
towards the second target—a “binding Round.” This outcome was quite predictable
(Messerlin, 2007a) and it would bring substantial welfare gains (see above Section III).
However, as of January 2010, the question of the ultimate goal of the Doha Round is not
yet completely settled because there is still a strong opposition in some quarters, in the
U.S. mostly.
Table 4 summarizes the main components of the current draft text. There are four
Swiss coefficients, one for the developed countries and three for the developing countries
(leaving aside the LDC which have no commitment). It is important to underline that the
higher the Swiss coefficient chosen by the developing countries is (the more limited the
liberalization is), the more likely trade between developing countries is hurt. This is
because the pre-Doha high tariffs of most developing countries protect mostly domestic
industries that operate also in other developing countries because of similar comparative

advantages. In short, the Swiss formula allows each developing country to make a policy
choice that can be “development friendly” or not (developed countries have a pro-
development Swiss coefficient).
Table 4. The Liberalization and Exceptions Formulas in NAMA, December 2008
DevelopedMembers
A. Liberalization formulaSwiss coefficient Swiss8 Swiss25
B. Exception formulas No Option A Option B Option A Option B Nocoverage (tariff lines) exception 14% max 6,5% max 10% max 5% max exceptioncoverage (trade value) allowed 16% max 7,5% max 10% max 5% max allowedtariff cuts half of the keeping half of the keeping
agreed tariffs agreed tariffsformula unbound formula unbound
or no cut or no cut
Developing Members shall chose one of the three following
Swiss20 Swiss22
Swiss coefficients
Source: WTO NAMA Chair, TN/MA/W/103/Rev.3, 6 December 2008.
Figure 1 provides a graphic illustration of the various agreed liberalization
formulas. The horizontal axis gives the range of the pre-Doha tariffs (from 0 to 270
percent, the highest tariff observed in the six emerging economies analyzed in more detail
in Table 5). The vertical axis gives the corresponding post-Doha tariffs for the various
Swiss coefficients. It shows that the target of the European business community (no
tariffs higher than 15 percent) will not be met only if the pre-Doha tariffs in the
developing countries are very high—higher than 40 percent (with a Swiss25) or than 60
percent (with a Swiss20).
Figure 1. Comparing the pre- and post-Doha tariffs, December 2008
0,0
2,5
5,0
7,5
10,0
12,5
15,0
17,5
20,0
22,5
25,0
0 20 40 60 80 100 120 140 160 180 200 220 240 260 280
Pre-Doha tariffs (percent)
Post
-Doh
a ta
riffs
(per
cent
)
Swiss8 Swiss20 Swiss22 Swiss25
23
Note: The horizontal axis illustrates the pre-Doha tariffs and provides the post-Doha tariffs for the four
Swiss coefficients agreed in the December 2008 draft text (see Table 4).
This observation raises the following questions: how frequent and how high are
the “peak” tariffs—defined as tariffs higher than 15 percent? Answering these questions
requires more detailed information provided in Table 5 for five major emerging
economies and Korea.
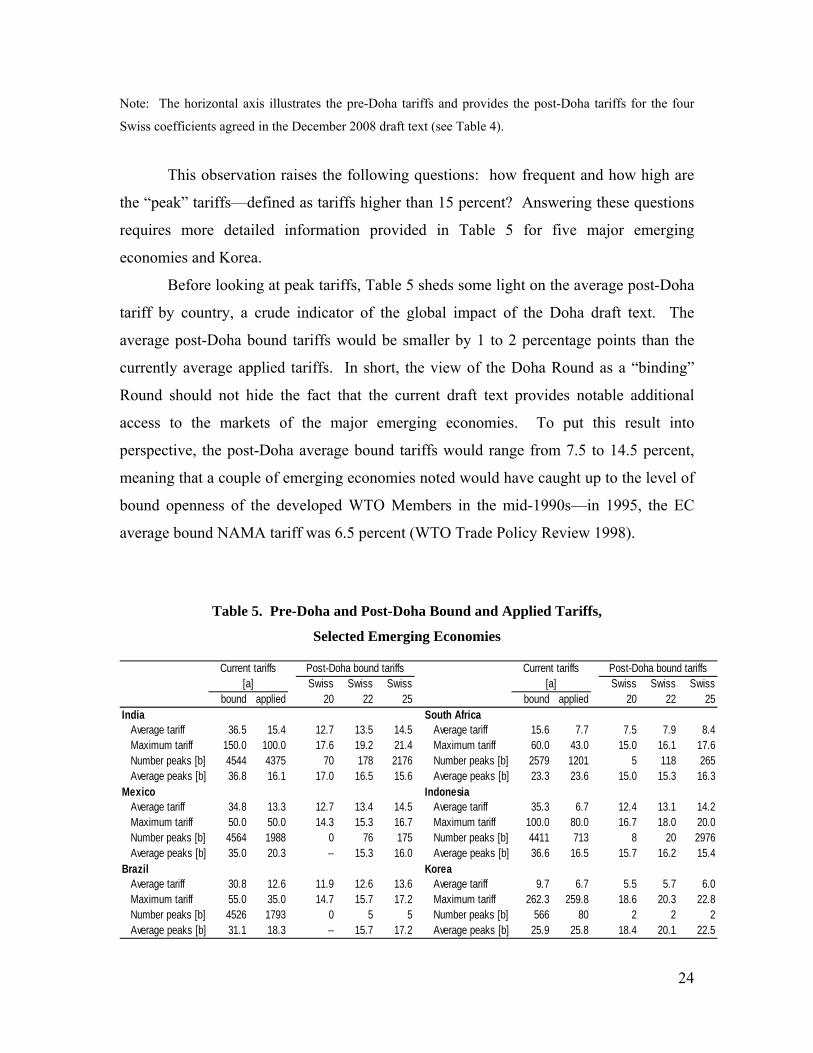
Before looking at peak tariffs, Table 5 sheds some light on the average post-Doha
tariff by country, a crude indicator of the global impact of the Doha draft text. The
average post-Doha bound tariffs would be smaller by 1 to 2 percentage points than the
currently average applied tariffs. In short, the view of the Doha Round as a “binding”
Round should not hide the fact that the current draft text provides notable additional
access to the markets of the major emerging economies. To put this result into
perspective, the post-Doha average bound tariffs would range from 7.5 to 14.5 percent,
meaning that a couple of emerging economies noted would have caught up to the level of
bound openness of the developed WTO Members in the mid-1990s—in 1995, the EC
average bound NAMA tariff was 6.5 percent (WTO Trade Policy Review 1998).
Table 5. Pre-Doha and Post-Doha Bound and Applied Tariffs,
Selected Emerging Economies
Swiss Swiss Swiss Swiss Swiss Swissbound applied 20 22 25 bound applied 20 22 25
India South AfricaAverage tariff 36.5 15.4 12.7 13.5 14.5 Average tariff 15.6 7.7 7.5 7.9 8.4Maximum tariff 150.0 100.0 17.6 19.2 21.4 Maximum tariff 60.0 43.0 15.0 16.1 17.6Number peaks [b] 4544 4375 70 178 2176 Number peaks [b] 2579 1201 5 118 265Average peaks [b] 36.8 16.1 17.0 16.5 15.6 Average peaks [b] 23.3 23.6 15.0 15.3 16.3
Mexico IndonesiaAverage tariff 34.8 13.3 12.7 13.4 14.5 Average tariff 35.3 6.7 12.4 13.1 14.2Maximum tariff 50.0 50.0 14.3 15.3 16.7 Maximum tariff 100.0 80.0 16.7 18.0 20.0Number peaks [b] 4564 1988 0 76 175 Number peaks [b] 4411 713 8 20 2976Average peaks [b] 35.0 20.3 -- 15.3 16.0 Average peaks [b] 36.6 16.5 15.7 16.2 15.4
Brazil KoreaAverage tariff 30.8 12.6 11.9 12.6 13.6 Average tariff 9.7 6.7 5.5 5.7 6.0Maximum tariff 55.0 35.0 14.7 15.7 17.2 Maximum tariff 262.3 259.8 18.6 20.3 22.8Number peaks [b] 4526 1793 0 5 5 Number peaks [b] 566 80 2 2 2Average peaks [b] 31.1 18.3 -- 15.7 17.2 Average peaks [b] 25.9 25.8 18.4 20.1 22.5
Current tariffs Post-Doha bound tariffs Current tariffs Post-Doha bound tariffs[a] [a]
24
25
Notes: (a) Year 2001 for bound tariffs, 2004 or 2005 for applied tariffs, except for India (2001). (b) Peak
tariffs are tariffs higher than 15 percent at the HS6 digit level.
Source: WITS data for the years 2004 or 2005. Author’s computations.
Turning to peak tariffs, Table 5 provides two key results. First is in terms of
frequency of the peak bound tariffs. Today, such tariffs are very common in the tariff
schedules of all the countries examined, except Korea. By contrast, peak-bound tariffs
would become a rarity with a Swiss20 coefficient, and barely notable (less than 200 tariff
lines) with a Swiss22 coefficient. They would remain a substantial factor with a Swiss25
coefficient only for India and Indonesia. Second, the peak tariffs would be drastically
cut. The average peak tariff for these six countries would decrease from 25-35 percent
before the Doha Round to 15-18 percent once the draft text would have been fully
implemented. Even more dramatically, maximum-bound tariffs would be slashed from
55-150 percent to 15-23 percent. Finally, the average of the post-Doha bound peak tariffs
for these countries would range from 15 to 17 percent, except for Korea (but only for two
tariff lines). In other words, the Businesseurope target of “no tariff higher than 15
percent” is largely achieved.
The last liberalization formula targets a specific group of countries—the LDC. In
2005, the Hong Kong Ministerial has called upon developed countries (and developing
countries on a voluntary basis) to grant, on an autonomous basis, duty-free and quota-free
(DFQF) market access for NAMA products originating from least-developed countries.
Although the draft text opens the possibility that this DFQF access should cover all the
products originating from all the LDC, it makes the DFQF a mandatory commitment for
only 97 percent of all the LDC exports—a threshold that would still easily allow the
maintenance of high tariffs on the few key exports of most LDC thanks to the exception
formulas.
The Exception Formulas: Building “Sanctuaries” of Highly Protected Products
The Doha negotiators have been much less well inspired when designing the
exception formulas. As shown in Table 4, such formulas are available only for the
developing or emerging countries choosing the Swiss20 or Swiss22 coefficients. In each
case, there are two options having the same structure—reduced tariff cuts on a notable
26
range of products (options A) or no cuts on a narrower range of products (options B).
How to assess these two options from an economic perspective?
Options A open the door to the use of Swiss40 or Swiss44 coefficients, meaning
that the highest post-Doha tariffs on the products under options A would be 40 or 44
percent. Such tariffs are very high. But, one should also recognize that developed
countries, such as the EC or the U.S., still apply similar tariffs, but on a relatively limited
number of products (textiles, clothing, leather and footwear in the U.S., and chemicals
and photographic products in the EC). The risk generated by options A thus flows
essentially from their relatively wide coverage in terms of products (450 to 650 tariff
lines in HS6 terms).
Options Bs allow unbound tariffs or no tariff cuts. As a result, they create much
more severe risks of highly protected “sanctuaries.” Since tariffs under options B remain
untouched while the rest of the tariffs will be substantially cut, tariff dispersion (possibly
escalation) will be amplified—making, from an economic perspective, options B much
more costly than options A for the country adopting them (and for the exporting trading
partners). From a political economy perspective, such exceptions will be very difficult to
eliminate in the next Rounds because vested interests will have huge incentives to keep
such high barriers—sanctuaries of highly protected sectors in largely liberalized
economies are very hard to eliminate, as best illustrated nowadays by the agricultural
sector in developed economies).
The 2008 mini-Ministerial draft text tries to limit such risks with the so-called
“anti-concentration” clause that aims at avoiding the exclusion of entire sectors from
tariff cuts. This clause imposes that at least 20 percent of tariff lines (9 percent of the
value of imports) in each HS tariff chapter would be subject to the full formula tariff
reduction. However, the impact of such a clause is ambiguous to say the least for two
reasons. First, HS chapters vary a lot in terms of number tariff lines and economic
importance. Second, this clause makes it easier for developing countries protecting a
wide range of inefficient economic activities to continue to protect them compared to
countries protecting a narrow range of industrial activities.
In addition to these exception formulas, the draft text provides for five country-
specific exceptions. However, these exceptions are much less important for the world-
trade regime than the above mentioned exception formulas because they involve mostly
27
the “negative coalitions” of small countries—hence cover a very small share of world
trade. That is:
1. LDC shall be exempt from tariff reductions (the “Round for free”), and they are
only expected to substantially increase their level of tariff bindings.
2. SVE (the largest is the Dominican Republic) shall bind all their tariff lines, with
an average bound tariff level not exceeding 30 percent or being less, depending on
the current average bound tariff of the country.
3. The New RAM (the largest ones are Ukraine and Vietnam) shall not be required
to undertake tariff reductions beyond their accession commitments. This
exception has no serious negative impact because the accession negotiations have
imposed on these countries moderate to low bound tariffs (for instance, the
average bound tariffs after full implementation of the accession protocol will be
5.1 and 10.4 percent in Ukraine and Vietnam, respectively).
4. The developing countries with initial low binding coverage (the largest one is
Nigeria) would be exempt from making tariff reductions through the formula, but
they would be requested to bind 75 to 80 percent of their tariff lines, at an average
level that does not exceed 30 percent.
5. In order to soften the impact of multilateral tariff cuts on the exports of
developing countries benefited from preferences (in other words, in order to
minimize the consequences of preference erosion), the EC and the U.S. would cut
more slowly a limited number of tariffs on products of key interest for a few
developing countries (Bangladesh, Cambodia, Nepal, Pakistan, and Sri-Lanka).
Major Pending Issues in NAMA: Sectoral Initiatives and Non-tariff Barriers
NAMA negotiations are dealing with two other main issues. First, “sectoral
initiatives” aim at full liberalization in well defined industrial sectors. Sixteen sectors
have been initially listed: cars, bicycles, chemicals, electronics, fish, forestry products,
gems and jewels, raw materials, sport equipment, healthcare, pharmaceuticals and
medical devices, hand tools, toys, textiles, clothing and footwear, and industrial
machinery. Many of these sectors face serious problems, from many NTBs to addiction
to antidumping cases to sharp downturns during the great economic crisis. As a result, in
most of these sectors, the current negotiations would seem to have a hard time to reach
28
the “critical mass” needed for concluding a deal. The sectors for which a deal seems still
possible are chemicals, electronic and electric products, and environmental products.
The second major pending issue in NAMA focuses on the elimination of NTBs
such as technical barriers to trade, sanitary measures, etc., or at least on the creation of
procedures capable to solve the NTB-related trade conflicts. The 2008 mini-Ministerial
draft text includes legal texts submitted by various WTO Members. Some of these texts
focus on horizontal (non-sectoral) solutions, such as the procedures for the facilitation of
solutions to NTBs. Other texts are “vertical” (de facto sectoral) solutions, such as how to
handle NTBs in the chemical sector or how to manage labeling in textiles, clothing,
footwear & travel goods.
However, a decision on whether all these proposals on sectoral initiatives and
NTBs would move forward to fully-fledged text-based negotiations remains to be taken,
and probably will be taken only at the extreme end of the negotiations.
The Negotiations in Agriculture20
The term “agriculture” in the Doha Round is a (deliberate?) misnomer. It hides
the fact that the products covered by the Doha negotiations are of two very different
sorts: the farm products produced by farmers, and the food products produced by
manufacturing firms, be cooperatives or private firms. This misnomer raises a crucial—
always tucked away—question: who will be the ultimate beneficiary of the post-Doha
protection—the farmers or the food industry? It is an important question because the
interests of these two groups of producers are divergent in trade-policy matters. An
increase (in relative terms) of the protection of farm products would reduce the profits of
the domestic food producers (it increases the relative costs of their farm inputs). A
relative decrease of the protection of farm products would increase the profits of the food
producers and their ability to substitute foreign farmers for domestic farmers.
Tensions between these two sectors are the most visible in the developed
countries where the food sector is well developed. Evidence provided below suggests
that, in such countries, the major beneficiaries of the Doha Round would be the food
20 See the companion chapter on agriculture by T. Josling (2011).
29
producers—not the small farmers despite the fact that such farmers are the only group in
agriculture that public opinion in developed countries would like to see protected. This is
not so surprising: the farm sector represents barely 2 to 4 percent of the GDP in
developed countries while the share of the food sector is more than double.
By contrast, the tensions between domestic farm and food sectors are more
limited in many developing countries if only because the domestic food sector is less
developed. Agriculture defined as the farm sector is the major item of the Doha
negotiations for most developing countries. It represents 40 percent of GDP, 35 percent
of exports, and 50-70 percent of total employment in the poorest developing countries
(12, 15 and 15 to 40 percent, respectively, in the other developing countries). Three-
quarter of the world’s poorest people live in rural areas, the proportion in the poorest
countries being as high as 90 percent.
That said, only a minority of developing countries is likely to specialize in
agriculture in the long run. But most of them need to go through a period where they
could accumulate wealth and skills in farm-related activities, before shifting to
manufacturing and services. In other words, agriculture in the Doha Round is not solely
a problem for major farm exporting countries such as Argentina, Brazil or Thailand. It
also is critically important for the poorest developing countries, which are often
dependent on a very small number of farm commodities, such as sugar, cotton or rice,
highly subsidized and protected by developed countries.
The Uruguay Round Heritage
The Uruguay Agreement on Agriculture was a breakthrough because it brought
the farm and food sectors back into the WTO legal framework, after five decades of a
general waiver. But it has had two severe limits.
First, it did not significantly lower the effective level of OECD farm support
below the mid-1990s. The estimated share of total support (from consumers and
taxpayers to farmers in OECD countries) in farm value added was 84 percent in 1986-
1988 and still 78 percent in 2000-2005.21 The years 2007-2008 witnessed a significant
21 These calculations rely on the assumption that value added amounts to 60 percent of production at farm gates.
30
drop of this share to 60 percent. But, this mirrors largely the boom in world-farm prices
during these two years, an evolution that has already been reversed. Meanwhile, the
number of active OECD farmers has declined more sharply since the mid 1980s, and it
will continue to do so in the coming years because of the age structure of farmers. As a
result, the total support per farmer has risen in OECD countries, sending the wrong signal
to the remaining farmers.
Second, the Uruguay Agreement on Agriculture has de facto granted a reverse
“special and differential treatment” (SDT) to developed WTO Members by allowing
many exceptions for agricultural products in WTO disciplines that are routinely enforced
for industrial products. The Agreement imposed generous caps on export subsidies (such
subsidies were not even countervailable until the so-called Uruguay “Peace Clause”
lapsed in January 2004). It allowed production subsidies having a notable impact on
trade flows in amounts much greater than the amounts effectively disbursed, creating a
phenomenon of “subsidy water” quite comparable to the “tariff water” observed in
industrial tariffs. The Uruguay Agreement also allowed a wide use of “specific” tariffs
(denominated as a fixed sum of money per unit of product, contrary to the ad valorem
tariffs expressed as a percentage of the world price). Specific tariffs are automatically
more protective when world prices decrease, that is, precisely when protection is sought
after by farmers. Finally, the Uruguay Agreement has introduced a generous use of
tariff-rate quotas (restrictions combining a lower (in-quota) tariff for a specified volume
of imports and a higher (out-quota) tariff for imports above this volume) despite the many
shortcomings of this instrument (see below).
Initial Mistakes: From the 2001 Doha Mandate to the 2004 Framework
The Doha negotiators have split their discussions into the same three components
as used by the Uruguay Agreement: tariff cuts (market access), domestic support
(subsidies, whether direct or indirect, such as those through guaranteed prices) and export
subsidies. From 2001 to August 2003, the WTO Members spent most of their time on
bickering how to define an export subsidy, which kind of formula to use for tariff cuts
and for cuts in domestic support, whether the existing “boxes” (defining acceptable and
non-acceptable domestic support) should be kept unchanged or redefined. Very little
31
came out of these discussions, except the choice of an inefficient liberalization formula
(the “tiered” formula) for cutting tariffs that happened to be a major flaw (see below).
In August 2003, a few months before the Cancun Ministerial, the EC and the U.S.
tabled a joint paper that was expected to start the real negotiations by providing figures
on the cuts in tariffs, domestic support and export subsidies that these two countries were
ready to envisage. The paper did not provide these figures, and it was badly received.
This EC and U.S. tactical mistake has had two consequences. In the short run, it
disbanded the U.S. and EC coalition, led to the collapse of the 2003 Cancun Ministerial,
and, more generally, put a severe blow to the U.S. and EC leadership in the WTO. In the
longer run, it changed the dynamics of the negotiating process by solidifying the “Trade
G20” coalition around three major developing economies (Brazil, China and India).22
The various attempts by the U.S. and EC negotiators to disband this coalition by
discouraging actual or potential members to join it were short-lived, and they were
counter-productive because they could not really change the coalition size (almost
entirely dependent from the three core countries and their few natural allies) while raising
deep resentments among the countries on which pressures were exerted.
The collapse of the U.S.-EC coalition was the starting point of a long negotiating
process leading to concrete proposals, starting with the so-called July 2004 Framework.
It is beyond the scope of this chapter to describe the tortuous path between the 2004
Framework and the draft text of the 2008 mini-Ministerials. Rather, what follows
presents the 2008 draft text that includes solidified figures in terms of liberalization and
exception formulas.
Tariff Cuts (Market Access)
Tariff cuts are the most crucial aspect of the negotiations in agriculture
(Anderson, Martin, and Valenzuela, 2005). By limiting the wedge between world and
domestic prices, small tariffs impose strong disciplines on domestic support (they make
such a policy very expensive) as well as on export subsidies (they reduce incentives to
provide them).
22 That made the WTO forum the first official witness of a process that culminated in 2009 with the emergence of the “Leaders G20” at the level of Presidents and Prime Ministers.
32
Unfortunately, the potentially high disciplining effect of tariff cuts has been
impaired by the Doha negotiators’ choice of a “tiered” liberalization formula. Table 6
summarizes the Doha draft text on market access. It shows the four tiers and the
respective cutting formulas for two groups of countries (developed and developing).23
Such a formula is much less efficient than a Swiss formula from the three
perspectives of international negotiations, domestic politics, and economics. From a
negotiating perspective, the tiered formula requires defining many parameters (the
thresholds defining the various “tiers,” the tariff cuts to enforce in each tier, etc.)
compared to one Swiss coefficient. This complexity is mirrored by the fact that it took as
much time to define one formula in agriculture for the developing countries compared to
three in NAMA. From the point of view of domestic politics, a tiered formula has
awkward discontinuities that can displace the pre-Doha and post-Doha ranking of
domestic activities in terms of tariff level. Such a feature is very likely to trigger strong
conflicts among the involved vested interests at the very final stage of the negotiations.24/
23 For simplicity sake, Table 6 does not show the five-tiers liberalization formula for the RAM. 24 Such discontinuities appear at the points connecting two different tiers. For instance, a pre-Doha tariff of 49.9 percent would be cut to a post-Doha tariff of 21.4 percent, whereas an initial tariff of 50.1 percent would be cut to a post-Doha tariff of 18.0 percent. The respective figures for initial tariffs of 74.9 and 75.1 percent would be 26.9 and 21.4 percent.
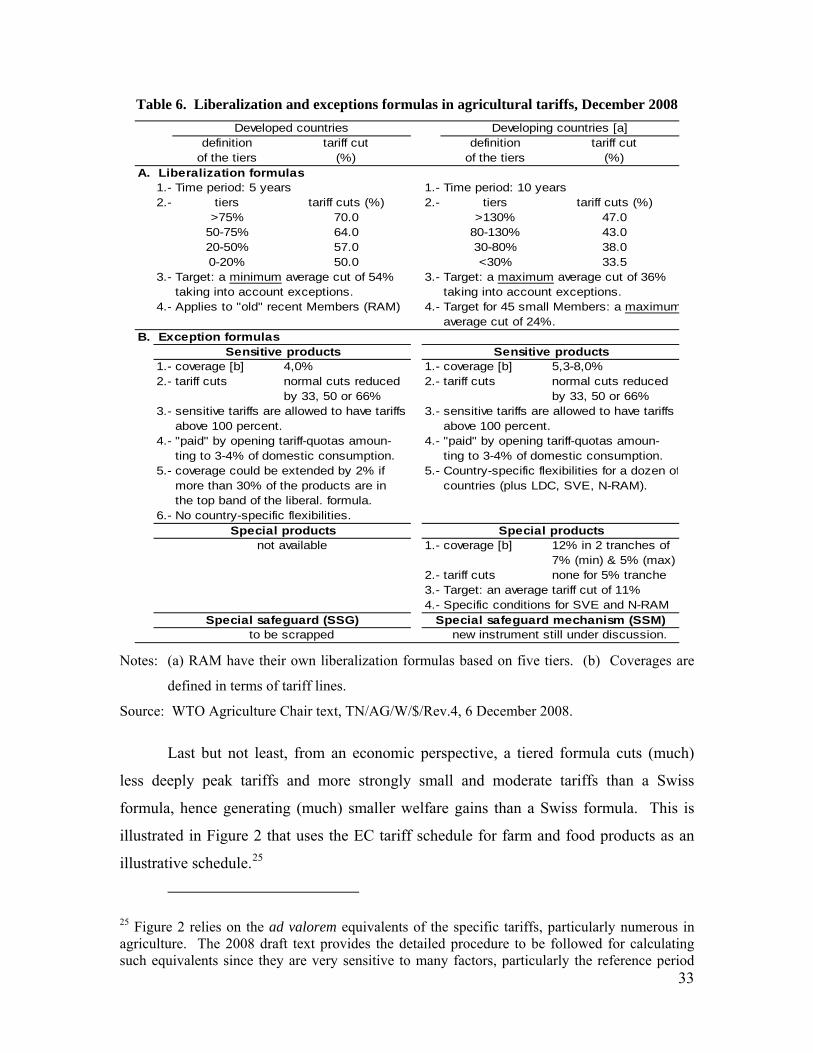
Table 6. Liberalization and exceptions formulas in agricultural tariffs, December 2008
definition tariff cut definition tariff cutof the tiers (%) of the tiers (%)
A. Liberalization formulas1.- 1.-2.- tiers tariff cuts (%) 2.- tiers tariff cuts (%)
>75% 70.0 >130% 47.050-75% 64.0 80-130% 43.020-50% 57.0 30-80% 38.00-20% 50.0 <30% 33.5
3.- 3.-
4.- Applies to "old" recent Members (RAM) 4.- Target for 45 small Members: a maximumaverage cut of 24%.
B. Exception formulas
1.- coverage [b] 4,0% 1.- coverage [b] 5,3-8,0%2.- tariff cuts normal cuts reduced 2.- tariff cuts normal cuts reduced
by 33, 50 or 66% by 33, 50 or 66%3.- sensitive tariffs are allowed to have tariffs 3.- sensitive tariffs are allowed to have tariffs
above 100 percent. above 100 percent.4.- 4.-
5.- coverage could be extended by 2% if 5.-more than 30% of the products are in countries (plus LDC, SVE, N-RAM).
6.- No country-specific flexibilities.
1.- coverage [b] 12% in 2 tranches of7% (min) & 5% (max)
2.- tariff cuts none for 5% tranche3.-4.- Specific conditions for SVE and N-RAM
taking into account exceptions. taking into account exceptions.
Developed countries Developing countries [a]
Target: a minimum average cut of 54% Target: a maximum average cut of 36%
to be scrapped new instrument still under discussion.
Country-specific flexibilities for a dozen of
not available
Target: an average tariff cut of 11%
the top band of the liberal. formula.
Special products Special products
Special safeguard (SSG) Special safeguard mechanism (SSM)
Time period: 5 years Time period: 10 years
Sensitive products Sensitive products
"paid" by opening tariff-quotas amoun-ting to 3-4% of domestic consumption.
"paid" by opening tariff-quotas amoun-ting to 3-4% of domestic consumption.
Notes: (a) RAM have their own liberalization formulas based on five tiers. (b) Coverages are
defined in terms of tariff lines.
Source: WTO Agriculture Chair text, TN/AG/W/$/Rev.4, 6 December 2008.
Last but not least, from an economic perspective, a tiered formula cuts (much)
less deeply peak tariffs and more strongly small and moderate tariffs than a Swiss
formula, hence generating (much) smaller welfare gains than a Swiss formula. This is
illustrated in Figure 2 that uses the EC tariff schedule for farm and food products as an
illustrative schedule.25
33
25 Figure 2 relies on the ad valorem equivalents of the specific tariffs, particularly numerous in agriculture. The 2008 draft text provides the detailed procedure to be followed for calculating such equivalents since they are very sensitive to many factors, particularly the reference period
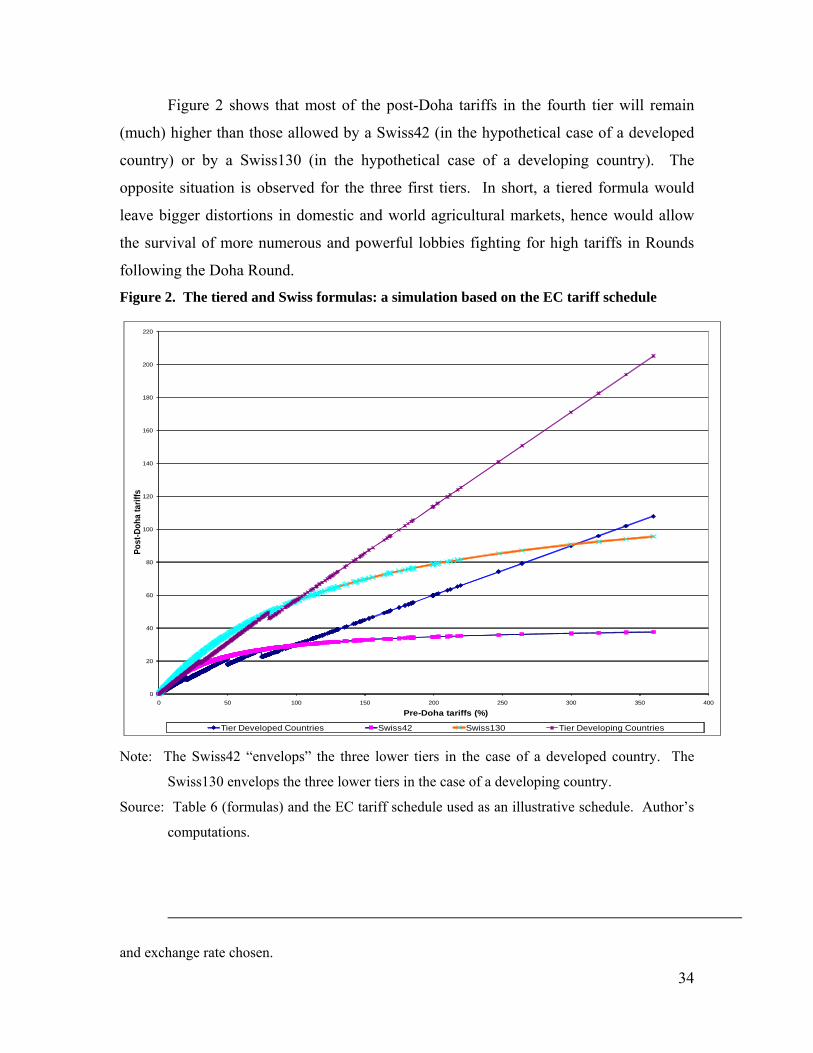
Figure 2 shows that most of the post-Doha tariffs in the fourth tier will remain
(much) higher than those allowed by a Swiss42 (in the hypothetical case of a developed
country) or by a Swiss130 (in the hypothetical case of a developing country). The
opposite situation is observed for the three first tiers. In short, a tiered formula would
leave bigger distortions in domestic and world agricultural markets, hence would allow
the survival of more numerous and powerful lobbies fighting for high tariffs in Rounds
following the Doha Round.
Figure 2. The tiered and Swiss formulas: a simulation based on the EC tariff schedule
0
20
40
60
80
100
120
140
160
180
200
220
0 50 100 150 200 250 300 350 400
Post
-Doh
a ta
riffs
Pre-Doha tariffs (%)
Tier Developed Countries Swiss42 Swiss130 Tier Developing Countries Note: The Swiss42 “envelops” the three lower tiers in the case of a developed country. The
Swiss130 envelops the three lower tiers in the case of a developing country.
Source: Table 6 (formulas) and the EC tariff schedule used as an illustrative schedule. Author’s
computations.
and exchange rate chosen. 34
35
That said, which sector—farm or food—would remain the most protected in the
post-Doha period? A precise answer requires calculations based on the countries’ tariff
schedules. Table 7 provides the result of such detailed calculations, again taking the EC
tariff schedule as an illustrative case. It clearly shows the food sector as the winner.
Such a result mirrors the tariff escalation solidified during the Uruguay Round, when
high tariffs were granted to food producers for “compensating” them for their expensive
sources of farm products. Hence, it should also be expected for the other (developed)
countries.
Table 7 provides several other interesting results. Its section A covers all the farm
and food products. It shows the Swiss coefficients that would provide the same average
tariff as the tiered formulas described in the draft text. These coefficients are substantial
(28.5 for developed countries and 87 for developing countries) with, interestingly, the
Swiss coefficient for developed countries not too far away from the highest Swiss
coefficient in NAMA for developing countries. As noted above, the Swiss formula
would rebalance tariff cuts—cutting more food tariffs and fewer farm tariffs, a result
more consistent with government pledges to protect small farmers than the Doha draft
text. Section B of Table 7 focuses on the “peak” tariffs imposed on the farm and food
products in the EC schedule of tariffs. It shows that peak tariffs are relatively similar for
both types of products, but are much more frequent in the food sector than in the farm
sector (65 percent of the number of tariff lines vs. 25−30 percent, respectively).
Interestingly, the Swiss formula would have roughly the same rebalancing effect on the
peak tariffs than on all the agricultural tariffs.

Table 7. The Post-Doha Winners: The Food vs. the Farm Sectors
Number Uruguayof tariff Boundlines tariffs [a] tiered Swiss28.5 tiered Swiss87
(%) formula formulaA. All tariffs
Farm commodities 117 19.7 7.8 7.8 12.2 12.7Horticultural products 273 13.6 6.0 7.3 8.7 10.2Semi‐processed food products 488 12.6 4.9 5.3 7.8 8.2Processed food 1120 32.6 12.3 11.9 20.0 19.4All farm and food products 1998 24.3 9.4 9.4 15.0 15.0
B. Peak tariffs (tariffs higher than 15 percent)Farm commodities 42 48.9 18.8 17.3 30.0 30.1Horticultural products 73 34.5 14.1 14.8 21.6 23.5Semi‐processed food products 93 51.9 18.5 17.0 31.6 30.1Processed food 711 47.8 17.5 15.7 29.1 26.9All farm and food products 919 47.2 17.4 15.8 28.8 27.1
Developed country Developing countryPost‐Doha bound tariffs [b]
Source: Table 6 (formulas) and the EC tariff schedule used as an illustrative schedule. Author’s
computations.
Turning to the exception formulas, Table 6 above summarizes the three main
types of exception formulas included in the 2008 draft text: sensitive products, special
products and the Special Safeguard Mechanism (SSM).
Sensitive Products.
All WTO Members would be entitled to define “sensitive” products for political
reasons, up to 4 percent (developed countries) to 5.3-8 percent (developing countries) of
the tariff lines (roughly 80 to 160 tariff lines at HS6 digit). They are eligible for reduced
tariff cuts, but these reduced cuts have to be “paid” by the introduction of tariff-rate
quotas (TRQ) amounting to 3 to 4 percent of domestic consumption. It is hard to predict
the tariff lines that will be selected. Those with the current highest out-quota tariffs seem
good candidates. But, in developed countries, the competition between vested interests
will be strong because the number of tariff lines under TRQ will decrease between the
post-Uruguay and the post-Doha regimes (for instance, from 251 to 71 in the EC case).
Things are even more complicated because there are additional constraints (for instance,
the provisions on tariff escalation or on tropical products, see below) to be taken into
account. Simulations for the EC suggest that the EC would still be able to achieve the
target imposed by the draft text of a minimum average tariff cut of 54 percent, although
36
37
the average tariff on sensitive products would only decrease from 112 to 86 percent
(Kutas, 2010).
At first glance, TRQ look like a attractive device because they give the impression
of allowing a careful management of the trade opening process. But the reality is quite
the opposite, as already witnessed by the TRQ regime introduced under the Uruguay
Agreement. The major flaw of TRQ is the difficulty of predicting their ultimate impact
because it requires a knowledge of supply and demand reactions that are rarely available
to market operators. This uncertainty is compounded by the lack of adequate data at the
disaggregated HS6 level. For instance, negotiators have been forced to lay down a
complex procedure to calculate the “domestic consumption” (the parameter on which to
apply the thresholds of 3 to 4 percent) at such a disaggregated level when only imports
and exports are available, whereas production figures are available at a much higher level
of aggregation.
Such an uncertainty opens the door to surprising outcomes. First, TRQ could be a
device-freezing market entry (contrary to their stated goal) as it has been observed under
the Uruguay Agreement. Second, if the domestic demand becomes smaller than the
TRQ quota, domestic prices reflect the low in-quota tariff, and domestic producers are
more exposed to freer trade than expected by the negotiators. Third, TRQ could also
favor an increase of imports, including (surprisingly) in the out-quota shares such as in
the EC bovine or poultry meat under the post-Uruguay regime (Kutas, 2010). Lastly, if
the domestic demand exceeds the quota, domestic prices reflect the high out-quota tariff,
generating huge rents. But, who would get such rents? The answer depends on several
parameters, but foreign exporting firms or domestic importing (food) firms—not
domestic farmers—are the most likely recipients of such rents.
Special Products.
Only developing WTO Members would be entitled to define special products
when they feel that trade liberalization of these goods would affect the country’s “food
security, livelihood security and rural development.” The potential coverage for such
products is quite wide—up to 12 percent of the tariff lines, roughly 240 tariff lines at HS6
digit level. Special products are eligible for much reduced tariff cuts, or even no tariff cut
at all. They are not to be “paid” by TRQ.
38
Special Safeguard Mechanism.
Last but not least, the Doha draft text introduces a last type of exception formula
under the form of a conditional “special safeguard mechanism” (SSM) made available
only to developing and recently acceded countries. As any safeguard, the SSM requires
the definition of the threshold allowed to trigger the measure and the type and magnitude
of the safeguard measure. Discussions on these issues have failed (Wolfe, 2009), and
have become the official reason of the collapse of the whole Doha negotiations in the
July 2008 mini-Ministerial.
By contrast, the Doha draft text scraps the “special safeguard” (SSG) created by
the Uruguay Agreement for developed Members, hence contributing to the elimination of
the “reversed SDT” enjoyed by the developed countries under the Uruguay Agreement.
A Provisional Conclusion on Exception Formulas.
Combined with the tiered formula, all these exception formulas would shape a
very uneven Doha liberalization. Farm and food products with low or moderate pre-
Doha tariffs and not subjected to one of the three exception formulas would be
liberalized. But, a substantial number of products—those with pre-Doha high tariffs or
subjected to one of the three exception formulas—would remain tightly protected,
particularly in the case of the developing countries (because of the special products and
SSM formulas). In short, the Doha Round Agreement based on the current draft text is
unlikely to open markets of critical interest for the WTO Members. In particular, trade
between developing countries will remain highly constrained.
Domestic Support
The 2008 draft text introduces two layers of cuts in trade-distorting support. First
are the cuts in the three different “boxes” inherited from the Uruguay Round Agreement,
that is:
• The Amber Box (“aggregate measure of support” or AMS) covers the
domestic support that is the most distorting because it is tightly linked to
prices (price-support mechanisms) and/or to production,
39
• The de minimis Box covers measures of similar nature as those of the Amber
Box, but in smaller amounts (they should not exceed 5 to 10 percent of farm
production),
• The Blue Box includes domestic support considered as less distorting than the
Amber Box because it is subjected to some restrictive conditions (such as
imposing production limits curbing potential over-production on direct
payments based on the number of animals or on the area planted).
All the cuts defined within each of these boxes are defined at two levels: the
country’s aggregate agricultural output, and the level of the country’s outputs of specific
products. This two-level system aims at preventing the circumvention of the Doha
disciplines on the global domestic support through transfers between different products.
The second layer of cuts in domestic support is based on a new concept created by
the Doha negotiators—the “overall trade-distorting domestic support” (OTDS), which is
the sum of the Amber, de minimis, and Blue boxes. Hence, it defines cuts in the
permitted amounts of the three boxes combined.
All these cuts are achieved by a mix of tiered formulas (the EC being the only
country in the highest tier, the U.S. and Japan pertaining to the second tier, and the other
developed and a few developing countries pertaining to the lowest tier) and caps not to go
beyond. Rather than describing all these cuts and caps in detail (see the 2008 WTO
Agriculture Chair text for a detailed description) it is more interesting to get a sense of
the impact of the Doha draft text on the OTDS and on the Amber Box (which constitute
the bulk of domestic support) in the case of the EC and of the U.S., the two major
providers of subsidies.
Table 8 presents the bound commitments taken by the EC and U.S. in the 1995
Uruguay Agreement, the effective support granted in 2004, and the estimated support for
2013. It suggests three major observations. First, the base level used by the Doha
negotiators are the Uruguay bound commitments, as in the tariff negotiations. Second,
the applied level of support in 2004 is much lower (roughly half) than the bound level
agreed in the Uruguay Round. In other words, the “water” in EC and U.S. domestic
support to agriculture is as substantial as the “tariff water” of the core developing and
emerging countries in NAMA. Third, the EC and U.S. Doha commitments defined by
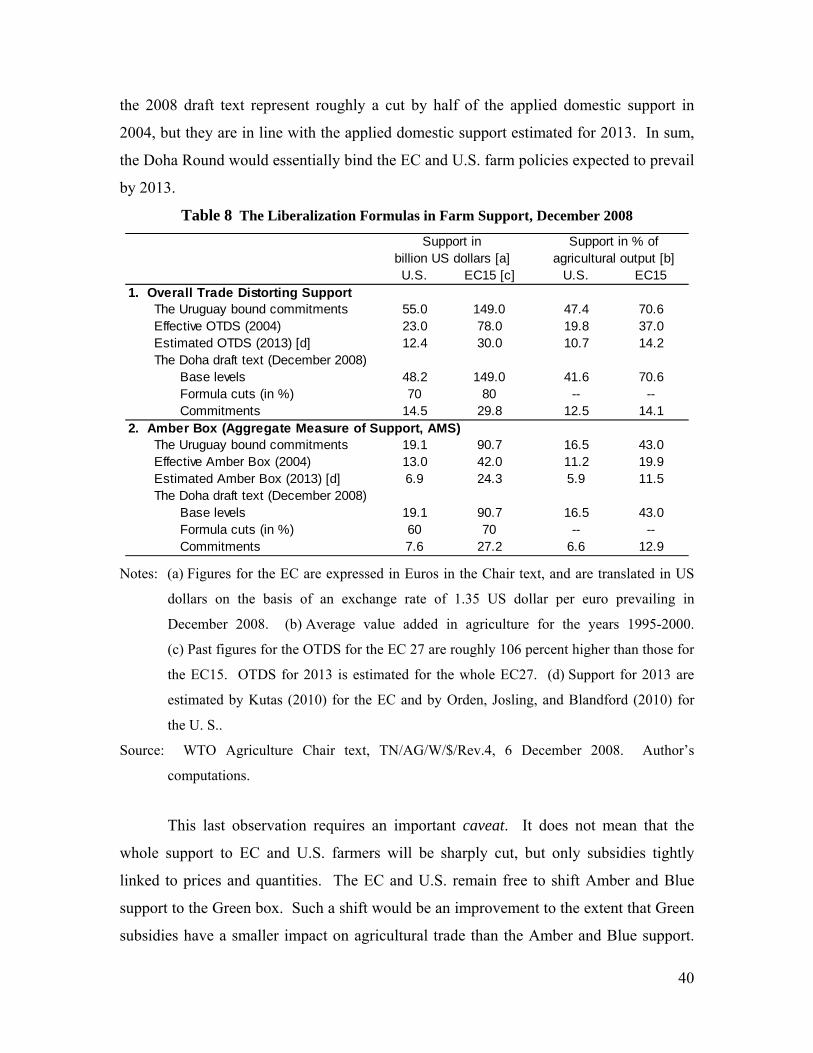
the 2008 draft text represent roughly a cut by half of the applied domestic support in
2004, but they are in line with the applied domestic support estimated for 2013. In sum,
the Doha Round would essentially bind the EC and U.S. farm policies expected to prevail
by 2013.
Table 8 The Liberalization Formulas in Farm Support, December 2008
U.S. EC15 [c] U.S. EC151. Overall Trade Distorting Support
The Uruguay bound commitments 55.0 149.0 47.4 70.6Effective OTDS (2004) 23.0 78.0 19.8 37.0Estimated OTDS (2013) [d] 12.4 30.0 10.7 14.2The Doha draft text (December 2008)
Base levels 48.2 149.0 41.6 70.6Formula cuts (in %) 70 80 -- --Commitments 14.5 29.8 12.5 14.1
2. Amber Box (Aggregate Measure of Support, AMS)The Uruguay bound commitments 19.1 90.7 16.5 43.0Effective Amber Box (2004) 13.0 42.0 11.2 19.9Estimated Amber Box (2013) [d] 6.9 24.3 5.9 11.5The Doha draft text (December 2008)
Base levels 19.1 90.7 16.5 43.0Formula cuts (in %) 60 70 -- --Commitments 7.6 27.2 6.6 12.9
Support inbillion US dollars [a]
Support in % ofagricultural output [b]
Notes: (a) Figures for the EC are expressed in Euros in the Chair text, and are translated in US
dollars on the basis of an exchange rate of 1.35 US dollar per euro prevailing in
December 2008. (b) Average value added in agriculture for the years 1995-2000.
(c) Past figures for the OTDS for the EC 27 are roughly 106 percent higher than those for
the EC15. OTDS for 2013 is estimated for the whole EC27. (d) Support for 2013 are
estimated by Kutas (2010) for the EC and by Orden, Josling, and Blandford (2010) for
the U. S..
Source: WTO Agriculture Chair text, TN/AG/W/$/Rev.4, 6 December 2008. Author’s
computations.
This last observation requires an important caveat. It does not mean that the
whole support to EC and U.S. farmers will be sharply cut, but only subsidies tightly
linked to prices and quantities. The EC and U.S. remain free to shift Amber and Blue
support to the Green box. Such a shift would be an improvement to the extent that Green
subsidies have a smaller impact on agricultural trade than the Amber and Blue support.
40
41
But, the magnitude of this smaller impact remains a debatable matter. After all, Green
subsidies would still induce farmers to produce more than in the total absence of support.
In short, it is harder to assess the true liberalization impact of the Doha draft text on farm
support that it is to assess the impact of the Doha draft text on NAMA.
Expressing domestic support in percentage of agricultural output is interesting
because such an expression is relatively similar to a tariff. Based on the average value
added in agriculture for the years 1995-2000, Table 8 shows that the Doha commitments
would reduce the share of domestic support in agricultural output value to 12-14 percent
in the U.S. and EC—a percentage close to the NAMA average tariff of emerging
economies such as Brazil or India (see Table 5). These estimates suggest that the
criterion of “a comparably high level of ambition in market access for Agriculture and
NAMA” imposed by the negotiators in the context of a “Doha Development Agenda” has
been met.
The December 2008 draft text includes many other provisions on domestic
support, but examining them in detail goes beyond the scope of a chapter. What follows
flags the most important ones.
• Almost all the commitments define precise time schedules for implementation
and substantial downpayments for the first year of implementation. The
implementation time schedule and downpayments differ greatly for developed
and developing countries, mirroring the special and differential treatment
enjoyed by developing countries.
• Caps on post-Doha support are defined with respect to the support actually
provided in 1995-2000 (the product specific Amber boxes) or to the amount of
production (de minimis box, Blue box).
• The Uruguay Blue box (direct payments based on the number of animals or on
the area planted are subjected to production limits ensuring to curb somewhat
over-production) would be complemented by a new Blue box (direct
payments based on a fixed amount of production in the past).
The domestic support component of the draft text deserves three final remarks.
First, the “Green” box (support deemed not to distort production or prices or, at least, to
cause minimal distortions) provisions will be tightened for developed countries, but made
42
laxer for developing countries in order to allow such countries to purchase farm products
for stockpiling, fighting hunger, and rural poverty, and/or buying from low-income
farmers (even at prices higher than market prices).
Second, there are special provisions for cotton, a product that has attracted
significant media attention since the early 2000s. Trade distorting domestic support for
cotton (Amber box) would be cut more substantially than for the other agricultural
products while the Blue support for cotton would be capped at one-third of the normal
limit for other farm products.
Finally, there are provisions in favor of the farmers of certain developing
countries that have indirectly benefited from OECD domestic support via preferential
access to protected OECD markets, as best illustrated by Mauritius (sugar) or certain
African or Caribbean countries (bananas) in the EC markets. Such preferential access has
allowed these farmers to sell their products on the EC markets at European prices that
were much higher than world prices. The Doha draft text allows for a slower
liberalization for products with such long-standing preferences. The list of the products
concerned is still under discussion.26 Such provisions are ambiguous, to say the least,
from a development perspective. Ending past preferences by establishing a (transitory)
preferential regime discards the crucial fact that the farmers of the developing countries
free riding on OECD support have been favored for decades at the detriment of the
competing farmers of the developing countries excluded from such OECD domestic
support.
Export Measures
Export measures have been among the least difficult topics to negotiate. A
(incomplete) draft text imposing their complete elimination by 2013 was one of the main
outcomes of the 2005 Hong Kong Ministerial. There are several reasons for such a
situation. Firstly, export subsidies per se have been almost exclusively granted by the EC
(85 percent of all export subsidies in the mid-1990s) hence putting a lot of pressures for
reform on only one WTO Member. Second, export subsidies have a bad reputation in
26 In the same vein, in December 2009, an agreement between the EC and the Latin American producers of bananas that did not have preferential market access to the EC during the last sixty years has put an acceptable end to this five decade-long dispute.
43
many corners: they are seen as a source of unfair international competition, as inefficient
in terms of food aid, as tightly related to public monopolies (state trading enterprises,
STE), etc. As a result, they have been under constant attack from all sides, from foreign
exporters to NGOs to domestic and/or foreign consumers, to domestic competition
authorities, etc. Finally, they are often perceived as subsidies targeted to large food
multinationals—most observers forget that, in fact, the multinationals “pay back” these
subsidies to farmers when they buy farm products at prices (much) higher than world
prices.
Under all these pressures, the EC has undertaken a unilateral liberalization of its
export subsidies since the mid-1990s. EC export subsidies have decreased from Euros 8
billion (the EC commitment in the Uruguay Round Agreement) to roughly 3 billion in
2003 and less than 2 billion in 2006—mirroring again a huge “subsidy water.” In 2007-
2008, EC export subsidies had almost disappeared because of the boom in world prices in
farm products, while less than Euros 0.6 billion for 2009 (half the 2008 amount) have
been included in the EC 2009 budget.
However, the 2008-2009 economic crisis has witnessed a reversal of this long
term decline, particularly in dairy products where the EC accounts for a large share of
international trade (from 20 to 35 percent, depending on the product). Another factor
raises some doubts on the ease with which a total elimination of export subsidies would
be achieved by 2013: if the total amount of export subsidies has declined, the quantities
of exports still eligible has declined more slowly, suggesting the survival of a strong
demand for such an instrument in some farm niches.
That said, the main difficulties met by the 2008 draft text were related to the
definition and treatment of export measures deemed “equivalent” to export subsidies,
such as food aid, export credits, guarantees and insurance, exporting state trading
enterprises, export restrictions, and taxes. Until recently, such instruments do not
represent a substantial amount of money. Available estimates suggest that the share of
exports subsidized by such instruments represent 2 (EC) to 5 (U.S.) percent of total
44
agricultural exports, and that the subsidy equivalent of all these instruments was smaller
than 7 percent (Hoekman and Messerlin, 2006).27
The 2008 draft text confirms the elimination of export subsidies by 2013, and it
imposes the same provisions on export credits with repayment periods beyond than 180
days. Moreover, it aims to ensure the progressive convergence of disciplines to be
imposed on export credits, export credit guarantees, or insurance programs with
repayment periods of 180 days or less (these programs should be self-financing, reflect
market consistency, and be of a sufficiently short duration so as not to effectively
circumvent commercially-oriented disciplines). It requires the elimination of the trade-
distorting practices favored by the STE, with future disciplines curbing potential
monopoly power (which could circumvent the disciplines on export subsidies)
government financing, and underwriting of losses. Lastly, the 2008 draft text aims at
eliminating commercial displacement beyond an adequate level of food aid through the
creation of a "safe box" for bona fide food aid in case of emergency, and through the
adoption of effective disciplines on in-kind food aid, monetization, and re-exports so that
there can be no loopholes for continuing export subsidization.
Major Pending Issues in Agriculture
The above description of topics included in the 2008 draft text is not exhaustive.
There are, among others, specific provisions on tariff escalation (when tariffs on
processed products are higher than those on raw materials, with a view to reduce such
escalation when it is large enough to hinder processing for export in the country
producing the raw materials) tariff simplification (with a view to minimize the number of
specific tariffs) tropical products (with a view to have faster and deeper tariff cuts on
such products), TRQ administration (shall TRQ be possible only for products already
under a TRQ regime, and what would be the TRQ regime if it can be imposed on new
products) and inflation (a topic covering price increases that could make void committed
27 These small figures are explained by the fact that the subsidy equivalent of an export credit is not the total amount of credit granted, but only the subsidized component created by the difference between the market and preferential interest rates. Similarly, what is at stake with the exporting STEs is not their whole activities, but the export subsidy equivalent provided by government financing and/or underwriting of losses.
45
limits and those that could create difficulties for developing countries facing sharp rises
in food prices). As these provisions deal with complex issues, they tend to be written in
general terms that still remain largely open to discussion in the months to come.
Besides this host of provisions, there are two major pending issues. As noted
above, the conditions for using the Special Safeguard Mechanism have not been agreed
on yet. The reason why negotiations have failed—the possibility, or not, to impose a
SSM duty higher than the post-Doha bound tariff for the product in question—does not
make much sense. Such a possibility is routinely used in antidumping, antisubsidy and
safeguard measures in NAMA. For instance, it is not uncommon that antidumping duties
on industrial products are ten times higher than bound tariffs.
The other major pending topic is geographical indications (GI), which are ruled
by the Uruguay TRIPs Agreement, but mostly concern agricultural products. 28 They
witness the opposition of the WTO Members (the so-called W52 sponsors led by the EC)
that favor a high level of GI protection based on a multilateral and mandatory register for
wines, spirits, and an undefined number of additional products, and the WTO Members
that favor a voluntary database on GI. Of course, the stricter the mandatory conditions
imposed by the register, the stronger is the implicit degree of monopoly created by the
register.
GI is a typical case of inertia in trade negotiations. This topic was already part of
the Uruguay negotiations. It continues to be tabled by the EC even though it is
questionable that a strong GI regime is in the EC’s own interests. For instance, the last
decade has given ample proof that a strong GI regime did not help the French wine
sector. Under the French strong GI regime for wines, some French vineyards have
performed very well, but others very poorly—suggesting that “something else” than
strong GI is key for success in the modern wine business. Evidence from the last decade
suggests that GI can have severe perverse effects (freezing the production technology,
28 Article 22.2 of the Uruguay TRIPs Agreement requires Members to provide the legal means (i.e., GIs) to prevent the use of any means “in the designation or presentation of a good that indicates or suggests that the good in question originates in a geographical area other than the true place of origin in a manner that misleads the public as to the geographical origin of the good,” as well as any use “which constitutes an act of unfair competition.” In contrast with patents, GIs do not aim at promoting innovation, but at giving information on “reputation.”
46
generating over-production, deteriorating quality, generating systematic misinformation,
and ignoring changes in consumers’ tastes).29 By contrast, evidence suggests that what
counts is the existence of large wine companies (such as in Champagne) capable of
meeting an ever changing demand while delivering the required level of quality and
reputation via trademarks.
V. Uncharted Territory: Services
Until 2008, the Doha negotiations in services showed little progress, despite the
fact that services represent 50 to 70 percent of the GDP of the WTO Members, and are of
prime importance for running an efficient economy.
The one-day “Signalling Conference” during the July 2008 mini-Ministerial was
the first event suggesting that things could move. Negotiators from 31 countries listed
their offers to open domestic services markets, and their requests to get better access to
foreign services markets. The day was unanimously considered a success, many
participants showing an unexpected appetite for negotiating improved market access in
services.
However, since then, negotiations in services seem to be back in limbo, a situation
that raises two different questions. Are there some intrinsic difficulties in negotiating in
services that could explain such slow progress, beyond the mere sequencing constraint?
If there are such intrinsic difficulties, what then could be the role of a multilateral Round
in opening markets in services?
The Intrinsic Difficulties in Liberalizing Services
A frequently mentioned source of intrinsic difficulties is the fact that services are
generally protected by regulations, rarely by tariffs or barriers that would be easily
measurable such as tax differentials. A second source of differences, largely ignored but
probably more crucial, is the relative weakness of the political economy of liberalization
in services compared to what happens in goods.
29 The negative consequences of strict GI have been recently illustrated by a fraud lasting over two years (on 18 millions of bottles), in which the over-production of syrah and merlot noir in Southern France (Aude) has been sold in the U.S. markets as pinot noir (Le Figaro, 20-21 February 2010, Cahier 2, page 1).
47
Regulations vs. Tariffs
As services are rarely protected by measurable barriers, negotiations in services
cannot be based on liberalization formulas comparable to those available for industrial or
agricultural products. There are two additional difficulties.
First, protection in services is embedded in regulations the main initial objective
of which was not to protect domestic services providers against foreign firms, but rather
to protect certain domestic providers against other domestic providers. For instance,
regulations limiting the entry of foreign retail firms running large outlets are the late by-
product of the decision, taken two or three decades ago, to protect domestic small shop-
keepers from domestic large stores. A corollary of this key feature is that most of the
gains from more liberalization in services would come from non-discriminatory market
opening, that is, liberalization with respect to foreign and domestic services providers.
Second, opening markets in services is rarely limited to the mere dismantlement
of the existing barriers. Rather, it generally requires the adoption of a flow of pro-
competitive regulatory reforms in the future. As a result, negotiating market access to
foreign markets in services is a bet on the willingness and the capacity of the trading
partners to deliver such a sequence of future reforms. This process is made even more
complicated because countries compete with each other on regulatory matters in a
dynamic way, with the improvement of the regulatory framework in a services sector by
a WTO Member triggering improvements of the regulatory framework of the service in
question by other WTO Members. Of course, all these future interactions cannot be
easily written down in a schedule of concessions on a year by year basis. Rather, trust in
the reform capacity of the trading partners becomes a crucial factor of the willingness of
a country to negotiate.
WTO negotiations are not well equipped to deal with such a fluid and dynamic
process. They are handicapped by the fact that the WTO is a wide forum where
Members are extremely heterogeneous in their capacity to deliver credible flows of
regulatory reforms in the future. In this context, unilateral or preferential liberalizations
seem more suitable.
However, the WTO handicap in terms of negotiating new market access in
services does not extend to the binding of existing market access since binding relies on
regulatory reforms already in place, and on the proven willingness to open the markets in
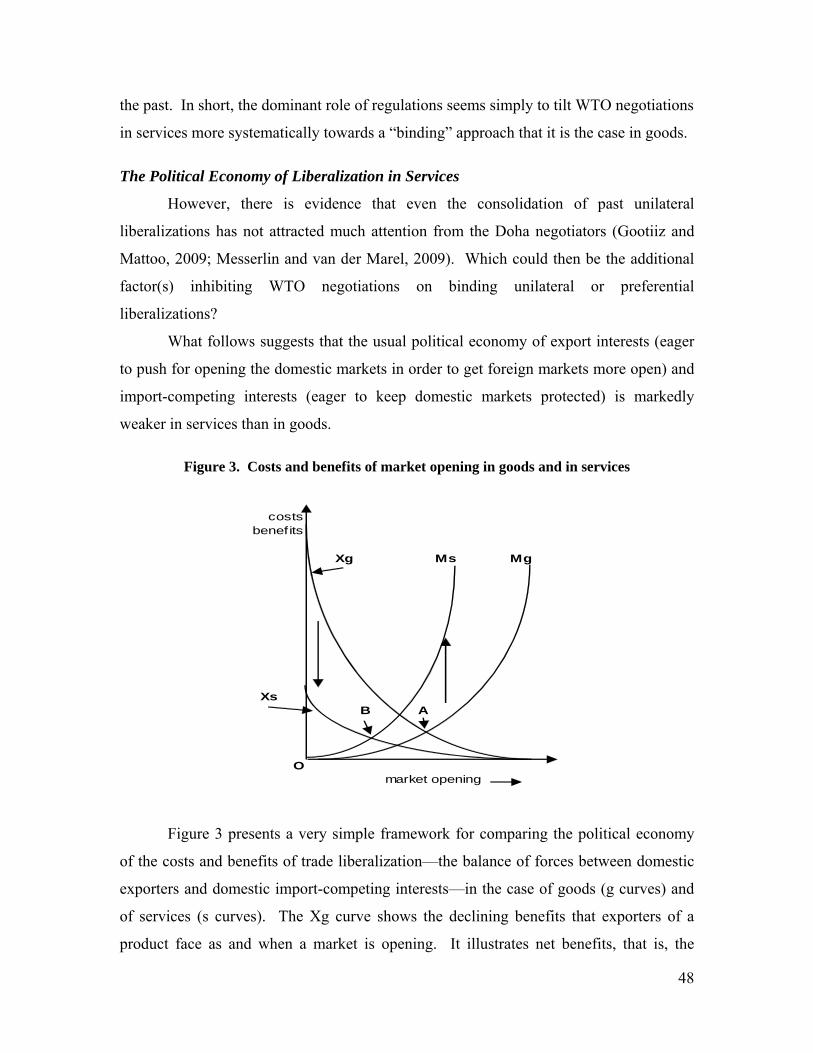
the past. In short, the dominant role of regulations seems simply to tilt WTO negotiations
in services more systematically towards a “binding” approach that it is the case in goods.
The Political Economy of Liberalization in Services
However, there is evidence that even the consolidation of past unilateral
liberalizations has not attracted much attention from the Doha negotiators (Gootiiz and
Mattoo, 2009; Messerlin and van der Marel, 2009). Which could then be the additional
factor(s) inhibiting WTO negotiations on binding unilateral or preferential
liberalizations?
What follows suggests that the usual political economy of export interests (eager
to push for opening the domestic markets in order to get foreign markets more open) and
import-competing interests (eager to keep domestic markets protected) is markedly
weaker in services than in goods.
Figure 3. Costs and benefits of market opening in goods and in services
costsbenefits
Xg Ms Mg
XsB A
Omarket opening
Figure 3 presents a very simple framework for comparing the political economy
of the costs and benefits of trade liberalization—the balance of forces between domestic
exporters and domestic import-competing interests—in the case of goods (g curves) and
of services (s curves). The Xg curve shows the declining benefits that exporters of a
product face as and when a market is opening. It illustrates net benefits, that is, the
48
49
opportunities lost by the exporters when the market is closed minus the difficulties to be
faced by these exporters when they get effective access to the market. The Mg curve
illustrates the rising costs that the import-competing producers of a product face when
their domestic market is opening. Hence, in the case of goods, the political “equilibrium”
between the two lobbies (exporters and import-competitors) is A. What follows uses the
Xg and Mg curves and the A point as benchmarks for assessing what happens in services.
In the case of goods, Figure 3 generally shows domestic exporters of certain
goods (say steel) and domestic import-competing firms producing other goods (say
clothing). In the case of services, Figure 3 would more often illustrate the situation
within the same service sector for several reasons: services are more prone to
differentiation than goods, services negotiations are more systematically sectoral than
those in products (if only because it is easier to compare offers and requests in the same
sector), etc.
Looking first at the export side, several reasons reduce net benefits from market
opening in services, compared to goods (for a description of these reasons within a
negotiating framework, see Adlung (2009)). These reasons prevail at the different stages
of the opening process—negotiation, market entry, and comparative advantages.
First, negotiating costs tend to be higher in services than in goods. Trade
negotiators have to invest in the knowledge of the service sector at stake and to learn
about the regulations, contrary to goods where they need to know only the level of the
bound and applied tariffs. In such a context, they often have to work with the agencies in
charge of regulating and monitoring a service, and these agencies are unlikely to facilitate
negotiations that could challenge their power or threaten their survival.
Second, the market entry phase requires from the exporters of the service to adjust
their strategies to the regulations and practices in their export markets. The available
empirical literature suggests that such costs are (much) higher in services than in goods
(Shepherd and Miroudot, 2009) once again making exporters of the service less
supportive of market opening.
Lastly, comparative advantages are fuzzier to grasp in services than in goods,
even though services liberalization tends to be sectoral. For instance, liberalizing
distribution services between France and Germany may induce German retailers, efficient
in medium-sized outlets (such as Aldi), to enter the French retail market. For doing so,
50
Aldi has to build medium-sized outlets in France, to hire French staff, and adapt to the
whole French regulatory environment, meaning that Aldi may lose some of its
comparative advantages in terms of capital costs, labor skills, favorable regulations in
Germany. This is quite different from what happens generally in manufacturing, where
exporting goods does not require building new factories and hiring workers in the export
market, and adjusting its whole operations for abiding by foreign regulations (a German
car exporter would expand its German units of production, increase its German
workforce, and would continue to operate mostly under German law). All these risks are
compounded by the fact that, services liberalization being often sectoral, Aldi may be
exposed to counter-offensives from French competitors in another segment of the retail
market (for instance, the French retailer Carrefour may try to enter the German
hypermarket segment) precisely when Aldi tries to enter the French market.
To sum up, the three above-described forces go in the same direction—reducing
the net benefits from market opening. As a result, the Xs curve for exporters in services
lies below the benchmark Xg curve for goods.
Turning to the import side, the Ms curve for services would lie above the Mg
curve for goods for reasons echoing those on the exporting side. First, import-competing
service providers will need to face adjustment costs in their domestic market. But,
because of the more frequent sectoral feature of services liberalization, they may also
have to pay costs for entering some segments of the foreign exporters’ market. Second,
services often involve regulatory agencies that are likely to support the import-competing
vested interests. Thus, the two forces described above go in the same direction: the Ms
curve for import-competing services lies above the Mg curve for goods.
The political-economy global equilibrium in services would be located at the left
of point A (say B) meaning a more limited market opening (see the horizontal axis) in
services than in goods. Note that, on the vertical axis, the equilibrium level of costs and
benefits in services associated with point B could be higher or lower than the level
associated to the point A.30
30 Interestingly, the fact that the political economy may be weaker in services than in goods has no clear-cut ex post impact on the adjustment costs to liberalization. For instance, the labor force that French distributors have to fire could be easily re-employed by the German distributors.
51
What then could be reasonably expected from the Doha negotiations?
The Report on the successful 2008 “Signalling Conference” does not provide any
precise information on the offers and requests evoked (it does not even mention the
names of the countries specifically interested in each service). However, it sheds some
qualitative light on the intensity and scope of the services to be liberalized among WTO
members that is summarized in the two first columns of Table 9.31
Column 1 gives a sense of how many participants manifested a serious interest in
negotiations during the Signalling Conference. Column 2 focuses on the interest shown
for two modes: mode 3 on the right of establishment and mode 4 on the movement of
natural persons. These two modes were the most contentious during the Uruguay Round
negotiations (WTO Secretariat, 2000) and, during the Doha Round negotiations, services
providers have repeatedly underlined their crucial role. Altogether, the two columns
reveal a willingness to negotiate, with a high number of participants interested in each
service, a high occurrence of offers and requests on mode 3, and even a willingness to
include mode 4 (by far the most contentious aspect of international negotiations in
services because it is often misperceived as a source of illegal immigration).
Columns 3 and 4 rely on an older source of information, namely the EC and U.S.
offers tabled in 2005 before the Hong Kong WTO Ministerial. These offers were
notoriously limited, reflecting the highly uncertain state of negotiations in manufacturing
and agriculture at this time. However, even if these offers do not provide adequate
information on the magnitude of the offers tabled in 2008, they are useful because they
give a first sense of the services in which the EC and the U.S. were already ready to move
in 2005. This is particularly the case for the EC offers that tabled notable additional
commitments, be it in terms of widening (binding the most recent ECMS at the level of
EC 1995 commitments) or deepening (offering new commitments for the EC as a whole
in terms on market access or national treatment).32 The U.S. offers present a less clear
31 Table 9 relies on Messerlin and van der Marel (2009). 32 The information in columns 3 and 4 relies on calculated indicators measuring how much the EC and the U.S. were willing to move (in terms of widening and deepening and for the four modes of supply) for each service listed in their offers (WTO, 2005a; 2005b). Weights have been given to each mode of supply by service in order to reflect their relative economic importance when aggregating the various modes. These weights are those used by the World Bank’s World
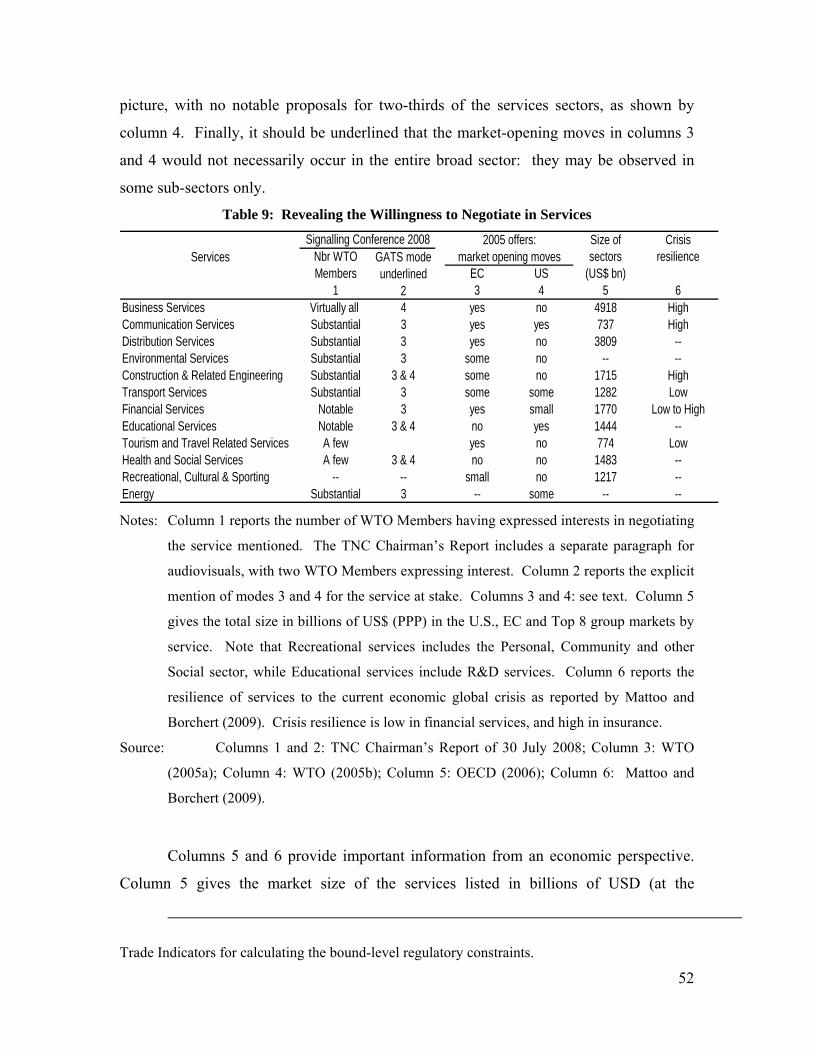
picture, with no notable proposals for two-thirds of the services sectors, as shown by
column 4. Finally, it should be underlined that the market-opening moves in columns 3
and 4 would not necessarily occur in the entire broad sector: they may be observed in
some sub-sectors only.
Table 9: Revealing the Willingness to Negotiate in Services
Size of CrisisServices Nbr WTO GATS mode sectors resilience
Members underlined EC US (US$ bn)1 2 3 4 5 6
Business Services Virtually all 4 yes no 4918 HighCommunication Services Substantial 3 yes yes 737 HighDistribution Services Substantial 3 yes no 3809 --Environmental Services Substantial 3 some no -- --Construction & Related Engineering Substantial 3 & 4 some no 1715 HighTransport Services Substantial 3 some some 1282 LowFinancial Services Notable 3 yes small 1770 Low to HighEducational Services Notable 3 & 4 no yes 1444 --Tourism and Travel Related Services A few yes no 774 LowHealth and Social Services A few 3 & 4 no no 1483 --Recreational, Cultural & Sporting -- -- small no 1217 --Energy Substantial 3 -- some -- --
Signalling Conference 2008 2005 offers:market opening moves
Notes: Column 1 reports the number of WTO Members having expressed interests in negotiating
the service mentioned. The TNC Chairman’s Report includes a separate paragraph for
audiovisuals, with two WTO Members expressing interest. Column 2 reports the explicit
mention of modes 3 and 4 for the service at stake. Columns 3 and 4: see text. Column 5
gives the total size in billions of US$ (PPP) in the U.S., EC and Top 8 group markets by
service. Note that Recreational services includes the Personal, Community and other
Social sector, while Educational services include R&D services. Column 6 reports the
resilience of services to the current economic global crisis as reported by Mattoo and
Borchert (2009). Crisis resilience is low in financial services, and high in insurance.
Source: Columns 1 and 2: TNC Chairman’s Report of 30 July 2008; Column 3: WTO
(2005a); Column 4: WTO (2005b); Column 5: OECD (2006); Column 6: Mattoo and
Borchert (2009).
Columns 5 and 6 provide important information from an economic perspective.
Column 5 gives the market size of the services listed in billions of USD (at the
Trade Indicators for calculating the bound-level regulatory constraints. 52
53
purchasing power parity exchange rates) for a group of ten countries.33 Market sizes are
a key factor determining the magnitude of consumer welfare gains and of firms
opportunities, hence the likelihood and magnitude of the negotiation success. That the
size of the agricultural and industrial markets for the ten countries amounts to roughly
US$7,900 billion and gives a good sense of the size of the market at stake in services.
In particular, Table 9 suggests three services sectors (business services,
communications and distribution) as a particularly rich potential source of negotiating
successes.
VI. Concluding Remarks
Since 2007, the world economy has been under great stress—first because of
burgeoning commodities prices, then because of the “great economic crisis” that started
in September 2009. These turbulences raise two questions with a quite different time
line.
Short-term Perspectives: Concluding the Doha Round
What could be the impact of the economic crisis on the Doha negotiations in the
short and medium term? It is often said that trade negotiations are easier during crises.
But, the current crisis is so much more severe and global than the previous ones
(Baldwin, 2010) and its exit phase may be so perilous that the past does not look to be a
robust guide.
That said, the great fear prevalent in mid-2008 of a significant slippage in
protection during the crisis did not materialize—so far (Messerlin, 2010). During the
eighteen months, none of the key countries that could have easily (from a WTO legal
perspective) increased its applied tariffs to the higher bound levels (see Table 2) has done
so.34
33 The ten countries (Brazil, Canada, China, EC, Japan, India, Korea, Mexico, Russia, and the U.S.) produce more than 80 percent of the value added in the dozen or so services sectors with available infomation in National Accounts. For details, see Messerlin and van der Marel (2009). 34 The only country showing signs of reversal is Russia, not a WTO Member.
54
This happy surprise may have a positive impact on the Doha deal. By not
increasing their applied tariffs up to their (much) higher bound tariffs during the current
crisis, the key emerging and developing economies have shown their revealed preference:
they have kept unchanged their applied tariffs for their own benefit. This behavior
undercuts their claim that they provide a huge favor to developed countries when cutting
their bound tariffs, hence that they should get generous exception formulas.
Consequently, negotiators from the key developing and emerging countries should
abandon such a claim, and agree on tightening somewhat the exception formulas,
particularly the options B in NAMA.
However, it takes two to tango. Such a restraint on their current requests by the
key developing and emerging economies should be met by a similar restraint by the
developed WTO Members on their own requests. In particular, developed countries
should abandon their claims for additional market access (deeper cuts in the applied
tariffs than those already agreed by the developing and emerging economies) and agree
on a “binding Round.” If they do not make such a move, developed countries should be
ready to face the collapse of the Doha Round (or its long hibernation), hence the risks
associated to permanent huge “water” in the key developing and emerging markets of
goods and services. The costs of such risks are likely to increase in the future, with the
increasing economic size of the key developing and emerging countries (once bigger,
these key countries may feel increasingly free to behave unilaterally).
It remains that restraints in agriculture and NAMA negotiations from both sides
will not be enough to conclude the Doha Round. There is the need for an additional,
mutually beneficial, booster that only services can provide. Services can attract the
support of the business community much more than any other conceivable trade-related
issue (such as intellectual property rights, norms, non-tariff barriers, public procurement,
rules, etc.). They are the largest source of opportunities for firms for three reasons: their
sheer size (50 to 75 percent of GDP), their ubiquitous presence (even manufacturing or
agrobusiness firms have a significant share, often about 50 percent, of their turnover in
services), and their high level of protection—services are on average twice more
protected than goods (Shepherd and Miroudot, 2009). The sheer binding of the services
liberalization of the last fifteen years would provide sizable gains for consumers all over
the world.
55
The question then is: how to relax the constraints of the Doha sequencing (getting
results in agriculture and NAMA before negotiating in services) and of the complexity of
services negotiations. One possibility would be to start exploratory talks on services in a
much smaller forum than the WTO, before repatriating them in the WTO if these talks
are promising (Messerlin and van der Marel, 2009). For instance, such talks would be
limited to the largest world economies—roughly ten, a group small enough to keep
negotiations manageable and large enough to cover more than 80 percent of world
production in services. Such talks could start by a transatlantic, transpacific (APEC) or
Eurasian dialog—it does not really matter because as soon as such a dialogue starts,
dynamic forces will expand it to the other, not yet involved, large economies.
Alternatively, such talks could start directly under the aegis of the G20 Summits. If
promising, the results of these talks would then constitute the embryo of Doha
negotiations in services.
Medium and Long-term Perspectives: WTO Reforms
Clearly, the nature of the WTO is changing. A successful Doha Round would
make this evolution even clearer because it will leave developed countries with
insignificant tariffs, key developing and emerging economies with moderate bound tariffs
and often small applied tariffs. In short, the times of wide-ranging negotiations on tariffs
would be almost over for 80 percent of the world trade—it is “death by success.” The
WTO current business as the key negotiating forum on tariff cuts in goods will be mostly
limited to the large but fragmented group of small developing economies.
Does this mean that the WTO as it is has lost its centrality (Baldwin and
Carpenter, 2009)? Not really, for three reasons. First, the WTO negotiating process in
goods will remain central for the many small developing countries that have chosen to
join negative coalitions in the Doha Round (see section II). The development impact of
multilateral trade negotiations between these countries will thus remain high. Second, the
WTO will remain the ultimate forum for all its Members for binding market access in
services—once again by far the largest share of economic activity in every domestic
economy. Last but not least, the WTO will keep its role of “rule guardian,” based on its
dispute settlement mechanism.
56
All this requires reforms of the way the WTO works. First, Rounds should be
shorter and more frequent. This is not a new idea, but so far, it has been justified by
unconvincing reasons, such as negotiator fatigue. It has a much firmer ground when it is
understood that short Rounds would fit much better the agendas of the business
community (which looks for quick results) as well as the political constraint imposed by
the fact that, during the last three decades, democratically elected governments lack
strong majorities, hence are unable to deliver grand visions (Messerlin, 2007b).
Second, the Single Undertaking principle needs to be reviewed. In the Doha
Round, it has fuelled a process of systemic evasion through “negative coalitions.” The
inevitably ad hoc definitions of such coalitions generate an irrational, chaotic and
ultimately unjust WTO forum (a coalition may be accessible to some Members, but not to
other very similar countries). The Single Undertaking principle should be re-interpreted
as enforceable at distant periods of time, not at every Round (as it was de facto the case
under the GATT regime). Between two enforcements, Members should be allowed to
“discriminate positively,” that is, to open further their markets by participating to
plurilateral agreements (Codes in GATT parlance) without waiting for an agreement
among all the Members.
These two suggestions focus on WTO traditional roles. In order to increase its
centrality, the WTO should also start to tackle activities that it has left aside so far
because its whole energy was focused on negotiations. One of the most urgent tasks is an
adequate monitoring of the Members’ obligations. Today, such a monitoring is
extremely poor. In this context, the current crisis has opened interesting perspectives. In
2009, the WTO (with the OECD and UNCTAD) has been asked by the G20 Summits to
monitor changes in tariffs and measures that could become trade barriers.
That is an interesting start. But, such a monitoring is of little help if there is no
reasonably informed benchmark of the changes in tariffs and other trade barriers that are
routinely taken by the WTO Members. Interestingly, a first attempt to provide such an
estimate suggests a non-negligible routine of 4 percent of tariff line changes every year
(Bouet and Laborde, 2009).35 Such benchmarks are crucial for assessing the true level of
35 These estimates rely on tariffs alone at the HS6 level. According to Evenett (2009), this threshold has been reached during the last 18 months. However, Evenett’s calculations are based
57
resilience to crisis of trade policies in the coming years. Another possible extension of
the monitoring activities would be an economic analysis of the potentially most damaging
trade barriers.
These tasks will keep the WTO central whether it has the direct capacity to do
them or whether it has only the capacity to flag the issues. For instance, the WTO is the
best equipped international institution for monitoring tariff increases, but it is not for
monitoring increases in subsidies or for analyzing the most dangerous shifts in
antidumping activity (likely to be seen beyond the WTO mandate by a large share of its
membership). It remains that flagging these issues would be a robust contribution of the
WTO to the world trade system.
Last but not least, the WTO could envisage a reform of international disciplines,
for instance stricter rules in subsidies. However, such a goal requires serious analysis.
The disappointing example of the EC rules in subsidies during the past years (these rules
are much stricter and economically sound than the WTO rules) shows that enforcing
strict international disciplines relies crucially on domestic institutions capable of raising a
strong domestic voice supporting international disciplines. Such domestic institutions are
essential for shifting the attention away from the costly and inefficient policy space
offered by trade policies to the much wider, better targeted, and more efficient domestic
policy space delivered by the many available domestic policies. All this is particularly
true for the trade-related issues—adjustment policies, norms and standards in goods,
regulations in services, climate change, etc.—that will make the WTO busy in the
future.36
on HS4 data, and include many trade barriers other than tariffs. As a result, a rigourous test needs yet to be done. 36 As of today, the best illustration of such institutions is Australia’s Productivity Commission (2009). Such domestic institutions have two key additional virtues. First, by nature, they are very sensitive to the risk of attrition of competition in the markets of many goods and services often generated by deep crises. Second, their strength may allow taking some risks in the world trade regime and in the WTO—for instance, when opening or re-opening the thorny negotiations on the rules on contingent protection (particularly, safeguards).
58
References
Adler, M., C. Brunel, G.C. Hufbauer and J.J Schott (2009) “What’s on the table? The
Doha Round as of August 2009.” Working paper 09-6. Peterson Institute for
International Economics. Washington.
Adlung, R. (2009) “Services Negotiations from a WTO/GATS perspective: in search of
volunteers,” WTO Secretariat. WTO. Geneva.
Anderson, K., W. Martin and E. Valenzuela (2005) “Why market access is the most
important of agriculture’s “three pillars” in the Doha negotiations.” Trade note
26. World Bank. Washington, DC.
Australian Productivity Commission (2009) “Reform beyond the crisis.” Annual Report
2008-2009. Australian Government. http://www.pc.gov.au Canberra.
Baldwin, R.E. (1986), “Toward more efficient procedures for multilateral trade
negotiations” Aussenwirtschaft 41(Heft II/III):379-94.
Baldwin, R and T. Carpenter (2009) “Why not in the WTO? The erosion of WTO
centricity in trade liberalization,” Centre for Trade and Economic Integration, The
Graduate Institute, Geneva.
Baldwin, R (2009) “The great trade collapse: Causes, consequences and prospects,”
VoxEU.org Publishers.
Blustein, P. (2009) “Misadventures of the Most-Favored Nation, clashing egos, inflated
ambitions and the great shambles of the world trading system.” Public Affairs.
Bouet and Laborde (2009) “The potential costs of a failed Doha Round,” Discussion
paper 886. IFPRI, Washington, DC.
Businesseurope (formerly UNICE) (2001) http://www.businesseurop.eu (search for the
page on WTO).
Evenett, S. (2009) “Crisis-era protectionism one year after the Washington G20
meeting.:’ In R. Baldwin (editor), “The great trade collapse: Causes,
consequences and prospects.” VoxEU.org Publishers.
Gootiiz, B. and A. Mattoo (2008) “Services in Doha: What’s on the table?” Mimeo.
August. World Bank. Washington, DC.
59
Groser, T., 2007. “Saving the Doha Round: The need for political leadership.”
Conference on “Saving the Doha Round and delivering on development,”
Ministry of Trade, New Delhi. Mimeo. July 4.
Hoekman, B., and P. Messerlin. 2006. “Removing the Exception of Agricultural Export
Subsidies.” In K. Anderson and W. Martin (eds) “Agricultural Trade Reform and
the Doha Development Agenda.” Basingstoke, U.K.: Palgrave Macmillan.
Hoekman, B., W. Martin and A. Mattoo (2009) “Conclude Doha: It Matters!” Policy
research working paper. World Bank. Washington, DC.
Hoekman, B. and A. Nicita (2010) “Assessing the Doha Round: Market access,
transaction costs and aid for trade facilitation.” Journal of International Trade and
Economic Development. Volume 19, No.1, 65-79.
Ismail, F. (2009) “Reforming the World Trade Organization: Developing countries in
the Doha Round.” CUTS International and Friedrich Erbert Stiftung. Geneva
Josling, T. (2011) “Protection, Subsidies and Agricultural Trade,” in Arvid Lukauskas,
Robert M. Stern, and Gianni Zanini, Handbook of Trade Policy for Development.
Oxford University Press, forthcoming.
Kutas, G (2010) “Impact of the Doha Round on the European agricultural sector.” PhD
thesis. Sciences Po Paris.
Laborde, D., W. Martin and D. van der Mensbrugghe (2009a) “Implications of the 2008
Doha draft agricultural and non-agricultural market access modalities for
developing countries.” Mimeo. IFPRI/World Bank, Washington, DC.
Laborde, D., W. Martin and D. van der Mensbrugghe (2009b) “Measuring the benefits of
global liberalization with a consistent tariff aggregator.” Mimeo. IFPRI/World
Bank, Washington, DC.
Mattoo, A. and I. Borchert (2009) “The Crisis-Resilience of Services Trade,” Policy
research working paper, World Bank: Washington DC.
Messerlin, P. (2007a) “The Doha Round: Where do we stand?,” Working Paper.
September. http://gem.sciences-po.fr Groupe d’Economie Mondiale at Sciences
Po. Paris.
Messerlin, P. (2007b) “How Much Further Can the WTO Go? Developed Countries
Issues.” Trade Policy Monitoring Center, CEPR and Kiel Institute.
60
Messerlin, P. (2008) “Walking a Tightrope,” German Marshall Fund and GEM Working
Paper. June. Washington and Paris.
Messerlin, P (2010) “A significant slippage in protectionism? Not yet.” In S. Evenett, B.
Hoekman and O. Cattaneo (editors). “Effective crisis response and openness:
Implications for the trading system.” World Bank and CEPR. Washington and
London.
Messerlin, P and E. Van der Marel (2009) “Leading with services: The dynamics of
Transatlantic negotiations in services.” GEM Working Paper. September.
http://gem.sciences-po.fr Groupe d’Economie Mondiale at Sciences Po. Paris.
Orden, D T. Josling and D. Blandford (2010) “WTO Disciplines on Agricultural Support:
Seeking a Fair Basis for Trade,” in process
Polanski, S. (2006) “Winners and losers: Impact of the Doha Round on the developing
countries.” Carnegie Endowment Report. Washington, DC.
Shepherd, B. and S. Miroudot (2009) “Leveraging in services to consolidate the global
economic recovery: An agenda for the G20.” GEM policy brief. July
http://gem.sciences-po.fr Groupe d’Economie Mondiale at Sciences Po. Paris.
Wallenberg, M. (2006) “Business and Trade Liberalization, address to the ECIPE
Launch Conference,” 7 November, ECIPE, Brussels (http://www.ecipe.org).
Wolfe, R (2009) “The Special Safeguard fiasco: The peril of inadequate analysis and
negotiations.” World Trade Review, Vol.8:4, 517-544.
World Bank (2002) “Global Economic Prospects 2005: Making world trade work for the
world’s poors.” World Bank, Washington, DC.
World Bank (2005) “Global Economic Prospects 2005: Trade, regionalism and
development,” World Bank, Washington, DC.