the dutch private rental sector review amended 19 dec zarah
TRANSCRIPT

WORKING PAPER — NOVEMBER 2013BOLIGØKONOMISK VIDENCENTER
The Dutch Private Rented Sector

THE DUTCH PRIVATE
RENTED SECTOR
Jonathan Fitzsimons
November 2013
The Knowledge Centre for Housing Economics

I
TABLE OF CONTENTS
LIST OF FIGURES ............................................................................................................................................. IV
LIST OF TABLES ............................................................................................................................................... V
ABBREVIATIONS ............................................................................................................................................ VI
PREFACE ....................................................................................................................................................... VII
CHAPTER 1: INTRODUCTION ............................................................................................................................ 1
CHAPTER 2: DUTCH TENANCY LAW AND LAW OF RENT REGULATION .............................................................. 2
INTRODUCTION AND LEGAL AUTHORITY ....................................................................................................................... 2
Introduction and Principles of Tenancy Law .................................................................................................. 2
Were these rules based on a particular philosophy? ..................................................................................... 3
Constitutional and International Instruments Influence on Tenancy Law Provisions .................................... 3
Allocation of Competences in the Legislative Jurisdiction of Tenancy Law .................................................... 4
Acts and Regulations Structuring Current Tenancy Law ................................................................................ 4
Legal Concept of a Lease Contract ................................................................................................................. 5
Social Regulations Affecting Private Tenancy Contracts ................................................................................ 6
Tenancy Law and the Role of Tenants Associations ....................................................................................... 8
Tenancy Law and the Courts .......................................................................................................................... 9
TENANCY LAW ...................................................................................................................................................... 10
The Conclusion of a Tenancy Contract ......................................................................................................... 10
Obligations of the landlord .......................................................................................................................... 11
Obligations of the tenant ............................................................................................................................. 11
Rent.. ........................................................................................................................................................... .12
Rent Increase ............................................................................................................................................... 12
Mandatory and Dispositive Rules ................................................................................................................ 15
Sharing with a Third Person ......................................................................................................................... 15
Succession of Contracts ................................................................................................................................ 17
Student Homes ............................................................................................................................................. 17
Duration and Termination of the Contract .................................................................................................. 18
Deposits ....................................................................................................................................................... 20
Utilities. ........................................................................................................................................................ 20
CHAPTER 3: THE POINTS SYSTEM FOR RENT REGULATION ............................................................................. 21
INTRODUCTION ..................................................................................................................................................... 21
THE FUNCTIONING OF THE POINT SYSTEM .................................................................................................................. 21
Size of Rooms (1 point per m²) ..................................................................................................................... 21
Size of Other Spaces (¾ point per m²) .......................................................................................................... 21
Heating ........................................................................................................................................................ 22
Thermal Insulation (up to 15 points per property) ....................................................................................... 22
Kitchen ......................................................................................................................................................... 22
Bathroom ..................................................................................................................................................... 22
Age of Property: Removed since 1 July 2004................................................................................................ 23
Private Outdoor Space (maximum 30 points) .............................................................................................. 23
Housing Type ................................................................................................................................................ 23
Living Environment (maximum 25 points) ................................................................................................... 24
Annoying Situations (up to 40 points deduction) ......................................................................................... 24
Services Offered in the Dwelling (increase by 35 points) ............................................................................. 24
Extra Points in Scarcity Areas ....................................................................................................................... 24
POINTS DETERMINE WHETHER A DWELLING IS WITHIN REGULATED RENT REGULATION ...................................................... 25
RENT INCREASES FOR DWELLINGS WITH RENT UNDER €681.02..................................................................................... 26
RENOVATION AND RENT INCREASES .......................................................................................................................... 28

II
POSITIVES OF THE POINTS SYSTEM ............................................................................................................................ 32
Simplicity ...................................................................................................................................................... 32
Predictability ................................................................................................................................................ 33
Maintaining an Affordable Market .............................................................................................................. 33
NEGATIVES OF THE POINTS SYSTEM .......................................................................................................................... 34
Too Much Detail ........................................................................................................................................... 34
Regional Diversity of the PRS ....................................................................................................................... 34
Rental Price Failing to Relate to the Points .................................................................................................. 34
Unfurnished Dwellings ................................................................................................................................. 35
Unregulated Utilities .................................................................................................................................... 35
REFORMS TO THE POINTS SYSTEM ............................................................................................................................ 36
Market Value Points..................................................................................................................................... 36
Energy Efficiency .......................................................................................................................................... 37
Income Assessed Rent Increases .................................................................................................................. 42
Landlord Levy ............................................................................................................................................... 43
CONCLUSION ........................................................................................................................................................ 43
CHAPTER 4: INSTITUTIONS ............................................................................................................................. 44
THE RENT COMMISSION ......................................................................................................................................... 44
THE SUB-DISTRICT COURTS ..................................................................................................................................... 48
THE COURT OF APPEAL ........................................................................................................................................... 49
THE SUPREME COURT ............................................................................................................................................ 49
DEBT COLLECTION AGENCIES AND BAILIFFS .................................................................................................................. 49
NOTARIES ............................................................................................................................................................ 50
TENANTS DOMES (HUURDERSKOEPELS) ..................................................................................................................... 50
URBAN TENANTS ORGANISATIONS............................................................................................................................ 51
NEIGHBOURHOOD GROUPS ..................................................................................................................................... 51
TENANCY ORGANISATIONS (LOCAL) .......................................................................................................................... 51
TENANCY ASSOCIATION (WOONBOND) ..................................................................................................................... 52
THE MINISTER FOR PUBLIC HOUSING ........................................................................................................................ 52
WSW (WAARBORGFONDS SOCIALE WONINGBOUW) .................................................................................................. 52
CFV (CENTRAAL FONDS VOLKSHUISVESTING) .............................................................................................................. 53
IVBN (VERENIGING VAN INSTITUTIONELE BELEGGERS IN VASTGOED) .............................................................................. 54
AEDES ............................................................................................................................................................... 55
CONCLUSION ........................................................................................................................................................ 56
CHAPTER 5: THE DUTCH HOUSING MARKET................................................................................................... 57
INTRODUCTION ..................................................................................................................................................... 57
ECONOMY ........................................................................................................................................................... 57
RESPONSE TO THE FINANCIAL CRISIS ......................................................................................................................... 61
DEMOGRAPHICS AND DEMAND FOR PRS DWELLINGS ................................................................................................... 64
HIGHLY LEVERAGED MORTGAGES ............................................................................................................................. 67
Tax Deductibility .......................................................................................................................................... 68
Mortgage Code of Conduct (Gedragscode Hypothecaire) ........................................................................... 70
National Mortgage Guarantee Fund (Nationale Hypotheek Garantie, NHG) .............................................. 71
Duration ....................................................................................................................................................... 72
Mortgage Products ...................................................................................................................................... 72
Interest Rate Fixing and Repayments .......................................................................................................... 73
Risks ............................................................................................................................................................. 75
LOW SUPPLY ELASTICITY ......................................................................................................................................... 77
THE DUTCH PRIVATE RENTAL MARKET AS AN INVESTMENT CLASS................................................................................... 79
CONCLUSION ........................................................................................................................................................ 81
CHAPTER 6: HOME-OWNERSHIP AND THE DUTCH POLITICAL ECONOMY ....................................................... 82

III
INTRODUCTION ..................................................................................................................................................... 82
FISCAL SUBSIDIES ON HOME OWNERSHIP IN THE NETHERLANDS ..................................................................................... 84
Fiscal Impact ................................................................................................................................................ 84
Pressure on the Dutch Government to Reduce the Fiscal Debt .................................................................... 85
A “NEUTRAL” TAX SYSTEM ........................................................................................................................... 86
Debate About The Justifications of Home-Ownership ................................................................................. 89
Impact of the Removal of the Subsidy for Home-Ownership ....................................................................... 90
POLITICAL ECONOMY ............................................................................................................................................. 91
DISTRIBUTIONAL SPREAD OF SUBSIDIES IN THE MARKET: HOME-OWNERSHIP FOR THE RICH, TENANCY FOR THE POOR ............. 95
CONCLUSION ........................................................................................................................................................ 98
CHAPTER 7: HOUSING ASSOCIATIONS............................................................................................................ 99
INTRODUCTION ..................................................................................................................................................... 99
AN EXPANSIVE APPROACH OF PUBLIC HOUSING POLICY ................................................................................................ 99
RESIDUAL AND UNITARY RENTAL MARKETS .............................................................................................................. 101
HISTORY OF THE HOUSING ASSOCIATIONS ................................................................................................................ 103
The Establishment of Housing Associations ............................................................................................... 103
1960s Strengthening of Power ................................................................................................................... 103
1990s Withdrawal of Government Support ............................................................................................... 104
HOUSING ASSOCIATIONS OWNERSHIP OF HOMES ...................................................................................................... 108
CROWDING OUT PRIVATE INVESTMENT ................................................................................................................... 110
Argument 1: Under-charging Rents ........................................................................................................... 110
Argument 2: High Income Tenants in Social Housing ................................................................................ 112
Argument 3: Huge Financial Capital .......................................................................................................... 114
THE IMPORTANT ROLE OF THE HOUSING ASSOCIATIONS IN CREATING A UNIQUE SOCIAL HOUSING MIX ................................. 115
Response 1: Housing Association Rents Not Significantly Under Charged................................................. 116
Response 2: Social Mix of Income a Successful Social Policy...................................................................... 117
Response 3: Financial Benefits Not Significant .......................................................................................... 117
EU COMPETITION AND STATE AID LAW .................................................................................................................... 118
Article 107 (ex Article 87 TEC) .................................................................................................................... 120
Article 101 (ex Article 81 TEC) .................................................................................................................... 121
Article 106 (ex Article 86 TEC) .................................................................................................................... 121
Effects of EU Competition Policy on Dutch Housing Policy ........................................................................ 122
REFORMS OF THE HOUSING ASSOCIATIONS .............................................................................................................. 124
New Government, New Priorities ............................................................................................................... 124
Home-ownership: The Elephant in the Room ............................................................................................ 124
Current Proposed Reforms for the Housing Associations........................................................................... 125
An Investor View of the Reforms ................................................................................................................ 127
Current Financial Pressures on the Housing Associations .......................................................................... 128
CONCLUSION ...................................................................................................................................................... 129
CHAPTER 8: CONCLUSION: DUTCH HOUSING POLICY AS A LONG TERM PLAN .............................................. 131
BIBLIOGRAPHY ............................................................................................................................................. 133
ANNEX 1: TAX IN THE DUTCH PRS ................................................................................................................ 140
TAXES FOR PRIVATE LANDLORDS ............................................................................................................................ 140
Individual ................................................................................................................................................... 140
Private individual landlords........................................................................................................................ 141
CORPORATE LANDLORDS ....................................................................................................................................... 142
HOUSING ASSOCIATIONS ....................................................................................................................................... 142
TENANTS ........................................................................................................................................................... 142
ENERGY SAVING MEASURES ................................................................................................................................... 143
FOCUS OF TAXES ................................................................................................................................................. 143
ANNEX 2: ECONOMIC THEORY OF NON-PROFIT ORGANISATIONS ............................................................... 144

IV
LIST OF FIGURES
Figure 1: Development of Rent Increase and Inflation ................................................ 28
Figure 2: Energy Labels of Dwellings by Year of Constrution ..................................... 41
Figure 3: Energy Labels of Dwellings by Province ........................................................ 42
Figure 4: Complaints Into the Rent Commission ......................................................... 48
Figure 5: Unemployment in Europe, In Q2 of 2012 ................................................... 58
Figure 6: Mortgage Debt, House Value, Savings and Pensions Entitlements, 2012 .. 60
Figure 7: House Price Index for Netherlands and Denmark, 2005, Q1 – 2013, Q1 ..... 62
Figure 8: Consumer Confidence, Netherlands ............................................................. 63
Figure 9: Change of Tenure Choice for New Building per Year .................................. 64
Figure 10: Population Ageing, Old Age Dependency Ratio.......................................... 65
Figure 11: Expected Increase of Aging Costs, 2007-60, Percentage Points of GDP .... 66
Figure 12: Index of the Size of Households .................................................................. 66
Figure 13: Avarage House Price and Mortgage in Euros .............................................. 68
Figure 14: Yearly Tax Advantage on Mortgage ............................................................ 68
Figure 15: Loan-to-Value Ratios for First -Time Buyers .............................................. 70
Figure 16: Loan-to-Value Ratio of Dutch Home Purchase 2000-2010 (in percentage) ........................................................................................................................................... 71
Figure 17: Mortgage Product mix 2012 .......................................................................... 72
Figure 18: Volume of Existing Mortgage by Maturity .................................................. 74
Figure 19: Volume of New Mortgage by Maturity ........................................................ 74
Figure 20: Arrears on Mortgage or Rent Payments ...................................................... 76
Figure 21: Forced Sales 2005-2012 ................................................................................. 76
Figure 22: Properties up for Sale .................................................................................... 77
Figure 23: Development of Housing Stock .................................................................... 82
Figure 24: Development of the Rental- and House Price ............................................ 83
Figure 25: Tax Wedge for Housing ................................................................................ 85
Figure 26: Netherlands Government Debt to GDP ....................................................... 86
Figure 27: Mortgage Tax Relief by Amount of Mortgage Costs, 2008 ......................... 96
Figure 28: Mortgage Tax Relief by Income Group, 2008 .............................................. 97
Figure 29: Share of Total Mortgage Tax Relief by Income Group, 2008 ..................... 97
Figure 30: Financial Flow Between the Government and the Housing Associations in the 'Balancing and Grossing Operation' 1995 ......................................................... 105
Figure 31: Homes by Ownership, 2010 ........................................................................ 108
Figure 32: Housing Associations in Proportion to Annual Rent/WOZ-Value, 2011 109
Figure 33: Housing Associations Dwellings On the Basis of How Much Rent is Charged (Left) and on the WWS Points System Ceiling (Right) ................................ 111
Figure 34: WWS Points per Type of Landlord ............................................................. 111
Figure 35: Average Rental Increase According to Type of Landlord ........................ 112
Figure 36: Incomes Occupants Housing Association Dwellings, 2012 ..................... 113
Figure 37: Income Composition of Tenants in Housing Association Dwellings .... 113
Figure 38: Distribution of Residential Property amongst Target Groups, 2012 ...... 126

V
LIST OF TABLES
Table 1: Price Liberalisation Threshold Per Year ......................................................... 26
Table 2: Inflation and Rent Increase .............................................................................. 27
Table 3: Development in Households’ Economy between 2002 and 2006................. 35
Table 4: Incoming Applications 2008-2011 ................................................................... 47
Table 5: Mortgage on Dwellings ..................................................................................... 67
Table 6: Development of Housing Stock ....................................................................... 83
Table 7: Budgetary Costs of Housing Policies in the Property Market (Euro Billion) 84
Table 8: Average WOZ-Value and Annual Rent of Housing Associations ............... 109
Table 9: Composition of ownership of rental housing in the Netherlands............. 110
Table 10: CFV Factsheet of Housing Associations Financial Position for 2011 ....... 114

VI
ABBREVIATIONS
AEDES Housing Association umbrella group AFM Autoriteit Financiële Markten (Financial Markets Authority) ANBI Algemeen Nut Beogende Instellingen (Institution Aimed at the Com-
mon Good) BBSH Besluit Beheer Sociale Huursector (Management of Social Rented
Sector Act) BNG Bank Nederlandse Gemeenten (Bank of Dutch Municipalities) CBS Centraal Bureau voor Statistiek (Central Bureau of Statistics) CFV Centraal Fonds Voor de Volikshuisvesting (Central Housing Fund) CPB Centraal Planbureau (Central Planning Bureau) DCC Dutch Civil Code (Burgerlijk Wetboek) DNB De Nederlandsche Bank (Dutch Central Bank) ECB European Central Bank EIA Energy Investment Allowance EPBD European Directive on Energy Performance of Buildings GIV Guaranteed Investment Vehicle GVW Gecorrigeerde Vervangingswaarde (Depreciation Replacement Costs) IVBN Vereniging van Institutionele Beleggers in Vastgoed (Association of
Institutional Property Investors) LTV Loan-to-Value MTO Medium Term Objective NHG Nationale Hypotheek Garantie (National Mortgage Guarantee) NWB Nederlandse Waterschapsbank (Dutch Water Boards Banks) OECD Organisation for Economic Co-operation and Development OMRV Open Market Rental Value PRS Private Rented Sector PV Provinciale Vergaderingen (Provincial Assemblies) [of Woonbond] SCP Structure-Conduct-Performance SGEI Services of General Economic Interest SGP Stability and Growth Pact TEC Treaty Establishing the European Community TFEU Treaty on the Functioning of the EU VR Verenigingsraad (Association Council) [of Woonbond] VROM Ministerie van Volkshuisvesting, Ruimtelijke Ordening en Milieu
(Ministry of Housing, Spatial Planning and the Environment) WEW Waarborgfonds Eigen Woningen (Home Ownership Guarantee Fund) WOZ Waardering Onroerende Zaken (Property Valuation Law) WSW Waarborgfonds Sociale Woningbouw (Housing Association Guaran-
tee) WWS Woningwaarderingssysteem (Points System of Rent Regulation)

VII
PREFACE
The Dutch private rented sector has a very unique structure in comparison to most other countries with similar housing challenges. On one side the govern-ment affords home-owners significant subsidies through a tax deduction of mortgage interest against income tax, which reduces the cost of home-ownership and therefore reduces the rented sector demand in the short and me-dium run. On the other hand, the Dutch government regulates the rented mar-ket in accordance with an objective points system, which in essence means that low quality rented dwellings has rent increases set by the government. Fur-thermore, the Dutch Housing Associations were afforded financial independence in the 1990s and have since amassed significant market power which enables them to offer housing below the market price. It is important to review the two policy/fiscal positions of the Dutch government in favour of home-ownership and in favour of low quality rented dwellings. They are subsidising both sides of the market for political economy reasons. However, the government is now addressing the subsidies due to the necessary fiscal consolidation required to meet the new European Union fiscal regulations. Significant reforms are thus starting to materialise to liberalise both ends of the market, the impact of which is speculated in this working paper. Therefore, chapter 3 reviews the points system of regulated rents, chapter 6 sets out the fiscal subsidies to the owner-occupied market, and chapter 7 assesses the mar-ket strength of the Housing Associations. Liberalising the market further raises questions which are important to other housing markets, such as affordability, creating areas of mixed social classes and financial regulation. Nonetheless, this working paper is attempting to offer holistic perspective of the Dutch private rented sector, aiming to include the most important factors which implicitly or explicitly affects the supply and demand of rented dwellings. Chap-ter 2 assess Dutch tenancy law and rent regulation on a formalistic legal per-spective to understand the practical costs of tenure choice. The institutions of the Dutch private rented sector are described in detail in chapter 4, where for instance we find that the Rent Commission offers the tenants a very cheap route to challenging the decisions of landlords in the regulated sector. Chapter 5 ex-amines the core supply and demand structure of the Dutch housing market, in-cluding the mortgage market characteristics, the supply elasticity and the Dutch demographics. The Knowledge Centre for Housing Economics, an independent and impartial research group within the Danish foundation Realdania, has commissioned this working paper at the start of 2013. An expansive comparative report is being made by the Knowledge Centre for Housing Economics together with DELFT Uni-versity, the London School of Economics, the Copenhagen Business School and the Cologne Institute for Economic Research, and is expected to be finished at the end of 2014.

VIII
For the work undertaken in this paper, we thank Marietta Haffner (DELFT Uni-versity), Rik de Boer (Dutch Ministry of the Interior and Kingdom Relations), René van Genugten & Emirto Reinhart (AEDES), Arnoud Vlak (IPD), Frank van Blokland & Steef Verweij (IVBN), Anke van Heur (Huurcommissie), Bastiaan van Perlo (Amsterdam Tenants Associations), John Graham (Whitfield & Adams) and Dirk-Jan Gondrie (Boekel de Nerée). This working paper does not reflect their views or opinions, rather our meetings and discussions with them was in order to get an understanding of the market from different perspectives in order to write a bal-anced paper.
Under the supervision of Curt Liliegreen, Head of Secretariat. With help from Zarah Saxil Andersen and Michael Harboe Møller

1
CHAPTER 1: INTRODUCTION
The private rented sector (PRS) in the Netherlands is shaped by a standard Europe-an style tenancy law, a rather unique rent regulation system, an evolving policy position regarding subsidies, a historical legacy stretching from the industrial revo-lution and an exemplar case of political economy developments. This report as-sesses in depth an array of subjects to understand tenure choice in the Nether-lands, including social science, macroeconomics, microeconomics, institutional path dependency, politics, sociology, public policy, EU law and normative legal theory.
Most of the analysis begins with the 1959 Roos Committee, which was set up to assess the Dutch economy on how to transition from a state controlled economy to a mature free market economy. For the housing sector it proposed deregulation to both the home-ownership market and the rental market, with assistance for low income households in Housing Association social dwellings. Looking at the reform proposals put forward in the last Coalition agreement, it seems as if the policy pro-posals are going to be finished off, albeit more than 50 years late.
The report can be seen in two parts. The first part is rather descriptive, where chapter two analyses tenancy law in the Netherlands. This can be described as a fairly normal Northern European system which sets out the rights and obligations of both the tenants and landlords, and is found to be somewhat protective of the tenants. Chapter three reviews the points system, which scores each dwelling on its objective characteristics, and whether the dwelling is in the regulated rent sys-tem. An assessment of the points system is carried out, showing the proposed re-forms. Chapter four assesses the important institutions in the PRS, ranging from the legal system, the soft law approach, the tenant support groups and the power-ful actors in the policy sphere of influence.
The second part of the report is more analytical. Chapter five assesses the Dutch housing market, showing that it is shaped by demographic changes, highly lever-aged mortgages and low supply elasticity. Chapter six discusses the government subsidies to the home-ownership market, their distributive impact and the politi-cal economy regarding tenure support in the Netherlands. It argues that the PRS will be a popular investment asset in the coming future. Finally, chapter 7 studies the Housing Associations. It shows that the strong position of the Housing Associ-ations is having a large negative impact on private investment in the PRS that has been deemed illegal under EU competition law as state aid. It assesses the benefits of the Housing Associations outside of finance, and again shows how Dutch poli-tics has influenced its history and is shaping its future. Furthermore, economic theory and social science concepts are used to understand the path dependency of these interacting housing market components.
It finds that the reforms to the points system, subsidies and Housing Associations are all part of a plan to change the government role in the PRS to a facilitator of a social-market economy style of regulation.

2
CHAPTER 2: DUTCH TENANCY LAW AND LAW OF RENT REGULATION
INTRODUCTION AND LEGAL AUTHORITY
1. INTRODUCTION AND PRINCIPLES OF TENANCY LAW
1.1 The Dutch Civil Code (DCC) was introduced in 1838, stipulating around 30
clauses in relation to tenancy law, most of which were taken from the French Civil Code. These principles, which were in principle non-mandatory, are known as the general rules of tenancy.
1.2 The non-mandatory character of the general rules implied that in a peri-od of severe housing shortage the tenant would not get any protection from rent increases or eviction. Following World War One, temporary rules were introduced to help the supply of affordable housing. In the late 1920s these measures were removed as the market returned to equi-librium. During the Second World War further housing shortages led to the Occupational Forces enacting rent regulation, where rent was re-stricted and unilateral eviction was limited. Following the war these measures were retained in policy, and subsequently enacted in the Rent Act of 1950
1.3 In 1971 a separate regulation was enacted to remove business tenancies
from the rent regulation, the so called shop-keepers tenancies.
1.4 In 1979 protective measures were introduced into the DCC. Measures concerning maximal rents were stated in a separate Residential Tenan-cies (Rent) Act. This extended tenancy law to other housing subjects, in-cluding subtenancy, exchange of housing, and the legal status of cohab-itants.
1.5 In order to stimulate (sub)letting of rooms to students etc, the protection
of tenants living in the same dwelling as their landlord was reduced in 1993 (art. 7:274 par. 1 infra f in connection with art. 7:232 par. 2 DCC).
1.6 On August 1st 2003 an extensive alteration in Dutch tenancy law was im-
plemented, in which the general rules of tenancy have been completely restructured. The basic rules of maximum rent in the 1971 legislation have been inserted into the DCC. The rules for shopkeepers, tenancies and housing tenancies have been marginally adjusted (art. 7:290 ff). The Rent Act was effectively replaced.

3
1.7 The general rules (pre-2003 legislation) were inspired by the French Civil Code, offered scope for the interpretation and amplification by the judi-ciary, through the principles of ‘reasonableness’ and ‘fairness’ in Art. 6:2 and 248 DCC. The pursuant jurisprudence often clarified the rent regula-tion further in practice, going beyond the facts of the case to stipulate other factual circumstances and the remedies available.
1.8 The new rules are built upon a preliminary draft from 1972, which is in-spired by the German BGB. It was a move away from general contractual principles to more detailed regulation of particular problems. To a lim-ited degree it codified the jurisprudence which had been established. The intention was made clear by parliament that the new legislation should not create different results compared to the old legislation. This is difficult to imagine, as the new legislation contains more regulation, more detail and more mandatory obligations. Therefore, it cannot be as-sumed that the jurisprudence from the old law can be applicable now, or whether the new law will be heavily shaped using the old jurisprudence.
2. Were these rules based on a particular philosophy?
2.1 The protective measures were initially prompted by a scarcity of hous-
ing, which has never fully disappeared and thus the continuation was justified. The left and right wing political parties have contested this ex-tension, with the later arguing that free market deregulated economics would solve the impasse of supply shortage.
2.2 It is possible to compare the development of tenancy law with labour law, where the protection of the economically weaker party in labour law had been established for much longer in a more clear and structured manner than tenancy law. Tenancy law has been more ad hoc towards responding to the market situation rather than following a clear political ideology.
3. Constitutional and International Instruments Influence on Tenancy Law
Provisions
3.1 The National Constitution and International Instruments (e.g. European Convention on Human Rights) played no marked part in the introduction of the past tenancy laws.
3.2 Parliamentary documents reveal no references were made to the consti-tution or international instruments in the creation of the new laws.
3.3 Consumer Protection legislation plays a part only in the assessment of
general terms and conditions:
3.3.1 Art. 6:231 ff DCC: General terms and conditions are any written clauses that have been drafted in order to serve in several con-tracts.

4
3.3.2 Where general conditions are not concerning key elements of the contract, they can be declared void should they be considered un-reasonably onerous.
3.3.3 Art.6:236 DCC: States clauses which are considered unreasonably
onerous.
3.3.4 Art. 6:237 DCC: States clauses which are presumed to be unreason-ably onerous
3.4 These clauses were not entered into the Civil Code specifically for tenan-
cy law, and in fact have rarely been used in tenancy law. Nonetheless, with the 2003 reforms introducing the number of conditions of tenancy law, they have proven more important.
4. Allocation of Competences in the Legislative Jurisdiction of Tenancy Law
4.1 The basic rules of Dutch tenancy law, including their implementation,
are laid down in acts of Parliament. In accordance to Dutch law, these take place in collaboration with the government.
4.2 The Minister of Public Housing establishes the standards for the allot-ment of points relevant to the housing, the value in money that corre-sponds with these points, and the standards for rent increases.
4.3 The Minister must consult first with the Second Chamber.
4.4 The Minister is held politically accountable for the development of rents.
However, rent increases are usually agreed upon in the coalition agree-ment when the political parties are forming the coalition government.
4.5 The Central Planning Bureau (Centraal Planbureau = CPB) has a role in de-
livering economic analysis and forecasting of the rent increase policies, as part of its role in reviewing all government policies.
5. Acts and Regulations Structuring Current Tenancy Law
5.1 The DCC consists of eight books:
5.1.1 Book 3 contains the law of property in general.
5.1.2 Book 6 contains the general rules of obligations.
5.1.3 Books 3 and 6 regulate general aspects of private law, and thus ap-
ply to tenancy law unless specifically stated otherwise.
5.1.4 Book 7 contains specific contracts, such as purchase, exchange, tenancy and labour agreement.

5
5.1.5 The general rules of rental law pertaining to the points system were inserted into the Dutch Civil Code in Book 7.
5.1.6 The rules for application are to be found in the Implementation
Legislation for Housing Rents (Uitvoeringswet Huurpirjzen Woonruimte).
5.1.7 The criteria for the appraisal of alterations of rent (rent increases)
are to be found in the Ministerial Decree on Housing Rents (Besluit Huurprijzen Woonruimte), especially in the explanatory notes and appendices.
6. Legal Concept of a Lease Contract
6.1 There are no other forms of lawful possession of a premises for housing
purposes other than a lease or ownership. In other words, there is no le-gal concept of a license which is found in English land law, whereby if a person is paying compensation to someone for the legal possession of a dwelling, it will immediately inferred that there is a leasehold on that premise, which therefore brings the subsequent leasehold laws stipulat-ed in this chapter.
6.2 On the other hand, in the case of a prolonged vacancy, a premises may well be allowed to be occupied free of charge. The users will be account-able for the actual costs of utilities. When the users are required to pay compensation for the actual use of the premises, they will be considered to have entered into a tenancy agreement, and thus under tenancy law protection.
6.3 In certain situations protective rules can be set aside, notably when the
stipulated use is by its nature limited for a short period of time:
6.3.1 Art. 7:232 par. 2 DCC: Holiday house.
6.3.2 Art. 7:232 par. 4 DCC: House due for demolition.
6.4 Vacant Property Act (Leegstandwet): a special regulation which provides the possibility of letting under surveillance by the municipal authorities premises awaiting renovation and the like. The rules of security of ten-ure will then not apply.
6.5 The Vacant Property Right has been amended during the financial crisis to allow temporary renting of unsold empty premises which cannot be sold due to financial difficulties.
6.6 The position of the tenant gives him obligatory rights only, rather than real property rights. The one exception is in the case where the landlord transfers his right of ownership (or a restricted right that includes the right of tenancy) to a third party.

6
That third party will then automatically become the tenant’s new land-lord, and he will obtain all assets and liabilities of the former landlord, at least to the extent wherein those rights are connected to the use of the premises for the rent the tenant is obliged to pay (Art. 7:226-227 DCC).
7. Social Regulations Affecting Private Tenancy Contracts
7.1 Housing Associations:
7.1.1 Half of the available housing in the Netherlands belongs to Housing
Associations, which are entities working in the interest of public housing. They operate under private law, although are under sur-veillance of the Minister for Public Housing, the Central Housing Fund (Centraal Fonds voor de Volkshuisvesting = CFV) and the Rent Tribunal.
7.1.2 The legal rights and obligations of Dutch housing associations are
formulated in the Social Housing Management Decree (Besluit Be-heer Sociale Huursector = BBSH). This decree stipulates that all the activities of housing associations have to be in the interest of hous-ing, especially housing of lower-income households. The same holds for the eventual profits that result from those activities. Housing associations must give priority to accommodating house-holds with a weak position on the housing market (mainly lower income households). However, they are allowed to provide dwell-ings for other target groups. They are also allowed to deliver high-rent or owner-occupied housing. As a consequence, Dutch housing associations are often typified as 'hybrid' organisations, which car-ry out public tasks, but are independent, private organisations, having market-driven objectives as well. The BBSH formulates the obligations of housing associations in the form of general 'fields of performance': accommodation of target groups, preservation of the quality of dwellings and their environment, consultation of ten-ants, providing housing and care arrangements, securing the fi-nancial continuity and using financial surpluses in the interest of housing.
7.1.3 Apart from being able to indirectly appeal to the Subsidised Rented
Sector (Management) Decree for the requirement of participation, the tenants have the same protection as the general rules of tenan-cy.
7.1.4 The tenants’ participation right is upheld in the Consultancy Act
Landlords and Tenants (Wet overleg huurders verhuurder).
7.1.5 The BBSH, introduced in 1993, allows housing associations a lot of administrative freedom. They are still supervised by the govern-ment, but, unlike before, on the basis of retrospective accountabil-ity.

7
7.2 Subsidies:
7.2.1 The Rent Allowance Act (Huurtoeslag) stipulates that tenants with
low income, depending on their personal circumstances, are per-mitted a rent subsidy, so long as their rent does not exceed a cer-tain amount. For eligibility of the housing allowance, in 2013 the government stipulated that the rent for a single person household aged between 23 and 65 must be between €222.18 and €681.02 per month, the annual income is below €21,025 and their savings and investments is below €21,139. There are many variables consid-ered in calculating the amount of allowance for each individual household, thus it is more appropriate to give an example found in 2013. For a single person household (with no child or partner), an annual wage of €15,000, a rent of €450 per month (including service costs) and no disability would receive a housing allowance per month of €197. It does not matter what form of landlord they have.
7.2.2 Housing Corporations do not have any exploitation subsidies since
1995. The only advantage they have is favourable loans from the WSW (Waarborgfonds Sociale Woningbouw). On 1 January 1995, the Balancing and Grossing Act (Wet balansverkorting geldelijke steun-volkshuisvesting) came into force, which provided the legal basis for a financial trade-off of all the government's remaining subsidy commitments to each of the housing associations on the one hand and the outstanding government loans to each of these associa-tions on the other.
7.3 National Policy Favouring The Home-Ownership Sector
7.3.1 Given the tax structure of the home-ownership market, the higher
a household’s wage is, the more favourable it is to go into home-ownership, predominantly due to the deduction of mortgage inter-est from income tax.
7.3.2 The housing market policy is pursuing greater owner-occupancy,
partially due to the acclaimed environmental benefits to the neigh-bourhood of ownership.
7.3.3 On the contrary, given the housing benefits for low-income house-
holds, the lower a household’s income, the more favourable it is to move into tenancy.

8
7.4 Public Law Measures of Assigning Houses to People in Need:
7.4.1 The BBSH states that one of the tasks of the Housing Corporations is to let their housing supply to those with the lowest income and in search of housing. Nonetheless, the Housing Corporations were encouraged to rent to a mix of incomes, and have set the point of access to many dwellings at €34,000 (2012), which is roughly the average income of Dutch households. Chapter 5 describes the re-form to this income level in 2013-2014.
7.4.2 The Housing Allocation Act (Huisvestingswet) seeks to obtain a well-
balanced and fair distribution of scarce housing. Municipalities are permitted to introduce housing regulations to allot low-priced housing to those in need. Such dwellings cannot be rented out without a housing license. The allocation and supervision of this role is entirely at the discretion of the municipality.
7.5 Public Law Measures to Prevent Dwellings From Staying Empty:
7.5.1 The Housing Allocation Act permits the municipality to claim
housing that is found to be vacant. A valid claim must require the property to be vacant for a period not exceeding 10 years and for the municipality to have a justified allocation to those who would make use of the premises. The municipality must decide on the amount of compensation to be paid to the owner.
8. Tenancy Law and the Role of Tenants Associations
8.1 Tenants can form Local Tenants Organisations, which act locally to en-sure adequate responses to local concerns are heard.
8.2 According to the BBSH, tenants in Housing Corporations have the legal right to voice their opinion on matters of policy and management, and the Corporations must adequately consult their tenants.
8.3 The Act on Consultation Between Landlords and Tenants (Wet overlag
huurders verhuurders) stipulates that commercial landlords with over 100 dwellings must similarly consult their tenants and engage in construc-tive dialogue. Nonetheless, there remains a principal-agent problem of the commercial landlord’s information asymmetry over the tenants. A summary of the consultation act is provided by Ouwehand and van Daa-len.1
8.4 Corporations are unified in a co-ordinated organisation (AEDES), which
has more power over national tenancy policy than tenants organisations or associations.
1 André Ouwe and Gelske van Daalen (2002) Dutch Housing Associations: A Model for Social Housing. OTB Research Institute for Housing, Urban and Mobility Studies. Delft, the Neth-erlands: Delft University Press.

9
8.5 The tenants are unified in a national tenants association (Woonbond). The aim and purpose of the Woonbond is to take any kind of action which is necessary to guarantee the availability of low-priced good quali-ty houses for tenants, safe neighbourhoods that provide a positive social environment and to encourage strong local organisations of tenants. It administratively helps everyone who has problems with rental accom-modation, short of providing legal insurance for tenants.
9. Tenancy Law and the Courts
9.1 Art. 7:262 DCC: In the case of rent disputes, the first point of access is the Rent Tribunal (Huurcommissie), where either the dwelling is within the points system or is being challenged by the tenant for inclusion in the points system, as stipulated below. Only after the case has been investi-gated and ruled by this committee, which is presided by a jurist (any per-son who possesses a degree in law and works professionally with the law), can it be put before the sub-district court.
9.2 Tenancy disputes are brought before the sub-district courts, wherein one member of the district court makes decisions. This court also deals with labour disputes and other cases with an interest at stake not exceeding €5,000. Legal representation is not mandatory before these courts. How-ever, litigation before this court without legal representation is unusual.
9.3 Once there is a serious conflict, economically disadvantaged parties may
apply for free legal assistance of a bailiff or a lawyer.
9.4 Litigation is fairly rapid in tenancy cases, with the average time involved being six to nine months. The execution of tenancy law judgements has few peculiarities. There may be reason to postpone execution of judge-ments where either the landlord argues that there has been abuse of the power to enforce a court decision or the tenant argues that there is an emergency requiring delay.
9.5 The litigant is due to pay a contribution, which increases according to his
income.
9.6 Appeal is allowed against the decision of the sub-district court, either if the value at stake has not been defined or if it exceeds €1,750. The ap-peal is brought to the Court of Appeal, where legal representation is mandatory.

10
TENANCY LAW
1. The Conclusion of a Tenancy Contract
1.1 No form is prescribed for the validity of contracts in general.
1.2 There are no specific rules dictating the form in which the consensus is
to be stated.
1.3 A verbal agreement is valid, and can be enforced if sufficient proof has been presented.
1.4 There is no public register to enter tenancy agreements.
1.5 It is customary for the rights and obligations of the parties to be regulat-
ed extensively, however parties can limit themselves to the bare essen-tials of the object of the tenancy and the amount of rent payable, as the remaining tenancy law issues are stated in statutory legislation.
1.6 As stipulated before, Housing Associations might be restricted according to the BBSH to provide housing specifically to lower income groups, thus would have to conduct an income assessment.
1.7 According to Dutch jurisprudence, an offer done by advertisement is in general not an offer that acceptance alone can lead to an obligation, but no more than an offer to commence negotiations (Dutch Supreme Court, April 10th 1982, 532 Hofland/Hennis). The person placing the offer by ad-vertisement has the freedom to retract the offer with or without a rea-son.
1.8 The principle of pre-contractual good faith can imply an obligation to
negotiate. However, the landlord is able to withdraw from the negotia-tions once further information is received about the tenant.
1.9 Art. 1 Dutch Constitution: Prohibition of any form of discrimination.
1.10 Art. 90 and 429 Criminal Code: Penal sanctions on discrimination. These
were particularly inspired by the International Convention of New York of March 1966. Discrimination on the grounds of political, economic, so-cial or cultural fields can give rise to a claim based on tort, either for an injunction or for horizontal effect (Dutch Supreme Court, December 10th, 1984, NJ 1985, 350, regarding a Turkish female employee). Penal or civil cases are brought before the usual courts, unless the discrimination is between men and women, whereby there is a national Committee with non-binding rulings.
1.11 Art. 3 Par. 1 lit. h, Directive 2000/43/EC: Equal treatment for the offering
of or giving access to goods and services.

11
1.12 Art. 6:228 DCC: A landlord is able to invoke error where his willingness to contract is established by an incorrect representation made by the tenant.
1.13 Art. 7:270 DCC: The contract can automatically transfer to another ten-
ant in an exchange of housing.
1.14 Art. 7:164 DCC: Declares void any unreasonable profit stipulated in con-nection with the tenancy agreement, including the landlord himself, an agent (such as an estate agent) or the departing tenant. Therefore, commission fees connected to the actual costs connected with the lease may be asked, above which amounts to undue payment.
2. Obligations of the landlord
2.1 The landlord must provide the object of the tenancy, including the use to which the tenant is entitled.
2.2 Art. 7:204 par. 2 DCC: Material or immaterial prevention of this these is considered deficiency.
2.3 Art. 7:206 DCC: In the event of Deficiency, the landlord is in principle obliged to provide a remedy.
2.4 Art. 7:207 DCC: Should there be Deficiency and the Landlord has not provided a remedy, the tenant is entitled to reduction of the rent, pro-portional to the loss of enjoyment.
2.5 Art. 7:208 DCC: The landlord can also be held liable for any ensuing damage to the tenant.
3. Obligations of the tenant
3.1 Art. 7:212 DCC: The tenant is obliged to pay the agreed rent.
3.2 Art. 7:213 DCC: The tenant is obliged to use the property in a manner be-fitting a responsible tenant.
3.3 Art. 7:214 DCC: The tenant is obliged to use the property in accordance with the intended use.
3.4 Art. 7:215 DCC: Far reaching alterations must be made only with the permission of the landlord, casu quo of the judiciary.
3.5 Art. 7:220 DCC: The tenant is obliged to tolerate urgent works and rea-sonable plans of innovation.

12
3.6 Art. 7:224 DCC: The tenant is obliged to return the object of the tenancy in a condition none other than that described at the time of entering in-to the agreement, except for normal wear and tear, once the tenancy has expired.
4. Rent
4.1 Art. 7:246 DCC: The rent can be freely agreed upon.
4.2 Rent is usually paid on an agreed date, paid in advance, and paid through giro transfer.
4.3 Art. 7:247 DCC: For dwellings in the unregulated market (above 142 points), the initial rent level is not controlled through rent regulation.
4.4 Art. 7:249 DCC: The housing tenant is authorised to have an agreed rent verified by the Rent Tribunal (Huur Commissie). It will determine the number of points attributed to the dwelling according to the objectives standards of quality, which corresponds with a maximum rent.
4.5 Art. 3a Implementation Act Residential Rents: Establishes the Rent
Commission role to mediate disputes regarding tenancies, excluding termination cases.
4.6 Art. 11 Rent Residential Tenancies (Implementation) Act: Should the Rent Tribunal find that the rent is higher than that which the points sys-tem stipulates, they are authorised to lower the rent accordingly.
4.7 Art. 7:262 DCC: Objections against the findings of the Rent Tribunal can be brought before the judiciary.
5. Rent Increase
5.1 The points system is seminal in questions as to whether the landlord is
permitted to increase rent. In 2013, should the dwelling be charged over €681.02 per month (which in theory should is the maximum amount charged for 142 points, then there is no regulation of rent increases (and initial rental prices). Dwellings which are charged under €681.02 are subject to rent increase regulation. The following legislation referring to the point system should be read only in accordance with regulated dwellings. This changes every year, and is further discussed in chapter 2.
5.2 Art. 7:255 DCC: In the case of renovation, the new rent price must still be within the rental price stipulated with the new number of points which the apartment is attributed.
5.2.1 Art. 7:255 DCC: After renovation, the tenant must pay the increased
rent that corresponds to the costs of improvement.

13
5.2.2 The increased amount of rent which is deemed reasonable corre-sponds to the costs of the renovation. The time frame of repay-ment of the costs is classified into 15, 20, 25 and 30 months accord-ing to the type of renovation. The interest of the investment is cal-culated similar to mortgage financing.
5.2.3 The renovation must be for an actual improvement of comfort (Geriefverbetering), rather than just replacing, fixing or maintenance (Groontonderhoud).
5.2.4 Any contribution by the tenant or from public subsidies are de-
ducted from the costs.
5.2.5 Art. 7:274 par. 1 infra c DCC: The desire to renovate the dwelling in order to be able to increase rent later is not considered to be urgent use by the landlord to evict the tenant. Neither can it bring about an offer, when turned down, might lead to termination by the judi-ciary.
5.2.6 Art. 7:220 DCC: If the dwelling is in need of renovation, the tenant can be compelled to allow the renovation. Should the renovation require the tenant to move out of the dwelling temporarily while the work is being done, he must do so in return for rent reduction and damages.
5.3 Art. 7:248 DCC: Rent in the regulated sector can be increased yearly ac-cording to a maximum percentage prescribed by the Minister of Public Housing in a decree (Besluithuurprijzen Woonruimte).
5.3.1 Art. 7:248 DCC: The rent increase can then be put into effect
through a rent increase clause in the contract.
5.3.2 Art. 7:252-253 DCC: A yearly increase can take place through a uni-lateral proposal, which is normally the procedure. The rent in-crease proposal should be sent to the tenant two months before the effective date. It should include data pertaining the present rent, the percentage of increase and the new rent.
5.3.3 Art. 7:252-253 DCC: Rent increase can also be enforced unilaterally
through the Rent Tribunal.
5.4 Art. 7:252 DCC: The landlord can at most raise the rent once in a year ba-sis, unless the apartment is simultaneously renovated under Art. 7:255.
5.5 Should the landlord want to increase the rent more than the increase
stipulated by the Minister, but in still keeping the rent under the maxi-mum limit according to the relevant points of the dwelling, then he will have to provide extra information in the unilateral proposal, including the number of points allocated to the property and information regard-ing his management and tenancy policy.

14
5.6 Should the tenant lodge a complaint against the proposal, the landlord
can refer the case to the Rent Tribunal. The Rent Tribunal can refuse to review the proposal if the increase is either above the maximum per-centage for that year or it exceeds the maximum rent applicable for that particular dwelling’s points.
5.7 Should the tenant not lodge a complaint, but nevertheless fails to pay,
the landlord will have to send a reminder before the Rent Tribunal as-sesses the case.
5.8 Economic Offenses Act: Asking for rent over the maximum allowed for
the dwelling can be prosecuted. Nonetheless, the usual route is for the Rent Tribunal to reduce it to the maximum allowed.
5.9 Deviations from rent law are strictly speaking null and void and not sub-
ject to annulment. Only deviations which are detrimental to the tenant are void.
5.10 Art.7:257 DCC: Rent can be reduced during the rental period on the ten-
ant’s initiative when it has become apparent defects have occurred.
5.11 Art. 7:222 DCC: The tenant must inform the landlord about defects of the dwelling, otherwise he may be liable for any subsequent associated damage.
5.12 Art. 7:241 in connection with Art. 7:204 par. 2 DCC: A fitting that is out of date can mean such a defect, even though the state of maintenance is adequate.
5.13 In accordance with contract law, 3 months of payment of the new in-
creased rent constitutes as a valid tacit acceptance of an offered contrac-tual agreement.
5.14 In order to be considered by the Rent Tribunal, a rent increase proposal
must comply with legal procedural requirements.
5.14.1 Art. 7:252 par. 5 DCC: If the written proposal has not met the re-quirements of form and content, an agreement as to the proposed rent increase is not binding, unless the landlord can prove that the tenant was not affected by the omission.
5.14.2 Art. 7:252 par. 6 DCC: Should the rent increase proposal be above the annually determined percentage and the proposal fell short on the information in paragraph 5.4 (above), then the rent increase will be restricted to the said inflation percentage.
5.14.3 Art. 6:127 ff DCC: If a rent increase was unduly paid, these amounts
can be deducted from future rent instalments as counter-claims, without judicial intervention.
15
6. Mandatory and Dispositive Rules
6.1 The general rules of tenancy law offer only a limited number of manda-
tory regulations, in which case a contractual divergence detrimental to the tenant has no effect.
6.2 Art. 7:206 lid 3 DCC: The tenant is authorised to remedy a lasting defect, thereby settling the costs by deducing them from the rent.
6.3 Art. 7:209 DCC: The landlord may not exempt himself from liability for defects known to him at the time of contracting.
6.4 Art. 7:242 DCC: Some other rules in tenancy law are declared mandatory only inasmuch they pertain to the law of tenancy of housing – such as the legislation on maximal rents applicability only below a certain standard.
7. Sharing with a Third Person
7.1 Primarily, much depends on what is stipulated in the tenancy agree-
ment, as usually subtenancies are excluded by the contract:
7.2 Art. 7:221 DCC: The lease is authorised to make the hired object available to another person, unless he had reason to believe that the hirer had reasonable objections against making the object available to such a per-son.
7.3 The importance of Art. 7:221 DCC is limited, as it is non-mandatory. Usually there are contractual provisions excluding subtenancies.
7.4 Art. 7:244 DCC: In derogation of Art. 7:221, the tenant does not have the
power to sublet the complete dwelling, but only the power to sublet a part of the dwelling.
7.5 Again, Art. 7:244 DCC is non-mandatory, and thus most contracts ex-
cludes all forms of subletting to third parties.
7.6 Art. 7:213 DCC: The hirer is obliged to use the property in a manner be-fitting a responsible tenant.
7.7 Secondly, much depends on the individual circumstances of the case, as
once the contract has come into effect, the landlord can be confronted with others who have acquired rights to the contract, including:
7.8 Art. 7:266 DCC: Through marriage of the tenant or registered partner-
ship.
7.8.1 Art. 1:80a DCC: Legal basis of a registered partner.

16
7.9 Art. 7:267-268 DCC: A lasting common household. They must have a joint household for two years, and then are entitled to ask the landlord to accept the third party as a co-tenant. If the landlord refuses, then they can ask the subdistrict court to grant an alternative authorisation. There is no need for a (pseudo) marital relationship, as attention will on-ly be paid to the long term basis. Thus a joint household can exist where the parents of the tenant has moved in for over 2 years. However, the factual circumstances are important – where you to find that the parents only moved in with the expectation to be moved onto a nursing home, then the long term basis would not be established (Dutch Su-preme Court, April 29th 1989, NJ 1989, 800 Van der Poel/’s-Gravenhage).
7.10 Art. 7:269 DCC: Subletting, where the subtenant of an independent house has a right to security of tenure.
7.11 The only possible grievance the landlord could argue is that there would
be over-occupancy due to the arrival of a co-tenant. There is no public law stating what the minimum space for each inhabitant must be. The only way additional rent could be charged for a new co-tenant is through a written clause in the contract, permitting that the complete rent does not exceed that which the points system stipulates should the dwelling be in the regulated market.
7.12 Should subtenancy be forbidden in the contract, then the landlord can
challenge it, permitting that he has a clear interest in not permitting it. Such a clear interest exists where the housing is only suitable for the tenant or the presence of the extra tenant is in any (objectively) detri-mental to the landlord or the other tenants.
7.13 Should the subtenancy be deemed a breach of the contract, then the
landlord can claim the termination of the contract. The burden of proof will be on the tenant to prove that the landlord has insufficient interest to invoke the prohibition of subtenancy in the contract. The landlord does not need to give prior cancellation or a final notice, as a breach of a continuous obligation not to over-occupy the apartment is considered ir-reparable and therefore can evoke immediate eviction.2 Less frequent are injunctions, where the tenant is required to stop subletting and made to pay a penalty.
7.14 Should the contract not stipulate against subtenancies, then the burden
of proof would be for the landlord to show, and if necessary prove, that either:
7.14.1 Art. 7:244 DCC: The tenant had reason to believe that there would
be objections against subletting.
7.14.2 Art. 7:244 DCC: The tenant could not factually sublet only part of his apartment.
2 Dutch Supreme Court, January 11th 2002, NJ 2003, 255 Schwarz/Gnjatovic

17
7.14.3 Art. 7:213 DCC: The subtenancy was so excessive so as to be classi-
fied beyond a reasonable use of the dwelling.
7.15 In the later situation where there is no breach of the contract, the land-lord can resort to an injunction, yet would normally go for a termination of the contract, either by a termination for breach of contract (by the ju-diciary), or by a judicial decision of the termination, after the landlord having given notice, on the grounds that the tenant had not used the properly in a manner befitting a responsible tenant.
7.16 Art. 7:270a DCC: The new tenant who continues the lease agreement is obliged to inform the landlord.
7.17 8. Succession of Contracts
8.1 Art. 7:299 DCC: Upon the death of the landlord, all their assets and liabil-
ities resulting from the tenancy agreement pass on to their heirs. They therefore have no special right to terminate the tenancy contract.
8.2 Art. 7:226-227 DCC: Where the landlord transfers his right of ownership of the dwelling, the third party will automatically become the tenant’s new landlord. The third owner will obtain all the assets and liabilities of the former landlord from the former contract.
8.3 Art. 7:274 par. 5 infra b DCC: The new landlord thus has no special au-
thority to terminate the tenancy agreement, and can only give notice under the normal grounds for eviction to the tenant after a period of three years has passed since acquiring the property.
8.4 These rules of succession are applicable to all forms of sale, including as
a result of bankruptcy, private transaction or public auction.
9. Student Homes
9.1 Where a landlord has contracted a student home for a group of students in one students name, it is assumed that the named student is the ten-ant and the other students are the subtenants. In this case the other students do not have contractual rights against the landlord and are not liable for rent separately.
9.2 Alternatively a landlord can have a tenancy agreement with all the stu-dents, whilst one student has taken it upon themselves to collect and remit the rents.
9.2.1 Art. 6:6 par. 2 DCC and Dutch Supreme Court October 6th 1989, NJ 1990, 184: In this case the students are jointly and separately liable for the total amount of the rent.
9.2.2 Should the tenants be authorised to nominate a new tenant, it would qualify as the right to appoint person by co-optation.

18
9.2.3 Jurisprudence of the lower courts shows that this must be done in
accordance with the content of the rent agreement and under the principles of reasonableness and fairness.
9.2.4 Jurisprudence suggests that more emphasis is put on the interests
of the tenants in sharing the facilities rather than the capacity to pay the rent.
10. Duration and Termination of the Contract
10.1 Art. 7:231 in connection with Art. 6:265 DCC): Should the tenant not
abide by his contractual obligations, the judiciary can set aside the ten-ancy agreement if the default is serious enough.
10.2 Where the default is not considered serious, the judiciary, and not the landlord, can terminate the agreement only on a limited number of grounds, after the landlord has given notice. In other words, giving no-tice does not terminate the tenancy, but is a condition for putting the matter before the judiciary, who will then review whether any of the statutory grounds for dismissal have occurred.
10.3 Art. 7:271 par. 5 infra b DCC: For a tenancy agreement of indefinite peri-
od, the notice for termination must be between three and six months, depending on the number of years the tenancy has already existed.
10.4 For a contract which is limited to a period of tenancy, notice cannot be
given towards an earlier date.
10.4.1 Art. 7:230 in conjunction with Art. 7:242 DCC: an agreement entered into for a limited length of time cannot be extended for another limited time. After the first limited period has elapsed it will be converted into an unlimited period. Thus notice should be served to confirm the conclusion of the limited period.
10.4.2 Within the set period neither the landlord nor the tenant can give
notice towards another date.
10.5 Art. 7:277 DDC: The grounds for dismissal are:
10.5.1 Not behaving in a manner befitting a responsible tenant.
10.5.2 Temporary tenancy, after which the landlord has the desire to take the premises into use (again) himself.
10.5.3 Urgent use by the landlord himself. The landlord’s interest in liv-
ing in the house must be greater than that of the tenant. The ten-ant must be able to find suitable housing according to his family and financial circumstances.

19
10.5.4 Turning down a reasonable offer to enter into a new tenancy agreement referring to the same apartment.
10.5.5 Realisation of a zoning plan.
10.6 Art. 7:274 par. 1 infra c DCC: The desire to renovate the dwelling in order
to be able to increase rent later is not considered to be urgent use by the landlord. Neither can it bring about an offer, when turned down, might lead to termination by the judiciary.
10.7 There are three stages of eviction following the court’s decision to evict the tenant:
10.7.1 The bailiff will serve the eviction order and demand that the tenant
leaves the premises.
10.7.2 Failure to comply will result in a judicial eviction taking place with-in a couple of weeks.
10.7.3 Should the tenant remain, then the bailiff will enter the premises
with police support, removing the contents of the dwelling onto the pavement and replacing all the locks. Should the tenant not be present, then the municipality stores the contents for a limited pe-riod of time.
10.8 The landlord may ask for immediate termination due to unusual cir-
cumstances. In normal circumstances notices will only result in the termination of the contract where the tenant accepts the notice or when the courts enforce the decision, of which for the later can take between six and nine months. Where there are special circumstances, a provi-sional measure can be requested, and a judge will sentence eviction in short term proceedings.
10.8.1 Limited arrears in payment of the rent is insufficient grounds for a rescission on breach of contract, where only an order for payment can be achieved.
10.8.2 Causing nuisance to fellow tenants may constitute non-performance towards the landlord, giving him the right to request eviction in interlocutory proceedings. However, usually the tenant will deny the nuisance, and thus the burden of proof is on the land-lord to prove there is nuisance, for which evidence is required, in-cluding lengthy witness summoning.
10.8.3 Art. 7:230 in connection with Art. 7:271 par. 7 DCC: Contractual
termination clauses are invalid, as this overlooks the role of the ju-diciary in deciding whether eviction is granted.
10.9 Art. 7:201 DCC: Everlasting tenancy (a clause of tenancy “for life”) is pos-
sible in principle, as it stipulates an agreement for a limited period.

20
10.10 Art. 6:258 DCC: A landlord can obtain a termination of a tenancy for life
on the grounds of unforeseen circumstances or an alteration of the agreement to the effect that notice can be given.
10.11 Art. 3:226 DCC: The real right to reside (for example in a tenancy for life
clause) is a species of the right of usufruct. It must be registered in the land registry.
10.12 The Vacancy Act (Leegstandswet) has been temporarily amended as a re-
sult of the mortgage crisis, allowing owners of dwellings to rent out un-sold properties temporarily, thus adjusting the rules on unlimited con-tracts.
11. Deposits
11.1 A deposit of two or at the most three months is customary.
11.2 The landlord does not need to pay interest on the deposit.
12. Utilities
12.1 It is customary for the tenant to contract suppliers of gas, water and
electricity and other utilities companies.
12.2 If the delivery takes place in the name of the landlord, then the landlord is permitted to charge the actual costs to the tenant with an increase of at most 5% for administrative expenses
12.3 The determination of the part to be paid by tenant should be measured
by his own meters. Alternatively an apportionment can be based on the size of the dwelling.
12.4 The landlord only has the right to the actual costs if the energy supply is
adequate. Should a malfunctioning heating device use a disproportion-ate amount of energy, then the tenant will not have to pay the actual costs.
12.5 Art. 7:259 and 261 DCC: There can be a contractual agreement to pay
monthly lump sum estimates to the landlord for utility expenses, so long as the actual amount of energy used is found out and retrospective-ly the actual costs are settled against what has been paid.
12.6 Art. 7:260 DCC: The Rent Tribunal can intervene to assess utilities bill disagreements between landlords and tenants.

21
CHAPTER 3: THE POINTS SYSTEM FOR RENT REGULATION
INTRODUCTION
The Netherlands has a system of points which determines both whether the dwell-ing is in the regulated rent system and for those that are regulated how much rent can be charged. The points are given to each dwelling for objective characteristics, including amenities and size. The points system has been an established method of rent regulation for a considerable time, with an intention of creating affordable housing for lower income households and ensuring long term investment stability. The system has been criticized for several reasons, including discouraging private investment in low cost dwellings, a reliance on the Housing Associations supply of low costs dwellings, not adequately recognising regional variance of housing mar-ket demand, and being too particular towards small characteristics and thus diffi-cult to calculate. The government has recently signalled new reforms to the points system, with policies including points according to the market value of the dwell-ing. Some reform has been carried out to the points system, including increased points according to the scarcity of rented dwellings in the area. This section will investigate all these “points”.
THE FUNCTIONING OF THE POINT SYSTEM
The rules concerning rent setting are found in the Implementation of Rent Prices Living Space Act (Uitvoeringswet Huurprijzen Woonruimte), which have been amend-ed in 2011. It establishes the Housing Valuation System (Woningwaarderings-systeem, WWS). Points are given for the following aspects of the dwelling, on the basis of 2013 policy, points and prices:
1. SIZE OF ROOMS (1 POINT PER M2)
This measures all rooms, including the kitchen and the bathroom/shower. The space is measured from wall to wall (at a height of 1.50m) including loose surfaces and closets. Attic rooms only count when there is a staircase leading to it and fin-ished as a room, whereby the roofing tiles are not visible from inside. First count all of the surfaces together, round this to the whole m2 and multiply by 1 point.
2. SIZE OF OTHER SPACES (¾ POINT PER M2)
This includes other areas such as sheds, barns, garages, basements, attics and util-ity rooms of at least 2m2. Should the attic is not be accessible by a staircase, it will be deducted 5 points (but never more than the number of points the attic gets). Count all of these surfaces together, round off m2 and multiply by ¾ point.

22
3. HEATING
• Per heated room: 1 point
• An open kitchen counts as a separate departure: 2 points
• Own boiler: 3 points
• Own condensing boiler: 5 points
• Collective condensing unit, per property: 1 point
• Thermostatic valves to radiators, per room (maximum 2 points per house): 0.25 points
• Heater(s) leave out, per room (up to 4 points per house): 1 point
• Hot water supply to boiler (combi boiler), per property: 1 point
• Flow meters, per property: 1 point
4. THERMAL INSULATION (UP TO 15 POINTS PER PROPERTY)
• The landlord can ship the items to match the investment (1 point per €226.89) or give points for different types of isolation facilities:
o Double glazing, per m2: 0.4 points
o Floor insulation, per dwelling: 2 points
o Roof insulation, per property: 2 points
o Cavity Wall Insulation, per property: 1 point
o Insulation on the outside of the wall, per property: 6 points
5. KITCHEN
Valuation of kitchen based on the length of the sink:
• Sink to 1 meter: 0 points
• Sink from 1 to 2 meters: 4 points*
• Sink of 2 meters and more: 7 points*
* This number of points can be up to double if the kitchen is more luxurious than a simple, most commonly found in new homes.
6. BATHROOM
• Toilet: 3 points
• Sink, lavet, bidet: 1 point

23
• Shower: 4 points*
• Bath: 6 points*
• Bath and shower in one room: 7* points
* Again, doubling the maximum number of points possible where it is luxurious.
6a. Living Allowance for Disabled Person Fittings
€226.89 for each of the costs that the landlord has paid in order to accommodate disabled people (net of subsidies): 1 point to provisions
7. AGE OF PROPERTY: REMOVED SINCE 1 JULY 2004.
8. PRIVATE OUTDOOR SPACE (MAXIMUM 30 POINTS)
Points for the area of gardens, balconies, terraces and the like with the length and width of at least 1.50m:
• up to 25m2: 2 points
• 25 to 50 m2: 4 points
• 50 to 75m2: 6 points
• 75 to 100m2: 8 points
• from 100 m2: 10 points*
• carport: 2 points
If there is no private outdoor space, including both a small balcony and a town garden: - 5 points
* Up to 15 points if a large garden to the site is unusually of extra quality.
9. HOUSING TYPE
• Single Family
o detached house: 17 points
o townhouse: 15 points
o terrace house: 12 points
• Multifamily (flat / house porch, etc.)
o Ground Floor: With elevator 6 points, without elevator 6 points
o 1st Floor: With elevator 5 points, without elevator 3 points
o 2nd Floor: With elevator 4 points, without elevator 1 point

24
o 3rd Floor and Above: With elevator 4 points, without elevator 0 points
• Duplex apartment: 1 point
• Ground floor: 4 points
• When less than 17 households use a lift access, 2 extra points.
10. LIVING ENVIRONMENT (MAXIMUM 25 POINTS)
Here are points given for the presence of facilities such as public parks, play-grounds for children, schools, shops, links to public transport and parking. You can ask your landlord or the secretariat of the Tenants Committee to assist the evalua-tion of the environment for which your home is in.
11. ANNOYING SITUATIONS (UP TO 40 POINTS DEDUCTION)
Deduction Points are given only for very serious cases which pose a health hazard, such as noise pollution (traffic and industry), serious degradation of the environ-ment, being affected by urban renewal activities and soil or air pollution.
12. SERVICES OFFERED IN THE DWELLING (INCREASE BY 35 POINTS)
The total points can be increased by 35 points. Examples of this would be the land-lord providing alarm installations, provision of meals and the use of recreational rooms
13. EXTRA POINTS IN SCARCITY AREAS
Since October 2011, apartments in a town with a housing shortage are worth more points. Landlords in such a "shortage area" can then ask for more money for their property for new contracts on the basis of extra points. This increases the market on a regional basis. Scarcity Areas are regions where there is high demand for housing, but where relatively few homes are available. Rental housing in munici-palities belonging to those regions can obtain up to 25 extra points.
To determine whether the house gets 25 extra points, you must look at the most recent property value of the home setting, using the WOZ valuation system (waardering onroerende zaken, which is further elaborated on at page 37 in relation to the reforms of the points system), or upon a request to the municipality. Divide the property value by the surface – to protect small apartments from significant rent increases.
• A property with a value-to-size equal or lower over €2900 per square metre gets 15 extra points.
• A house with a higher value per square metre than €2900 gets 25 extra points.
For example a house in Amsterdam worth €200,000 and an area of 50m2, gets a value per square metre of € 4000. Does this amount exceed the € 2900? As it does then the number of points to be increased rises up to 25.

25
The scheme of up to 25 extra points can lead only new leases to a higher rent. For existing leases, the landlord must adhere to the existing statutory rent increase.
POINTS DETERMINE WHETHER A DWELLING IS WITH-IN REGULATED RENT REGULATION
The points accorded to these aspects can add up to a total between 40 and 250 points. Once the points have been calculated, there are two very important con-siderations:
1. When the dwelling has less than 143 points, there is always a maximum rent which can be charged per month
The points rating of a dwelling only stipulates the maximum rent which can be charged per month, for dwellings with up to 142 points. For these dwellings the rental increase is set by the Minister for Public Housing, which has been linked to inflation since 2008. Private institutional investors have stated they are not inter-ested in this market of dwellings below 143 points due to the restriction in how much can be charged. In theory, dwellings which have 143 points and above can charge any rent they wish, although this is subject to the local PRS demand and supply.
2. Dwellings which are charged less than €681.02 are subject to the rental price increase regime of the regulated market, regardless of the points the dwelling has
Taking into consideration part 1, the remainder of the dwellings with points over 142 will only be in the unregulated market (i.e. not subject to rent increase rules) if the contract states that the rent is above €681.02 (set for 2013). With dwellings ob-jectively rated above 142 points it is important to stress that the threshold for rents to be liberalised is the amount of rent the landlord charged, rather than the points quality of the dwellings. Dwellings are usually charged less than the objective characteristics due to the market conditions or when the Housing Associations are fulfilling a social role of providing affordable housing. For example, a dwelling in East Groningen could exhibit 160 points due to its objective characteristics, but due to the rental market in that area the landlord can only rent the dwelling out at €660 per month, which would result in the dwelling being in the regulated sector. The rents of 95% of rental properties are regulated.
Dwellings with points less than 143 points has a rent price ceiling
Dwellings with points over 142 has neither a rent price ceiling or floor

26
TABLE 1: PRICE LIBERALISATION THRESHOLD PER YEAR Guilders Conversion to Euro Euro 1989 ≥ ƒ 750,- (€ 340,34) 1990 > ƒ 775,- (€ 351,68) 1991 > ƒ 820,- (€ 372,10) 1992 > ƒ 865,42 (€ 392,71) 1993 > ƒ 913,33 (€ 414,45) 1994 > ƒ 963,75 (€ 437,33) 1995 > ƒ 1.007,50 (€ 457,18) 1996 > ƒ 1.047,92 (€ 475,53) 1997 > ƒ 1.085,- (€ 492,35) 1998 > ƒ 1.085,- (€ 492,35) 1999 > ƒ 1.107,- (€ 502,33) 2000 > ƒ 1.149,- (€ 521,39) 2001 > ƒ 1.193,- (€ 541,36) 2002 > € 565,44 2003 > € 585,24 2004 > € 597,54 2005 > € 604,72 2006 > € 615,01 2007 > € 621,78 2008 > € 631,73 2009 > € 647,53 2010 > € 647,53 2011 > € 652,52 2012 > € 664.66 2013 > € 681.02
Source: Ministerie van Infrastructuur en Milieu
RENT INCREASES FOR DWELLINGS WITH RENT UNDER €681.02
Rent can be increased by the Minister for Housing via a yearly decree (Besluithuur-prijzen Woonruimte). Since 2008 this increase has been kept at the level of inflation. It has been subject to a considerable amount of political discussion, with the Social Democratic Party ensuring low rent increases in order to maintain the support of its tenant voters during the financial crisis.
On one hand, this low increase ensured that there was a sufficient match between income and housing costs, in order to ensure there was not a large reliance of low-er income households on rent allowance subsidies. The Tenants’ Associations ar-gue that this measure was greatly welcome at a time of wage cuts and unemploy-ment.
On the other hand, the artificial setting of rental prices too low will distort the housing market through two main channels. First, it discourages private invest-ment in the lower quality housing stock by ensuring zero or insufficient returns to

27
equity. With dividends below 5% the private sector has been withdrawing from the market. Secondly, creating a cost differential with the liberalised market en-courages households to remain in the regulated sector. Many households have got access to the regulated market with a low income, and then remain in the market after their wage increases have increased.3 The effect of middle income house-holds remaining in low points dwellings has restricted the supply of low quality dwellings.
The stated increase from the Minister in the decree is incorporated into the rental contract through a possibility of three channels:
I. an indexation clause in the contract states that the yearly decree is auto-matically factored into the rent charged,
II. the landlord unilaterally informs the tenant that the contract will be changed taking into consideration the stipulated increase, or
III. the Rent Tribunal will confirm the proposed change to the contract which the landlord has made according to the decree.
The landlord may increase the rent more than what the decree states should the new rental amount be below the rental price which the apartment can be rented out according to the points it objectively has. In doing so the landlord must offer in writing the number of points afforded to the property, how this relates to the new rental price, and give information about his management and tenancy policy. Any arising disputes will be referred to the Rent Commission for assessment.4
The following table and graph shows the dynamics between rent and inflation.
TABLE 2: INFLATION AND RENT INCREASE 2002 2004 2006 2008 2010 2011
Rent increase
(incl. Harmonisation) 2.9% 3.1% 2.7% 1.9% 1.6% 1.8%
Inflation 3.4% 1.2% 1.1% 2.5% 1.3% 2.3%
Percentage of Housing Stock According to Rent Increase
until 0% 0.70% 0.70% 0.70% 1.20% 1.20% 1.20% 0% 6.30% 4.80% 5.60% 5.60% 4.80% 4.40% 0 to 1% 0.70% 2.00% 1.70% 1.10% 1.70% 1.20% 1 to 2% 2.50% 5.80% 16.80% 83.40% 84.70% 85.70% 2 to 3% 50.00% 33.60% 46.60% 3.10% 2.50% 2.50% 3 to 3,9% 28.40% 28.40% 24.20% 1.00% 1.40% 1.00% from 3,9% 11.50% 24.70% 4.50% 4.60% 3.80% 4.10% Rental Stock 3,080,300 3,025,133 2,975,790 2,934,455 2,917,848 2,908,590 Source: Cijfers over Wonen en Bouwen 2013, Ministerie van Binnenlandse Zaken en Koninkrijksrelaties.
3 Susan Fitzpatrick and Mark Stephens (eds.) (2009) The Future of Social Housing. London: Shelter. 4 See Chapter 3 for more information about the Rent Commission

28
FIGURE 1: DEVELOPMENT OF RENT INCREASE AND INFLATION
Source: Centraal Bureau voor Statistiek(CBS), Cijfers over Wonen en Bouwen 2013, Ministerie van Binnenlandse Zaken en Koninkrijksrelaties.
RENOVATION AND RENT INCREASES
Renovations can only raise the rent if they are actually improving the utility of your enjoyment of the dwelling, and not if the renovation is merely ensuring the quality of the dwelling as stipulated in the contract. For instance, should the con-tract originally say there should be a tiled bathroom, and the tiles have only been replaced with new ones, then this will not permit an increase in the rent.
Furthermore, there is a distinction between repair, maintenance and cleaning which is expected of the tenant and that of the landlord. This table stipulates where the different obligations lies according to each actor.
Maintenance: Tenant Responsibility Landlord Responsi-bility
Painting
Whitening interior walls and ceil-ings, and painting or papering of interior woodwork and interior walls as needed
Exterior Painting
Preparatory work for the painting
Plastering and/or filling holes, open-ings, closing low shrinkage cracks
Minor works Securing and screwing include loose parts, e.g. handrails, doorknobs,
0,000,501,001,502,002,503,003,504,004,505,00
%
Rent Increase Inflation

29
Maintenance: Tenant Responsibility Landlord Responsi-bility
thresholds, electrical switches, out-lets, doorbells, floor grilles, diffus-ers, keys in locks and locks.
Parts and compo-nents housing
Replacement and renewal, include water taps and parts of faucets, doorknobs, locks, latches and hing-es, floor grilles, diffusers, keys in locks and outside locks, fitting for douchette and toilet, garnish toilet, electrical switches and sockets, door bells, cable connections, telephone and computer connections and similar components of data net-works
Hinges, locks, valves etc.
Anti-blocking, regularly checking the movability, oil, grease or descal-ing of movable parts
Major repairs, re-placement
Congelation Facilities to prevent (of repair) freez-ing of taps
Lighting Replacement of bulbs in common areas and on the outside of the housing
Repairs and replace-ment of fixtures
Windows and built-in mirrors
Replacement of damaged and bro-ken windows and mirrors if the costs are low
Technical installa-tions within the home
Include bleeding and refilling cen-tral heating system, restarting the heating system after failure, filter replacement and cleaning of grills, where the costs are low and there is therefore no specialist knowledge required
Repair, inspection, replacement
Draught Proofing Installing and maintaining draft-proof facilities where costs are low
Parts located out-side the house
Include replacement and renewal of parts of mailbox, outdoor, carport,
Replacement when worn

30
Maintenance: Tenant Responsibility Landlord Responsi-bility
flagpole holder provided the costs are limited
Gardens, yards, driveways and fences
At first instance habitation garden or yard. After levelling the garden and the application of topsoil. Regu-lar mowing the grass. Regular re-moval of weeds in the garden and between tiles driveways, access paths, and terraces. Replacing bro-ken tiles. Regular trimming hedges, hedges and sprouting trees. Replac-ing plants that died. Replacing bro-ken boards or segments of wooden fences. The right turn and straight wooden fences. Regular varnishing or painting fences
At first habitation construction drive-ways and access paths and make simple boundary. Major re-pairs, replacement
Chimneys, exhaust and ventilation ducts
Cleaning, sweeping and unclog if accessible by tenant
Major repairs, re-placement
Sewer
Keep clean and unclog the drains in to the terminal from the living area of the leased property to the munic-ipal sewer system or the sewer where the sewer tenant accessible
Landfill Sleeve. Garbage Space
Keep clean and unclog the garbage chute as necessary. Cleaning of the garbage room. In both cases where the tenant accessible
Repairs
Living area and common area
Ensure cleanliness
Windows, window frames, door frames, painted woodwork and other painted parts
Washing and cleaning the inside and outside of the windows, win-dow frames, door frames, painted woodwork and the other painted parts. To the extent that the tenant accessible
Pests Fighting fleas, ants, wasps, lice and The control of cock-roaches, pharaoh

31
Maintenance: Tenant Responsibility Landlord Responsi-bility
to the extent such costs are limited ants, longhorn beetles and wood worms (due to force majeure)
Rain gutters and drains
Regular cleaning. Insofar as tenant accessible
Replacement and re-pairs
Litter Regularly remove
Graffiti Delete where not derive any note-worthy costs and provided for ten-ant accessible
Zinc and cesspools and septic tanks
Emptying Replacement and re-pairs
As stipulated in chapter 2, Art. 7:220 DCC states that if the dwelling is in need of renovation, the tenant can be compelled to allow the renovation. Should the reno-vation require the tenant to move out of the dwelling temporarily while the work is being done, he must do so in return for rent reduction and damages.
Improvements to the dwellings which increase the utility can lead to an increase in the rent, but only in accordance with the points system. The additional rent for the improvements can be added to the rent increase as stipulated by the Ministeri-al decree. Art. 7:255 DCC states that after renovation, the tenant must pay the in-creased rent that corresponds to the costs of improvement. For instance, with double glazing windows, you need to pay the increased utility from the double glazing, but not the entire cost of the windows, as normal windows were part of the contract. The increased rent for double glazing should be no more than €10, while installing a new heating system where there was no previous central heating would amount to around €40.
The calculation of the increased rent according to the cost of improvement is fairly complex:
1. The costs must be separated between simple replacing/fixing/maintenance costs (Groontonderhoud) and improvements of comfort (Geriefverbetering), us-ing only the later for calculating the increased rent.
2. Any public subsidies or tenant contributions must be deducted from this cost.

32
3. The actual cost to execute the improvements include:
a. General construction site costs
b. General company costs
c. Risk premium in connection with increases in salaries or material costs
d. CAR insurance
e. Preparation and supervision costs
f. VAT
4. Each type of renovation is classified into the different repayment time peri-ods of 15, 20, 25 and 30 months.
5. The interest on the costs of renovation is calculated on the basis of the monthly cost of a mortgage on the basis of annuity, using the average inter-est rate at the time which construction started.
6. Using the total cost of the improvement to living renovation, the time frame for repayment and the applicable monthly interest, the total amount which can be added to the rent is calculated.
7. This is deemed the reasonable increase of rent, which can be contested in the Rent Commission.
The normal case of conflict would be the landlord stipulating a rent increase, fol-lowed by a refusal of the tenant to pay the new level. Therefore, where there is a conflict between the landlord and tenant over how much the rent should be in-creased, the landlord can refer the case to the Rent Commission. Alternatively, if your landlord is a Housing Association or an institutional investor planning on renovation with more than 10 apartments in the building, then they must consult the tenants as to the renovation work. Should less than 70% disagree to the work, then the work is deemed reasonable and the landlord will proceed. Should more than 70% of the tenants disagree then the tenants have 8 weeks to ask the court to rule whether the proposed plans are reasonable.
POSITIVES OF THE POINTS SYSTEM
SIMPLICITY
The first main positive of the points system is that it is very simple in practice to compute. The only three areas which can be debated with regards to the points are the characteristics of the neighbourhood, annoying situations and the value of the house in accordance with working out scarcity points. Nonetheless, given the system has been in use for the past 40 years, there is a sufficiently clear statutory material and jurisprudence on how to calculate a neighbourhood character and what can be regarded as an annoying situation. For example, should a tenant

33
agree to a contract over a major road, then it is implicitly accepted that there will be noise pollution.
Furthermore, there is considerable support for tenants to calculate their points through the tenants organisations and the Tenants Association, and the points can be assessed by the Rent Commission. Nonetheless, challenges against the number of points being attributed is not the main source of complaints to the Rent Com-mission. The rent can be easily calculated using the online programme at www.hurders.info, which allows tenants to enter details of their dwellings in order calculate the points.
PREDICTABILITY
The points system has been relatively unchanged over the past 40 years, hence-forth showing that there is a sufficient degree of acceptance, effectiveness and po-litical support. The system ensures that investors know what limits they can achieve in the market, either in terms of the maximum rent they can charge for a dwelling or knowing that rent increases would be regulated by the government with all the political risk that comes with. Similarly it offers tenants a security of tenancy and long term affordability of housing, which enables long term financing security.
MAINTAINING AN AFFORDABLE MARKET
The points system’s main aim is to ensure low income households have affordable rental dwellings. It thus ensures that there is not an over-reliance on housing ben-efits for low income households to afford dwellings in the more expensive liberal-ised market. In areas such as Amsterdam, where there is a huge demand for a lim-ited supply of dwellings, the prices would be extremely high for rent and purchas-ing. Therefore, it is accepted that there is support for the least well off in society to provide them with social dwellings in order keep these areas accessible to low in-come households.
The Dutch housing market is proud of following the policy of a ‘Social Mix’, which encourages at least a modicum of population socioeconomic diversity.5 Housing policy is used to bring together into the same neighbourhoods households of dif-ferent income. The aim is to reduce the number of run down low income neigh-bourhoods stigmatised with crime and unemployment. Affordable rent will insure that low income households will not be frozen out of improved neighbourhoods.
It can be argued that the points system has deflated the private rental market by encouraging households to stay in the regulated market instead of moving to the liberalised market. The stipulation that rent is increased in accordance to the Min-isterial decree when the rental price is below €681.02 (2013) has led to many houses which are above 142 points to be kept in the regulated sector, especially by the Housing Associations.6
5 Wendy Sarkissian (1976) ‘The idea of social mix in town planning: An historical overview’. Urban Studies, 13(3), pp. 231-246. 6 See Chapter 7 on Housing Associations for greater detail.

34
NEGATIVES OF THE POINTS SYSTEM
TOO MUCH DETAIL
Although the points can be calculated very methodically, some argue that the cal-culations are too arcane, with people having to measure the size of the kitchen sink, the number of tiles in the bathroom, et al. The Rent Commission tries to help this problem with their online rent calculator, which is due to be updated at the end of 2013. In chapter 4 it is shown that the proposed reforms of the points sys-tem will increase the detail and difficulty of calculating the points, which should result in greater numbers of tenants complaining to the Rent Commission.
REGIONAL DIVERSITY OF THE PRS
Previous to reforming the points system to include scarcity points, there was a cri-tique that a dwelling in the heart of Amsterdam was subject to the same rent max-imum as an objectively similar dwelling in East Groningen.7 A bi-product has been the black market for apartments in high demand areas, whereby tenants have been paying the regulated rent and then sub-renting the dwelling out for consider-able profit. Arguably the black market rent is the real market value, showing the real effect of the regulation against supply and demand dynamics. Nonetheless, it has been claimed that the black market has been reduced due to integrated infor-mation systems. The scarcity points do contribute to balancing out the regional variation of housing markets, but the impact will be slow given its applicability to only new contracts. On the other hand, the reform to include scarcity points has not been welcomed by the Tenants Associations and social scientists on the basis that it will contribute to the erosion of the “social mix” of the Dutch rental market.8 This argument suggests that integrating low cost dwellings together with higher costing rental and owner-occupied dwellings has contributed to neighbourhoods of variable wealth and thus greater social cohesion and less stigmatised poor areas. Thus making certain regions more expensive will be pro-cyclical – higher income households will live there, rent will increase and become less accessible for lower income households, and in turn stimulating higher rents. The “transformation of a working-class or vacant area of the central city to a middle class residential and/or commercial use” is known as the process of gentrification.9
RENTAL PRICE FAILING TO RELATE TO THE POINTS
Another criticism of the points system, usually put forward by the private inves-tors, is that the points system does not require dwellings which are above 142 points to be liberalised. The argument is predominantly made against the Housing Associations, which are found to rent out a considerable number of dwellings over the 142 points at prices below the €681.02, thus in the regulated market. Although previously stated the positives include more affordable housing for many tenants and a deflation of the whole rental market, it has crowded out investors from the market for dwellings with points from 142 to 200. In other words, the Housing As-
7 For more information about the housing market, and the regional variation of house pric-es, see page 59. 8 See page x 9 Loretta Lees, Tom Slater, and Elvin K. Wyly (2008) Gentrification. New York: Routledge.

35
sociations are renting out dwellings at 72% the price stipulated by the relevant points, meaning that dwellings between 142 and 200 are brought into the rent regulations. By offering these dwellings which should be on the market between €681-750 per month at low prices, and with regulated rent increases providing very low dividend, the private sector cannot compete. This is part of the reason why the reforms are going to bring these dwellings into the liberalised market.10
UNFURNISHED DWELLINGS
The points system fails to consider that most dwellings are rented out unfur-nished, and the impact this has on user costs. This means that tenant has upfront costs of even basic cooking and laundry facilities. These can prove highly signifi-cant for those without any such furniture and households with very low income. It is insignificant for a comparison of the user-costs with home-owners who can af-ford furniture and would in any case need their own furniture. Nonetheless, mov-ing costs and the cost of having to furnish a larger sized apartment are not includ-ed in the decision to move into a new dwelling.
UNREGULATED UTILITIES
Secondly, the points system does not consider the utilities bills, which are paid according to the actual cost of energy used. Haffner and Boumeester (2010) show how important unregulated energy market costs are to households as a percentage of their income.11 The authors use the Dutch ‘WBO 2002’ and ‘WON 2006’ housing surveys, which have a sample size of more than 60,000 households.
TABLE 3: DEVELOPMENT IN HOUSEHOLDS’ ECONOMY BETWEEN 2002 AND 2006
Household's economy Total change Gross rent 13% Housing Allowances 18% Net rent 12% Gas Price 77% Electricity Price 50% Local Property Tax Abolished Income -2% Net-expenditure-to-income + 3.6% Total expenditure (including utilities bills) to income 6% Source: Marietta Haffner and Harry Bouwmeester (2009) ‘Affordability of housing in the Netherlands: an in-creasing gap between owning and renting’
10 In greater detail in chapter 7 on the Housing Associations. 11 Marietta Haffner and Harry Boumeester (2009) ‘Affordability of housing in the Nether-lands: an increasing gap between owning and renting’. Paper presented at International Symposium on Housing Affordability and Market Stability, 24-27 March 2009, Tsinghua University, Beijing, China.

36
It is important to separate this issue from that of your landlord charging too much in comparison to the actual energy bill. This problem is sufficiently prohibited in tenancy law, and cases can be brought before the Rent Commission.12
Although the energy costs have been decreasing for the past 3 years, the govern-ment recognises the long term energy price challenge. Their response is to en-courage private investment or implement object subsidies in energy efficiency, in-stead of rent regulation. An evaluation of government policy towards increasing energy prices on the economy is too expansive for this report, but nonetheless de-serves consideration for the future given the real impact on to the tenants and how this impacts on their ability to pay the rent. It has been suggested that tenants are more likely to pay their utilities bills before their rent when they can only pay one of the two, as the energy companies have the ability to turn off the supply while non-payment of rent has 2 or 3 months of non-payment before an eviction claim can be made.
REFORMS TO THE POINTS SYSTEM
MARKET VALUE POINTS
One major reform that is being considered will be including the market value of the dwelling into the number of points it gets. This is following the 25 scarcity points which have been introduced for 10 regions. The logic is that the scarcity points will accommodate for differentiation between regional market pressures, while the market value will differentiate the neighbourhood characteristics. The Coalition Agreement originally stated that the rent would be completely deter-mined by the value of the property. With this policy the rent prices would go down in many areas of the Netherlands, especially in the peripheral areas, given the low market value of the dwellings. Furthermore, landlords were uneasy with the pro-posal as it would reduce the stability of their rental income, whereby rent would be tied to the movements of the housing market. The rental market would then lose its status as a cyclical stabiliser against house prices and as an alternative safe as-set class. The latest policy idea is to factor in the market value into the points sys-tem, so that the maximum rent would be increased by 4.5% of the value of the dwelling.
Although the plans are due to be announced in Autumn 2013, it is expected that the market value will be the same method used by the tax authorities to value properties, as stipulated by the Property Valuation Act 1994 (Wet waardering onroer-ende zaken, WOZ). The banks use WOZ value as the value of the property for mort-gage calculations. In 2006 the Netherlands had 7m WOZ rated properties, of which 85% are homes. The WOZ value is determined by the value of the property should there be a full and unencumbered ownership transfer. The method used for homes is the comparison method, which is a study of similar properties that have been sold around that date. Should there be no sales of similar properties availa-ble, sales from other dates are used and then recalculated to the current date value level. For homes under construction, the value is determined on the percentage of how ready the building is according to its depreciation replacement costs (gecorri-
12 See chapter 3, pp.

37
geerde vervangingswaarde, GVW). The GVW is the value of the land plus an estimate of the investment put into the building. The municipality calculates the WOZ val-ue, and should there be a challenge, the owner can bring the case to the Valuation Court, which is an independent administrative body with public legal personality. Challenges can then be made to through the courts. The Minister of Finance is po-litically responsible for the WOZ.
Henceforth, the rent regulation will be a mix of objective characteristics (points system) and a market value (of how much the house is worth if you were to sell the property on the market). Nonetheless, the exact market value is unknown given the price setting of the Housing Associations (see Housing Associations section) and the huge subsidies of the home-ownership market. The points system was created so that the open-market would not determine the rental price for many tenants, as the social aim was to create affordable rent for a large target group.
It is thus necessary to distinguish between the market value of the underlying worth of the assets and the open market rental value (OMRV). While there is rent regulation and the market power of the Housing Associations, the OMRV is not ac-curate. However, taking account of the rent regulation, there is a 6-8% of the Dutch rental market in which the dwellings are non-regulated with an open market rent-al value in place. In that market supply and demand are more or less identifying what OMRV is, although the only way to validate this would be to refrain from reg-ulation, which is a highly unlikely policy.
ENERGY EFFICIENCY
The energy efficiency points for heating devices (part 3) and thermal insulation (part 4) are being reformed, so that the dwelling is measured for energy efficiency as a whole. There are two reasons why the reforms were taken.
The first reason is due to the fiscal stimulus of the government into the rental sec-tor in energy saving subsidies. In response to the financial crisis, the Dutch gov-ernment responded by creating the ‘Working for the Future’ agreement on 25 March 2009. The measures included an incentive budget of €395m to boost con-struction of market-sector housing units and €320m in energy investment allow-ances to stimulate sustainable investment by owner-occupiers and tenants. The emergency stimulation for sustainable investment was mainly through the exten-sion of the energy investment allowance (EIA) for energy-saving investments in business machinery for 2009-10. Energy-saving investments in existing rented dwellings (€160m in 2009 and €160m in 2010) were subject to energy level B or two-step improvements. A maximum investment of €15,000 per dwelling applies for the energy investment allowance, with a 44% deduction before fiscal profit deter-mination. Housing Associations were particularly attracted to this deal, with 100,000 extra dwellings a year subject to energy-saving measures. Therefore, in need of showing a two-stage improvement, there needed to be a continual rating of energy rather than the points per item.

38
The second motivation for this reform comes from the European Directive on Ener-gy Performance of Buildings (EPBD).13 The EPBD requires 5 concrete policies to im-prove the energy performance of buildings in all EU countries:
• Requirements for a general framework for the method of calculating the in-tegrated energy performance of buildings.
• Minimum requirements for the energy performance of new buildings.
• Minimum requirements for the energy performance of large existing build-ings that undergo major renovation.
• Energy certification of buildings.
• Regular inspection of boilers and air conditioning systems, and in addition assessment of the heating installation in which the boilers are more than 15 years.
The main points of the revised EPBD include:
• As of December 31 2020, all new buildings in the EU must have 'nearly zero' energy consumption and the energy for 'a very large extent’ must come from renewable sources.
• There is a binding target of zero energy by 2021 for new buildings
• Government’s new buildings or those which they 'inhabit' from December 31 2018 should set an example by building, buying or renting 'nearly zero-energy buildings.
• The definition of "nearly zero-energy building" is described in the Directive as a building with very high energy efficiency. According to the text of the Directive, this means a near zero net consumption or uses a very low amount of energy. The Dutch government is still considering the final in-terpretation of this definition.
• There is no specific target for the renovation of existing buildings, but the EU Member States must set an example in the public sector by developing policies and measures to boost the concept. Measures taken to transform buildings to very low energy by Member States must be notified to the Commission in their national plans.
• A cost-optimal requirement (U-value) is placed on the insulation of the building structure when major renovations are carried out. This is done by tightening the insulation in the building, so the value is raised to a slightly higher level than is currently the practice in the market.
• There should be a harmonized cost-optimal level calculation method for minimum energy performance requirements in Member States. This will be refined in the EU’s comitology procedure.
13 Directive 2002/91/EC of the European Parliament and of the Council of 16 December 2002 on the Energy Performance of Buildings

39
• States will have to introduce penalties for non-compliance. Member States shall lay down the rules on penalties applicable to infringements of national provisions introduced by this Directive.
• A more detailed and rigorous procedure for issuing energy performance cer-tificates (energy labelling) will apply in Member States.
• Control will be needed in the Member States to check the accuracy of the energy performance certification.
• States should introduce penalties for non-compliance with national provi-sions introduced under the Directive. They must also take all necessary measures to ensure that they are implemented. The penalties must be ef-fective, proportionate and dissuasive. Member States shall report these pro-visions to the Commission.
Therefore, in the Dutch PRS, energy labelling has been introduced. The dwelling is rated by the government, with the energy efficiency labels being found online at ep-online.nl. Points for parts 3 and 4 (heating and thermal insulation) will be re-placed with the following energy labels:
Energy and Points
Energy corresponding to Single Family Multifamily/ Duplex
Label A + + 44 40
Label A + 40 36
A Label 36 32
Label B 32 28
Label C 22 15
Label D 14 11
Label E 8 5
Label F 4 1
Label G 0 0
Source: Dutch Ministry of the Interior and Kingdom Relations, found at http://www.rijksoverheid.nl/onderwerpen/huurwoning/puntensysteem-huurwoning/puntensysteem-en-energielabel (accessed 06/06/2013).

40
Should there be no energy efficiency label for the dwelling, you can determine this on the basis of the year of build:
Energy to year
Year Class house corresponds with energy
more family corresponds with energy
2002 and later A A
2000 t / m 2001 B B
1998 t / m 1999 C C
1992 t / m 1997 C D
1984 t / m 1991 D D
1979 t / m 1983 E E
1977 t / m 1978 F F
1976 and older G G
Source: Dutch Ministry of the Interior and Kingdom Affairs, Ibid.
A landlord who believes their energy efficiency is greater than this estimation table can use further methods to assess the energy efficiency of the dwelling.
The consequences of this measure is that the rent can be increased or decreased according to the overall energy rating of the house, when comparing the points afforded for part 3 and 4 of the points valuation above. Nonetheless, this new for-mat for energy points is only applicable currently for dwellings contracted for on or after 1 July 2011. It will be applicable for all dwellings from 2014.
Over 2 million Dutch dwellings had an energy label by the end of 2011. This is over a quarter more than at the end of 2009. About 90% of all dwellings with an energy label is rented and almost 10% owner occupied. In the last two years there has been a sharp increase in the number of owner-occupied dwellings receiving an en-ergy label, but all in all there are still relatively few. Since 1 January 2013 dwellings can no longer change hands without an energy label. Dwellings built between 1945 and 1959 often get an energy label E, F, or G. This means they are not energy effi-cient. There was a huge shortage of homes after World War II. So because huge numbers of dwellings had to be constructed urgently, the quality of construction was under pressure. Most dwellings with an inefficient energy label were built in

41
the years 1960–1970. In this period the housing shortage had still not been solved. Building many dwellings was more important than building energy efficient dwell-ings. Over 202 thousand dwellings from this construction period were labelled inef-ficient. This is one third of all dwellings labelled energy inefficient.
FIGURE 2: ENERGY LABELS OF DWELLINGS BY YEAR OF CONSTRUTION
Source: CBS, Web magazine, 23 October 2012
Dwellings constructed after 1980 became more and more energy efficient. Hardly any dwellings labelled energy inefficient were built then. Insulation of roofs, walls and floors became standard in newly constructed dwellings in the 80s and double glazing in 1994. In recent years many dwellings for the rental market were made more energy efficient. On the basis of the energy label a dwelling receives points that influence the rent level. An energy efficient label is currently an exclusive sales argument for dwellings.
The institutional investors state that the reforms mean that investment will only be made to increase energy efficiency when the energy classification of the dwell-ing will increase by two steps. Should the renters’ perception of energy efficiency be low, then they will not value the benefit in accordance to the increased rent, thereby reducing the popularity of newly built or refurbished housing stock. This problem is acerbated when the tenants in a building have the power to stop reno-vation work being carried out by their institutional or Housing Association provider when 70% object to the development.
AEDES argues that it has a very unique and fair way to ensure energy modernisa-tion of their Housing Association stock. The main philosophy is encouraging ten-ants to welcome the renovation rather than forcing them to accept it. They split
0
100
200
300
400
500
in 1
000s
A and B C and D E, F and G

42
disadvantage of the rent increase with the advantages of lower utilities costs, with a net gain for the tenants. For example, a reduction of the utilities bills of €100 would be matched with an increase of rent of €75, thus benefiting the tenant €25.
FIGURE 3: ENERGY LABELS OF DWELLINGS BY PROVINCE
Source: CBS, Web magazine, 23 October 2012
INCOME ASSESSED RENT INCREASES
There is a criticism that access to the regulated market is not contingent upon the household income level. This leads to many households remaining in the regulat-ed sector, benefitting from the low rent and regulated increases.14 The high de-mand from middle income households for regulated dwellings thus effectively squeezes out some low-income households from the market, who then have to rent on the private market, financed by rent allowances. With 30% of rented sector receiving rent allowances, the government argues that a better allocation attached with rent regulation would increase fiscal efficiency. Nonetheless, the government recognises the positive influence to neighbourhoods which the ‘social mix’ of in-come diversity has had. Therefore, there is considerable opposition to more in-come assessed rent increases, as it is feared it might leave areas with high levels of regulated dwellings with more households of low income, and thus causing areas to become undesirable such as the council estates in the UK.
As will be shown, the Housing Associations control the vast majority of the regu-lated sector. Therefore, in 2013 the income limit for access to Housing Associa-tions’ dwellings will be set at €34,000, increased from €33,000, which amounts to
14 Gerbert Romijn and Paul Besseling (2010) ‘Economische effecten van regulering en subsi-diering van de huurwoningmarkt’ (Economic effects of regulating and subsidizing the rent-al housing market) CPB Discussion Document No.165. The Hague: CPB. (In Dutch)
ZeelandSouth Holland
LimburgNorth Holland
FrieslandNorth Brabant
GroningenGelderland
UtrechtDrenthe
OverijsselFlevoland
A and B C and D E, F and G

43
40% of rental households. To encourage households with incomes above €34,000 to leave the regulated sector and increase the allocative efficiency the annual rent increases will increase according to the income of the household. Assuming that inflation is at the 2% which the ECB targets, a 6% rent increase for households with income over €43,000 per year renders the difference between the regulated and unregulated sectors minimal. Nonetheless, this provision would not force high income tenants out of their social dwellings, where other policy proposals have included an income assessment every few years. They state that the rent increase (for 2013-2014) will be:
• Household income below €34,000: inflation + 1.5% increase
• Household income between €34,000 and €43,000: inflation + 2% increase
• Household income above €43,000: inflation + 4% increase
LANDLORD LEVY
A new tax is introduced: the Landlord Levy (verhuurderheffing). This tax is levied upon the ownership of houses in the regulated housing market. The levy is calcu-lated upon the aggregate WOZ value of the houses. An exemption exists for the value of the first ten houses of each owner. Therefore, the levy will only apply to institutional investors and Housing Associations with more than 10 dwellings with rent under €681.02. For 2013 the tariff will be 0,0014%, for later years a 0,231% rate will apply. With the large share of the regulated dwellings belonging to the Hous-ing Associations, it is expected to tax them €1.7bn per year. Chapter 8 discusses the landlord levy and its impact in the rented market in detail.
CONCLUSION
The points system has been in place for a considerable time, showing its positive aspects of controlling rent increases and providing simplicity for tenants. Howev-er, the archaic manner in which it evaluates the quality of a kitchen by measuring the size of the sink rather reflects its dated position in the housing market, as the government reform aims show. By using an objective calculation of the quality of the dwelling as a means of household access to the regulated market, it fails to consider the dynamics of the geographical location and the income of the house-hold. To understand the rationale for the existence, operation and reforms of the points system, it is necessary to review the complimentary institutions, the hous-ing market, the political economy of Dutch housing, the user costs of tenure choice and the role of the Housing Associations.

44
CHAPTER 4: INSTITUTIONS
To comprehensively understand how rent regulation and tenancy law operates in practice, it is necessary to institutions surrounding its application and normative development. This chapter will review how the Rent Commission has a major role in the regulated rental market, where resort to the courts is much lower than other jurisdictions. The courts are thus usually the second point of contact for the regu-lated dwelling tenants, and the first point of contact for the unregulated dwelling tenants. They deal more with eviction cases in tenancy law. This chapter then assesses the support tenants can get from Tenants Organisations, Tenant Domes, the Tenants Association and Neighbourhood Groups. The final part reviews the major policy players in the rental sector, including the CFV, the WSW, the Minister for Public Housing, the Housing Association umbrella group (AEDES) and the Insti-tutional Investors umbrella group (IVBN). The IVBN and AEDES have been included in this chapter on the basis of their normative power over housing policy, in com-parison to the other institutions which perform mainly practical roles. Further-more, many of the institutions have legislative authority through the Consultation Act (Overlegwet) 1998, reformed 2009.
Other institutions considered in this report, including the Municipal Banks, The Mortgage Guarantee Fund and the Central Planning Bureau, et al, are not included in this chapter given their indirect impact on the rental sector, but are nonetheless explained elsewhere.
THE RENT COMMISSION
The Rent Commission (Huurcommissie) serves an essential role in the Dutch PRS rent regulation. It is an institution which at its core acts as a mediator between landlords and tenants in cases of tenancy and rent regulation disputes. On a more expansive level, it gives out advice and information publically regarding tenancy and rent regulation issues. Although funded by the government, it acts inde-pendently.
The Rent Commission is given statutory authority through Article 3a of the Imple-mentation Act Residential Rents. Historically Rent Commissions have existed in the Netherlands since 1917, where the initial aim was to help the protection of weak tenants. They were local institutions until 1970, when the national points system required a national Rent Commission. The Rent Commission assesses rent issues for the regulated market dwellings. In theory it can issue guidance for par-ties in the liberalised market, should it be asked. Parties in the liberalised market can stipulate in their contracts that any disputes will be dealt with through the Rent Commission, although this is rarely done, despite its substantially cheaper costs than going through the courts.

45
Very rarely has the Rent Commission been asked to resolve a dispute in the liberal-ised market, due to both the fact that actors in this market are mainly highly pro-fessional managers of such dwellings, and dwellings in this market are afforded significantly less rent regulation protection.
The Rent Commission is financed by and accountable to the Minister of Public Housing, Spatial Planning and the Environment15. Therefore the CEO and Deputy are part of the government, appointed by merit and with only six year terms. Nonetheless, the Rent Commission is required by law to be legally neutral to the government, with a role to objectively assess cases according to the law. The staff of the Commission are Civil Servants. The Independent Governing Body (Zelfstan-dig Bestuurs Orgaan) of the Rent Commission consists of three members: the CEO (appointed by the government), a representative of the landlords and a representa-tive of the tenants (usually from the Tenants Association, Woonbond). This means that there is a balance of power in the institution insuring political independence and fair functioning.
People who are unhappy with the Rent Commission can complain to the Ombuds-man, although this is rarely done. There is a considerable amount of respect for the integrity and decisions of the Rent Commission. Externally it was found that the vast majority of judgements which the Rent Commission had decided were implemented and very few were appealed to court, as permitted in Art. 7:262. Fur-thermore, a public review of the Rent Commission is conducted every two years, with reforms carried out to ensure efficient public management. A previous re-form on the basis of policy review was to accept landlord’s requests to review a rent increase when the tenant stated they would not pay the new rent, rather than waiting for after three months of not paying the rent.
The main role of the Rent Commission is dispute resolution. The attractiveness of the Rent Commission fulfilling this role is simple: it is quicker and cheaper than bringing cases to the courts. Bearing in mind that although there is a freedom of contract in Article 7:246 DCC, any dwelling which has points below 142 has regu-lated rental prices. Accordingly, there are several types of disputes which the Rent Commission adjudicates.
1. Initial Rent Setting: According to Art. 7:243 DCC, the tenant has up until 6 months after signing the contract an opportunity to ask the Rent Commis-sion whether the rent price agreed is reasonable. In other words, was the rent within the 142 points in order to be regulated, and if so has the correct rental price been assigned to the number of points the dwelling exhibits.
2. Rent Increases: According to Art. 7:253 DCC the Rent Commission can be asked by either the landlord or the tenant to assess a rent increase proposal as to whether it is reasonable according to rent regulations. Usually the case is that the tenant refuses to pay the new rent level, and then the landlord brings the case to the Rent Commission to determine the legality.
15 From this point on referred to as the Minister for Public Housing

46
3. Rent Increases after Housing Improvements: Similarly to rent increases, according to Art. 7:255 DCC the parties can ask the Rent Commission to as-sess the proposed rent increase following an improvement of the dwelling. In other words, the Rent Commission will assess whether the increased points due to the improvement work correlates to the increased rent charged. Further considerations of reasonableness include whether the work was merely remedy to defects of the dwelling.
4. Rent Reduction: According to Art. 7:257 DCC, the Rent Commission can be asked to assess whether rent should be reduced when there is a defect in the dwelling. This is the most prevalent case which the Rent Commission deals with. The Rent Commission has outlined defects into three categories:
A. Maximum of 25% reduction, for defects such as no daylight in living room or bedroom, no bathroom facilities and unlocked doors.
B. Maximum of 45% reduction, for defects such as a serious and persis-tent odour from mistreated sewage, severe subsidence of the building and severe leakage of rain water.
C. Maximum of 55% reduction, for defects such as cracks in walls with more than 8mm, wood rot in window frames and a malfunctioning elevator.
5. Service/Utilities Charges: According to Art. 7:258 DCC the Rent Commission can be asked to assess whether the amount charged to the tenant for service charges both in terms of advanced monthly payments and in settling these off against the actual usage every year. This is the second most prevalent case the Commission deals with.
The Rent Commission will assess each case according to the law, and has the pow-er to resolve the dispute by changing the terms of the private contract between the two parties so that the tenant has their rent reduced for either a specific time or indefinitely should they have won the case. Should the landlord win the case, the Rent Commission will tell the tenant they have to pay the required rent as stipu-lated, but cannot amend the contract to increase rent to accommodate for damag-es. The landlord must increase the rent according to the rent increase laws as normal.
The Rent Commission also implicitly induces landlords and tenants to solve their disputes through the charges associated with bringing cases for assessment. When both parties bring a case the landlord must pay a deposit of €450 and the tenant €25. The party which “wins” the case receives their deposit back. The dif-ference thus means that the landlord will try to settle before going to the Commis-sion, especially when the disputed values are much lower than €450, and the €25 charge for the tenant discourages frivolous challenges or en masse multi-action cases. Prior to these charges, when the service was for free there were problems of lack of resolution negotiations and the Tenants Association (Woonbond) advising all the tenants to try challenging all the disputes.

47
Furthermore, the Rent Commission aims to increase its role in educating landlords and tenants on tenancy law and rent regulations, so that there will be less cases brought for resolution. For example, the Commission will have rent calculating software available from the end of 2013 which will enable people to work out the points of their dwelling online and through an app. They also aim to publish their decisions in order to give people case references in order to compare to their situa-tions. The increased role of providing information has proven successful in reduc-ing the cases brought to the Commission, and will improve its operational efficien-cy given the federal funding will be reduced from €20m to €11m.
The work load of the Rent Commission is very much correlated with the stability of Rent Regulation. When there has been changes to the system, such as the large increase in utilities bills in accordance to increased energy commodity prices or when the Minister increases the rise of rent applicable for the next year. They ar-gue that not only does reforming the points system create investor insecurity re-garding the future of rental prices, but also confuses the tenants as to how much rent they should be paying. Thus the Rent Commission is expecting in the medi-um and long term many cases regarding the extra points which can be assigned to dwellings in scarce areas. Similarly in the following years, as the Minister decou-ples rent increase from inflation, they expect the number of cases to rise. With regards to the proposal of linking the points system to the value of the property they argue this will create perpetually high number of cases as not only is the val-ue of the property legally uncertain, but the movement of the market value will ensure price instability and thus an increase in the number of cases brought for-ward.
The table and the graph below shows the decreasing number of cases brought to the Rent Commission, which is due to the inflation based low rent increases, the falling energy prices and the minimal rental policy reform in the past decade.
TABLE 4: INCOMING APPLICATIONS 2008-2011
2008 2009 2010 2011 2012
Initial Rent Dispute 4,901 6,561 5,910 5,270 4,582 Service Cost Dispute 4,184 4,288 4,049 3,078 2,367 Rent Increase Dispute 1,181 2,224 668 458 654 Rent Allowance Declaration Dispute 1,106 2,576 801 343 252
Total 11,372 15,649 11,428 9,149 7,855 Source: www.huurcommissie.nl, 2011-2012 Annual Reports of the Rent Commission

48
FIGURE 4: COMPLAINTS INTO THE RENT COMMISSION
Source: www.huurcommissie.nl, 2011-2012 Annual Reports of the Rent Commission
THE SUB-DISTRICT COURTS
The Netherlands is divided into 10 districts, each with its own court. Each court has a number of sub-district venues. The district court is made up of a maximum of five sectors. These always include the administrative sector, civil sector, crimi-nal sector and sub-district sector. Family and juvenile cases are often put into a separate sector, as is sometimes the case with the administration of the law con-cerning foreigners. The court board is free to determine such matters.
It is relatively simple for ordinary citizens to have their case heard in the sub-district sector. They have the right to argue their own case and do not need a law-yer to represent them in court. Cases are handled by a single judge.
In terms of civil law, the sub-district judge deals with all cases involving rents, hire purchase and employment. In criminal law, the sub-district judge only deals with minor offences, not serious offences. All cases of consequences under €25,000 (thus nearly all the rent cases) are brought through the sub-district courts first. Often these are cases in which the police or the public prosecutor has proposed a settlement. If the accused refuses to accept such a proposal, then the case comes before the sub-district judge. The sub-district judge usually delivers an oral judg-ment immediately after the hearing.
0
2.000
4.000
6.000
8.000
10.000
12.000
14.000
16.000
18.000
Nu
mb
er
of
ap
pli
cati
on
s
Initial Rent Dispute Service Cost Dispute
Rent Increase Dispute Rent Allowance Declaration Dispute
Total

49
THE COURT OF APPEAL
The 10 districts are divided into four areas of Court of Appeal jurisdiction: The Hague and Amsterdam in the west, Arnhem-Leeuwarden in the north and east and Hertogenbosch in the south.
With regard to criminal and civil law, the justices of the Court of Appeal deal with cases where an appeal has been lodged against the judgment passed by the district court. The Court of Appeal re-examines the facts of the case and reaches its own conclusions. In most cases it is possible to contest the Court of Appeal’s decision by appealing in cassation to the Supreme Court of the Netherlands. In addition to criminal and civil cases, the Court of Appeal also deals with all appeals against tax assessments, in its capacity as administrative court. Cases to be seen by the Court of Appeal must be over €1,750 in value.
THE SUPREME COURT
As the highest court in the fields of civil, criminal and tax law in the Netherlands, the Supreme Court is responsible for hearing appeals in cassation and for a num-ber of specific tasks with which it is charged by law. The aim of cassation is to promote legal uniformity and the development of law. The court examines wheth-er a lower court observed proper application of the law in reaching its decision. At this stage, the facts of the case as established by the lower court are no longer sub-ject to discussion.
An Attorney General’s office is attached to the Supreme Court. Its member’s main task is to provide the Supreme Court with independent advice, known as an advi-sory opinion, on how to rule in a case.
Not only judgments of courts of appeal can be appealed in cassation, also judg-ments of the Joint Court of Justice of the Netherlands Antilles and Aruba can be appealed in cassation to the Supreme Court
DEBT COLLECTION AGENCIES AND BAILIFFS
For tenants who owe the landlord money, they may have to deal with debt collec-tion agencies and bailiffs, although under strict legal parameters.
Both debt collection agencies and bailiffs collect debts on behalf of a creditor. In doing so, debt collection agencies are not permitted to use any coercive measures, like the seizure and sale of goods. Debt collection agencies are only allowed to send letters with a request for payment. Bailiffs, however, have a legal status and are permitted to use coercive measures. For this, they usually require a court order.
Collection costs are the costs you incur as a creditor in order to collect a money claim, if your debtor fails to pay this claim of his own accord. A statutory regula-tion exists for extrajudicial collection costs. The compensation is a percentage of the bill owed to you by your debtor. The minimum amount of compensation is € 40.

50
NOTARIES
The most important task of notaries and junior notaries is to record agreements in notarial acts, to keep the acts and to issue copies of them to the persons con-cerned.
After drawing up a notarial act they must also take responsibility for the activities that result directly or indirectly from the execution of the act. For example, they must arrange for the updating of the registers of immovable property, marriage contracts, public and private companies, foundations and cooperatives.
Notaries and junior notaries are also legal advisers. They preside over the discus-sions that precede the signing of a notarial act. In doing so, they weigh the inter-ests of all concerned and seek to strike a balance in the advice they give. Since rental agreements are not property rights and do not require being put on a land registry, notaries play a minor role in the PRS.
Since the new Notaries Act came into force in the Netherlands in October 1999 there has no longer been a standard scale of fixed fees for notarial work.
TENANTS DOMES (HUURDERSKOEPELS)
A Tenants Dome combines the interests of all tenants in a particular landlord, usu-ally for a building, but also in the cases of large private landlord/investors tenants form an umbrella organisation. Housing associations are legally obliged to consult their tenants. The Tenants Domes consult with the management of the corpora-tion on behalf of all tenants. The subject of consultation includes all matters which concern the tenants directly, such as the annual rent increase, individual complaints, new construction, renovation, the delivery of a policy of urban renew-al, financial health of the corporation and consultation for residents' committees to the quality of service.
Tenants Domes are voluntary organisations. The basis of the organisation consists of residents committees which are active in most housing complexes. They elect the Board of the Domes, who then sit in regular meetings. In many cases, the board hires external experts, paid through the subsidy that the housing authority is legally obliged to make available.
The position of a tenants dome is somewhat similar to that of a Works Council: it consults with the management of a corporation, which shall decide on key topics only after they have asked for the tenants dome advice. Although Tenants Domes receive funding from the landlords, they are independent organisations. The inde-pendence of the arrangement is usually written down in a cooperation agreement. Tenants Domes often do more activities, such as office hours for residents, a newspaper for all residents and support of residents committees.

51
URBAN TENANTS ORGANISATIONS
Urban Tenants organisations combine the interests of all tenants in a municipality. The urban tenants organisation often participates in the "three-party agreement 'between the municipality, corporations and residents. They are often a collabora-tion of all community organisations that are active in the community, such as res-idents committees, Neighbourhood Groups and Domes. Activities range from con-sulting, campaigning, supporting residents and community organisations to con-duct legal proceedings.
NEIGHBOURHOOD GROUPS
A neighbourhood group, the name says it all, is a group of people engaged in the local area. Usually they are residents, but may also be entrepreneurs, institutions or others who want to contribute when located in the area. Neighbourhood Groups come in all shapes and sizes - some only for their own street and others for an en-tire neighbourhood.
Sometimes neighbourhood groups organise activities for the neighbourhood, such as a neighbourhood party. However, most neighbourhood groups are primarily concerned with the quality of life in the neighbourhood. For example, they collect waste lying around, maintain green areas for children playing, ensure the safety of their streets, or try to do something against congestion. When necessary, the neighbourhood group conducts a consultation with the responsible public authori-ty.
A good way to address problems in the neighbourhood is the “Community Watch” actions (De Buurtschouw) where members of the neighbourhood group (or a resi-dents' committee), teamed with several public bodies, have a walk through the neighbourhood and see what is good and bad. As the main public bodies are pre-sent, immediately agreements can be made about how to tackle the problems.
Bodies which take part include the housing corporation, the municipality, the “Neighbourhood Janitor” (buurtconciërge), the police and the community centre. All of them have something to do with what happens in a neighbourhood, but each has the responsibility for a small part. By bringing them all together it prevents the neighbourhood group from being sent from between their administrative responsi-bilities. Usually the authorities find it worthwhile to receive feedback on their ser-vices. In most places, a community centre or community work agency helps community groups to organise activities and provides a place to hold meetings.
TENANCY ORGANISATIONS (LOCAL)
These are district centres which have the following roles:
I. giving free information, advise and support on rent and tenancy law, II. helping and encouraging residents to organise themselves in Tenants
Domes, Urban Tenants Organisations and Neighbourhood Groups, and III. actively standing up for the rights of tenants.

52
On district levels, these organisations also monitor policy and economics of the rental markets, providing the local tenants initiatives with expertise and quality reports and alerts.
TENANCY ASSOCIATION (WOONBOND)
The Dutch Tenants Association was founded in 1990. In 2011 the Woonbond or-ganises more than half of all households in the PRS, amounting to more than 1.5 million homes. Their objective is to lobby for affordable rent, good quality homes, liveable and safe neighbourhoods and strong tenants' organisations. The large membership of the Woonbond ensures adequate influence on rental policy. A member of the Woonbond will sit on the Board of the Rent Commission.
The highest body within the Woonbond is the Association Council (Verenigingsraad = VR). Its members are elected from Provincial Assemblies (Provinciale Vergaderingen = PVs). The number of members from one PV depends on the number of tenants in that provincial area. The daily management of the association is in the hands of management. The board is appointed by the Association Council (VR) local tenants' organisations, including residents committees, organisations at the level of ‘the landlord, tenants organisations acting on behalf of several landlords and so on. Additionally the Woonbond accepts individual members.
THE MINISTER FOR PUBLIC HOUSING
According to Article 7:248 DCC, rent in the regulated sector can be increased yearly according to a maximum percentage prescribed by the Minister of Public Housing.16 Since 2008 the Minister has kept the rent increases at the level of inflation, which have been welcomed by tenants and tenants’ organisations, but has been strongly opposed by the private landlords.
The power to change the rent increase is very limited to what the government par-ties have agreed to in their Coalition Agreement, which sets out policies for the term of government. The policies they conclude are evaluated by the Central Planning Bureau (CPB), which analyses the effects of all current and future gov-ernment policies.
WSW (WAARBORGFONDS SOCIALE WONINGBOUW)
The Social Housing Guarantee (WSW) provides guarantees to lenders granting loans to housing associations for social housing projects and other properties with a social or public function. These guarantees enable housing associations to bor-row on favourable terms. WSW has a solid security structure, and the guarantees it provides are very highly regarded. The world’s leading rating agencies, Standard & Poor’s and Moody’s Investors Service, have awarded WSW their highest possible ratings of AAA and Aaa, respectively. At the end of 2011 WSW had guaranteed loans totalling around €86.3 billion.
16 The proposed reforms to the rental market have been discussed in chapter 3, and further information about the political economy of the Dutch PRS is discussed in chapter 6.

53
WSW’s core competences and tasks include keeping in sight all developments that affect social housing:
I. assesses its participants’ financial positions as well as their overall quality, II. devotes attention to its participants’ cash flows, III. analyses the market on an ongoing basis, IV. requires participating house associations to provide information twice a
year and asks for both actual and forecast figures, V. advises participants on the range of products available in the market, and VI. is actively involved in developing new financial products for the sector.
WSW has successfully evolved into an organisation performing ‘key activities’. Its Executive Board comprises a General Manager and a Director. A controller who has broad-ranging internal control responsibilities, but also advises the Executive Board and provides information to the Supervisory Board independently has been appointed at a management team level. WSW is a ‘flat’ organisation, where re-sponsibilities are kept as low as possible in the hierarchy.
CFV (CENTRAAL FONDS VOLKSHUISVESTING)
The Central Housing Fund (CFV) is an independent administrative body with the primary task of financial monitoring and rehabilitation of housing associations in the Netherlands. Other forms of supervising the corporations are the responsibil-ity of the Minister for Public Housing. The CFV operates in the public interest in monitoring the financial security and stability of Housing Corporations. The man-date of the CFV comes with many measures of accountability and transparency. The CFV is overseen by the Minister for Public Housing, who is politically responsi-ble for the CFV and has the power to appoint, suspend and dismiss the board of the CFV.
The CFV is in a transitional phase resulting from the financial crisis, from that of self-regulating oversight to a more hands-on regulatory approach. The first step is a move to risk-based supervision. The CFV sets out requirements of efficiency and effectiveness which are calculated according to a risk profile of the corporations. Risk-orientated supervision requires a more holistic approach to regulation, with the focus on sustainability of the Housing Corporation finances, which may be compromised by different market conditions, such as liquidity or solvency prob-lems, but also for example by losses related reforms to the rented sector. There-fore the CFV has a large role in monitoring the market, and forecasting potential risks.
Their monitoring task includes the collection of annual financial data of Housing Corporations. They are then able to pass judgements or warnings to the Housing Corporations, such as the quality of the financial statements, solvency, capital ca-pacity in relation to the proposed activities, liquidity, maintaining social bound power (waste) and from analysis of multiple subjects forward financial risk man-agement. The CFV is developing new products to improve and professionalise su-pervision. Model development and data management are done by the CFV itself in close consultation with the Corporations.
54
The CFV has had a remediation task since its inception in 1988. This monitoring task was given a legal basis in the BBSH and in the 2002 Housing Act. The CFV has developed into an independent, reliable and professional organisation. With ap-proximately 43 employees, the CFV today enjoys a lot of knowledge and experi-ence.
Currently, the CFV is on the eve of a conversion to Financial Authority of Housing Associations.
IVBN (VERENIGING VAN INSTITUTIONELE BELEGGERS IN VASTGOED)
The Association of Institutional Property Investors (IVBN) members are real estate companies in the form of real estate funds and real estate investment managers, acting on behalf of institutional investors, such as pension funds, insurance com-panies and banks. They have a material direct and/or indirect property portfolio focused on sustainable operation. The IVBN counts 30 members on 1 January 2013. It collectively represents members with over €60bn in Dutch property and well over €50bn abroad. The members of the IVBN invest - both directly and indirectly - mainly in homes, offices and shopping malls/stores. In addition, there are invest-ments in premises, logistics, car parks and other property, for example nurseries.
In total, the members of IVBN rent out approximately 130,000 homes, which amounts to nearly half of the free rental sector. They are therefore, after corpora-tions and private owners, the third largest party offering rental dwellings in the housing market. The commercial real estate is primarily made up of office space (approximately 5 million m2), retail space (approximately 4.5 million m2), premises and car parks.
The following types of property companies can be members of IVBN:
I. Professional real estate funds that invest primarily for institutional in-vestors in real estate,
II. listed or non-listed real estate companies, III. Real Estate Asset Managers, IV. Pension funds in direct investments in real estate, V. insurers with direct investments in real estate, and VI. foreign institutional real estate investors, with at least three years active
private establishment in the Netherlands.
The IVBN fulfils the following roles:
I. encourages capital is invested in real estate (both directly and indirectly, in the Netherlands and abroad),
II. represents the common interests of its members, III. provides a platform to institutional real estate investors, IV. aims to professionalize institutional investors, including working on
transparency and integrity especially in the Dutch property sector, V. explains the invested activities focused on the Netherlands,

55
promotes the sustainability of the stock,
VI. emphasizes the social significance of investing in real estate, and VII. is for governments and regulators the logical partner in the institutional
and professional property market.
The Board of IVBN, consisting of people who work in the property investment sec-tor on a daily basis, actively guides the association. In carrying out its activities, IVBN has at its disposal a small, decisive and professional team. Several work groups assist this branch association, with specialists recruited from amongst its members. Their members are involved in the IVBN through the board, the three-monthly general meetings and study groups.
AEDES
AEDES is a trade association which represents the interests of Housing Associa-tions in The Hague and Brussels, looking for solutions to improve the functioning of the housing market and contributing to the professional sector.17 About 95% of the Housing Corporations are members of AEDES. Housing Corporations accom-modate more than 2.4 million households in the Netherlands in social housing and are investing in 60% of construction output in the Netherlands.
For more than 100 years, housing associations ensure that people with lower in-comes have access to live in affordable and well-maintained homes. Since 1913 corporations joined forces in what is now called AEDES, thus making 2013 a 100 year anniversary for AEDES.
Key tasks of the organisation of include:
I. political advocacy of representing the interests of the Housing Associa-tion,
II. connecting the work of the different Housing Associations into a net-work, and
III. developing the professionalization of the Housing Associations in the rental market in terms of finance and property management.
AEDES represents the interests of 418 Housing Corporation members and associ-ates. This means that the agenda of members determines the activities of the as-sociation. The members elect General Directors, while an independent Chairman is appointed. An Executive Committee is elected from the general management, who are tasked with the daily running of AEDES. Members of AEDES meet at least twice a year in a Congress in which outlines of policy are determined.
17 For further information on Housing Associations, see chapter 7.

56
CONCLUSION
The institutional setting for Dutch tenancy law and rent regulation follows a soft law approach. Not only are there multiple levels of organisations available to help the tenants with problems, standard of living and political weight in the policy process, but consultation with the tenants is increasingly becoming mandatory. For example, the requirement to consult the tenants regarding modernisation or renovations is held through tenants organisations. In the Netherlands, like Ger-many, there is a history of constructive dialogue between suppliers and consumers of public goods, like there is between trade unions and employers.
With a large population not only being tenants, but also tenants within the Hous-ing Associations, the normative legitimacy of the Woonbond and AEDES makes them extremely influential in the PRS policy debate. They fear that the announced policy reforms are going to replace the special Dutch social mix and spatial plan-ning successes for financial liberalisation. On the other hand, the large financial strength of the IVBN ensures it has a place at the policy table. The IVBN has been disappointed with the direction which the government has taken the PRS over the past decade, as the private sector has been squeezed out of the market, but is wel-coming the current reform agenda. The report will thus consider the opinions of both groups for the remainder of the report.
The CFV and the WSW were necessary bodies which were introduced to adminis-ter loans and provide accountability for the Housing Associations as the govern-ment withdrew from the market. They are representative of a mature form of gov-ernment which facilitates the functioning of the open-market without steering it. Nonetheless, the size and legitimacy of these institutions has led to criticism that they are not influencing enough control or ensuring maximum efficiency with the Housing Associations.
Finally, the main finding from this chapter is the role of the Rent Commission in the regulated rental sector. The Rent Commission is clearly an established and successful means of conflict resolution that provides a more efficient enforcement of tenancy law and rent regulation than the courts, in both financial and time span terms. The moves to increase the tenants and landlords knowledge of their rights and obligations are significant, where publishing the cases determined will give people even greater awareness of their position. Nonetheless, the Rent Commis-sion will inevitably loose this sense of stability as reforms radically change the market dynamics away from the tenants’ preferences.

57
CHAPTER 5: THE DUTCH HOUSING MARKET
INTRODUCTION
The private rented sector in the Netherlands will service a higher demand both in terms of tenants and investment, due to the current state and structure of the economy, the demographics of Dutch households, a decreasing popularity of mort-gage financed home-ownership and an inelastic supply of dwellings. While some of these factors are not specific to the Netherlands, taken together they are affect-ing the tenure choice in the Netherlands, and as such are a consideration for the current reform proposals.
ECONOMY
The domestic economy is closely linked to the housing, mortgage market and rent-al market. An economic overview can show the increasing demand for private rental housing over ownership and the financial conditions for investment in the sector. Therefore, a brief analysis of the Dutch economy is warranted, both from a structural and cyclical perspective.
Basic facts about the Netherlands include:
• Nominal gross domestic product of €602bn (2011), which ranks as a middle-sized economy and a quarter that of Germany.
• The population is also medium-sized with 16.7m inhabitants living in 7.5m households.
• The GDP per capita (purchasing power parity) is €36,054, which translates to an internationally comparable US$43,478 – showing the Netherlands as one of the wealthiest nations in the EU.18
• The largest economic value is added by the services sector (75%).
• The largest private sectors are trade, transport, business services and finan-cial services, which play a large role in international trade.
• Exports equal 78% GDP and imports account for 71% GDP, resulting in a sur-plus on the current account of 7.8% GDP.
• Nonetheless, with such a large percentage of external trade compared to other countries, the Dutch economy is highly dependent on the business cy-cle of global trade.
The labour market is characterised by a low unemployment rate (currently 4.9%) and a high participation rate (80.1%). Graph 6 shows that the Netherlands has a 18 World Bank Database
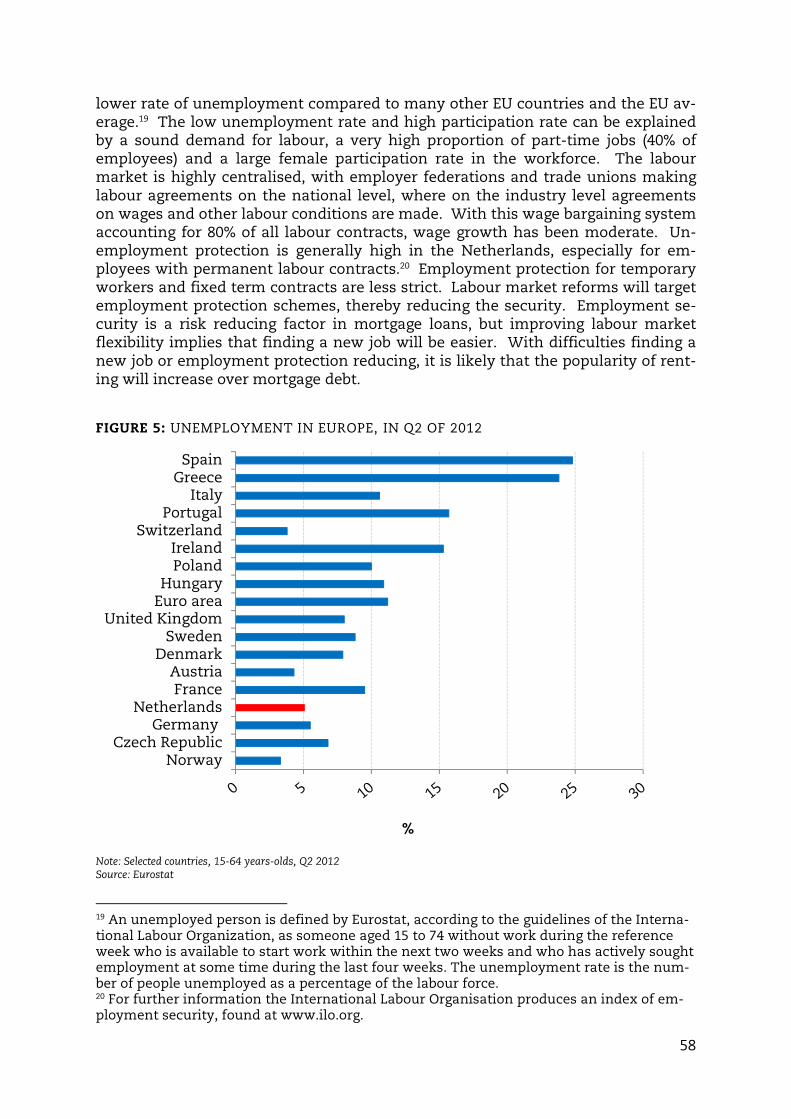
58
lower rate of unemployment compared to many other EU countries and the EU av-erage.19 The low unemployment rate and high participation rate can be explained by a sound demand for labour, a very high proportion of part-time jobs (40% of employees) and a large female participation rate in the workforce. The labour market is highly centralised, with employer federations and trade unions making labour agreements on the national level, where on the industry level agreements on wages and other labour conditions are made. With this wage bargaining system accounting for 80% of all labour contracts, wage growth has been moderate. Un-employment protection is generally high in the Netherlands, especially for em-ployees with permanent labour contracts.20 Employment protection for temporary workers and fixed term contracts are less strict. Labour market reforms will target employment protection schemes, thereby reducing the security. Employment se-curity is a risk reducing factor in mortgage loans, but improving labour market flexibility implies that finding a new job will be easier. With difficulties finding a new job or employment protection reducing, it is likely that the popularity of rent-ing will increase over mortgage debt.
FIGURE 5: UNEMPLOYMENT IN EUROPE, IN Q2 OF 2012
Note: Selected countries, 15-64 years-olds, Q2 2012 Source: Eurostat
19 An unemployed person is defined by Eurostat, according to the guidelines of the Interna-tional Labour Organization, as someone aged 15 to 74 without work during the reference week who is available to start work within the next two weeks and who has actively sought employment at some time during the last four weeks. The unemployment rate is the num-ber of people unemployed as a percentage of the labour force. 20 For further information the International Labour Organisation produces an index of em-ployment security, found at www.ilo.org.
NorwayCzech Republic
GermanyNetherlands
FranceAustria
DenmarkSweden
United KingdomEuro areaHungary
PolandIreland
SwitzerlandPortugal
ItalyGreeceSpain
%

59
Social security for the unemployed in the Netherlands is relatively generous.21 Un-employment insurance is mandatory for all employees, and will ensure a benefit payment of 70-75% of the last wage, subject to a cap of 110% of the average wage. The duration of the benefits depends on the employment history, but can last up to 38 months. Unemployment benefits are not means-tested, but are conditioned on active job seeking, which is monitored. Once the unemployment benefits are no longer entitled, the social security system insures a fixed benefit (bijstandsuitker-ing) for an absolute minimum standard of living. These are means tested, subject to strict conditions and unlimited in duration. A home-owner is still entitled to receive this if they can prove that renting another house would incur similar or higher costs than servicing the mortgage. Therefore, unemployment risk does not majorly dissuade home-ownership. Furthermore, housing allowances are allocat-ed to around 30% of all tenants with the aim to promote affordability and prevent residential segregation. They depend on the household income, rent and composi-tion, where it is only made available to households occupying a dwelling under a certain price limit that is determined according to the points system.22
The aggregate households balance sheets shows the Dutch have a relatively high level of wealth. The CBS shows that financial assets amounted to €1,828bn and non-financial assets, including real estate, had an estimated value of €1,327bn.23 The total debt stock of households amounted to €756bn, implying that for every euro of debt there was €2.41 in financial assets and €1.76 in non-financial assets. These assets and liabilities are relatively high in international comparisons, which explains the focus on the debt side during the downturn of the business cycle. 86% of the debt consists of mortgages with an aggregative value of €652bn, which trans-lates to a mortgage debt ratio of 108% of GDP.24 This is the highest debt ratio in Europe, while on the other hand other forms of debt, such as consumer credit, is relatively low. Looking solely at the debt ratio is insufficient to conclude whether a country has a debt problem, where the aggregate current loan-to-value (LTV) ratio of 56.4% is manageable. There is a high asset base roughly equalling 300% GDP, consisting mainly of pension and insurance assets, with a combined estimated value of €1,112bn (2011). The high amount of cumulated savings in pension and insurance reserves gives the Dutch households less need to save money, and therefore the deposits in cash and savings are rather low. Therefore the Dutch banks have a relatively large reliance on capital markets for funding. The house-holds have two problems: their assets are not liquid, and their assets are subject to market developments while their liabilities are generally not. Thus low or negative returns on pension plan assets and declining house prices have led to a deteriora-tion of net wealth of Dutch households. The resulting impact on the PRS is that more households will choose to rent their homes and investors will see it com-paratively as a safer investment. 21 Policy reviewed at 2012 22 Julie Lawson (2011) “Country Case Study: The Netherlands” in Kath Hulse (eds.) Secure Housing in Rental Housing: A Comparative Analysis. Australian Housing and Urban Research Institute.Report No. 170. 23 Central Statistics Bureau (2012) ‘Dutch homes worth twice as much as total mortgage debt’ Web Magazine, 06 September 2012, found at http://www.cbs.nl/en-GB/menu/themas/macro-economie/publicaties/artikelen/archief/2012/2012-3680-wm.htm (accessed 30/05/2013). 24 European Mortgage Federation (2013) “Key Figure 2011” found at http://www.hypo.org/Content/default.asp?PageID=414 (accessed 30/05/2013).

60
FIGURE 6: MORTGAGE DEBT, HOUSE VALUE, SAVINGS AND PENSIONS ENTITLE-MENTS, 2012
Source: CBS, CBS Web magazine, 6 September 2012
The cyclical developments on the asset side of a household’s balance sheet has consequences for households’ wealth, uncertainty about future wealth and thus consumer confidence. Weak consumer consumption has resulted in lower eco-nomic performance of the Dutch economy compared to other northern and central Eurozone countries. Recovery will be slow for two reasons. First, there is strong fiscal consolidation in order to comply with the Euro-Plus Pact budget deficit target of 3% of GDP by 2013. Second, the sovereign debt crisis in the Eurozone weakens the Dutch economy given the intra-Eurozone trade dependence and the govern-ment participation in the European Stability Mechanism (ESM). Nonetheless, with the German and developing countries economic growth supporting Dutch exports, there is optimism in the medium to long-term recovery.
There are strong regional differences in the housing and labour markets, with are-as of limited employment opportunities exhibiting weak housing demand and lower house prices. In the private and social rental markets the landlords in these regions of low demand are confronted often with vacancies and demolishing un-used stock. Conversely in the economically strong areas the demand is so large that tenants must join long waiting lists before they can rent a dwelling.25 In par-ticular, waiting lists in the Randstad cities of Amsterdam, Rotterdam, The Hague and Utrecht are a particular concern for households wanting to access the market. The regional differences explain the reform to the points system to include “scarci-ty points”.
25 Reinout Kleinhaus and Wenda Van der Laan Bouma-Doff (2008) ‘On Priority and Progress: Forced Residential Relocation and Housing Changes in Haaglanden, the Netherlands’ Hous-ing Studies 23(4), 565-587.
-1000
-500
0
500
1000
1500
Mortgage debt Value ofdwellings and
land
Savings andother deposits
Pensionentitlements
Bln
eu
ro

61
RESPONSE TO THE FINANCIAL CRISIS
The Dutch financial industry was negatively affected through its own highly lever-aged position,26 synchronized with the contagion effect of the US and European mortgage securitisation crisis, which is very well documented.27 In 2008 various Dutch ‘systemic’ banks fell into dire financial straits, including ING, ABN AMRO and SNS Real, leading to the nationalisation of ABN AMRO. Following the example of AIG, the credit crunch severely crippled the Dutch insurance sector, with the government being required to bail out Fortis and Aegon. With a complete freeze in short term lending liquidity, no capital to lend and portfolios with higher risk mar-gins, the banks reduced granting mortgages and severely tightened mortgage con-ditions. This forced the government to partially nationalise more banks and guar-antee bank liabilities. Similar to many countries, the mortgage market demanded more personal capital and more repayments of the principal, which was a signifi-cant step away from the interest only mortgages previously granted.
The Netherlands was the fifth largest exporting country in the world in 2008, and was thus particularly hard hit with a steep fall in exports in 2009.28 All industries, including construction and real estate, were badly hit by increasing unemployment and bankruptcy. The Dutch government responded with emergency stimulus measures accompanied with spending cuts, as stipulated in the ‘Working for the Future’ agreement on 25 March 2009. The measures included an incentive budget of €395m to boost construction of market-sector housing units and €320m in ener-gy investment allowances to stimulate sustainable investment by owner-occupiers and tenants. With stimulatory measures and dwindling tax revenue, the national debt was growing at €65m a day in 2010.29
The emergency stimulation for sustainable investment was mainly through the extension of the energy investment allowance (EIA) for energy-saving investments in business machinery for 2009-10. Energy-saving investments in existing rented dwellings (€160m in 2009 and €160m in 2010) were subject to energy level B or two-step improvements. A maximum investment of €15,000 per dwelling applies for the energy investment allowance, with a 44% deduction before fiscal profit deter-mination. Housing Associations were particularly attracted to this deal, with 100,000 extra dwellings a year subject to energy-saving measures.
In 2008 the number of houses sold in the Netherlands fell by 10%. The number of purchases with a National Mortgage Guarantee (Nationale Hypotheek Garantie = NHG, explained in further detail at page 71) rose by 14%, increasing its share of the mort-gage market to 60% from 55%. In 2009 the housing market severely diminished, especially at the higher end. Commissions for architects, developers, construction firms and estate agents led to further unemployment and bankruptcies. With the exploitation of land showing financial losses, construction of more affordable owner-occupied and rental homes also substantially decreased. The real economy
26 Hugo Priemus (2010) ‘The Credit Crunch: Impact on the Housing Market and Policy Re-sponses in the Netherlands’ Journal of Housing and the Built Environment 25, 95-116. 27 International Monetary Fund (2008) Global Financial Stability Report. Washington DC: IMF. 28 World Trade Organisation (2009) World Trade Report 2009. New York: World Trade Organi-sation. 29 Flip de Kam (2009) ‘Coalitie baart begrotingsmuis met grote staart [Coalition budget like a mouse with a long tail], NRC Handelsblad, 4 + 5 April.

62
deterioration has resulted in lower residential mobility, fewer new households be-ing formed, cautious lending policies and huge negative-equity risks. The financial crisis has switched demand from home-ownership to renting, and from expensive housing to cheaper housing. Finally, another significant policy of the government was to change the Vacancy Act (Leegstandswet) in order to rent out unsold proper-ties temporarily, thus adjusting the rules on unlimited contracts. The government estimates 70,000 homes have rented their dwelling out under this policy.
FIGURE 7: HOUSE PRICE INDEX FOR NETHERLANDS AND DENMARK, 2005, Q1 – 2013, Q1
Source: Eurostat
In comparison to countries like Ireland, UK and US where the decline in the prop-erty market is causing an economic recession, in the Netherlands it is the econom-ic recession which is causing a decline on the property market. The decline of the housing market has been less severe given that there is a housing shortage in the Netherlands, and the large size of the rented market has absorbed some of the housing demand. Furthermore, there is institutional support to act as an automat-ic stabilizer in the housing market, including the NHG which is run by the Home Ownership Guarantee Fund (Waarborgfonds Eigen Woningen, WEW), the housing as-sociations selling properties at a moderate price and offering low risk dwellings for households, the Authority Financial Markets (AFM) which supervises the mortgage markets, the absence of subprime mortgage markets, the deductibility of mortgage interest for income tax, and the position of some Dutch banks which appeared to be resilient in difficult times.
60,00
70,00
80,00
90,00
100,00
110,00
120,00
Ind
ex
2010=
100
Denmark Netherlands

63
FIGURE 8: CONSUMER CONFIDENCE, NETHERLANDS
Source: CBS
The political desire by many was for the Housing Associations to act as a counter-cyclical investor during this turbulent time in the private sector, especially with regards to continuing rental dwelling projects and taking over rental dwelling con-struction projects of the commercial developers.30 Housing Associations increas-ingly relied on two public banks, the Bank Nederlandse Gemeenten (BNG, Municipali-ties Bank) and the Nederlandse Waterschapsbank (NWB, Netherlands Water Boards Bank), from 60% of financing to 90% in 2008-09. Nonetheless, the Housing Corpora-tions have also been fit by the financial crisis, by the rent regulation and policy re-forms by the government. Without liquidity in the housing market and diminish-ing property values creating balance sheet pressures, there has been less construc-tion or transactions of new stock. The Housing Associations reported in 2009 that their liquidity was under pressure, due to three reasons specific to them in addi-tion to the deteriorating housing market. First, by linking the rent increases at in-flation, the Housing Corporations’ current capital inflow has been constrained. Secondly, the government has changed policies with regards to the Corporations, including having to pay corporation tax. Third, the imposition of the Vogelaar levy, which is a levy imposed on Housing Associations for a fund to regenerate rundown urban areas.
In 2009 the CFV reduced the risk status of over one hundred Housing Associations to B status, showing that they are in a precarious financial situation. Nonetheless, over three hundred Housing Associations and the two public banks lending to them have retained the triple A status, meaning that loans are still being made at reasonable rates.
30 Eric Harms (2009) ‘Hoe staat de woningmarkt ervoor?’ [What is the State of the Housing Market] Tijdschrift voor de Volkshuisvesting 15(3), 11-15.
-40
-35
-30
-25
-20
-15
-10
-5
0
5
10
15A
vera
ge p
os.
min
us
neg
. re
spo
nse
s

64
The financial crisis and the structure of the economy must be considered both as a sudden impact on the private rented sector, but also as part of the long term changing dynamics of the Dutch housing market in general. Four reasons for this include an increase of demand due to household formation and demography changes, reforms to the mortgage market, inelastic supply and the PRS as an in-vestment class.
DEMOGRAPHICS AND DEMAND FOR PRS DWELLINGS
The population and the number of households are increasing in the Netherlands. There are 16.7m inhabitants who live in 7.5m dwellings. Ownership of the housing stock comprises of 56% owner-occupied, 32% Housing Associations and 12% rental properties in private ownership. Home-ownership has grown from comprising of around 30% between 1945 and 1970, due to wealth improvement and home-ownership stimulating subsidies from the government. Figure 9 shows the change of tenure choice over time, which must reflect the demand for each sector. After assessing the reasons for the shifts in demand, this chapter sets out the proposed liberalising reforms to the PRS and the Home-ownership sector and how demand might change furthermore.
FIGURE 9: CHANGE OF TENURE CHOICE FOR NEW BUILDING PER YEAR
Source: CBS, Cijfers over Wonen en Bouwen 2013, Ministerie van Binnenlandse Zaken en Koninkrijksrelaties.
Nonetheless, despite the size of the home-ownership sector, the rental market is still large and is dominated by the Housing Associations which aim to provide cheap housing for low income households. The Housing Associations set rents which are below market rates while the private landlords charge rents in line with the mortgage servicing costs of home owners.
0102030405060708090
100
%
From rental to rental From rental to ownership
From ownership to rental From ownership to ownership

65
The demand for dwellings provided by the Housing Associations is high given their reduced rents, and that the home-ownership subsidies make renting from private landlords as expensive as having a mortgage. This fine line between tenancy choice is further defined due to the rent regulation of the points system, as previ-ously described.
One important factor which will affect the Dutch housing market is the ageing population, where figure 10 shows the increasing old age dependency and figure 11 shows the increase of aging costs. While figure 10 shows that the old age depend-ency is increasing in many European states, especially for the “peripheral” coun-tries of Italy, Spain and Ireland, figure 11 shows that the Netherlands is expected to have the highest pension and health care costs for the elderly. The pension and health care costs are thus in accordance with the national policies, as the old age dependency in Spain will increase more than the Netherlands, while the pension and health costs are considerably lower. Therefore, we can see that the aging pop-ulation will reduce the fiscal and household spending on housing in the future as the pension and health care liabilities require financing. Furthermore, as rational forward looking economic actors, households in the Netherlands would expect the health and pension provision to be less than adequate in the future, and save equi-ty through their house which would need to be released through sale of the dwell-ing.
FIGURE 10: POPULATION AGEING, OLD AGE DEPENDENCY RATIO
Note: Population 65 years and over divided by 15-64 years population Source: OECD, OECD Economic Surveys: Netherlands 2012, figure 12.
Over the past 20 years annual population growth has been 0.5% and annual house-hold growth 1.0%. The demographic factors explaining the decreasing household size are decreasing number of children per household and an increase in single-person households. Sociological factors explain this trend, whereby the number of divorces are increasing, households are forming later in the adult life, increased female participation in the workforce is resulting in less children being born and
0
10
20
30
40
50
60
70
%
2010 2020 2030 2040 2050

66
families opting to have fewer children. These trends are expected to continue, causing more demand for housing. Figure 12 shows the substantial increase in the number of one-person households in the Netherlands. Taken together, an increase in the number of households and a decreasing size of the households, the demand for dwellings will increase, particularly for those accommodating smaller house-hold sizes.
FIGURE 11: EXPECTED INCREASE OF AGING COSTS, 2007-60, PERCENTAGE POINTS OF GDP
Note: Unemployment benefits and education costs. Source: OECD, OECD Economic Surveys: Netherlands 2012, figure 12.
FIGURE 12: INDEX OF THE SIZE OF HOUSEHOLDS
Source: CBS
-4
-2
0
2
4
6
8
10
%
Pensions costs Health care costs Other costs
80
90
100
110
120
130
140
Ind
ex
2013=
100
1 person 2 persons 3 persons 4 persons 5 or more persons

67
HIGHLY LEVERAGED MORTGAGES
The mortgage market in the Netherlands is rather complex, where plain amortis-ing mortgages are rare. The domestic market is shaped by the tax system, the Mortgage Code of Conduct and the NHG guarantee system. The reforms to the mortgage market might suggest a greater increase of demand for the rental mar-ket. Nonetheless, it is likely that the core attitude will be to stay put, given a household considering home-ownership would be of enough income not to be ap-plicable for social housing, selling your home might result in heavy losses in the open market and the rental prices are increasing. Therefore, to assess the transi-tion to the rental sector, it is necessary to review the extent of the loss in populari-ty of mortgage lending.
TABLE 5: MORTGAGE ON DWELLINGS
Registered sold
dwellings
Number of New Mort-
gages
Average House Price
(Euro)
Average Mortgage
Price (Euros)
Price index of existing dwell-
ings for sale (2005=100)
------------ Weighted average ------------
2005 206,629 572,693 222,708 248,773 100 2006 209,767 544,874 235,843 267,102 104.6 2007 202,401 462,418 248,325 281,997 109.1 2008 182,392 384,100 254,918 293,058 112.2 2009 127,532 262,645 238,259 281,688 108.3 2010 126,127 252,182 239,530 288,755 106.3 2011 120,739 242,623 240,059 285,862 103.7 2012 117,261 199,994 226,661 261,071 97.5 Source: CBS, Cijfers over Wonen en Bouwen 2013, Ministerie van Binnenlandse Zaken en Koninkrijksrelaties.
Figure 13 shows the average prices and mortgage of dwellings in the Netherlands. Comparatively this is more stable than many other countries, especially where the graph’s y-axis starts at €200,000. In 2009 the house prices only reduced 10%. The reason for this limited drop has been explained before as the housing shortage, the large size of the rental market, the institutional support to the mortgage market, the fiscal support to home-ownership and the reasonable performance of the Dutch banks. However, in 2013 there has been a further decrease in house prices, whereas other parts of Europe have started to see a turnaround into growing house prices, such as London. This would suggest that the natural readjustment of the house prices in the Netherlands was postponed by the national policies and insti-tutions, which this chapter assesses in detail.

68
FIGURE 13: AVARAGE HOUSE PRICE AND MORTGAGE IN EUROS
Source: CBS, Cijfers over Wonen en Bouwen 2013, Ministerie van Binnenlandse Zaken en Koninkrijksrelaties.
TAX DEDUCTIBILITY
The Dutch tax system allows for a full deduction of mortgage interest payments on taxable income. For a long time since the beneficial treatment was created in the 19th century the deduction was unconditional, but has been tightened since the 1980s.
FIGURE 14: YEARLY TAX ADVANTAGE ON MORTGAGE
Source: OECD, Mortgage market in the Netherlands, ABN AMRO, May 2012
200.000210.000220.000230.000240.000250.000260.000270.000280.000290.000300.000
Eu
ros
Average House Price Average Mortgage Price
0,0
0,2
0,4
0,6
0,8
1,0
1,2
1,4
1,6
1,8
% o
f m
ort
ga
ge v
alu
e

69
Currently households are only allowed to deduct interest payments on the mort-gage of one (owned) residential house, up to a maximum period of 30 years. Inter-est payments resulting from mortgage equity withdrawal are not included, thus the mortgage loan can only be used for financing the dwelling. The OECD finds that the Netherlands on average has the highest subsidy of the mortgage value per annum at 1.6%, as shown in figure 14.
This leads to three clear observations:
i. Mortgage financing is very attractive since net interest costs are clearly low-er. As it is easy to finance the purchase of a house with a mortgage loan, the system stimulates home-ownership.
ii. The system does not constrain mortgage lending. The tax deductibility in-centivises high mortgage borrowing, even by those with large wealth. This contributes to the large mortgage debt of the Netherlands.
iii. The tax system reduces the incentives to pay back the principal for the du-ration of the mortgage, where a lump-sum repayment of principal at ma-turity maximises the tax deductibility over time. Furthermore, the tax sys-tem allows for untaxed accumulation of capital through dedicated savings accounts or insurance products, on condition these are used to repay the principal on maturity of the mortgage. On the other hand, a wealth tax re-stricts other capital accumulation possibilities.
The mortgage subsidies provide a substantial cost for the fiscal position of the sov-ereign Dutch finances and thus are due for major structural reform, as will be ex-amined in greater detail in the political economy section. From 2013 the tax relief has been conditional on at least annual mortgage redemption. Nonetheless, re-forms will only be applicable to future mortgages, while existing mortgages will continue to benefit from the old tax regime. This will directly hit first time buyers who also face more restrictive mortgage lending from the banks. Therefore, many first time buyers will remain in rented apartments until they have sufficient capital to afford mortgages.
The purchasing of homes also includes a transaction tax, which is usually 6% the purchase value, but has been temporarily reduced to 2% to stimulate the housing market. A transaction tax of 6% is considerable large in comparison to Denmark and Sweden, but comparable to many other European countries. A large transac-tion tax reduces household mobility and thus decreases the efficient allocation of dwellings. Finally, home ownership is also subject to wealth tax. The current val-ue of a house is treated as a virtual asset and is taxed according to a progressive tax rate, which runs up to 0.6% of the real estate value. Although this acts as a counter-measure to the interest tax deductibility, the net tax effects for mortgage borrowers remains very positive.

70
MORTGAGE CODE OF CONDUCT (GEDRAGSCODE HYPOTHECAIRE)
The Dutch Mortgage Code of Conduct regulates underwriting standards on a basis of self-regulation among banks and other mortgage lenders. Regulatory pressure has led to tighter underwriting standards and stricter compliance. The code is de-signed to prevent ‘overlending’ to customers, but increasingly it also results in a level playing field in which non-price based competition is eliminated. The stricter compliance has led to tighter mortgage lending standards.
FIGURE 15: LOAN-TO-VALUE RATIOS FOR FIRST -TIME BUYERS
Note: EA=Eurozone Source: ECB, Mortgage market in the Netherlands, ABN AMRO, May 2012
A recent change is a new loan-to-value limit of 104% plus applicable transfer tax. The LTV is scheduled to be decreased incrementally to 100% in the coming years. The Netherlands has more mortgages of loan-to-value ratios over 100% than any EU country, as shown in figure 15. The notional average LTV-ratio (or the average value of the loan relative to the value of the property) increased from 79% in 1970 to 100% around the 2000s and even rose further to 120% at the end of 2009. Survey results show that the total number of households with an LTV-ratio above 100% quadrupled between 2002 and 2008. Another important change is the constraint on interest only loans, where although these products are still allowed, it is only up to a maximum of 50% of the property value.
0
20
40
60
80
100
120
Lo
an
-to
-va
lue

71
FIGURE 16: LOAN-TO-VALUE RATIO OF DUTCH HOME PURCHASE 2000-2010 (IN PERCENTAGE)
Note: Loan-to-value ratio = average mortgage amount/ average sales amount. Source: DNB, Het Kadaster kwartaalbericht, in European Economy – Macroeconomic Imbalances Netherlands 2013 and Over-view of Financial Stability in the Netherlands May 2010.
Again, these changes in regulatory standards make the conditions to get mortgage loans much tighter, especially for first-time buyers. Therefore, it can be argued that the popularity of the rental market will increase as these households are fro-zen out of the home-ownership market.
NATIONAL MORTGAGE GUARANTEE FUND (NATIONALE HYPOTHEEK GARANTIE,
NHG)
The NHG is a voluntary mortgage guarantee system run by the WEW public foun-dation. The foundation manages and regulates the NHG, and is backed by local government. It is fully funded by the mortgage holders, who pay a lump-sum fee of 0.7% of the value of the mortgage upfront. The NHG offers credit protection to the borrower, and thus indirectly to the lending institution, in case of unforeseen circumstances that result in the sale of the home. It aims to stimulate home-ownership by reducing the risk of debt overhang. The maximum mortgage for an NHG guarantee is €265,000, which has been temporarily raised to €350,000 in order to stimulate the housing market.
The NHG guarantee is particularly attractive as the associated risks of buying a home are reduced, which leads to a discount factor of up to a full per cent (80 basis points) on the applicable mortgage rate. Although only applicable for amortising mortgages, this stimulates many to enter the home-ownership market that would otherwise stay in the rental sector. Furthermore, as it protects the lending institu-tion, the credit rating of the institutions are increased and thus allows it to issue more mortgages at more competitive rates.
90
95
100
105
110
115
120
125
%

72
DURATION
The duration of a typical mortgage is 30 years, which is comparatively high com-pared to many other European countries. This is the length equal to the period of tax deductibility of interest payments. Therefore, this long duration encourages households to get a mortgage rather than stay in the rental market.
MORTGAGE PRODUCTS
The mix of product mortgages is complex, as they are designed to take optimal use of the beneficial tax system and can be used in combination.
FIGURE 17: MORTGAGE PRODUCT MIX 2012
Source: Volkshuisevesting informative system(VOIS)
• Interest only mortgage loans: These do not include any repayment of the principal, except at maturity. There is no mechanism attached that allows the build-up of principal, exposing households to huge negative-equity re-lated risks if property prices fall.31 With a market share of roughly 50%, these are popular because debt servicing costs are lower and offer full and easy tax advantages. Comparatively Denmark has mortgage products with only 10 years of interest only payments, and the remainder must be paid off over the subsequent 20 years. The Mortgage Code of Conduct has restricted the use of interest only mortgages to a maximum of 50% of the total mort-gage. Furthermore, interest only mortgages will not benefit from tax de-ductibility on interest payments from 2013.
31 Robert Giebels and Xander van Uffelen (2009) ‘Failissement Lehman was moedig besluit’ [Lehman Bankruptcy was a Brave Decision], de Volkskrant, 23 December.
4%
17%
4%
35%
4%1%
1%
34%
Savings insurance Savings Investment
Interest only Annuity Linear
Other Combination

73
• Bank savings mortgage loans: Similar to an interest only mortgage with re-payment of principal at maturity, but with the capital dedicated for principal repayment accumulated in a bank savings account. It is thus designed to save for repayment whilst taking advantage of the maximum tax deductibil-ity over time. The savings payments remain constant over time and roughly equal the interest rate on the mortgage. After a change in the tax system in 2007, capital accumulations in the dedicated bank accounts were allowed for favourable tax treatment. The popularity has increased over the past couple of years, giving it roughly 20-25% market share. However, again they will be less popular given the tax deductibility reforms.
• Savings insurance mortgage loans: These are similar to the bank savings mortgage loans, except for the fact that the capital is not accumulated in a bank savings account, but instead in a life insurance product. Capital is generated by paying life insurance premiums. The capital can only be used to repay mortgage debt. Returns in the insurance product are guaranteed. It has been very popular in the past decade, although the higher transparency and lower cost structure of the bank savings mortgage loans has led to a market share decline to 10-15%.
• Life insurance mortgage loans: Capital is generated by insurance premiums and investment returns. The capital returns are thus reliant on the invest-ment returns in the insurance pool, which are not always guaranteed. The market share has been slowly decreasing to 5-10%.
• Investment mortgage loans: Capital is generated by means of investments in one or more mutual funds, with the investment not being guaranteed. Life insurance is often taken out to hedge the risk. The market share is around 5%.
• Classical mortgage loans: These products are the linear and annuity mort-gage loans that are the norm in most other countries. Principal is repaid during the length of the mortgage and interest payments gradually decline over time. The structure is simple and safe, but due to the tax system these mortgages are not popular. The current market share is 5%, but this is likely to increase substantially in the future when tax deductibility will be calcu-lated on an annuity basis.
Therefore, popularity of the each mortgage products is rapidly changing. The tax reforms are reducing the payment at maturity forms of finance, while the macroe-conomic instability is reducing the investment forms of mortgage financing. Therefore, when comparing the private rental market to the home-ownership sec-tor, it needs to be considered that the future of mortgage financing lies with the classical mortgage loan, which therefore reduces the favouritism of home-ownership on a user base comparison.
INTEREST RATE FIXING AND REPAYMENTS
In general Dutch mortgages have interest rates that are usually fixed between 5 and 10%, as shown in figure 18. Statistics from the Dutch Central Bank (De Neder-landsche Bank, DNB) shows that 99% of all existing mortgage loans have an interest

74
rate fixed for 5 years or longer. There is more variation in new mortgages, as shown by figure 19. The number of variable rate mortgages (fixed period shorter than 1 year) is currently 23%. Longer term fixings are still more usual, although the popularity of fixed rates of longer than 5 years shows a decreasing trend in recent years. With a popularity of 40%, longer term fixed rates are still the most com-monly used interest rate period. 37% of all new mortgages have an interest rate with a 1-5 year fixed period. In comparison to other countries, the number of vari-able rate mortgages is clearly lower. This is a risk reducing factor in terms of mortgage servicing. Since 30 year fixings are very rare in the Netherlands, there is still interest reset rate risk present over the full duration of the mortgage.
FIGURE 18: VOLUME OF EXISTING MORTGAGE BY MATURITY
Source: DNB in: RaboBank Nederland, Dutch Housing Market Quarterly, June 2013
FIGURE 19: VOLUME OF NEW MORTGAGE BY MATURITY
Source: DNB in: RaboBank Nederland, Dutch Housing Market Quarterly, June 2013
0
50
100
150
200
250
300
350
400
450
Bil
lio
n e
uro
s
Fixed > 5 yr Fixed 1-5 yr Variable and fixed till 1 yr
0
2
4
6
8
10
12
14
Bil
lio
ns
eu
ros
Variable and fixed till 1 yr Fixed 1-5 yr Fixed 6-10 yr Fixed > 10 yr

75
RISKS
The main risks in mortgage loans are late payments and ultimately foreclosure. Late payments are generally managed well, with mortgage payments automatically debited from current accounts. Payment failures are quickly discoverable and no-tices are sent out usually within days. Mortgage arrears and foreclosure rates are very low in the Netherlands compared to other countries in Europe, as shown in figure 20, a modest rising trend is observable. There are three reasons why there is good behaviour given the risks associated with the high level of mortgage debt:
i. The mortgage lender has full recourse to the borrower: The dwelling acts as collateral and in case of foreclosure it will be auctioned. The residual debt does not automatically involve a loss for the mortgage originator or owner. The holder of the mortgage loan has full recourse to other assets of the borrower, including future income of the borrower. Personal insolvency law is very strict and austere, thus just handing over the keys to the bank is not attractive.
ii. The structure of the economy: Unemployment is low, there are usually multiple sources of income in a household and the social security system is generous.
iii. The structure of the housing market: People who are facing hard times ser-vicing mortgage debt often have no easy alternative. Selling the house and switching to the rental market does not lead to any cost saving, because they typically do not qualify for the low rental dwellings by the Housing As-sociations. Instead they have to rent at high prices from the private rented sector. Furthermore, home-owners currently are able to rent out their dwellings.
Should the amount of mortgage debt be higher than the current value of the collat-eral, a residual debt burden will remain if the property is sold. First time buyers are at risk, whereby divorce or other relationships tend to terminate in the first years of living together. Recent buyers who have bought a home around the peak in the house prices, with a typical LTV on their mortgage exceeding 100% will now have negative housing equity. Negative equity is not actually a major issue in the Netherlands, whereby the accumulated capital is not factored in, the younger households have longer duration of earnings to repay, negative equity is not a rea-son for foreclosure and the NHG guarantee covers such unexpected life events. Finally, the very positive housing equity of older generations will ultimately be transferred to the younger generations via inheritance. The low number of forced sales is shown in figure 21. It could be expected that this number of forced sales might increase when the interest only loans need to be amortized and are under-financed, which is a similar problem facing the Danish housing market.

76
FIGURE 20: ARREARS ON MORTGAGE OR RENT PAYMENTS
Note: Missing data in 2004 for The Netherlands and UK. Source: Eurostat
FIGURE 21: FORCED SALES 2005-2012
Source: kadaster.nl
0
2
4
6
8
10
12
14%
of
tota
l p
op
ula
tio
n
Denmark Ireland Greece Italy
Netherlands Portugal Sweden
050
100150200250300350400450

77
LOW SUPPLY ELASTICITY
Housing supply responds slowly to the increase in housing demand in the Nether-lands.32 In areas of low supply elasticity the prices of new homes are dictated largely by the prices of the existing housing stock. While the growth in demand does not push up the supply, it leads to rising prices and greater shortages. Hous-ing is by nature a supply-driven market, and the supply of new stock is reducing in the Netherlands over the long term. Due to the high durability of dwellings, addi-tions to the housing stock are typically marginal. The average annual growth amounted to 2.5% in the 1970s, 2.0% in the 1980s, 1.2% in the 1990s and only 0.8% between 2000 and 2010. The total stock is 7,270,000 dwellings, which is almost twice that of 1970. Figure 22 shows how the number of houses for sale slowly in-creasing and then stagnating. Therefore, with demand increasing, the number of existing houses up for sale decreasing and alow supply elasticity, it would be as-sumed that the house prices will increase.
FIGURE 22: PROPERTIES UP FOR SALE
Source: Huizenzoeker.nl. in: Dutch Housing Market Quarterly, Rabobank June 2013
32 Wouter Vermeulen and Jan Rouwendal (2007) ‘Housing supply in the Netherlands’ CPB Discussion Paper, No.87. The Hague: CPB.
0
50.000
100.000
150.000
200.000
250.000

78
Spatial planning policy by definition leads to less elasticity of supply. As a very densely populated country with concerns on the quality of living environment, it is necessary to adequately consider planning policy.33 Nonetheless, the Dutch policy has been very short term and has not addressed the long term demand issues.34 The bureaucracy involved with the planning system means that the development and construction process of housing supply cannot quickly respond to demand. The UK as a similarly inelastic country has brought forward planning policy reform to address the issue.35 Furthermore, the planning policy has tried to encourage new builds where the demand is low in an attempt to stimulate economic growth and housing demand in those areas – leading to an even more widening house price gap between popular and peripheral areas.
New dwellings must meet stringent quality and environmental standards which increases the inelasticity of housing supply in the Netherlands. The EU ‘Zero Ener-gy’ policy is driving the construction of buildings in the EU to be energy neutral in the coming years, with growing standardised targets. The cost of implementing these standards is included in the price of the selling or rental price. For instance, the points system for the regulated rental market explicitly increases the points according to the level of energy efficiency of the dwelling. Nonetheless, should the consumers not value the quality and environmental standards, then the price-to-quality ratio of the new buildings will be less than old buildings, thus leading to stagnation a of housing construction.
Regulations and procedures affect the production of housing, ranging from water management to working conditions. Drawn from all different tiers of government, from the European Union to local councils, these challenges are not uncommon to countries other than the Netherlands. Nonetheless, Dutch administrative and public law affords a large scope for objection, appeals and reviews in comparison to other countries, leading to longer procedural delays, thus slowing the construc-tion of new houses.
The Dutch municipalities are responsible for the development of locations for houses to be built on, and thus have a very strong ability to control the price of the building land. The allocative efficiency of this power has been criticised by private investors in the rental market because the municipalities have sold bundled pack-ages of land to the Housing Associations, where one area is designed for low cost dwellings and the other for expensive unregulated dwellings. They claim Housing Associations should not be permitted to use their ability to construct low cost dwellings to crowd out private investors in the upper price side of the market. As will be shown in chapter 7, this issue will be resolved with a legal separation be-tween the commercial and social enterprises of the Housing Associations.
33 Ruben van Leeuwen and Philip Bokeloh (2012) ‘Mortgage market in the Netherlands’ ABN AMRO Group Economics Paper, available at www.abnamro.nl/nl/images/.../04.../Speciale_uitgaven_4_van_5.pdf (accessed 30/05/2013). 34 Peter Boelhouwer, Harry Boumeester and Harry Van der Heijden (2006) ‘Stagnation in Dutch housing production and suggestions for a way forward’ Journal of Housing and the Built Environment 21, 299-314. 35 Kate Barker (2004) Review of Housing Supply, Delivering Stability: Securing our Future Housing Needs. London: HMSO.

79
The second allocative efficiency problem is that the time taken for the municipali-ty to understand the demand of the market, determine the price of the land, sell the land off and then for the developer to finish construction is too long for the new supply to adequately respond to the initial demand. Municipal land prices are usually sold based on an estimate of the selling or rental prices of the prospective dwellings. The municipalities have tended to overestimate the future selling or renting prices with the aim to maximise their largest revenue stream, resulting in the tendency to keep land supply scarce. Furthermore, the greater expense of new land means the house/rent price-quality ratio will be lower than the existing build-ings, thus reducing transactions of new builds.
THE DUTCH PRIVATE RENTAL MARKET AS AN IN-VESTMENT CLASS
A review of the home-ownership market shows that the tenure cost of home-ownership was significantly reduced due to fiscal subsidies and generous mortgage financing. As a consequence demand for the private rented sector diminished sig-nificantly, where renting a dwelling was for households unable to access the mort-gage market. The financial returns on property can be found in the ROZ/IPD Neth-erlands Annual Property Index shows that participants achieved a direct return on residential investment of 0.6% in 2012, compared to the 5.1% annualised return over the past 10 years.36 This can be further compared to the 2012 returns for equi-ty (19.3%) and bonds (8.7%).
Nonetheless, the Dutch private rented market is expected to grow in demand in the foreseeable future due to five categories of development. First, as shown in this chapter, the demography of the Netherlands will produce more households, smaller number of people per household, and an aging population which will be-come increasingly difficult to finance. Whereas married couples could access more capital with a combined income, single person households will not have this abil-ity, and thus will, in addition to increasing their labour mobility, choose to rent dwelling. Elderly households will supplement their pension income by releasing housing equity by selling their large family homes and moving into smaller and more manageable dwellings.
Secondly, there are key reforms to the highly favourable mortgage market this chapter has described. With the ability to get an interest only mortgage for 30 years, at 120% the value of the property, with the interest deductible against taxa-ble income accounting for an annual tax subsidy of 1.6% of the mortgage value, and which is guaranteed by a national public body, it is little wonder that the per-centage of Dutch households opting to enter the home-ownership sector increased over time.
36 Stichting ROZ Vastgoedindex and IPD Netherlands (2013) ‘Netherlands Annual Property Index: Results for the year to 31 December 2012’ found at http://www.ipd.com/indices/index.html?country=Netherlands (accessed 10/10/2013).

80
Reforms are going to increase the costs of households accessing the mortgage market, with LTV ratios decreasing and normal amortizing mortgages increasing as a response to the volatility caused by such high risk financing operations.
The next two chapters analyse the third and fourth reasons why the private rented sector is expected to grow in the Netherlands, namely that fiscal subsidies for home-owners will be removed and the market share of the social Housing Associa-tions will be diminished. By liberalising the homeownership sector and making the rented sector more competitive, the tenure cost for each sector will increase and thus make them comparable to the rented sector. Understanding this shift in policies and how it will increase the demand for private rented housing, invest-ment into the sector will increase.
Supply to the market will be encouraged by a fifth reform being implemented, which is the reforms to the points system as set out in chapter 3. The reforms are due to have the effect of increasing the points for dwellings in areas of scarcity, such as the Randstad, or even the proposed idea of incorporating the value of the dwelling into the number of points given. These proposals will liberate many dwellings out of the regulated sector, which private investors have lost confidence in, and into the unregulated sector where private investors see a solid demand and thus safe dividend from. Furthermore, rent for private rented dwellings has not seen the same decline as the housing sector, where due to regional growth pat-terns rent prices have continuously increased in popular areas.
As analysed the growth of the private rented sector in the Netherlands is opposed by many groups, mainly on the grounds of sociological and political reasons. The Amsterdam Tenants Association highlights the gentrification fears that many low-income households will have to leave Amsterdam should their dwellings leave the regulated sector, where left to the market forces such rents will increase dramati-cally. Against the backdrop of this is the necessity of the government to reduce fiscal spending in the housing market, with a more private investment driven sec-tor emerging.
Private investment from institutional investors is very low in the market, and has been decreasing over time due to the aforementioned reasons. Currently the Dutch institutional investors invest as much as 85% of their capital abroad, which has led to the government’s “Orange Investing” campaign designed to promote in-ward investment. One such policy was to increase Dutch institutional investment into the domestic mortgage market, where banks would securitise mortgages up to €320,000, which are guaranteed under the NHG. AAA tranches would then be sold to a special investment vehicle called the National Mortgage Institute that would in turn issue housing bonds onto the market. The problem with this idea is the fall-ing demand for mortgages and the decreasing house prices has led to spreads on the housing bonds being higher than government bonds.

81
Therefore instead the institutional investors see the private rented sector as offer-ing the demand necessary for low risk investment in their portfolios. Many of the institutional investors are pension funds undertaking a strategy of ‘liability match-ing’, where they attempt to minimise a portfolio's liquidation risk by ensuring as-set sales, interest and dividend payments correspond with expected payments to pension recipients, due to the “Baby Boom Generation” soon being at the position of having their pensions paid out.
CONCLUSION
This chapter has observed the characteristics of the housing market in the Nether-lands, with the intention of showing both the underlying characteristics of de-mographics and supply elasticity and the dynamic characteristics of demand shift-ing between the rented market and the home-ownership market. In summary, five key points can be taken from this chapter. The first three points address the un-derlying characteristics. First, it has been observed that the Netherlands, like many other developed countries, has an aging population with the associated fis-cal challenges this will entail through health and pension provision. The effect of the ageing population is likely to be that an increased amount of government reve-nue will be reallocated from the housing market, an increase in small elderly households which are likely to downsize to a smaller dwelling and release the eq-uity of the house through a sale. Secondly, there is a growing number of house-holds at the same time as the average number of people in the household is de-creasing, thus increasing the demand for small dwellings. This could be due to the falling birth rate, increase in divorce and other sociological factors. Third, supply elasticity is very low in the Netherlands, especially in economically growing and popular areas such as Amsterdam. Not only is the area for development limited in these areas, there are also institutional barriers preventing supply to match the increase in demand, such as energy and environmental quality requirements.
The fourth and fifth points are focused on the dynamic characteristics of the Dutch housing market. The fourth point is that there has been a fundamental shift in the mortgage market which has restricted access and increased the refinancing costs of households in the home-ownership sector. Government policies, public institu-tional requirements and lending companies have all responded to the weaknesses of the Dutch mortgage market with a raft of measures such as reducing the LTV ratio or the ability to get interest-only mortgages. Fifth, the development of house prices in the Netherlands is still not clear. With a significant presence in the hous-ing market following the financial crisis through policies such as reducing transac-tion tax to 2% from 6%, the increase in the number of mortgages purchased with the lower NHG guarantee, energy investment allowances and the Vacancy Act, taken together with the traditional support through tax deductions, it is unclear whether the Dutch housing market prices has naturally corrected like it has been seen in countries with significant drops in price like Ireland. Households and in-vestors will thus be less inclined to purchase dwellings where they do not expect any or large capital gains. The next two dynamic features of the Dutch housing market which will influence the private rented sector are the reduction of the home-ownership subsidies and the policies to reduce the market power of the Housing Associations, which will be address in chapters 6 and 7 respectively.

82
CHAPTER 6: HOME-OWNERSHIP AND THE DUTCH POLITICAL ECONOMY
INTRODUCTION
There is a delicate political balance between subsidies to the home-ownership market and the rental market, both in normative debate and due to the electoral system. Over the past 30 years there has been a general trend towards home-ownership from the rental market, through government subsidies and increasing house prices. Table 6 shows both the development of the accumulative housing stock and the individual breakdown of the property according to the tenure. More-over, the transition of stock from the rental market to the home-ownership market is shown in figure 23 since 1985. This chapter will describe how this transition came about due to government and financial institutions support for home-ownership.
FIGURE 23: DEVELOPMENT OF HOUSING STOCK
Source: Systeem Woningvoorraad SYSWOV, Cijfers over Wonen en Bouwen 2013, Ministerie van Binnenlandse Zaken en Koninkrijksrelaties.
25
30
35
40
45
50
55
60
65
Perc
en
t
Ownership(%) Rent(%)
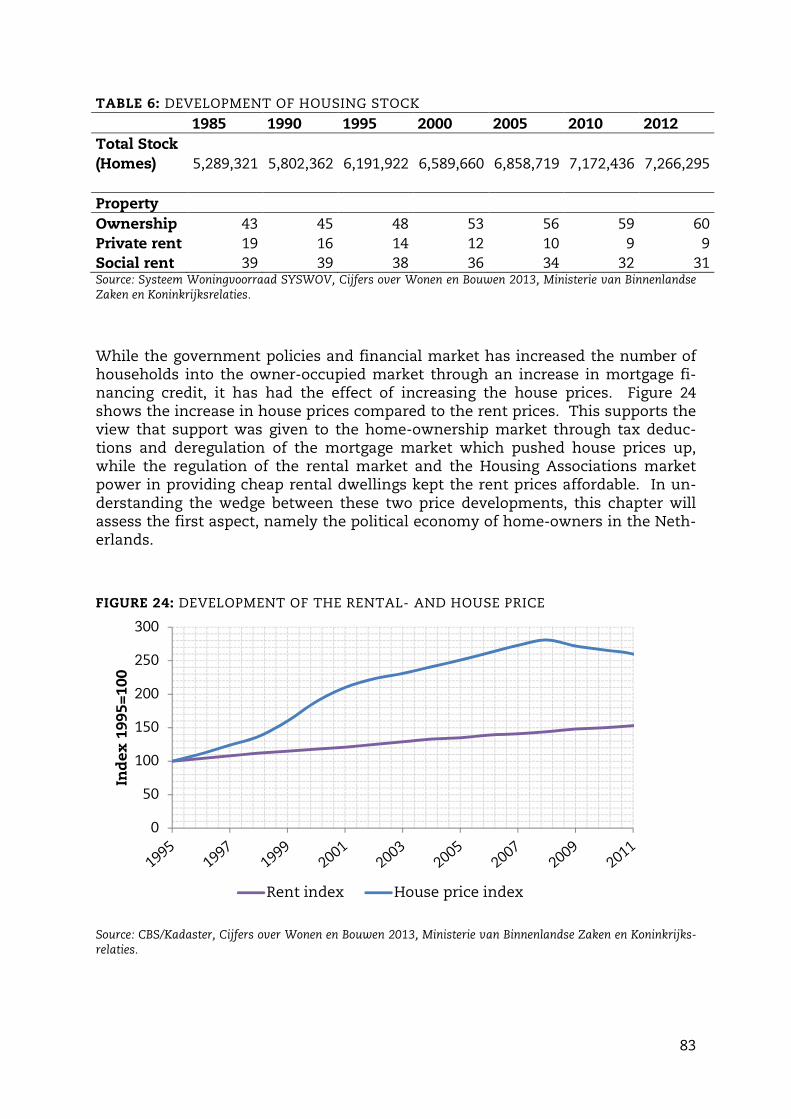
83
TABLE 6: DEVELOPMENT OF HOUSING STOCK
1985 1990 1995 2000 2005 2010 2012
Total Stock (Homes) 5,289,321 5,802,362 6,191,922 6,589,660 6,858,719 7,172,436 7,266,295
Property Ownership 43 45 48 53 56 59 60 Private rent 19 16 14 12 10 9 9 Social rent 39 39 38 36 34 32 31 Source: Systeem Woningvoorraad SYSWOV, Cijfers over Wonen en Bouwen 2013, Ministerie van Binnenlandse Zaken en Koninkrijksrelaties.
While the government policies and financial market has increased the number of households into the owner-occupied market through an increase in mortgage fi-nancing credit, it has had the effect of increasing the house prices. Figure 24 shows the increase in house prices compared to the rent prices. This supports the view that support was given to the home-ownership market through tax deduc-tions and deregulation of the mortgage market which pushed house prices up, while the regulation of the rental market and the Housing Associations market power in providing cheap rental dwellings kept the rent prices affordable. In un-derstanding the wedge between these two price developments, this chapter will assess the first aspect, namely the political economy of home-owners in the Neth-erlands.
FIGURE 24: DEVELOPMENT OF THE RENTAL- AND HOUSE PRICE
Source: CBS/Kadaster, Cijfers over Wonen en Bouwen 2013, Ministerie van Binnenlandse Zaken en Koninkrijks-relaties.
0
50
100
150
200
250
300
Ind
ex
1995=
100
Rent index House price index

84
FISCAL SUBSIDIES ON HOME OWNERSHIP IN THE NETHERLANDS
FISCAL IMPACT
There is significant debate in the Netherlands arguing that any reforms liberalising the rental market should be accompanied by removing the significant fiscal subsi-dises afforded to the home-ownership market. These have come through the de-cline in tax on imputed rents and mortgage interest deduction from income tax. These policies, combined with a surge in house prices, raised the budgetary costs of home-ownership. Significant literature has shown this empirically and norma-tively.37 The amount of revenue forgone from the interest rate deduction against income tax per year rose from €5bn in 1995 to €11bn in 2005, whilst the revenue from imputed tax remained at around €2bn per year.38
TABLE 7: BUDGETARY COSTS OF HOUSING POLICIES IN THE PROPERTY MARKET (EURO BILLION)
2006 2007 2008 2009 2010 2011
Mortgage Interest Deduction(MID) 11,8 12,1 12,4 12,7 12,4 12,0 Exemption net housing wealth from capital tax 7.6 8.2 8.6 8.4 7.7 7.4 Tax exemption capital saving for amortization 0,7 0,7 0,7 0,7 0,7 0,7 Imputed rents (EWF) -2,3 -2,4 -2,6 -2,7 -2,8 -2,7 Transaction Tax (dwellings and non-dwellings) -2,6 -2,9 -2,7 -1,6 -1,6 -1,2 Local property taxes(OZB) -2,6 -2,7 -2,8 -2,9 -3.0 -3.1 Net budgetary costs 12,6 13,0 13,6 14,6 13,4 13,1 Net budgetary costs in % of GDP 2,3 2,3 2,3 2,6 2,3 2,2 Source: Ministry of Finance, 2012
On an international comparison, it can be seen that the Netherlands has a consid-erably large implicit subsidy. Figure 25 shows this on the basis of a difference be-tween after-tax and pre-tax interest rate of mortgage debt, where the large nega-tive tax wedge for the Netherlands shows a high subsidy rate. This led to the Dutch having the highest relative mortgage debt in the EU at €640bn, and has been estimated to cause property prices to rise by about 20% on average.39 It has been shown that many other countries reversed their implicit subsidisation of the home-ownership sector in the 1980s and 1990s, where the Netherlands kept it.40
37 Casper Van Ewijk, Bas Jacobs and Ruud Mooji (2007) ‘Welfare Effect of Fiscal Subsidies on Home Ownership in the Netherlands’ De Economist 155(3), 323-336. 38 Ibid 39 SER-CESD (2010) Naar een integrale hervorming van de woningmarkt [Towards integral reform of the housing market]. The Hague: Expert Committee of the Social Economic Council SER), 16 April. 40 Patric Hendershott and Micheal White (2000) ‘Taxing and Subsidizing Housing Invest-ment: The Rise and Dall of Housing’s Favoured Status’ NBER Working Paper No. 7928. Cam-bridge, MA: National Bureau for Economic Research.

85
FIGURE 25: TAX WEDGE FOR HOUSING
Note: Difference between after-tax and pre-tax real interest rate on mortgage loans; 1999 tax rules, interest rates and infla-tion. Source: OECD, van den Noord, P. (2003) and OECD ECONOMIC SURVEY OF THE NETHERLANDS 2004
PRESSURE ON THE DUTCH GOVERNMENT TO REDUCE THE FISCAL DEBT
The Netherlands has signed up to the Fiscal Compact and thus is obligated to re-duce its total debt, which might incentivise reforms to remove subsidies to the housing market. The Fiscal Compact, as stipulated in the Treaty on Stability, Co-ordination and Governance41 requires contracting parties to respect/ensure conver-gence towards the country-specific medium-term objective (MTO), as defined in the Stability and Growth Pact (SGP), with a lower limit of a structural deficit (cycli-cal effects and one-off measures are not taken into account) of 0.5% of GDP; (1.0% of GDP for Member States with a debt ratio significantly below 60% of GDP). Correc-tion mechanisms should ensure automatic action to be undertaken in case of devi-ation from the MTO or the adjustment path towards it, with escape clauses for ex-ceptional circumstances. Compliance with the rule should be monitored by inde-pendent institutions.
Reduce the subsidies, reduce the deficit/debt: The fiscal rules must be considered in light of the long term liabilities of the demographic changes, lower economic growth and debt repayments. This chapter has shown how large the subsidies to the housing market are as a percentage of the GDP, and in an aim to reduce the deficit and debt, the government is planning to remove the subsidy to the market. In other words, the government is of the opinion that the current large amount of fiscal support to the home-ownership market is unsustainable, and thus is remov-ing the support or conditioning support to lower risk mortgages in order to benefit the stability of the sector.
41 Found at http://www.eurozone.europa.eu/media/304649/st00tscg26_en12.pdf (accessed 30/05/2013)
-2,5
-2
-1,5
-1
-0,5
0
0,5
1
1,5
2
Wed
ge(%
)
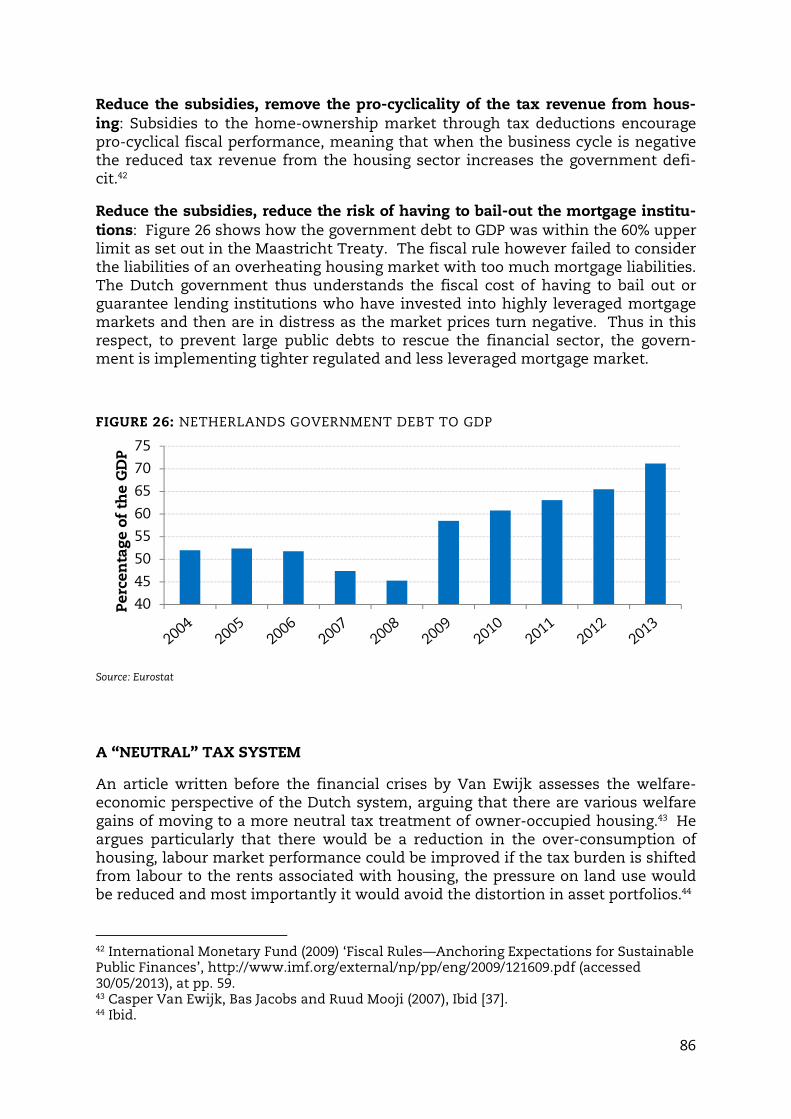
86
Reduce the subsidies, remove the pro-cyclicality of the tax revenue from hous-ing: Subsidies to the home-ownership market through tax deductions encourage pro-cyclical fiscal performance, meaning that when the business cycle is negative the reduced tax revenue from the housing sector increases the government defi-cit.42
Reduce the subsidies, reduce the risk of having to bail-out the mortgage institu-tions: Figure 26 shows how the government debt to GDP was within the 60% upper limit as set out in the Maastricht Treaty. The fiscal rule however failed to consider the liabilities of an overheating housing market with too much mortgage liabilities. The Dutch government thus understands the fiscal cost of having to bail out or guarantee lending institutions who have invested into highly leveraged mortgage markets and then are in distress as the market prices turn negative. Thus in this respect, to prevent large public debts to rescue the financial sector, the govern-ment is implementing tighter regulated and less leveraged mortgage market.
FIGURE 26: NETHERLANDS GOVERNMENT DEBT TO GDP
Source: Eurostat
A “NEUTRAL” TAX SYSTEM
An article written before the financial crises by Van Ewijk assesses the welfare-economic perspective of the Dutch system, arguing that there are various welfare gains of moving to a more neutral tax treatment of owner-occupied housing.43 He argues particularly that there would be a reduction in the over-consumption of housing, labour market performance could be improved if the tax burden is shifted from labour to the rents associated with housing, the pressure on land use would be reduced and most importantly it would avoid the distortion in asset portfolios.44
42 International Monetary Fund (2009) ‘Fiscal Rules—Anchoring Expectations for Sustainable Public Finances’, http://www.imf.org/external/np/pp/eng/2009/121609.pdf (accessed 30/05/2013), at pp. 59. 43 Casper Van Ewijk, Bas Jacobs and Ruud Mooji (2007), Ibid [37]. 44 Ibid.
40
45
50
55
60
65
70
75
Perc
en
tag
e o
f th
e G
DP

87
A deadweight loss to society occurs to society when there is a price distortion be-tween mortgage- and equity-financed ownership, resulting from the allocative effi-ciency introduced by the asymmetries between the tax treatment of mortgage debt and financial assets. Having assessed the mortgage market in the Netherlands, the favourable mortgage treatment means that there is an incentive for households to increase mortgage assets in their portfolios. At an accumulative macro level this size of mortgage assets is larger than its most efficient size and thus provides a greater risk profile for the investments.
In assessing the distortion which the implicit home-ownership subsidies has on asset portfolios, Van Ewijk defines a bench-mark ‘neutral’ tax system, where hous-ing assets are treated on the same footing as other assets.45 In other words, the capital invested in the house yields an asset return which competes directly against other assets. The asset return for a house is essentially the rental price for housing services that is determined on the market. He assumes that to avoid dis-tortions in the portfolio of households, then the return on housing assets should be comparable to return on other assets.
Nonetheless, he doesn’t consider that the price of housing, and thus the return on housing assets, is largely shaped by the inelastic supply conditions of the Dutch housing market. As we have seen, the Netherlands housing market has inelastic supply, large demand, demographic pressures and the effect of monetary or fiscal policy encouraging the housing market.
Furthermore, the analysis of ‘neutral’ tax system with assets treated on similar basis does not factor in corresponding risk premiums of the assets. For instance shares usually yield higher risk premium than bonds. Given the fundamental na-ture of the mortgage market to the welfare and finances of many households and society, the credit crisis has shown the necessity to properly calculate the risk premium of mortgages (and any securitisation) into the returns. Therefore taxa-tion differences between different assets could be justified in order to counter-cyclically stabilise the asset market.46
In 2001 the tax system was reformed with the aim to remove the tax based implicit subsidy for home-ownership:
Pre-2001 Tax System:
• Nominal interest payments on mortgage debts fully deductible from person-al income tax
• Imputed rent (eigenwoningforfait) on owner-occupied housing is subject to in-come tax at the same rate, and equals 1.25% of the value of the property. The imputed rent is a percentage of the true value of the dwelling, as found in the WOZ-value. This is much lower than the rate of return on alternative investments.
45 Ibid, at 325. 46 Harry ter Rele and Guido van Steen (2001) ‘Housing Subsidisation in the Netherlands: Measuring its Distortionary and Distributional Effects’ CPB Discussion Paper No. 002, pp. 13.

88
• Wealth tax of 0.7% applies to only 60% of the value of owner-occupied dwell-ings, rather than full market value of other assets. Mortgage debt is fully deductible from a household’s wealth. Wealth taxation had a tax exemption of €88,000 for singles and €110,000 for married couples.
• Local property tax, which depends on the local jurisdiction, averages around 0.3%.
• Transfer tax of 6%.
• No capital gains tax.
• Value added tax is due only when a new building is bought from a building company.
• Households with high incomes would face high tax rates on traditional forms of saving, thus encouraging investment in relatively tax-sheltered ways. Capital growth funds transformed income into capital gains through the dividend of shares, but were nonetheless subject to corporate tax rate of 35%. Capital insurance was exempt from both income and wealth taxation. A common form of purchasing a house involved combining a capital insur-ance and a mortgage (‘spaarhypotheek’). The insurance payments were set at such a level that, in combination with returns on capital, it led to a saving fund that is exactly sufficient to redeem the mortgage.
Post-2001 Tax System:
• Introduction of a scheduler approach to personal income tax, which splits income into three boxes which are taxed separately.47
• The elimination of wealth tax.
• Box 1: Income from labour, pensions and owner-occupied housing (includ-ing the balance of imputed rents and the interest payments on the mort-gage). Sum of these incomes still taxed at progressive rates.
• In other words, the value of the owner-occupied home is taxed via the im-puted rent, whereby a certain percentage (maximum of 0.8%) of the WOZ value of the dwelling is added to the income. Thus, in fiscal terms the home is treated as an investment, where acquisition costs are tax-deductible but proceeds are taxed.
• Deductibility of interest payments restricted to period of 30 years.
• Box 2: Income of manager and shareholders of corporations.
• Box 3: Personal income from capital that does not qualify for boxes 1 and 2. This consists of income taxed under a presumption of a 4% nominal rate of return on the net value of assets, which is then taxed at a proportional rate of 30%. The presumptive return on capital is taxed separately from labour income. This effectively corresponds to a wealth tax of 1.2%, although there
47 See annex 1 for a summary of the tax in the Dutch housing market

89
is a tax exemption of €17,000 for singles and €34,000 for married couples, at 2013 prices.
• The tax reform reduced the subsidy on mortgage-financed housing due to lower tax rates applicable to mortgage interest payments. Where a capital insurance is attached to the mortgage, the reduction of subsidy is counter-acted by the fact that capital insurance is only exempt if it forms part of this financial construction. The benefit of which is considered a subsidy.
• Equity-financed housing subsidies changed. With a debt claim the subsidy decreases, while shares would increase. Similarly, capital insurance which are not attached to mortgages lose their tax-favoured status.
Under a neutral tax regime, the value of the house minus the mortgage loan should be added to the asset portfolio, which is assumed to make 4% return which is taxed at 30%. However, the owner-occupied tax system deviates from this in two ways. First, owner-occupied housing is not subject to the tax on capital in-come but to the progressive tax on labour income. Second, the net asset return is negative on average due to the combination of a low imputed rental rate and a full deductibility of nominal interest costs on mortgages.
In 2006 the imputed rental rate ranged only up to 0.6% of the housing value to a maximum of €8,900, and the deductible nominal interest on mortgage loans usual-ly exceeded 0.6%. Nonetheless, the government also levies a stamp duty of 6% on housing transactions, which raised €3bn in 2006. Correcting for this, the implicit subsidy in 2006 was €14bn per year. In 1995 government expenditure on mortgage interest relief accounted for 1.2% of the GDP, which by 2005 had risen to 2% of the GDP.
DEBATE ABOUT THE JUSTIFICATIONS OF HOME-OWNERSHIP
When considering the reasons for large government subsidies of the home-ownership sector, in comparison to the rental market, four justifications are given. First, housing subsidies reduce the cost of housing relative to the cost of other goods and services and thereby stimulate demand in the economy. This justifica-tion is given by the economically liberal parties for maintaining the subsidies to encourage stimulation of the housing market.48 Counter-cyclical fiscal policy would suggest that such subsidies should be reduced in boom periods and in-creased during recession, in order to smooth the economic cycle. With instability still a large risk in the Dutch housing market, the government policy aim shows long term reforms in order to spread the transition of increasing housing costs.
The second argument for housing subsidies is the merit-good argument, which paternalistically nudges citizens into home-ownership because they underestimate the value of owning decent housing. This argument has been challenged often, where there is no proof that there is an underestimation of the importance of good housing.
48 See the political economy section at page 88.

90
Thirdly, the external effects of home-ownership is used to justify government sub-sidies, where good housing is assumed to raise the quality of the environment and neighbourhood. For example, this could include greater investment in the mainte-nance of housing stock, greater neighbourhood involvement such as support for local schools, and the better environment for raising children. More importantly the positive spill-overs from these activities saving the government fiscal expendi-ture on housing maintenance, local schools and child care for example. In other words, home-ownership encourages the foundations of communities which in it-self are more socially cohesive and fiscally cheaper. Furthermore, it may reduce the risk of segregation and slum formation. The arguments of the Housing Associ-ations for low to high income households living in the same neighbourhood is an extension of this argument into the rental market, which is aiming to create a “so-cial mix”. Nonetheless, there are no definitive empirical studies of positive exter-nalities.
The fourth justification is that subsidisation has a distributional effect, whereby the subsidies affect the purchasing power over a wide range of income levels. Dis-tribution in this sense can nonetheless be inefficient or unjust, as the section be-low called “Distributional Spread of Subsidies in the Market” demonstrates.
On the other hand, one can argue that home-ownership has a negative externality in the labour market as home-owners are less mobile tenants, whereby they are increasing unemployment efficiency by rejecting jobs where they are unwilling to move to. Furthermore, in comparison with the rental market, the home-ownership market comes with the risk of a loss of wealth due to a drop in house prices or higher financing costs due to a rise in interest rates or banking liquidity problems. As shown in the section regarding the situation of the housing sector in the Neth-erlands, the demography of the population and the financial state of the market shows why the rental market has growing popularity.
IMPACT OF THE REMOVAL OF THE SUBSIDY FOR HOME-OWNERSHIP
With the Dutch housing market torn apart between the rental and home-ownership subsidies, it is argued that as soon as you start deregulating both ends of the market, the rent levels will be slightly below the maximum rent levels set by the points system, apart from specific regions such as Amsterdam, Utrecht and Rotterdam. The reasoning comes from factoring in the demographic situation and income situation. Therefore, the Housing Association dwellings which are 72% of the points value might only increase by 25%, and dwellings in less popular regions might just remain at the level they are in the current regulated sector.
Despite the significant implicit subsidies to the home-ownership market, the size of the home-ownership sector in the Netherlands is relatively smaller to other countries. This is due to the subsidies for rental housing. As has been shown, low income households receive means-tested rent assistance and the points system regulates the rental prices of low cost dwellings. Furthermore, the favourable loans granted to the Housing Associations has been found to be a form of state aid subsidy, and thus due to be reformed. The argument between these assets returns: are subsidies of the home-ownership market an indirect policy to offset the effects of the rental regulation and rent assistance, and if so should it be removed when rent policy is liberalised?
91
On reason why the subsidies of the home-ownership sector has been retained is the political economy of housing policy reform in the Netherlands. The effect of fiscal subsidies depend on the amount of debt as a share of the housing value, the type of mortgage loan, the interest rate, and the marginal tax against which the mortgage interest is deducted. Therefore, given the large spread in home-ownership, mortgage debt and income, there would be many losers in reform.
POLITICAL ECONOMY
Despite the inefficiencies of the housing market in the Netherlands and the con-sensus among all actors that there needs to be some type of reform, it has been argued that reform has been slow due to the political economy considerations among the most powerful actors, including the political parties, large bodies/actors in the housing market, the European Union, expert economics and academics.
The 150 members of the Dutch House of Representatives are voted in through pro-portional representation, which usually leaves no party with majority power and thus forms coalition governments between two or more parties. During the nego-tiations between parties to form a new government, a Coalition Agreement must be made, which sets out home-ownership and rental policy for the coming term of government.
The Dutch political parties consist of the CDA (Christian Democrats), PvdA (Labour Party), VVD (Conservative Party), D’66 (Social Liberals), ChristenUnie (Protestant confessional party), Groen Links (Green Party), SP(Socialist Party) and the PVV (far right party).
Reviewing the manifestos of the parties (in 2010) shows how each party is trying to attain votes from the electorate according to the home-ownership and rental di-vide.
• SP (Socialist):
o Advocates extending the regulated rent sector for rents up to €850 per month and prolong the inflation linked rent policy.
o Proposes a levy on rich housing associations to be redistributed to the poorer housing associations.
o The mortgage interest tax relief should be guaranteed, but modified for a maximum of €350,000 and with a maximum tax rate of 42%. It encourages repayment of mortgage debt.
• CDA (Christian Democrats):
o Wants to make rental policy more market-orientated by incorporating housing value into the points system.
o Encourages periodic means-testing of household income for access to Housing Association dwellings, above which the household must pay higher rent, buy the dwelling from the Housing Association, move in-to commercial rented sector or buy an owner-occupied dwelling.

92
o Want the Housing Associations to return to their role in providing ac-commodation for low income households.
o The increased value of the Housing Association stock should be used to finance housing allowances.
o Advocate explicit stimulation of the home-ownership market.
o Argues that the mortgage interest tax relief is essential for the stimu-lation of the housing market.
o Tax measures should be taken to facilitate structural home improve-ments.
• PvdA (Labour Party):
o Wants to make rental policy more market-orientated by incorporating housing value into the points system.
o Encourages periodic means-testing of household income for access to Housing Association dwellings, above which the household must pay higher rent, buy the dwelling from the Housing Association, move in-to commercial rented sector or buy an owner-occupied dwelling.
o Want the Housing Associations to return to their role in providing ac-commodation for low income households.
o Proposes a levy on rich housing associations to be redistributed to the poorer housing associations
o Advocates reform of the fiscal consequences of home-ownership in a long transition, including a maximum tax rate of 30%, measures to stimulate the repayment of mortgage debt and the phasing out of transfer tax and imputed rent deduction from income tax.
• VDD (Conservative Party):
o Wants to see the Housing Associations sell part of their stock.
o All rents should be liberalised and social rental housing should be abolished.
o Do not wish to interfere with mortgage interest tax relief.
o Wants to abolish transfer tax and putting a ceiling on property tax.
o Wishes to reduce the VAT for major maintenance and home im-provement.

93
• D’66 (Social Liberals):
o Similar to PvdA
o To reduce the social rental sector, they argue the Housing Associa-tions should have an exit option after they have transferred their cap-ital gains to the Crown.
• Groen Links (Green Party):
o Similar market orientated approach to the rental policy as CDA, PvdA, D’66 and ChristenUnie.
o Argues that all tenants of property owned by housing associations should have the right to buy their home.
o Similar reform of the fiscal consequences of home-ownership as the PvdA and D’66, although extended to give measures to cover the fi-nancial risks of home owners who are faced with financial problems.
• ChristenUnie (Protestant confessional party)
o Similar market orientated approach to the rental policy reform as CDA, PvdA, Groen Links and D’66
o Advocate explicit stimulation of the home-ownership market.
o Argues the mortgage interest tax relief should facilitate paying off the mortgage by assuming repayment on annuity basis.
o Propose tax deductible mortgage debt should be capped at €750,000 and the maximum tax rate reduced to 42%.
• PVV (Far-Right):
o Wishes to keep the system as it is.
These manifestos demonstrate that with each party proposing policy for each tar-get electorate, an overall agreement on housing policy that is balanced between home-ownership and rental market reforms cannot be easily achieved without po-litical risk, leading more often than not to governments delaying policy reform. Beolhouwer and Priemus49 clearly demonstrate the gap between the political arena and the expert advice from both the Dutch Housing, Spatial Planning and Envi-ronment Council (VROMRaad)50 and the expert committee of the Dutch Social Eco-nomic Council (SER-CSED)51.
49 Peter Boelhouwer and Hugo Priemus (2011) ‘Housing System Reform: Expert Opinions and Political Reality in the Netherlands’ Paper for the ENHR Conference July 2011 Toulouse, http://www.enhr2011.com/sites/default/files/Paper-P.Boelhouwer-WS03.pdf (accessed 30/05/2013). 50 VROMRaad (2007) ‘Tijd voor keuzes’ [Time for choice], The Hague (VROM Council, or in full Council for Housing, Spatial Planning and the Environment). 51 SER-CSED (2010) ‘Naar een integrale hervorming van de woningmarkt’ [Towards integral reform of the

94
They show that as a result of the 2010 election, with all this debate surrounding housing market reforms, the “Freedom and Responsibility” Government Agree-ment was very limited, without any meaningful reform and the continuation of the ill-advised inflation linked regulated rent increase policy.
In April 2012 the PVV withdrew support for the Rutte Government when it was ne-gotiating a budget for 2013, leading to elections in September 2012, where Rutte (VVD) formed a coalition cabinet with the PvdA. The Coalition Agreement has been seen as the start of an eventual reform of the housing market by many. The housing section of the agreement states:
The Dutch housing market is stagnant. This is bad news for our economy, and a major im-pediment for people who want to buy, sell, rent or move. Requiring annual repayments of principal as a precondition for mortgage interest relief for new mortgages, and structurally reducing conveyance duty, will be the first big steps towards getting the housing market moving again. Finally, we will create a transparent and sustainable framework for the property sales and rental market, thus putting an end to the prevailing uncertainty and putting us within striking distance of a fair and dynamic market. In view of the great im-portance and complexity of these reforms, a new Minister for Housing and the Central Gov-ernment Sector at the Ministry of the Interior and Kingdom Relations will be put in charge of housing issues.
• Mortgage interest relief will continue to exist to encourage people to buy homes of their own, but will be modified as follows. For new and existing loans secured by mortgage, from 2014 the highest rate in force (for the fourth tax band) will be reduced by 1/2% per year, until it has been reduced to the rate for the third tax band. Each year we will transfer the additional revenues generated by this measure in a budget-neutral way back to the group affected by it: half by lowering the income tax rate for the highest tax band, and half by raising the upper limit for the third tax band. The problem of residual debt remaining after property sales will be effectively tackled by making interest payments on residual debt temporarily tax-deductible (for a maximum of five years), under certain preconditions. The facility of the Dutch Municipal Housing Incentive Fund for loans to new buyers on favoura-ble terms will be expanded.
• Housing benefit will be preserved intact to ensure the continued availability of af-fordable housing to low-income people. This will make it possible to raise rents by different amounts for people with different incomes. For tenants with household incomes of less than €33,000, the increase will be 1.5 percentage points above the rate of inflation; for tenants with household incomes between €33,000 and €43,000, 2.5 percentage points above the rate of inflation; for tenants with household incomes above €43,000, 6.5 percentage points above the rate of inflation. Lessors will be able to use an approach based on aggregate rent-al income. The system will be retained of setting a rent above which rents are deregulated. The home valuation system will be drastically simplified by taking as a base 4.5% of the assessed value under the Valuation of Immovable Property Act, thus eliminating the com-plicated points system. For tenants with incomes higher than €43,000, the maximum rent under the home valuation system will be temporarily suspended; as soon as the sitting ten-ants vacate, the maximum rent will be applicable again. This will enable us to tackle the
housing market], The Hague (Expert committee of the Social Economic Council SER), 16 April.

95
problem of distortion in the rental market while maintaining the existing stock of social housing.52
• Housing associations must be made to serve the public interest once more. We will limit their tasks to building, leasing and managing social housing and, as a subordinated task, real property with a social function directly linked to social housing. Housing associa-tions will be directly supervised by municipalities. Municipalities with more than 100,000 inhabitants will be given additional powers. The size of a housing association must corre-spond to the scale of the regional housing market and to its core societal function. The addi-tional rental income that housing associations will receive as a result of measures in the rental sector will be creamed off through taxation. The regulation of the remuneration of housing association managers will be accelerated using the new Top Incomes (Standardisa-tion) Act.
DISTRIBUTIONAL SPREAD OF SUBSIDIES IN THE MAR-KET: HOME-OWNERSHIP FOR THE RICH, TENANCY FOR THE POOR
The political divide over housing reforms is linked directly to the distributive effect of both the home-ownership and rental subsidies. The CPB conducted a report on the distortionary and distributional effects of subsidies in the owner-occupied and rental markets.53 The distortionary effect of subsidies on prices is shown through the ratio of the subsidy to total housing costs. It is used to measure the price dis-tortion between renting and ownership. The subsidies depend on the income of the beneficiary; therefore they compare the subsidies over a range of income lev-els.
The effect subsidies have on purchasing power is measured as the ratio of the sub-sidy to net household income (corrected for without the subsidy). To determine the impact on the income distribution, the CPB calculates the effect on purchasing power over a wide range of household incomes.
They find that government subsidisation for owner-occupiers increases with in-come. Subsidies range from 10% for people with low income, 22% for people earn-ing €35,000, and 25% for the highest earners. For the rental market they find that the government subsidy decreases sharply with the renter’s income. For house-holds with incomes above €15,000 owner-occupying is subsidised more. For renters above €20,000 subsidies are virtually zero, with those earning more being effectively taxed.
The purchasing power effect of subsidies falls with income in both the owner-occupied and the rental households. For owners there is a small and gradual de-cline from 10% at low income levels to 7% at high income. For renters the effect is even small as income increases. Therefore, housing subsidies effectively reduce relative differences in purchasing power.
52 These policies were written in 2012 for the 4 year policy agenda, and these prices were implemented in 2013, and potentially subject to further change in 2014-16. 53 Ibid [46]

96
The report confirms that tenure choice in the Netherlands is highly correlated with income, with households earning around €20,000 the least subsidised income cate-gory. Furthermore, higher income home-owners tend to invest their income in more low-tax assets (mortgage with capital insurance), and low income renters will receive greater rental allowances.
The CBS conducted a report in 2010, which shows that the fiscal subsidies of home-ownership is skewed in favour of high income households.54 They conclud-ed:
• Nearly half of the 7.2m households in the Netherlands had a mortgage on their home in 2008. Together, they paid €28bn in mortgage costs, and re-ceived more than €10bn back from the government through tax deductions. Nearly half of this €10bn was paid to the 20% of households with the highest incomes.
• 4m households in the Netherlands had their own home in 2008. Nearly 3.5m of them had a mortgage on their home. They paid an average €680 per month for their mortgage. On average they received €240 back through mortgage interest relief, by deducting their mortgage interest payments from their income tax and social insurance liabilities.
• 1% of households had very high mortgage costs: €2,700 or more per month. They received 44% of this amount back in the form of tax relief: €1,620 per month on average. For the quarter of mortgage payers with the lowest costs (less than €330 per month) the tax benefit amounted to about 20%, or €40 per month.
FIGURE 27: MORTGAGE TAX RELIEF BY AMOUNT OF MORTGAGE COSTS, 2008
Source: CBS, CBS Web magazine, 12 May 2010
54 Reinder Lok and Peter Meuwissen (2010) ‘Half of benefits from mortgage tax relief go to richest households’ Statistics Netherlands Web magazine, 12 May 2010, http://www.cbs.nl/en-GB/menu/themas/bouwen-wonen/publicaties/artikelen/archief/2010/2010-3118-wm.htm (accessed 30/05/2013).
Less than 330 euro(25 %)
330 to 570 euro (25%)
570 to 870 euro (25%)
870 to 1,600 euro (20%)
1,600 to 2,700 euro (4%)
2,700 euro and more (1%)
Total
% of households

97
FIGURE 28: MORTGAGE TAX RELIEF BY INCOME GROUP, 2008
Source: CBS, CBS Web magazine, 12 May 2010
• Eight out of ten households with a gross income of €106,000 or more had a mortgage. They received nearly 42% of the costs back, an average of just over €1000 per month.
FIGURE 29: SHARE OF TOTAL MORTGAGE TAX RELIEF BY INCOME GROUP, 2008
Source: CBS, CBS Web magazine, 12 May 2010
1th decile (to 16 000 euro)
3th decile (22 000 to 28 000 euro)
5th decile (36 000 to 45 000 euro)
7th decile (55 000 to 66 000 euro)
9th decile (81 000 to 106 000 euro)
Total
euro/month
Mortgage tax relief Net Mortgage payment after tax relief
1th decile (to 16 000 euro)
2th decile (16 000 to 22 000 euro)
3th decile (22 000 to 28 000 euro)
4th decile (28 000 to 36 000 euro)
5th decile (36 000 to 45 000 euro)
6th decile (45 000 to 55 000 euro)
7th decile (55 000 to 66 000 euro)
8th decile (66 000 to 81 000 euro)
9th decile (81 000 to 106 000 euro)
10th decile (106 000 euro or more)
%

98
• Only one in ten households with a gross income of less than €16,000 had a mortgage. They paid an average €620, and received €90 in tax relief. This is connected with the lower tax rates for this income group.
• As a result of the relatively large number of households with a mortgage and the high average tax deductions, 30% of total mortgage tax relief was re-ceived by the highest income group. Just over 19% was paid to the second highest income group. This means that nearly half of mortgage tax relief is received by households with a gross income of more than €81,000. There was considerable political debate about this in the 2012 elections and during the government reforms of the market.
There is a clear division between the tenure choice on the basis of income, which fuels the political economy of political parties’ policy differences. The economic crisis might be reducing the attractiveness of the home-ownership sector, with house prices returning to structural price levels and more restrictive lending prac-tices. Nonetheless, it is clear that the pressure to remove subsidies in the rental market must be matched by removing subsidies in the home-ownership market, from a party political perspective, to ensure greater asset allocation efficiency, in-come to subsidy equality and provide tenure substitution. Finally, the political im-passe which has shaped housing market reform in the Netherlands has been jolted into operation by three European Union considerations: reform to the rented sec-tor, reform to the state subsidies of the Housing Associations, and a reduction of the overall subsidisation of the housing market, amounts to around 4% GDP, to ful-fil the European Union Fiscal Pact.
CONCLUSION
The subsidies to the owner-occupiers and renters are driving the housing sector apart, both at a great fiscal cost and with distributional consequences. The elec-toral system encourages political parties to back either home-owners or tenants according to political philosophy and economic status. It would be expected that there would be political and normative constellation against the tax subsidies in-creasing with the income of the household, but the support for the low income households through the points system of regulation and the large supply of cheap dwellings by the Housing Associations reduces this concern. Therefore, reforms to the housing market must address both sides simultaneously. The mortgage mar-ket has already become less advantageous for owner-occupiers, with less favoura-ble lending, tightened mortgage lending and a decade of house price increases. Furthermore, the Rutte government, after years of supporting the home-ownership subsidies, has started removing these subsidies, for example by allowing mortgage deduction against income for only classical annuity based mortgages. With the political economy paralysis on housing sector reform lifted, it is now necessary to assess the reforms to the subsidies for the social housing sector.

99
CHAPTER 7: HOUSING ASSOCIATIONS
INTRODUCTION
The Housing Associations have developed in the Dutch housing system to a point of great market share and capital assets. This chapter analyses how the Housing Associations fit within an expansive approach to public housing, a review of its history, a theoretical understanding of the role Housing Associations play in the rental market and its current market share. Then it addresses the critique of the private institutional investors that the Housing Associations are crowding out pri-vate capital from the rental market given the rent regulation rules and its financial state aid, the justification of said position, and an assessment of how this state aid is incompatible with EU competition law. In light of this debate, the reforms to the Housing Associations due to be enacted will be assessed. Finally, the chapter will present an economic theory approach to non-profit organisations in an attempt to understand the institutional future of the Housing Associations.
It is found that while the home-ownership sector is being liberalised due for fiscal reasons, the Housing Association reforms are being introduced to increase the pri-vate sector into the rental sector supply with the aim to increase the market effi-ciency of housing in the Netherlands. Throughout this chapter there is an on-going debate between the societal contribution of the Housing Associations against the negative consequences they are inflicting on economic performance and effi-ciency of the rental market and Dutch institutional investment.
AN EXPANSIVE APPROACH OF PUBLIC HOUSING POLI-CY
Like most Western European countries, the Netherlands had to solve a severe housing shortage following World War II, followed by considerable growth in the number of households and the lack of private construction of dwellings. In similar fashion to the other countries, the Dutch government intervened in the housing market in home-building projects, choosing volume of accommodation over other quality consideration policies. This intervention was taken in a period of substan-tial growth in the welfare state. The size of the Dutch public housing sector was greater than other Western European countries, rising from 12% in 1945 to 41% in 1975.

100
Compared to other countries, housing policy was given effective instruments in the 1970s, reflecting the belief that public intervention in the housing market should be continued. The justifications given for a central state control included:
a) Merit good argument – This economic concept by Richard Musgrave states a commodity which is judged that an individual or society should have on the basis of some concept of need, rather than ability and willingness to pay.55
b) Externalities argument – The beneficial effect of good housing and the posi-tive effect on the residential environment.56
c) Redistributional argument – Providing subsidies for the poor who have no access to the mortgage market is a form of redistribution.
d) Development argument – Given the anticipated growth in demand for quali-ty, based on the expectation of growing affluence.
The government made a clear choice in the 1974 Memorandum on Rent and Subsi-dy Policy (Nota Huur- en Subsidiebeleid) for a mixed system of object- and subject-subsidies. The object subsidies were aimed at keeping social housing at an “afford-able house price” (volkshuisvestingsprijs), that were aimed for a range of household incomes.
This expansive housing policy was drawn back in 1989 with a new Memorandum for Housing in the Nineties (Nota Volkshuisvesting in de jaren negentig) stating that the government policy is to facilitate the functioning of the housing market. Five aims of this policy included: to promote adequate quality housing for the housing supply; to make good yet affordable dwellings available to low-income households; to ensure multiplier effects for fields beyond housing; to stabilize the market; and to promote continuity in residential construction. The method for achieving these aims is for the government to adopt a facilitating role. The change of government motivation shows how the arguments for intervention have changed:
a) Merit good argument – Lost validity as the welfare state evolved into a mar-ket economy.
b) Externalities argument – Losing ground, although the ‘social mix’ policy re-mained important for many.
c) Redistributional argument – This concept is inherently flawed, whereby the home-ownership subsidies increase with income. Nonetheless, where re-distribution is a policy aim, it is more efficiently done through targeted monetary transfers, otherwise known as subject transfers. The Dutch gov-ernment recognised this with a focus on targeting financial support to low-er-income households.
d) Development argument – Muted, whereby provision for quality dwellings should be supplied by the PRS.
55 Richard Musgrave (1959) The Theory of Public Finance. New York: McGraw Hill, at pp. 13-15. 56 Esteban Rossi-Hansberg, Pierre-Daniel Sarte and Raymond Owens (2010) ‘Housing Exter-nalities’ Journal of Political Economy 118(3), 485-535.

101
On the one hand, the government produced rental policies to accommodate low and middle income households, while on the other hand deregulated the housing market for the middle and upper-income households to satisfy their quality needs. Nonetheless, the state still has a role in contract enforcement and subsidies to the owner-occupied and rental markets.
In the 1990s the government further reduced its participation in the market by pri-vatising many of its public entities and decentralising many of its responsibilities. The 2000 Memorandum call ‘What people want, where people live’ furthered the individualist development of housing policy, which emphasised tenant freedom of choice, ambitious home-ownership targets and a sale of many social rented dwell-ings.
RESIDUAL AND UNITARY RENTAL MARKETS
There are two theories concerning the development of the non-profit social rental sector which can shape the discussion regarding the history, role and future of the Dutch Housing Associations.
The first is what Harloe terms the residual rental market.57 Primarily he argues that the large social rental sector will not last much longer in a capitalist society, where housing will become a commodity.58 Where the capitalist economy will not adequately house citizens, the state will provide large-scale, subsidised and con-trolled social rented housing.59 It could be argued that the German system demon-strates these characteristics, where the government assistance only provides for those unable to find housing.
Furthermore, Harloe distinguishes two models of social housing provision, which he argues have been found in Western European industrial economies at separate periods of history.60 The first model is the mass model, which are extensive pro-grammes for social rental dwellings aimed for all household incomes and thus avoid negative stigmatisation. The mass model of provision was most common following World War II until the mid-1970s. The second model is the residual model, which accommodates the politically, economically or socially marginalised groups, and thus become stigmatised forms of provision. This model started to be imple-mented during the 1970s, due to a change in the emergence of new economic and political rationale for social rented assistance.
The second theory is more dynamic than Harloe’s residual market model, where Kemeny argues that two housing models may arise simultaneously in different countries: unitary and dual.61 A unitary rental market is where a mature non-profit rental sector can compete successfully with the commercial rented sector in a social market model where there is no state support. The dual rental sector is
57 Michael Harloe (1995) “The People’s Home?” in Social Rented Housing in Europe & America. Oxford: Blackwell. 58 Ibid at 3. 59 Ibid at 6, 524. 60 Ibid at 534, 547. 61 Jim Kemeny (1995) From Public Housing to the Social Market, Rental Policy Strategies in Com-parative Perspective. London: Routledge.

102
essentially where the non-profit rental sector is insufficiently mature and requires state support.62
His theory is therefore dependent upon the economic development and the long-term policy structuring of the rental housing stock, what is termed the concept of maturation. The non-profit organisations do not require a market return on their capital, in comparison to the for-profit organisations. Therefore their financial costs are lower when debt represents a smaller proportion of the market value of the property. Thus, maturation of the non-profit rental organisation increases when the ratio of equity to market value is higher. This occurs with the amortisa-tion of the debt and appreciation of market values over time. With a higher degree of maturation, the non-profit organisations can compete against the for-profit or-ganisations as they are able to accept a lower return on their large equity in terms of lower rents.
The path dependency of maturation depends on government policy either being suppressive or encouraging. Suppressive policy involves the non-profit sector being separated from the for-profit sector in competitive terms. It leaves the non-profit sector acting as a safety net in the form of a strongly controlled public rental sec-tor. With public control, the non-profit sector cannot mature economically. The separation of the public and private rental systems results in the dual system.
Encouragement policy involves allowing the non-profit sector to undertake a high level of maturation through expansion and being able to compete with the for-profit sector. This policy emanates from Germany’s social market economy model, which constructs a market in which the state regulates in order to balance eco-nomic and social priorities. The state regulation comes in the form of rent regula-tion, although Kemeny argues that this regulation should be removed when the non-profit sector has reached a sufficient degree of maturation. The encourage-ment policies must balance a profit motive in the rental market with encouraging supply of non-profit provision, and balancing the forms of tenure between non-profit, for-profit and home-ownership in a manner in which the choice of tenure is determined by the individual rather than government policies. When these chal-lenges are successfully balanced, then the unitary rental sector will not have any low-income stigmatism.
According to Kemeny the Dutch rental sector is developing into a unitary rental model,63 where the government has withdrawn from the Housing Associations, there is more market driven competition between the sectors and the Housing As-sociations are exhibiting greater maturation.64 Using the two theories of Harloe and Kemeny, the history of the Housing Associations will be examined in order to understand the inherent tensions they are creating in the Dutch rental market and why the government is undertaking extensive reform.
62 Ibid 38-40. 63 Ibid at 119. 64 Marja Elsinga, Marietta Haffner and Harry van der Heijden (2005) “A unitary rental market in the Netherlands: theoretical exploration and empirical evidence” in Jón Rúnar Sveinsson (ed.) Housing in Europe: new challenges & innovations in tomorrow’s cities. Reykjavik: University of Iceland, The Urban Studies Institute.

103
HISTORY OF THE HOUSING ASSOCIATIONS
THE ESTABLISHMENT OF HOUSING ASSOCIATIONS
The first Housing Associations were founded between 1850 and 1860 by either Workers’ Associations with the aim to provide housing for the deprived workers or by employers to avoid social unrest among the workers. By 1870 the cooperative housing associations aimed to save enough capital in order to build houses for workers to buy or rent cheaply. In 1876 the Dutch Cooperative Associations Act was enacted, giving the associations legal status, leading to the establishment of 112 Housing Associations in 1899 with 7750 dwellings.
The Housing Act of 1901 brought the Housing Associations under greater state con-trol and support, whereby in return for favourable loans and subsidies for con-struction and management, the sole objective of the associations was for the pro-motion of public housing. There was debate as to the level of public provision these associations provided, where they were usually orientated towards the for-mer ‘pillars’ of Dutch society: Catholic, Protestant or associations. Furthermore, alongside the associations the local authorities were increasingly providing a safe-ty net function for housing.
The Housing Associations played a vital role in the vast building construction pro-cess following World War II to address the severe housing shortage. The object subsidies given to the Housing Associations meant that the state held increasing power over the governance of the associations. The 1947 Housing Allocation Act (Woonruimtewet) transferred the housing allocation power from the Housing Asso-ciations to local councils, leading to a severe reduction of membership, which con-tributed to a crisis for housing associations.
1960S STRENGTHENING OF POWER
As described in the first section, the Netherlands took a different approach to many other Western Countries in the late 1960s and 1970s, where they decided to reinforce public housing policy with effective measures. The Report of the Roos Committee in 1964 concluded that the Housing Associations were to be given the primary role in building new houses which were not attractive for the private sec-tor and to house under-privileged households. As a result the role of building new houses was given to the Housing Associations, and the councils were limited to building if the associations did not wish to take the initiative.
The subsidies towards the Housing Associations were coupled with the principle of equal treatment to the private sector, where the associations were allowed to build better-quality houses and the private sector were allowed to build lower-quality houses. The policy reforms drastically widened the remit of the associations, both in providing for the poor and moving into the higher quality market. This competi-tive policy marks the first sign of the maturation of the Housing Associations.

104
1990S WITHDRAWAL OF GOVERNMENT SUPPORT
As described in the first section, the 1989 Report from the Ministry of Housing, Spa-tial Planning and the Environment (Ministerie van Volkshuisvesting, Ruimtelijke Orden-ing en Milieu, VROM) on Public Housing in the 90s marked the start of a trend to-wards independence which would characterise the Housing Associations. It em-phasised the role of private initiative in the social rented sector, through a major redevelopment of the social rented sector. The sale of rental property was encour-aged, where the need to get government permission to sell rental property was re-moved.
The Housing Associations can also obtain loans at favourable conditions from the Bank of Dutch Municipalities (Bank Nederlandse Gemeenten, BNG), a special pur-pose public bank with an exceptionally good credit rating, which only lends to mu-nicipalities and housing corporations and the Nederlandse Waterschapsbank (NWB). Although the BNG has a limited liability, its top rating can only be sustained under the implicit assumption that the government would support the bank in case of financial problems. At the end of 2010, loans from the BNG to housing corpora-tions totalled over EUR 40 billion, or 6.8% of GDP.
The policy report established two bodies to administer the increased financial in-dependence of the Housing Associations. The first was the Central Housing Fund (CFV), which is a non-departmental body with three roles: financial supervision of Housing Associations on behalf of the Minister for Housing; to take remedial action if the Housing Associations find themselves in financial difficulties; and the redis-tribution of equity for special purposes. The CFV is financed through a levy on the Housing Associations in exchange for the Housing Associations being exempted from paying corporation tax on social activities. Nonetheless, in 2006 this corpora-tion tax exemption was abolished for commercial activities in separate legal enti-ties, and then in 2011 the exemption for social activities was abolished.
The CFV monitors the Housing Associations on six performance targets, which have been criticised for being too unquantifiable for adequate performance indica-tors:
- Care for the quality of the stock;
- Guarantee financial continuity of the organisation;
- Provide privileges to the target group of social housing policy;
- Facilitate tenants’ participation in policy decisions;
- Contribute to the liveability of the neighbourhoods where the housing stock is located;
- Contribute to housing provision for the elderly, the disabled or people who otherwise need help.

105
€15.9bn Long
Term Subsidy Committments
Housing
Associations
€18.6bn debt
owed in loans
Government
The second body established by the report is the Guarantee Fund for Social Hous-ing (WSW), which is a private body that guarantees Housing Associations’ loans. The loans are given at rates below market value, and are the main issue of conten-tion in the public/private financing dichotomy. Furthermore, the central govern-ment and local municipalities provide guarantees on the WSW loans should the demand for loans become too big or the body encounters liquidity issues, effective-ly removing the risk of default. In addition, Housing Associations obtain loans from municipal banks with interest rates approximately 0.5% less than the market.
These bodies were given public legal basis in the seminal Social Rented Sector Management Order (Besluit Beheer Sociale Huursector, BBSH), which came into force in 1993. It stipulated further that the Housing Associations have the task of providing good, affordable housing for those who are unable to pay in the private market, in exchange for tax benefits, guaranteed loans from the WSW and local authorities offering land at below market value for them to build social rented dwellings. In addition, this act stipulated that the Housing Associations could offer high rent and owner-occupied dwellings in the private market.
In conjunction with the BBSH, in 1995 the Dutch government undertook the radical ‘Grossing and Balancing Operation’ (bruteringsoperatie),65 which marked a major shift for the Housing Associations towards financial independence and the matu-ration as described by Kemeny. The State wanted at one and the same time to re-deem the long-standing subsidy commitments (€15.9bn) and simultaneously call in early the loans that the associations still had outstanding (€18.6bn). In this way, the continuous pumping of money round the social housing circuit could be brought to an end.66 The long term subsidy commitments and the loans were usu-ally several decades long in accordance with the agreement of land exploitation. The advantages for the government included savings made on the object subsidies, the administrative bureaucracy could be substantially reduced, and the housing budget could be subjected to a stringent cleanout operation.
During the 1970s and 1980s rental premiums were paid to social landlords to compensate for the difference between the cost price and the actual rent paid by the tenants. The BBSH and Grossing and Balancing Operation ended these subsidies, and generally re-focused remaining direct grants
65 Most commonly referred to as the ‘Balancing and Grossing Operation’, which was given legal basis in the Balancing and Grossing Act (Wet balansverkorting geldelijke steun volkshuisvesting) 1995. 66 Frans Dieleman (1999) ‘The impact of housing policy changes on housing associations: experiences in the Netherlands’ Housing Studies 14(2), 251-260, at 252.
FIGURE 30: FINANCIAL FLOW BETWEEN THEGOVERNMENT AND THE HOUSING ASSOCIA-TIONS IN THE 'BALANCING AND GROSSING OP-

106
towards housing allowances to low income households.67
Moreover, the government could take an independent position with respect to the housing association sector in the discussions concerning the annual rent increase. The independence gave the Housing Associations greater freedom to carry out a more flexible and thus market oriented rental policy, and assumed new responsi-bilities in the management of their property. In effect, ex-ante control over the pol-icies of the Housing Associations was changed to ex-post accountability of the ac-tions of the Housing Associations by the CFV. Priemus identifies six revenue ave-nues for the Housing Associations following the ‘Grossing and Balancing Opera-tion’ have ensured which has ensured sufficient financial resources at their dis-posal to be able to carry out the housing task quite independently: existing finan-cial reserves, substantial rental income, property development of expensive rental and owner-occupied dwellings, sales of existing stock, remaining subsidies through subject grants and object guarantees, and finally mergers between Hous-ing Associations.68 Since the 1995 reforms, the Housing Associations have tended to keep rents low while raising capital to fund a loss in rental income through the other revenue avenues. It can be argued that this approach is appropriate for the supply of affordable housing to low income households in the Netherlands, but as this chapter develops this approach has resulted in the decreasing role of private investment and arguably economic efficiency.
The calculations of the ‘Grossing and Balancing Operation’ were based on a num-ber of assumptions regarding the future development of variables such as interest rates, inflation and rent increases. It has been argued by private investors opposed to the market strength of the Housing Associations that the long and sustained increase in house prices since 1995 far outstrip the assumptions made in 1995, and thus the Housing Associations have received a considerably enhanced amount.
Furthermore, it should be noted that the financial resources of each Housing Asso-ciation depends on their housing stock, especially when considering the geograph-ical diversity of house and rent prices. The net worth of the housing stock depends on their assets (housing stock and rental revenue) and their liabilities (loan debt), which is calculated through the future risk adjusted income wealth and thus vari-able according to factors many factors including the location, corporate govern-ance, existing stock, demand and financing arrangements, inter alia.
In summary, the central aim of the 1989 policy document of creating a more mar-ket approach to the housing sector was claimed by many as being achieved through three areas of reform. The first area was deregulation, where the associa-tions were able to compete in the upper market, the regulated rent price maximum levels were raised much higher than before, the housing associations were subject to market forces such as credit rating and the management was subject to regula-tive accountability by the CFV rather than government control. While object sub-
67 Ministry of Housing, Spatial Planning and the Environment (2009) Cijfers over Wonen, Wijken en Integratie, VROM; Harry van der Heijden, Marietta Haffner and Agnes Reitsma (2002) ‘Ontwikkeling van de Woonuitgaven in zes West-Europese Landed’[Trends in Hous-ing Expenditure in Six West European Countries] Volkshuisvestingsbeleid en Woningmarkt 34, Delft: DUP Science. 68 Hugo Priemus (2001) ‘Social Housing as a transitional tenure? Reflections on the Nether-lands' new housing memorandum 2000-2010’ Housing Studies 16(2), 243-256.

107
sidies were rapidly decreased, the rent levels were raised considerably more than before, at around 5.5%. The only direct subsidy which remains for the tenants are rent allowances, which are based on the household income and amount of rent they must pay. The second was decentralisation, where the ‘Grossing and Balanc-ing Operation’ transferred risk and responsibility from central government to local government and the independent Housing Associations. Finally the third area was self-sufficiency, where the financial and management independence of the Hous-ing Associations would allow them to operate more efficiently in a unitary market in competition with the for-profit institutions.
Essentially the forms have left the Housing Associations in a hybrid position:
- Societal role: Providing low cost accommodation for low income house-holds, supported by WSW loans, cheap municipal bank loans, accountable to the CFV, purchasing land at favourable prices in return for social housing, having many tenants receiving rent allowances, with many dwellings in the regulated rent market and for a long time avoiding VAT and transaction tax-es.69
- Entrepreneurial role: Competing for middle and upper-income household rental market in the unregulated sector, financial independence from gov-ernment object subsidies, managerial independence and professionalism, independent power to buy and sell dwellings and land, able to raise capital on the private market and subject to credit rating assessments.
In theory the two roles can become incompatible, whereby the more an area re-quires financial assistance in the social role, the less entrepreneurial success the Housing Association will be able to earn. On the other hand, an improving area will require less financial assistance in the social role, while the Housing Associa-tions would be earning surplus capital.70 Therefore, one could argue that without large and national Housing Associations or centralised redistribution, the econom-ic efficiency of the Housing Associations is limited on an overall national level.
The pressure is on for social housing institutions to become more market orientat-ed, where the reduction in subsidies and investment in public housing has resulted in the need to increase the efficiency of current funding in order to maintain the social functioning.71 Furthermore, the entrepreneurial role of the Housing Associa-tions can increase the level of accountability from the social actors involved, such as ensuring the residents have a democratic vote over proposed changes.72 Mullins and Rhodes identifies the new form of cooperation between the Housing Associa-tions and the government as the “network approach, [with] high levels of interde-
69 An assessment of the legality of this role under EU competition law follows in the section ‘EU Competition and State Aid Law’ found at page 113. 70 Pierre Koning and Michiel van Leuvensteijen (2010) De woningcorporaties uit de verd-wijndriehoek [Getting housing associations out of the Bermuda triangle]. The Hague: CPB, 1 April. 71 Vincent Gruis and Nico Nieboer (2004) Asset Management in the Social Rented Sector. Policy and Practice in Europe and Australia. Dordrecht, the Netherlands: Kluwer Academic Publish-ers, at 196. 72 David Mullins (2006) ‘Competing Institutional Logics? Local Accountability and Scale and Efficiency in an Expanding Non-profit Housing Sector’ Public Policy and Administration 21(3), 6-24.

108
pendence between organisations and the state where hierarchical forms of ‘com-mand and control’ are no longer effective methods for policy implementation.”73
HOUSING ASSOCIATIONS OWNERSHIP OF HOMES
Housing Associations own 2.3m homes in the Netherlands. This is the equivalent of one in three homes. Another 12% of dwellings are rented out by other private and institutional landlords. The remaining 55% of homes in the Netherlands are owner-occupied homes.
FIGURE 31: HOMES BY OWNERSHIP, 2010
Source: CBS, CBS Web magazine, 5 December, 2011
Homes owned by housing associations are mainly located in large cities. 20% of all homes owned by a housing association are located in one of the four large cities: Amsterdam, Rotterdam, The Hague and Utrecht. In other strongly urbanised mu-nicipalities, too, the percentage of association-owned homes is often higher than the national average.
Other municipalities with a large percentage of housing association homes are Ap-pingedam (in the province of Groningen) and Doesburg (in the province of Gelder-land). In both municipalities, associations own 41% of dwellings. The lowest per-centages of homes owned by housing associations (less than 10%) are in Rozendaal (Gelderland) and Margraten (Limburg).
Within the large cities, homes owned by housing associations are mainly clustered in a number of neighbourhoods. As of 2012 there are 11,896 neighbourhoods in the Netherlands.74 In 275 of them, three-quarters of homes are owned by a housing
73 David Mullins and Mary Lee Rhodes (2007) ‘Special Issue on Network Theory and Social Theory’ Housing Theory and Society 24(1), 1-13. 74 All municipalities are subdivided into districts (wijken), which in turn are subdivided into neighbourhoods (buurten). Neighbourhoods have no formal status.
Nederland
Amsterdam
Rotterdam
The Hague
Utrecht
Own homes
Rental homes owned by housing association
Rental homes owned by other lessor

109
association. More than 2000 neighbourhoods have no association-owned dwellings at all. These are neighbourhoods with mainly owner-occupied homes.
Between 1997 and 2008 there were a considerable number of mergers between Housing Associations, thus raising the average number of dwellings per organisa-tion from 3,000 to 5,600. Evidence suggests that mergers of Housing Associations in the Netherlands is driven by factors such as the market position and profession-alisation.75
TABLE 8: AVERAGE WOZ-VALUE AND ANNUAL RENT OF HOUSING ASSOCIATIONS
2007 2008 2009 2010 2011
WOZ-Value per Housing Association (in 1.000s) 152 158 160 157 154 Annual Rent/WOZ-Value of
Housing Associations (in %) 3.25 3.17 3.09 3.23 3.4 Source: CFV, Cijfers over Wonen en Bouwen 2013, Ministerie van Binnenlandse Zaken en Koninkrijksrelaties.
FIGURE 32: HOUSING ASSOCIATIONS IN PROPORTION TO ANNUAL RENT/WOZ-VALUE, 2011
Source: CFV, Cijfers over Wonen en Bouwen 2013, Ministerie van Binnenlandse Zaken en Koninkrijksrelaties.
75 Gerard van Bortel, David Mullins and Vincent Gruis (2008) ‘‘Change for the Better?’ – mak-ing sense of housing association mergers in the Netherlands and England’ Journal of Housing and the Built Environment 25, 353-374.
0
5
10
15
20
25
30
35
%

110
CROWDING OUT PRIVATE INVESTMENT
The IVBN argues that the Housing Associations have been granted the opportunity to crowd out private institutional investors from the complete private rental mar-ket due to their hybrid position with the government through three channels: charging their tenants rent prices in the regulated sector even though the points for the dwelling is above the threshold; accommodating many households in social dwellings who have middle-to-high incomes; and using their financial advantages afforded to them for their societal role to finance their activity in the medium-to-high quality dwelling market.
ARGUMENT 1: UNDER-CHARGING RENTS
Table 9 shows the number of dwellings the IVBN institutional investors, the small private landlords and the Housing Associations have for three rental price group-ings. The third row shows the unregulated rent dwelling numbers. The fourth column shows the number of dwellings the Housing Associations have in each rent price category according to the points system. Thus it shows that the Housing As-sociations have many dwellings with quality points over 142, which according to the points afforded objectively should be in the deregulated market, but instead the Housing Associations charge rents below the €681.02. While the allocation of rent to points is more accurate with private investors, the Housing Associations have at least 1 million dwellings which are to be liberated.
TABLE 9: COMPOSITION OF OWNERSHIP OF RENTAL HOUSING IN THE NETHER-LANDS
On the basis of rent On basis of WWS-points
IVBN members
Part./Comm. lease
Housing associations
< EUR 548 19,500 234,097 1,909,274 639,222
EUR 548 – 647 56,000 62,589 357,248 651,825
> EUR 647 57,000 87,571 87,571 1,063,103
Total 132,500 384,257 2,354,093 2,354,150 Source: IVBNVISIE: op de huurwoningenmarkt. Uitgave, Naar én vrije sector huurmarkt, September 2011
The private investors see their market being rental dwellings costing between €550 and €900 of rent per month, given that there is no demand for rented dwellings above €900 per month as the household would benefit more from home-ownership at this rent price given the government subsidies. They argue that the Housing Associations are able to enter the €650 - 900 market and charge rents below €650 per month because there is no shareholder interest and no obligation to announce to the market the amount of dividend on their capital.

111
FIGURE 33: HOUSING ASSOCIATIONS DWELLINGS ON THE BASIS OF HOW MUCH RENT IS CHARGED (LEFT) AND ON THE WWS POINTS SYSTEM CEILING (RIGHT)
Source: IVBNVISIE: op de huurwoningenmarkt. Uitgave, Naar én vrije sector huurmarkt, September 2011
As stipulated in the Points System section of this report, when the rent being charged is below €681.02 then rent increase is set by the Minister for Public Hous-ing. Since 2008 the level of rent increase for the regulated sector has been set at inflation, which is clearly not enough dividend for private investors to invest in the market or even stay in the market. The Housing Associations thus are able to ac-cept dividend of 2%, where the private market expects around 6%. The IVBN (which consists of 16 private institutions with around a third of the unregulated market) has reduced its number of dwellings from 300,000 to 130,000 dwellings, most of these coming in the regulated sector.
FIGURE 34: WWS POINTS PER TYPE OF LANDLORD
Source: CBS, Cijfers over Wonen en Bouwen 2013, Ministerie van Binnenlandse Zaken en Koninkrijksrelaties.
81%
15%
4%
< EUR 548 EUR 548 – 647 > EUR 647
27%
28%
45%
< EUR 548 EUR 548 – 647 > EUR 647
€ 2,80
€ 3,00
€ 3,20
€ 3,40
€ 3,60
€ 3,80
€ 4,00
0
204060
80100
120140160
Housingassociation
Investors Private landlords
WW
S-P
oin
ts
Average amount of WWS-points per dwellings (left axis)
Monthly rent per WWS-point (right axis)

112
FIGURE 35: AVERAGE RENTAL INCREASE ACCORDING TO TYPE OF LANDLORD
Source: CBS, Cijfers over Wonen en Bouwen 2013, Ministerie van Binnenlandse Zaken en Koninkrijksrelaties.
ARGUMENT 2: HIGH INCOME TENANTS IN SOCIAL HOUSING
The second area where the private institutional investors feel that they are being crowded out is in the competition for middle income households. In the Nether-lands 43% of the population are applicable for social housing in the Housing Asso-ciations, which at €34,000 is a high level of housing protection. This is due to the aim of housing policy to create a social mix, whereby social housing does not be-come badly stigmatised, leading to ghetto neighbourhoods and the associated problems. It is thus evidently more popular for middle-income households below this threshold to try and get access to Housing Association dwellings over the pri-vate sector. Furthermore, the Housing Associations do not continually assess the incomes of the tenants, thus leading to many tenants whom have received wage increases above this threshold who are still in the dwelling, rather than moving in to the liberated rental sector or home-ownership. Therefore the institutional in-vestors do not welcome the idea of increasing the threshold to €43,000.
Since 1 January 2011, the European Commission has decided that 90% of the rental housing stock in the Netherlands with a rent below the house rent allowance limit (€652.52 in 2011) must be made available to households with a taxable income be-low €33,000. Last year, more than a quarter of the housing association stock was occupied by people earning incomes above this standard income set by the Euro-pean Commission. This amounted to 609,000 dwellings out of the total Housing Association stock of 2.2m. According to the European definition, their incomes were disproportionately high in relation to the rent they had to pay.
0
20
40
60
80
100
120
Housingassociations
Companies Noncommercialinstitutions
Privatelandlords
Investors total
%
until 2 % 2 to 3 % 3% and more

113
FIGURE 36: INCOMES OCCUPANTS HOUSING ASSOCIATION DWELLINGS, 2012
Source: CBS, CBS Web magazine, 3 July 2012
Not all homes owned by housing associations are in the low-rent social housing sector. Approximately 98% of housing association dwellings are in the social hous-ing category, but the proportion may vary by municipality. People with incomes above €33,000 living in housing association dwellings in the so-called ‘free sector’, where a residence permit is not required, do not act against the decision of the Eu-ropean Commission.
FIGURE 37: INCOME COMPOSITION OF TENANTS IN HOUSING ASSOCIATION DWELLINGS
Source: CBS, CBS Web magazine, 3 July 2012.
0
200
400
600
800
1000
1200H
ou
ses
in
1,0
00s
Income in 1,000 euros
Utrecht
Ouder-Amstel
Nieuw-Lekkerland
Graafstroom
Midden-Delfland
%
Houses occupied by people with income above the EC-norm
Houses occupied by people with income below the EC-norm
EC-Norm

114
The proportion of people paying rents considered too low relative to their incomes is far above average in many municipalities in the Randstad region, but oddly enough, this is not the case in the four major Dutch cities, where the proportion varies around the nationwide average. The proportion is relatively high in smaller municipalities situated in the vicinity of Amsterdam, Rotterdam, The Hague and Utrecht.
ARGUMENT 3: HUGE FINANCIAL CAPITAL
The third complaint of the IVBN with regards to the Housing Associations is the advantages given to them in the ‘Grossing and Balancing’ process. Table 10 gives selected financial indicators of the overall position of the Housing Associations ac-cording to the CFV 2010-11 report, where the balance sheet has improved, solvency has increased, loan-to-value has decreased and the interest rate of borrowing has decreased. The institutional investors argue that the state aid before and after 1995 have been locked up within the Housing Associations, whereby the property assets on their balance sheets is stated at €150bn, while the CPB have estimated these assets to be twice that at around €300bn. There are three particular channels previously discussed which benefit the Housing Associations: (1) locations are sold to social rented dwelling developments lower than market price by the local au-thority, (2) the Housing Associations can lower the interest rate paid for a loan with a WSW guarantee, and (3) the Housing Associations have the legal freedom to rent dwellings at ‘unprofitable investment’ prices which does not even cover operation-al costs.76
TABLE 10: CFV FACTSHEET OF HOUSING ASSOCIATIONS FINANCIAL POSITION FOR 2011
Finance 2010 2011
Financial position(X € 1 billion) Balance sheet 117.9 123.5 Housing Association Funds 32.1 34.2 Solvency 27.2 27.7 Loan to Value (public housing operating value/return value long-term debt) 75.7 73.3 Interest rate in % 4.32 4.21 Source: Annual Report Cash flow forecast 2012-2016. 2011, WSW.
It has been argued that the large amount of surplus has not been used with maxi-mum efficiency in the past. A levy was introduced to charge associations to con-tribute to a deprived neighbourhood fund run by the municipalities, in recognition of the failure of the Housing Associations addressing local community challenges. However, this levy has been successfully challenged in court.
76 Marietta Haffner, Joris Hoekstra, Michael Oxley and Harry van der Heijden (2009) Bridging the Gap Between Social and Market Rented Housing in Six European Countries?. Housing and Ur-ban Policy Studies 33. Delft, the Netherlands: Delft University Press.at 225.

115
Although the Housing Associations are not per se wealthy, given the assets are pro-prietary rather than monetary, the IVBN suggests that the imbalance with the pri-vate sector could be addressed by the Housing Associations selling off their dwell-ings in the unregulated market.
The government has proposed a levy for landlords owning over 10 regulated dwell-ings, which would suggest a targeting of the Housing Associations, given their large share of the regulated rental market. Nonetheless, the IVBN argues that this levy will effect most of the institutional investors too, thus not readdressing the imbal-ance. The reason is that institutional investors still have large portfolios including regulated dwellings. The investors are usually investment funds like pension funds, who structure their investment in large packages which contains both regu-lated and deregulated dwellings. Therefore the total dividend of the investment fund will go down, further reducing the overall private investment in the Dutch rental market.
Finally, in this third line of arguing, namely the financial benefits afforded to the Housing Associations, the IVBN believes that the advantages should only be given to the social housing role dwellings, not the dwellings competing in the commer-cial market. A better idea would be for the Housing Associations to sell off the dwellings in the unregulated market, and reinvest the capital in maintenance of the existing stock and increased rent allowances. Without a separation, policies to address the advantages will not be effective, such as the recent implementation that Housing Associations pay VAT, where it is argued that their minimal or nega-tive dividend results in hardly any or no VAT paid. The credit ratings of the Hous-ing Associations will remain high when their liabilities are guaranteed ultimately by the government, thus reducing the market efficiency aspect of credit ratings.
THE IMPORTANT ROLE OF THE HOUSING ASSOCIA-TIONS IN CREATING A UNIQUE SOCIAL HOUSING MIX
AEDES, which represents most of the Housing Associations, states that the contra-ry to the financial argument put forward by the private investors is the social good which affordable housing provided to a large section of society. They argue that the maintenance of a large and good quality rental sector with affordable rents for broad target groups has been a successful policy in the Netherlands against segre-gation and marginalisation.77
The dominant principle of Dutch policy regarding the integration of ethnic minori-ty and ‘socio-economically weak’ groups, since the close of World War II, has been to provide social opportunities through mixed residential environments.78 The de-velopment of social mix housing policies in the Netherlands has been presented
77 Julie Lawson and Nico Nieboar (2009) ‘The Regulation of Social Housing Outcomes: A Mi-cro Examination of Dutch and Austrian Social Landlords Since Financing Reforms’ present-ed at the European Network for Housing Research Conference, Prague, June 28 – July 1. 78 Ellen Lindeman, Kees Dignum, Peggy Schyns, Karin Klein Wolt, Harry Smeers, Simone Crok and Jereon Slot. (2003) De Staat van de Stad Amsterdam II [State of the City of Amsterdam II]. Amsterdam: Department of Research and Statistics. (Dutch).

116
perfectly by van Kempen and Bolt.79 This approach has been echoed in the 1998 Swedish ‘Development and Justice’ policy aimed at combating economic, social and ethnic segregation.80 This emphasis on social mix typically has been justieed on grounds of both economic efeciency (e.g. making society as a whole better off by enhancing solidarity, labour productivity and community sustainability) and distributive equity (e.g. improving the life-chances and social inclusion of disad-vantaged groups)81. A report of the European Commission highlights the member state obligations to encourage integration and cohesion beyond mere formal rights, and particularly within housing to prove equal access to decent and affordable housing, lack of segregation along ethnic and socio-economic lines and frequent inter-ethnic contact.82
RESPONSE 1: HOUSING ASSOCIATION RENTS NOT SIGNIFICANTLY UNDER CHARGED
AEDES defends the prices which the Housing Associations charge for rent by argu-ing that the points system gives a maximum rent which can be charged given the objective characteristics, and not a minimum or target value. They argue that alt-hough there is a theoretical legal price cap, in many parts of the country it is quite impossible to charge that amount of rent. Should the Housing Associations charge that much rent then their dwellings would be more expensive than the commer-cial parties, and thus to achieve the social objectives of providing affordable hous-ing it is necessary to charge below what the points system states.
On the other hand, AEDES argues that there is limited rental stock with rents be-tween €681 and €900 because there is no market for these rental dwellings, as peo-ple who can afford €700-800 per month would be much better off buying a house due to the tax subsidies. Where AEDES does recognise the points system fallacies is in scarcity areas with huge housing demand, where the difference between the regulated dwellings and the unregulated is large. In other words, when liberalised rents would start at around €900 per month, no private market can survive when the better option is to buy a house. Nonetheless, they warn that additional points allocated for scarcity regions is problematic to calculate, as it is difficult to say whether all dwellings within the region has increased quality. Therefore, AEDES warns against the scarcity points adding more than 10% of the total value, and would advocate giving points out on a more local level within all the regions. Al-ternatively, the Amsterdam Tenants Association proposes reforming the points 79 Ronald van Kempen and Gideon Bolt (2009) ‘Social Cohesion, Social Mix, and Urban Poli-cies in the Netherlands’ Journal of Housing and the Built Environment 24, 457-475. 80 Roger Andersson (2006) ‘Breaking Segregation’: Rhetorical construct or effective policy? The case of the Metropolitan Development Initiative in Sweden’ Urban Studies 43(4), pp. 787–799. 81 Simone Delorenzi (2006) “Introduction” in Simone Delorenzi (ed.) Going Places: Neighbour-hood, Ethnicity and Social Mobility. London: Institute for Public Policy Research, pp.1–11. 82 Alfons Fermin and Sara Kjellstrand (2005) Study on Immigration, Integration and Social Cohe-sion, study prepared for the European Commission, DG Employment & Social Affairs, avail-able at http://igitur-archive.library.uu.nl/fss/2007-0227-200324/fermin_05_study_on_immigration.pdf (accessed 05/05/2013); International Centre for Migration Policy Development (2008) Housing Policies Promoting Integration and Community Cohesion at Local Level, thematic discussion paper prepared for the European Union Agency for Fundamental Rights, found at http://fra.europa.eu/sites/default/files/fra_uploads/485-FRA_Thematic_HOUSING.pdf (accessed 05/05/2013).

117
system so that the market is regulated up to rents of €900 per month. Nonetheless, AEDES argues that the unregulated market should be kept open for competition, where the private rented sector can invest as much as they want, provide a level of quality higher than that of the social housing and charge whatever rents they want. AEDES opposes the planned policy reform which would factor the market value of the dwelling as a basis of rent calculation, as it would insufficiently cover all the objective characteristics of the apartment, and thus would threaten all in-vestment in energy efficiency, renovation and refurbishment.
RESPONSE 2: SOCIAL MIX OF INCOME A SUCCESSFUL SOCIAL POLICY
In some cities like Rotterdam the municipality introduced policies of promoting high income households into lower cost dwellings in order to achieve this social mix, as means to tackle criminality and unemployment problems.83 The evidence of this success is debateable, where it was found that people with sufficient in-come would not choose to move there or would move out of the area as quickly as possible. Instead of these project aimed at high income households, AEDES argues that the best manner to achieve the social mix is to have a sufficiently high income threshold for social housing. They argue that €34,000 (per household) access to social housing income threshold is far too low. People who earn slightly above this level, say at €1,700 per month, cannot afford to pay over €681 in rent to private in-vestors, cannot afford a mortgage, and cannot have access to social housing. They argue that mixing social/political objectives with free-market financial governance is a dangerous development which threatens the successful neighbourhood policy of the Netherlands. There is an argument that the politicians more sympathetic to free-market financial governance could not develop this objective within the Dutch democratic route and thus turned to the EU competition law arguments to reach their housing policy objectives.
RESPONSE 3: FINANCIAL BENEFITS NOT SIGNIFICANT
To finance this large social project which brings harmony to urban Dutch neigh-bourhoods, AEDES emphasises the support from the government is not as large as the private investors claim. With the tax advantages and object subsidies now re-moved, the only advantages the Housing Associations receive are relatively cheap-er loans from the municipal banks and the guarantees from the WSW. The esti-mated advantage of these total approximately €0.5bn, which is even lower during this period of very low interest rates. Such support can be supported under the inclusionary housing justification of creating a social and ethnic mix through social housing.84
83 WoON Survey (2006) Statistics Adapted by OTB Research Institute for Housing, Urban and Mobility Studies, Delft. 84 Nico Calavita and Alan Mallach (2010) Inclusionary Housing in International Perspective: Af-fordable Housing in Social Inclusion and Land Value Recapture. Cambridge, MA: Lincoln Institute of Land Policy.

118
However, in many countries the focus of inclusionary housing has been changed to making the private developer designate a certain percentage of his development to affordable housing, and is usually driven by the need to cut the budget.85
The municipalities are no longer selling land to the Housing Associations cheaply given the falling prices of the land on the market, and where they are selling it to the associations, it is now at market value.86 On the other hand, the government is planning on taking out €1.7bn from the Housing Association, which is approxi-mately a sixth of their annual cash-flow through. With the Housing Association assets being non-liquid bricks-and-mortar, the only way will be for the associa-tions to sell off land, which is almost impossible given the market conditions.
They criticise the CPB estimations that the rent would double if the rent regulation was removed. Breaking the report down, the CPB estimates the Housing Associa-tions’ total free market value at €350bn, the market rent at 5.5% of this value, meaning each dwelling costing €1,300 per month and thus nobody being able to live in Amsterdam without earning incomes above €50,000. The discrepancy in the total capital of the Housing Associations is due to pro-cyclical market value esti-mates, whereby the value of property has been taken in the bubble without 20-30% deflation of the housing prices and the array of government policies which aim to remove liquid capital form the Associations. They argue that the CFV is an ade-quate independent body to ensure necessary transparency and financial accounta-bility, where their comprehensive reports show the market and political system information on investments, capital, income, et al.
EU COMPETITION AND STATE AID LAW
The IVBN believed that the Dutch government would not address the position of the Housing Associations in the rental market due to political economy con-straints, and brought a case to the European Commission in 2007 arguing that the policies amounted to state aid under EU competition law. The impact of this case has been considerable, with significant amount of literature available.87 This chap-ter therefore summarises the case, debate and policy effect.
European Competition law is an essential element in creating an efficient internal market with the free movement of goods and capital by ensuring competitive mar-ket economics. The main aspect of EU competition law is preventing market abuse by dominant market players or cartels. Furthermore, EU competition law restricts government intervention in the market which would disrupt the level playing field of competitors.
85 Sarah Monk, Christine Whitehead and Gemma Burgess (2007) ‘The Provision of Affordable Housing Through Section 106: The Situation in 2007’ RICS Research Paper Series 14(7), Lon-don: RICS. 86 Edwin Buitelaar and George de Kam (2011) ‘The Emergence of Inclusionary Housing: Con-tinuity and Change in the Provision of Land for Social Housing in the Netherlands’ Housing Theory and Society 29(1), 56-74; Willem Korthals Altes (2008) ‘Actief grondbeleid betaalt zich terug’ [Active Land Pays Off] Property Research Quarterly 1, 22-27. 87 Marja Elsinga, Marietta Haffner and Harry van der Heijden (2008) ‘Threats to the Dutch Unitary Rental Market’ International Journal of Housing Policy 8(1), 21-37; Jim Kemeny, Jan Kersloot and Philippe Thalmann (2005) ‘Non-profit housing influencing, leading and domi-nating unitary rental markets’ Housing Studies 20(6), 859-872.

119
The Treaty on the Functioning of the European Union (TFEU, replacing the Treaty of the European Community), sets out the rules on EU competition law, and takes precedence over national legislation.
Social housing varies across Europe, but usually exhibits two characteristics. First is that ownership and management of the stock is increasingly privatised or run by limited or non-profit organisations. The second characteristic is that social hous-ing landlords depend on stable access to long term finance with a low interest rate and necessary guarantees. In the Netherlands the Housing Corporations have this first character of government independence and have the second financial charac-teristic. EU competition in essence challenges the public financial support to the Housing Associations when they were competing against the private sector for the middle income households in the rental or home-owner markets, and whether this could be justified on broader role of social housing in society.
Lennartz el al highlight the degree of variation between the private and social sec-tors of housing on a theoretical and practical level.88 On the strictly theoretical lev-el, the private sector operates as profit-maximising agents with the rent acting as a market clearing price, and the public sector operates to serve the political and so-cial public task with market distortion.89 On a strictly theoretical argument, the price competition is thus impossible: the social product of the social housing is immeasurable and unable to be compared under the neoclassical approach of competition law shown below. However, in practice both markets share similar prices, qualities, locations and customer bases. The Dutch social housing offers households a tenure choice with the private market, whereby the private market is regulated in the points system and where the Housing Associations have large in-come ceilings for tenants. It was found that the Dutch Housing Corporations sup-ply of housing to the middle income families meant that the market share went beyond strictly social housing.90
Competition law observes the competition within a market based upon the struc-ture-conduct-performance (SCP) paradigm, which questions whether there is a causal relationship of a neoclassical competitive market between the following three elements:
a. Supply concentration - measures the number and market shares of suppli-ers in a market.
b. Product differentiation - measures the homogeneity of the products that are being traded.
c. Barriers to entry and exit - measures how likely new suppliers enter and exit a market and thus how stable the supply structure in a market is.91
88 Christian Lennartz, Marietta Haffner and Michael Oxley (2012) ‘Competition between so-cial and market renting: a theoretical application of the structure-conduct-performance paradigm’ Journal of Housing and the Built Environment 27(4), 453-471. 89 Michael Oxley (2000) The Future of Social Housing : Learning from Europe. London: Institute for Public Policy Research. 90 Claude Taffin (2008) ‘Social Housing facing the EU Law’ Housing Finance International 23(2), 26-31. 91 Kenneth Clarkson and Roger LeRoy Miller (1983) Industrial Organisation: Theory, Evidence, and Public Policy. Auckland, New Zealand: McGraw-Hill.

120
An assessment with the SCP paradigm in housing will fail to understand the com-plexity of the housing market, where Motta shows that substitutionality of the tenure choice is dependent on the cross-price elasticity of household demand in all sections of the housing market.92 In conclusion, a complete overview of competi-tion law in the housing sector would be too large for this working paper, and thus the rest of this section will concentrate on the essential elements relevant for the reform of the Dutch Housing Associations.93
ARTICLE 107 (EX ARTICLE 87 TEC)
1. Save as otherwise provided in the Treaties, any aid granted by a Member State or through State resources in any form whatsoever which distorts or threatens to dis-tort competition by favouring certain undertakings or the production of certain goods shall, in so far as it affects trade between Member States, be incompatible with the internal market.
2. The following shall be compatible with the internal market:
(a) aid having a social character, granted to individual consumers, provided that such aid is granted without discrimination related to the origin of the prod-ucts concerned;
(b) aid to make good the damage caused by natural disasters or exceptional oc-currences;
(c) aid granted to the economy of certain areas of the Federal Republic of Ger-many affected by the division of Germany, in so far as such aid is required in order to compensate for the economic disadvantages caused by that division. Five years after the entry into force of the Treaty of Lisbon, the Council, act-ing on a proposal from the Commission, may adopt a decision repealing this point.
3. The following may be considered to be compatible with the internal market:
(a) aid to promote the economic development of areas where the standard of liv-ing is abnormally low or where there is serious underemployment, and of the regions referred to in Article 349, in view of their structural, economic and social situation;
(b) aid to promote the execution of an important project of common European in-terest or to remedy a serious disturbance in the economy of a Member State.
92 Massimo Motta (2004) Competition Policy – Theory and Practice. Cambridge: Cambridge Uni-versity Press. 93 Marja Elsinga, Marietta Haffner, Harry van der Heijden and Michael Oxley (2009) ‘How Can Competition in Social Rented Housing in England and the Netherlands be Measured?’ International Journal of Housing Policy 9(2), 153-176.

121
ARTICLE 101 (EX ARTICLE 81 TEC)
1. The following shall be prohibited as incompatible with the internal market: all agreements between undertakings, decisions by associations of undertakings and concerted practices which may affect trade between Member States and which have as their object or effect the prevention, restriction or distortion of competition within the internal market, and in particular those which:
a. directly or indirectly fix purchase or selling prices or any other trading condi-tions;
b. limit or control production, markets, technical development, or investment;
c. share markets or sources of supply;
d. apply dissimilar conditions to equivalent transactions with other trading par-ties, thereby placing them at a competitive disadvantage;
e. make the conclusion of contracts subject to acceptance by the other parties of supplementary obligations which, by their nature or according to commercial usage, have no connection with the subject of such contracts.
2. Any agreements or decisions prohibited pursuant to this Article shall be automati-cally void.
3. The provisions of paragraph 1 may, however, be declared inapplicable in the case of:
i. any agreement or category of agreements between undertakings,
ii. any decision or category of decisions by associations of undertakings.
This article prohibits putting any entities at a competitive disadvantage as a result of a distortion of the competing forces in the common market, including through a special position or agreement. This would suggest that the special position of the Housing Associations in the Netherlands granted by the government which ena-bles them to have a competitive advantage over the private investors is thus in-compatible with EU competition law.
ARTICLE 106 (EX ARTICLE 86 TEC)
2. Undertakings entrusted with the operation of services of general economic interest or having the character of a revenue-producing monopoly shall be subject to the rules con-tained in the Treaties, in particular to the rules on competition, in so far as the application of such rules does not obstruct the performance, in law or in fact, of the particular tasks assigned to them. The development of trade must not be affected to such an extent as would be contrary to the interests of the Union.
This article states that entities entrusted with the operation of services of general economic interest (SGEIs) under a special regime are also in principle incompatible. On the other hand, it is not applicable where applying the rule renders the opera-tion of the performance obsolete. The TFEU does not define what a SGEI specifical-ly is, but this can be found in the 2004 European Commission White Paper on Ser-vices of General Interest as:

122
…services of an economic nature which the Member States or the Community subject to specific public service obligations by virtue of a general interest criterion.94
This definition has since been clarified in a 2012 Communication from the Europe-an Commission, and then adopted in legislation.95 Nonetheless, in observing the challenge by the IVBN in 2007 and the subsequent policy development with regards to the Housing Associations the chronologically relevant definitions and case law will be assessed.
Commission Decision 2005/842/EC laid down the rules under which the Commis-sion will accept compensation to entities providing SGEIs.96 Following the ECJ deci-sion in Altmark case, the Decision stated that there must be a clear definition of the public services to be delivered, an objective and transparent parameter decided in the advance for the calculation of the amount of competition necessary, and the use of the cost parameters based on the costs of a typical entity. Should these conditions be met, then the compensation for the SGEI would not amount to state aid.
Furthermore, the Community framework for state aid in the form of public service compensation, published in November 2005, states that the member state has a wide margin of discretion in classifying services as SGEIs, so long as the obligations and method of compensation for the entities are set out in national legislation specifying the following:
a) The precise nature and the duration of the SGEI obligations.
b) The undertakings and territory concerned.
c) The nature of any exclusive or special rights assigned to the undertaking.
d) The parameters for calculating, controlling and reviewing the compensation.
e) The arrangements for avoiding and repaying over-compensation.
EFFECTS OF EU COMPETITION POLICY ON DUTCH HOUSING POLICY
The EU Commission sent a letter to the Dutch Minister for Housing on the 14th July containing measures which are needed to be taken in order for Dutch housing pol-icy to be compatible with EU competition law. In response, the Minister sent a let-ter in September 2005 to the Dutch Parliament stating that the social housing is a SGEI which would be granted compensation accordingly.
94 European Commission (2004) ‘White Paper on services of general interest’ COM 374 final, Brussels, 12.5.2004, found at http://eur-lex.europa.eu/LexUriServ/site/en/com/2004/com2004_0374en01.pdf (accessed 30/05/2013), pp. 22. 95 Commission Regulation (EU) No 360/2012 of 25 April 2012 on the application of Articles 107 and 108 of the Treaty on the Functioning of the European Union to de minimis aid granted to undertakings providing services of general economic interest Text with EEA rel-evance, Official Journal L 114 , 26/04/2012 P. 0008 – 0013. 96 European Commission (2005) Decision 2005/842/EC on the application of Article 86(2) of the EC Treaty to State aid in the form of public service compensation granted to certain undertakings entrusted with the operation of services of general economic interest, C(2005) 2673

123
To ensure this policy was ‘Europe-proof’ the Minister presented a policy outline to the Dutch government in December 2005 responding to the requirements in a) to e) above, while stressing the wide-ranging mission of Dutch social housing in provid-ing good quality housing for low income households at the same time as ensuring neighbourhoods of social mix of low and middle income tenants.
In addressing a) and b), he set out two concrete objectives of the associations to be considered as SGEIs. The first states that the primary allocation of dwellings in the regulated rental market is towards the target groups of housing policy. The aim is for 90% of regulated dwellings to be allocated to the target groups. Thus, access to social housing was capped for households with income below €33,000 (in 2006). The second objective of the Housing Associations is for the investment in new con-struction and restructuring of dwellings. This is evidently necessary, whereby pri-vate investment in the regulated sector is very weak, due to the dividend due to rent regulation and the lack of capital in the weakened housing market.
In addressing the forms of compensation assigned to social housing associations, the parameters for calculating compensation and the means of dealing with over-compensations, set out in c) to e), Minister Dekker stipulated a range of policy re-forms. The main proposal was to separate the Housing Associations’ accounts for their social and commercial activities. The social activities of the Housing Associa-tions include:
• The construction, lettering, maintenance, renovation and possible sale of dwellings with regulated rent.
• Enhancing the quality of living environment in relation to dwellings with regulated rent.
• The construction, letting and maintenance of social property.
Therefore, any other activities in the unregulated rental market are regarded as being in the commercial market. The Minister proposed a legal separation be-tween the social and commercial activities of the Housing Associations. The social parent organisation would become a shareholder of the corporate entity. Cross-subsidisation from the social activities to the commercial activities is not allowed, although profits from the commercial subsidiary are allowed to be spent by the social parent organisation.
The compensation for Housing Associations consists of the guarantees by the WSW, support in the case of bankruptcy from the CFV, cheap loans from municipal banks and the exemption from VAT, the last of which has been subsequently re-moved. Therefore, any WSW/municipal bank loans or CFV guarantees would only be made for the social activities, and the commercial activities would need to be financed on the open-markets.

124
REFORMS OF THE HOUSING ASSOCIATIONS
NEW GOVERNMENT, NEW PRIORITIES
Before the policy outline could be enacted, early elections were held, where the Christian Democrat and Liberal Coalition was replaced with a Christian Democrat and Social Democrat Coalition. The new coalition agreement revised the housing policy agenda towards regenerating 40 problem neighbourhoods, increasing the affordability of rented housing, energy efficiency investment and increasing the number of new dwellings.
To finance investment in the problem neighbourhoods, the government primarily proposed imposing a tax on the Housing Associations in order to raise €750m per annum. The associations opposed this tax, claiming that it would remove the fi-nancial independence acquired in the 1995 ‘Balancing and Grossing’ process. In other words, they opposed what would have amounted to a de-maturation process in a reverse from a unitary rental market. Following negotiations the Housing As-sociations agreed to contribute €250m per annum into a private investment fund over the next 10 years. Later on this was successfully challenged in courts.
The new housing Minister Vogelaar dropped the policy reform proposals of former Minister Dekker. Using a wide margin of discretion, she stated that the social housing sector was the responsibility of the national state. This demonstrates the political economy constraints in the Netherlands on the reform of the housing sec-tor, where an election and new coalition formation changes the policy path. None-theless, the policy of the government raising €750m a year still shows that the po-litical parties believe the Associations were not using their capital efficiently. Fur-ther questions regarding the Housing Associations capital surpluses included the legitimacy of their management. While Minister Dekker proposed to weaken the Housing Associations vis-à-vis the private sector, Minister Vogelaar proposed to weaken them through central government control.
HOME-OWNERSHIP: THE ELEPHANT IN THE ROOM
As we have seen, the subsidies for the home-ownership market are huge and caus-ing distributive inequality. This is contributing greatly to the existence of a dual market, whereby the low income households are going into the rented sector while the middle and high income households are becoming owner-occupiers. Nonethe-less, the popularity of the rental sector is growing due a more restrictive mortgage market, employment insecurity, demographic trends, inelastic housing supply and labour market needs.
The political economy of reforms to the Housing Associations also depends on re-forms to the home-ownership sector, where the centre-left/left parties would up-hold the tenants’ benefits of the Housing Associations and the centre-right/right parties would uphold the home-owners subsidies and the promotion of private enterprise in the rental market. Therefore, for political reasons the housing mar-ket must be reformed in a holistic sweep, which given the amount of policy con-siderations will take a considerable amount of time.

125
CURRENT PROPOSED REFORMS FOR THE HOUSING ASSOCIATIONS
Following the 2012 election, the VVD/PvdA coalition agreement set out the policy reforms for the Housing Associations, which largely follow the proposals of former Minister Dekker. Although the proposals are not currently conclusive, the Ministry for Public Housing has indicated the following policies as most likely to be an-nounced in Autumn 2013 and implemented in 2015:
• There will be a legal separation of the commercial and social enterprises of the Housing Associations. The finding of whether the loan guarantees are considered “general economic interest”, and thus state aid, are still awaiting. However, it is likely that the EU Competition Commission will find the WSW loan guarantees fall within state aid. It is unsure whether the existing loan guarantees will have to be renegotiated following the policy reform, but it is assumed that Housing Associations cannot get new loans for their commer-cial activities. The debt of non-SGEI branches of the Housing Associations is around 89% financed by loans through the government channels. The CFV argues that when the loans expire, they should not be re-financed by the parent organisation, but rather by the financial market, from financial su-pervision perspective. Another option the government is considering is that the Housing Associations should not have any commercial activities, alt-hough this would be a radical step towards a dual rental market.
• The Housing Associations stock will be more efficiently allocating social dwellings for low income households, in a move away from middle and high income tenants using social housing. This is a policy responding to domestic criticism of many social dwellings being occupied by middle in-come households, and thus reduces the supply of social dwellings for those who need it. With 30% of rented sector receiving rent allowances, the gov-ernment argues that a better allocation attached with rent regulation would increase fiscal efficiency. Nonetheless, the government recognises the posi-tive influence to neighbourhoods which the ‘social mix’ of income diversity has had. Therefore, the income limit for access to social dwellings will be set at €34,000, increased from €33,000, which amounts to 40% of rental households. This threshold is what the EU ruled sufficient. To encourage households with incomes above €34,000 to leave the regulated sector and increase the allocative efficiency the annual rent increases will increase ac-cording to the income of the household, as previously discussed at page 44.

126
FIGURE 38: DISTRIBUTION OF RESIDENTIAL PROPERTY AMONGST TARGET GROUPS, 2012
Source: WoON 2012, Cijfers over Wonen en Bouwen 2013, Ministerie van Binnenlandse Zaken en Koninkrijksre-laties.
• The government will increase the pressure on Housing Associations to in-crease the rent of dwellings which are charged below the maximum rent in areas of scarcity. The recent reform to increase the number of points by 25 in scarce areas does not force the associations to increase the rent and only has effect on new contracts. Similarly, introducing market value points will not force an increase in the rent. The problem with legislating for this issue is that the points system is a national rent policy, and in areas of the Netherlands which are less popular and economically worse off it would not be possible to increase the rent to the maximum. The coalition agreement stated that the rent increase in the regulated sector would depend on the market value of the dwelling, which would increase the rent for the many Housing Association dwellings in scarce areas and/or greater objective quali-ties. This policy has been dropped, due to political constraints, complaints from many private landlords about the instability of rent this policy would cause and opposition from the Housing Associations. Furthermore, with Housing Associations owning 75% of the rented dwellings, the low rents charged deflated the market value, and thus determining a market value for this policy would be difficult.
• The government recognises that the 1995 “Balancing and Grossing” reform left the Housing Associations operating within a no-risk market, leaving them to make a lot of capital, which was based on non-liquid assets of prop-erty. The 1990s reforms sufficiently dealt with the inefficiency of govern-ment controlled allocation of dwellings, rent setting, investments, subsidies and cheap loans, where civil servants were inundated with paperwork and careless with giving out subsidies. Nonetheless, the freedom afforded to the
0102030405060708090
100
HousingCorporations
Private rent Sale
%
HT Target Group EC Target Group Tenants Above

127
Housing Associations’ management was not accountable enough, where the CFV was not given sufficient accountability powers and the Housing Associ-ations offered no shares. This has been demonstrated by the problems sur-rounding Vestia (the single largest housing corporation), emanating from poor governance and financial mismanagement. A holistic view of the pro-posals shows that the government is going to reduce the financial capacity of the Housing Associations to ensure their management increases opera-tional and investment efficiency. For example, they are now charged corpo-ration tax, they will be taxed in order to finance problem neighbourhood re-development schemes, state loans and guarantees for their commercial ac-tivity will be removed and the points system reforms will encourage more higher income households into the private rental dwellings. It is assumed that the Housing Associations will then have to sell off its high quality dwellings to the private sector in the future. Most significantly, the govern-ment is introducing a levy for landlords with over 10 regulated dwellings, which will effectively tax the Housing Associations about €1.7bn per year, starting from 1 January 2014
AN INVESTOR VIEW OF THE REFORMS
From a regulatory view, the Housing Associations should have a legal split between their commercial and social activities, as without it is extremely difficult to deter-mine what cash flow is related to what activity. Therefore to fulfil the legal ra-tionale of a split, a legal rather than administrative split must be carried out. Fur-thermore, for the purposes of private investment a legal split is favourable, so there is a clear regulatory and redistributive separation of the two enterprises.
With an administrative separation an investor’s equity base is being exposed to social and commercial activities. Alternatively, with a legal separation the inves-tor’s equity base is being exposed to commercial activities, but in a private limited structure. A private investor will participate in the legally separated section given there is no exposure to redistribution towards the social sector. The private inves-tor will have their dividend returned without the profits having to be shared across the social activities. Furthermore, with an administrative separation, not only will the equities be exposed across both sides, but the equities will be in a heavily regu-lated investment vehicle with a government regulator incapable of recognising the difference between the social and private equity.
A legal separation, from a tax and financial point of view, has been well tested and sophisticated. The Dutch pension funds’ portfolios were heavily invested in Dutch property 30 years ago, and all of those investments were sold into mostly listed funds which outside investors were invited to invest in. Gradually the pension funds retrieved from their position. The Dutch pension funds and UK insurance companies were the front runners in establishing these forms of investment funds, which did not create market chaos. Therefore, the Housing Associations have a model to follow which involves legal separation with private investment in the commercial profile. The most popular form of investment in the commercial enti-ty of the Housing Association would be through a Guaranteed Investment Vehicle (GIV), which is a type of investment contract, where the investor agrees to put some amount of money into a project, and on the other hand the developer agrees after expiration of a certain deadline to refund fixed amount of profit together with

128
the initial loan. For example, a property investor puts €50,000 into the commercial profile of the Housing Association, against €65,000 to be refunded to him after two years by the Association. By buying stock, rather than buying in, a GIV ensures that Housing Associations, as the former owners, still has an economic interest in the portfolio. The operational management would stay with the Housing Associa-tion as they understand the neighbourhood and the risk of the portfolio. Nonethe-less, the GIV should be outside of the social profile regulatory framework, and thus dependent on a legal separation.
CURRENT FINANCIAL PRESSURES ON THE HOUSING ASSOCIATIONS
Primarily, the associations are suffering painful losses on derivatives which are yet to be marked on their balance sheets, predominantly due to decreasing property values. The funds of the public housing sector grew with 7% in 2011 to €34.2bn, with a solvency ratio around 27.7%. Nonetheless, with the losses on derivatives included the funds would be €2.6bn lower, which would be a 8% loss.
Secondly, the announced policy reforms have not been factored in. The landlord levy announcement, which will be implemented in 2014 at a cost of €620m, has not been processed in the balance sheet. Should this have been included then the funds would have decreased to €26.4bn with solvency around 23%. Further policy announcements not factored into the finances of the Associations include in-creased property tax and sanitation tax due to the restructuring plan of the Vestia Housing Corporation. Nonetheless, the incoming rent increases have not been fac-tored in, which should rebalance these deficits.
The Housing Associations themselves have different solvency levels, due to geo-graphic market conditions, operational activities, corporation tax and risk premi-ums. The CFV found that 32 had insufficient solvency
The debt position of the Housing Associations leaves the Associations highly vul-nerable to interest rate risks. For existing loans with a variable interest rate, these are hedged with derivatives, which in itself may bring liquidity and counter-party risks. An interest rate rise from the historically low rates in 2011 and 2012 will bring a larger credit spread on base rate loans and new loans when refinancing the debt. This is especially dangerous for Associations which rely on short-term fi-nancing.
Further liabilities relate to the property market. There is €5bn of obligations for the Associations to redevelopment and repurchasing. These obligations depend on the market, which has been negative since 2008. Similarly the Housing Associations will have to write off acquired land positions and sell off new construction projects as the market weakens.

129
CONCLUSION
The development of the Housing Associations’ role in Dutch housing policy can be generalised into three steps. Primarily, following the war and up to the 1990s they represented a strong arm of the government in providing affordable housing to meet the demand by low income households in a residual rental market. Then the second phase of development occurred during the 1990s, where the Housing Asso-ciations were liberated from the direct subsidies of the government, and in return were given the freedom to operate with an additional entrepreneurial role, albeit with ex ante accountability from the CFV. Annex 2 has an extended political econ-omy explanation for what is described as the isomorphism of the Housing Associa-tions into corporate entities, or in other words how they have changed their role from a non-profit and state-sponsored provider of affordable housing into a large and dominant supplier of housing.
The 1990s reforms however left the Housing Associations with a blurred mandate, where on the one hand they had public support in favourable loans from the BNG, guaranteed loans from the WSW and tax advantages, while on the other hand were competing against the private market. Although strategy was defended by many for effectively redistributing the proceeds of the private enterprise into the supply of affordable dwellings and creating a social mix for society by including middle income households in social housing developments, it has diminished the private investment into the private rented sector. On the basis of state aid provid-ing the Housing Associations a market advantage over the private sector, EU com-petition and state aid law ruled that the public support could only be provided for “services of general economic interest”. Therefore, in the third transitional phase for the Housing Associations, the government is due to implement legislation stat-ing that the public support can only be provided for their social role, and not their private sector business.
In addition, the government is due to reformulate the financial and market posi-tion of the Housing Associations. Their market position will be effected first by lowering the income limit for access to social housing, and secondly by reforming the points system as mentioned in chapter 4 many of the Housing Association dwellings will become unregulated and the rent increases will be larger than the past few years. On the financial side, the government will introduce a large levy every year for providers of more than 10 regulated dwellings, thus effectively tar-geting predominantly the funds and asset capital of Housing Associations to en-courage them to focus on their social role.
It must therefore be concluded that the reforms of the Housing Associations will return their role to dual market approach, where the non-profit sector acts to pro-vide affordable housing to those unable to access the private market, with the sup-port of state subsidies, a position reminiscent of the role afforded to them by the Roos Committee in 1959. This would be similar to the German private rented mar-ket, where the private sector plays a more significant role. Alternatively it could be argued that the Housing Associations have developed so significantly that they can efficiently distribute the profit from their private enterprise into their social hous-ing in order to maintain the current supply of dwellings. The reform must be seen together with the reform of the home-ownership sector, where the government support is being reduced, predominantly for fiscal and economic efficiency rea-

130
sons, after considerable political economy deadlock. The negative of liberalisation, in comparison to the potential forthcoming unaffordability of houses in the home-ownership sector, will be the potential end of the supply of affordable rental dwell-ings and the increase of social segregation. A crude conclusion could be that while subsidies were introduced to both ends of the market to entice voters, subsidies are being taken away from both ends of the market to ensure there is no net loss for either political side.

131
CHAPTER 8: CONCLUSION: DUTCH HOUSING POLICY AS A LONG TERM PLAN
An alternative view to the incoherent Dutch political economy of housing policy reform can be argued, which states that there is a long term transitional reform process taking place over the past 50 years that reflects the needs of the economy and people.
Following the findings of the government “staatscommissie de Roos” in 1959, the Dutch government committed to restructuring the Netherlands from a develop-ment economy with strong government involvement following the second world war into a matured economy with the government role in facilitating the economy. Many recommendations were made to a holistic range of policies including social security, labour market, regulation on pricing of core-goods, and finally, the resi-dential sector and the social housing aspect within it. The core element of the re-forms was that the government should step down from interference and allow the sector to become more mature by itself, including the abolition of all kind of subsi-dies with regards to constructing and exploiting real estate. Furthermore, should there be deficiencies in the ability of households to pay for rent, there would be targeted rent subsidies. The government started implementing some of these measures in 1962, but had to step down these very market heavy measures in light of social protest movements which swept across Europe. Instead they decided to implement mixing rental subsidies with retaining rent regulation, whilst keeping subsidies for construction and exploitation of real estate.
This mixed policy remained until the 1990s, where in 1995 the BBSH definitively abolished all subsidies for constructing and managing real estate, with only rental subsidies left. The transition involved 37bn guilders from the government into the Housing Associations, and the Housing Associations paying back 35bn guilders into the government, with the net revenue for the Housing Associations being around 2.5bn guilders. Following this monumental move to abolish construction and ex-ploitation subsidies, the next logical development is the abolishment of rent regu-lation. However, it is acknowledged that this step could only be taken if the subsi-dies to the home-ownership market would be taken simultaneously. Having pre-viously been fiercely against abolishing the mortgage interest deductions against interest tax, Mr Rutte is now implementing such measures, and thus entering the next phase of liberalising the Dutch housing market.
The government sees that if the residential market is to be deregulated in order to make the parameters more attractive for private investment, they need to reform the huge role of the Housing Associations which are not at present governed by the capital markets as they do not issue shares, but as a result of the 1995 abolishment of subsidies they are not under the control of the government. Now the govern-ment sees the Housing Associations as established enterprises with sustainable business models, it wants to remove the huge capital base. This is being done through the large levy and legal separation with the unregulated Housing Associa-

132
tion dwellings, which will in turn force the Housing Associations to sell off their portfolio of dwellings in the unregulated sector. The Germans successfully fol-lowed this route when it sold off its public social housing in the 1990s and 2000s.
The Rutte government is simultaneous deregulating both ends of the market as was first proposed in the Roos Committee of 1959. With subsidies being reduced in the home-ownership sector and the Housing Associations returning into a dual rental sector role, the government is implementing market based reforms to the rent regulation. For example, introducing market value into the points system will radically alter its normative basis of being a national and objective quality assess-ment to a market led approach. A market based approach to the rental market will thus change the social characteristics of Dutch spatial planning, where the ‘social mix’ neighbourhoods will diminish and the institutional soft law approach of ten-ancy law will harden. Aside from government reform to the private rented sector, the inelastic supply of housing, the demography challenges, economic factors, fi-nancial investment factors and the decreasing attractiveness of home-ownership will in itself encourage more people to choose renting as their tenure choice. This latest policy reform process represents the logical next step in a long term process, and it would be expected that there would be no change to the system for the next 10-20 years.

133
BIBLIOGRAPHY
Altes, W. K. K. (2008) ‘Actief grondbeleid betaalt zich terug’ [Active Land Pays Off], Property Research Quarterly 1, 22-27.
Andersson, R. (2006) ‘Breaking Segregation: Rhetorical construct or effective policy? The case of the Metropolitan Development Initiative in Sweden’, Urban Studies 43(4), 787–799.
Anheier, H. and Ben-Ner, A. (eds.) (2003) The Study of the Nonprofit Enterprise: Theories and Approaches, New York: Kluwer Academic/Plenum Publishers.
Barker, K. (2004) Review of Housing Supply, Delivering Stability: Securing our Future Housing Needs, London: HMSO.
Boelhouwer, P. and Priemus, H. (2011) ‘Housing System Reform: Expert Opinions and Political Reality in the Netherlands’ Paper for the ENHR Conference July 2011 Toulouse, http://www.enhr2011.com/sites/default/files/Paper-P.Boelhouwer-WS03.pdf (accessed 30/05/2013).
Boelhouwer, P., Boumeester, H. and Van der Heijden, H. (2006) ‘Stagnation in Dutch housing production and suggestions for a way forward’, Journal of Housing and the Built Environment 21, 299-314.
Buitelaar, E. and de Kam, G. (2011) ‘The Emergence of Inclusionary Housing: Con-tinuity and Change in the Provision of Land for Social Housing in the Netherlands’, Housing Theory and Society 29(1), 56-74.
Calavita, N. and Mallach, A. (2010) Inclusionary Housing in International Perspective: Affordable Housing in Social Inclusion and Land Value Recapture, Cambridge, MA: Lin-coln Institute of Land Policy.
Central Statistics Bureau (2012) ‘Over a quarter of tenants in housing association stock earn more than 33 thousand euro’ Web Magazine, 04 July 2012, found at http://www.cbs.nl/en-GB/menu/themas/bouwen-wonen/publicaties/artikelen/archief/2012/2012-3652-wm.htm?Languageswitch=on (accessed 05/11/2013)
Central Statistics Bureau (2012) ‘Dutch homes worth twice as much as total mort-gage debt’ Web Magazine, 06 September 2012, found at http://www.cbs.nl/en-GB/menu/themas/macro-economie/publicaties/artikelen/archief/2012/2012-3680-wm.htm (accessed 30/05/2013).
Central Statistics Bureau (2012) ‘Energy class known of over 2 million dwellings’ Web Magazine, 23 October 2012, found at http://www.cbs.nl/en-GB/menu/themas/bouwen-wonen/publicaties/artikelen/archief/2012/2012-3697-wm.htm (accessed 05/11/2013).
Central Statistics Bureau (2011) ‘Housing associations own one in three Dutch homes’ Web Magazine, 06 December 2011 found at http://www.cbs.nl/en-GB/menu/themas/bouwen-wonen/publicaties/artikelen/archief/2011/2011-3520-wm.htm?Languageswitch=on (accessed 05/11/2013).

134
Central Statistics Bureau (2010) ‘Half of benefits from mortgage tax relief go to richest households’ Web Magazine, 12 May 2010 found at http://www.cbs.nl/en-GB/menu/themas/bouwen-wonen/publicaties/artikelen/archief/2010/2010-3118-wm.htm(accessed 05/11/2013).
Clarkson, K. and Miller, R. L. (1983) Industrial Organisation: Theory, Evidence, and Pub-lic Policy, Auckland, New Zealand: McGraw-Hill.
Commission Regulation (EU) No 360/2012 of 25 April 2012 on the application of Ar-ticles 107 and 108 of the Treaty on the Functioning of the European Union to de minimis aid granted to undertakings providing services of general economic inter-est Text with EEA relevance, Official Journal L 114 , 26/04/2012 P. 0008 – 0013.
De Huurcommissie(2011) ‘Jaarverslag’.
De Huurcommissie(2012) ‘Jaarverslag’.
De Kam, F. (2009) ‘Coalitie baart begrotingsmuis met grote staart [Coalition budget like a mouse with a long tail], NRC Handelsblad, 4 + 5 April.
Delorenzi, S. (ed.) (2006) Going Places: Neighbourhood, Ethnicity and Social Mobility, London: Institute for Public Policy Research.
De Nederlandsche Bank(DNB) (May 2010) ’ Overview of Financial Stability in the Netherlands’, DNB no. 11
Dieleman, F. (1999) ‘The impact of housing policy changes on housing associations: experiences in the Netherlands’, Housing Studies 14(2), 251-260.
DiMaggio, P. and Powell. W. (1983) ‘The Iron Cage Revisited: Institutional Isomor-phism and Collective Rationalisty in Organizational Fields’, American Sociological Review 48, 147-160.
Directive 2002/91/EC of the European Parliament and of the Council of 16 Decem-ber 2002 on the Energy Performance of Buildings
Dutch Supreme Court, January 11th 2002, NJ 2003, 255 Schwarz/Gnjatovic
Elsinga, M., Haffner, M. and van der Heijden, H. (2005) ‘A unitary rental market in the Netherlands: theoretical exploration and empirical evidence’, Jón Rúnar Sveinsson (ed.) Housing in Europe: new challenges & innovations in tomorrow’s cities. Reykjavik, University of Iceland, The Urban Studies Institute.
Elsinga, M., Haffner, M. and van der Heijden, H. (2008) ‘Threats to the Dutch Uni-tary Rental Market’, International Journal of Housing Policy 8(1), 21-37.
Elsinga, M., Haffner, M., van der Heijden, H. and Oxley, M. (2009) ‘How Can Compe-tition in Social Rented Housing in England and the Netherlands be Measured?’, In-ternational Journal of Housing Policy 9(2), 153-176.
European Commission (2004) ‘White Paper on services of general interest’ COM 374 final, Brussels, 12.5.2004, found at http://eur-lex.europa.eu/LexUriServ/site/en/com/2004/com2004_0374en01.pdf (accessed 30/05/2013).

135
European Commission (2005) Decision 2005/842/EC on the application of Article 86(2) of the EC Treaty to State aid in the form of public service compensation granted to certain undertakings entrusted with the operation of services of general economic interest, C(2005) 2673
European Commission (2013) ‘European Economy - Macroeconomic Imbalances Netherlands 2013’, Occasional Papers 140 April 213.
European Mortgage Federation (2013) ’Key Figure 2011’ found at http://www.hypo.org/Content/default.asp?PageID=414 (accessed 30/05/2013).
Fermin, A. and Kjellstrand, S. (2005) ‘Study on Immigration, Integration and Social Cohesion’, study prepared for the European Commission, DG Employment & Social Affairs, available at http://igitur-archive.library.uu.nl/fss/2007-0227-200324/fermin_05_study_on_immigration.pdf (accessed 05/05/2013)
Fitzpatrick, S. and Stephens, M. (eds.) (2009) The Future of Social Housing, London: Shelter.
Giebels, R. and van Uffelen, X. (2009) ‘Failissement Lehman was moedig besluit’ [Lehman Bankruptcy was a Brave Decision], de Volkskrant, 23 December.
Gruis, V. and Nieboer, N. (2004) Asset Management in the Social Rented Sector. Policy and Practice in Europe and Australia, Dordrecht, the Netherlands: Kluwer Academic Publishers, at 196.
Haffner, M. and Boumeester, H. (2009) ‘Affordability of housing in the Netherlands: an increasing gap between owning and renting’, Paper presented at International Symposium on Housing Affordability and Market Stability, 24-27 March 2009, Tsinghua University, Beijing, China.
Haffner, M., Hoekstra, J., Oxley, M. and van der Heijden, H. (2009) Bridging the Gap Between Social and Market Rented Housing in Six European Countries?, Housing and Ur-ban Policy Studies 33. Delft, the Netherlands: Delft University Press.
Handy, F. (1997) ‘Coexistence of nonprofit, for-profit and public sector institutions’, Annals of Public and Cooperative Economics 68(2), 201-223.
Harloe, M. (1995) The People’s Home? in Social Rented Housing in Europe & America, Ox-ford: Blackwell.
Harms, E. (2009) ‘Hoe staat de woningmarkt ervoor?’ [What is the State of the Housing Market], Tijdschrift voor de Volkshuisvesting 15(3), 11-15.
Hendershott, P. and White, M. (2000) ‘Taxing and Subsidizing Housing Investment: The Rise and Dall of Housing’s Favoured Status’, NBER Working Paper No. 7928. Cam-bridge, MA: National Bureau for Economic Research.
Hulse, K. (eds.) Secure Housing in Rental Housing: A Comparative Analysis, Austral-ian Housing and Urban Research Institute.Report No. 170.

136
International Centre for Migration Policy Development (2008) ‘Housing Policies Promoting Integration and Community Cohesion at Local Level’, discussion paper prepared for the European Union Agency for Fundamental Rights, found at http://fra.europa.eu/sites/default/files/fra_uploads/485-FRA_Thematic_HOUSING.pdf (accessed 05/05/2013).
International Monetary Fund (2008) ‘Global Financial Stability Report’, Washington DC: IMF.
International Monetary Fund (2009) ‘Fiscal Rules—Anchoring Expectations for Sus-tainable Public Finances’, http://www.imf.org/external/np/pp/eng/2009/121609.pdf (accessed 30/05/2013).
IVBNIVSIE: op de huurwoning (September 2011) ‘Naar een vrije sector huurmarkt’ found at http://www.ivbn.nl/viewer/file.aspx?FileInfoID=342 (accessed 05/11/2013).
Kemeny, J. (1995) From Public Housing to the Social Market, Rental Policy Strategies in Comparative Perspective, London: Routledge.
Kemeny, J., Kersloot, J. and Thalmann, P. (2005) ‘Non-profit housing influencing, leading and dominating unitary rental markets’, Housing Studies 20(6), 859-872.
Kleinhaus, R. and Van der Laan Bouma-Doff, W. (2008) ‘On Priority and Progress: Forced Residential Relocation and Housing Changes in Haaglanden, the Nether-lands’, Housing Studies 23(4), 565-587.
Koning, P. and van Leuvensteijen, M. (2010) ‘De woningcorporaties uit de verd-wijndriehoek’ [Getting housing associations out of the Bermuda triangle], The Hague: CPB, 1 April.
Lawson, J. and Nieboar, N. (2009) ‘The Regulation of Social Housing Outcomes: A Micro Examination of Dutch and Austrian Social Landlords Since Financing Re-forms’, presented at the European Network for Housing Research Conference, Prague, June 28 – July 1.
Lees, L., Slater, T. and Wyly, E. (2008) Gentrification, New York: Routledge.
Lennartz, C., Haffner, M. and Oxley, M. (2012) ‘Competition between social and market renting: a theoretical application of the structure-conduct-performance paradigm’, Journal of Housing and the Built Environment 27(4), 453-471.
Lindeman, E., Dignum, K., Schyns, P., Wolt, K. K., Smeers, H., Crok, S. and Slot, J. (2003) De Staat van de Stad Amsterdam II [State of the City of Amsterdam II], Amster-dam: Department of Research and Statistics. (Dutch).
Ministry of Housing, Spatial Planning and the Environment (2009) ‘Cijfers over Wonen, Wijken en Integratie’, VROM.
Ministry of the Interior and Kingdom Relations (2013) ‘Cijfers over Wonen en Bouwen’.

137
Monk, S., Whitehead, C. and Burgess, G. (2007) ‘The Provision of Affordable Hous-ing Through Section 106: The Situation in 2007’, RICS Research Paper Series 14(7), London: RICS.
Motta, M. (2004) Competition Policy – Theory and Practice, Cambridge: Cambridge Uni-versity Press.
Mullins, D. (2006) ‘Competing Institutional Logics? Local Accountability and Scale and Efficiency in an Expanding Non-profit Housing Sector’, Public Policy and Admin-istration 21(3), 6-24.
Mullins, D. and Rhodes, M. L. (2007) ‘Special Issue on Network Theory and Social Theory’, Housing Theory and Society 24(1), 1-13.
Musgrave, R. (1959) The Theory of Public Finance, New York: McGraw Hill.
OECD (June 2012)’OECD Economic Surveys Netherlands – Overview’.
OECD (2004) ‘OECD Economic Surveys Netherlands 2004: Housing Policies’
Ouwe, A. and van Daalen, G. (2002) Dutch Housing Associations: A Model for Social Housing, OTB Research Institute for Housing, Urban and Mobility Studies. Delft, the Netherlands: Delft University Press.
Oxley, M. (2000) The Future of Social Housing : Learning from Europe, London: Institute for Public Policy Research.
Priemus, H. (2001) ‘Social Housing as a transitional tenure? Reflections on the Netherlands' new housing memorandum 2000-2010’, Housing Studies 16(2), 243-256.
Priemus, H. (2010) ‘The Credit Crunch: Impact on the Housing Market and Policy Responses in the Netherlands’, Journal of Housing and the Built Environment 25, 95-116.
Rabobank (June 2013) ’Dutch Housing Market Quarterly’, Rabobank Economic Re-search Department.
Romijn, G. and Besseling, P. (2010) ‘Economische effecten van regulering en subsi-diering van de huurwoningmarkt’ [Economic effects of regulating and subsidizing the rental housing market], CPB Discussion Document No.165. The Hague: CPB. (In Dutch)
Rossi-Hansberg, E., Sarte, P. and Owens, R. (2010) ‘Housing Externalities’, Journal of Political Economy 118(3), 485-535.
Rúnar Sveinsson, J. (ed.) (2005) Housing in Europe: new challenges & innovations in to-morrow’s cities., Reykjavik: University of Iceland, The Urban Studies Institute.
Sarkissian, W. (1976) ‘The idea of social mix in town planning: An historical over-view’, Urban Studies 13(3), 231-246.
SER-CESD (2010) Naar een integrale hervorming van de woningmarkt [Towards integral reform of the housing market], The Hague: Expert Committee of the Social Eco-nomic Council SER), 16 April.

138
SER-CSED (2010) ‘Naar een integrale hervorming van de woningmarkt’ [Towards integral reform of the housing market], The Hague (Expert committee of the Social Economic Council SER), 16 April.
Stichting ROZ Vastgoedindex and IPD Netherlands (2013) Netherlands Annual Prop-erty Index: Results for the year to 31 December 2012, found at http://www.ipd.com/indices/index.html?country=Netherlands (accessed 10/10/2013).
Taffin, C. (2008) ‘Social Housing facing the EU Law’, Housing Finance International 23(2), 26-31.
Ter Rele, H. and van Steen, G. (2001) ‘Housing Subsidisation in the Netherlands: Measuring its Distortionary and Distributional Effects’, CPB Discussion Paper No. 002.
Van Bortel, G., Mullins, D. and Gruis, V. (2008) ‘Change for the Better? – making sense of housing association mergers in the Netherlands and England’, Journal of Housing and the Built Environment 25, 353-374.
Van der Heijden H., Haffner, M. and Reitsma, A. (2002) ‘Ontwikkeling van de Woonuitgaven in zes West-Europese Landed’[Trends in Housing Expenditure in Six West European Countries], Volkshuisvestingsbeleid en Woningmarkt 34, Delft: DUP Science.
Van den Noord, P. (2003) ‘Tax Incentive and House Price Volatility in the Euro Area: Theory and Evidence’, OECD Economics Department Working Papers, No. 356, OECD Publishing.
Van Ewijk, C., Jacobs, B. and Mooji, R. (2007) ‘Welfare Effect of Fiscal Subsidies on Home Ownership in the Netherlands’, De Economist 155(3), 323-336.
Van Kempen, R: and Bolt, B. (2009) ‘Social Cohesion, Social Mix, and Urban Policies in the Netherlands’, Journal of Housing and the Built Environment 24, 457-475.
Van Leeuwen, R. and Bokeloh, P. (2012) ‘Mortgage market in the Netherlands’, ABN AMRO Group Economics Paper, available at www.abnamro.nl/nl/images/.../04.../Speciale_uitgaven_4_van_5.pdf (accessed 30/05/2013).
Vermeulen, W. and Rouwendal, J. (2007) ‘Housing supply in the Netherlands’, CPB Discussion Paper No.87. The Hague: CPB.
VROMRaad (2007) ‘Tijd voor keuzes’ [Time for choice], The Hague (VROM Council, or in full Council for Housing, Spatial Planning and the Environment).
Walter, P. (ed.) (1987) The Nonprofit Sector: A Research Handbook, London: Yale Uni-versity Press.
WoON Survey (2006) Statistics Adapted by OTB Research Institute for Housing, Ur-ban and Mobility Studies, Delft.

139
World Trade Organisation (2009) World Trade Report 2009, New York: World Trade Organisation.
WSW (2011) ‘Annual Report: Cash Flow Forecast 2012-2016’

140
ANNEX 1: TAX IN THE DUTCH PRS
TAXES FOR PRIVATE LANDLORDS
INDIVIDUAL
Primary residence
Deemed rent on house taxable.
Mortgage interest and related expenses such as initial fee for loan deductible.
Other annual payments of house deductible.
Local taxes levied for sewerage, rubbish collection etc.
Deemed rent and local taxes based in tax value of house (WOZ waarde), which is determined once every two years.
Transfer taxes are 2% for living accommodation. For new property (less than two years after first use) VAT is chargeable and transfer taxes creditable against VAT.
Transfer taxes off-settable on a transfer within six months (temporarily extended to three years for properties purchased between 1 September 2012 and 1 January 2015).
Leasehold property: annual ground rent is deductible (but no deduction if it is paid in one instalment).
Subsidies are available for renovation of “monuments” (listed buildings).
Types of mortgage loan
• Annuity
• Endowment
• Bank savings
• Investments
• Life insurance
• Non-repayment
For new mortgages there is a maximum period of 30 years for deduction. New mortgage loans require repayment.
On selling a house and buying a new house the profit on the old house must first be used towards the cost of the new house.

141
Loan must be used for the house purchase or for building work on the house.
Interest can be allocated between (fiscal) partners.
A loan from the employer is possible and is not taxable (but also not deductible).
Rate for interest deduction being reduced by 0.5% per annum from 2014 so that deduction will eventually be at the 42% rather than the 52% rate.
Temporary rental places the property in box 3. On termination of temporary rental property falls in box 1, at least until the end of 2013.
Interest remains deductible if house is for sale and was main residence and has been empty for a maximum of three years after the calendar year in which it is left.
Current loan to value ratio being reduced from 106% (including transfer tax) to 100% from 2013. Energy saving investments leading to lower living costs can in-crease this back to 106%.
PRIVATE INDIVIDUAL LANDLORDS
House used as second home falls in box 3 and is taxed at 1.2% of the WOZ value of 1 January each year. The amount of the loan is deductible from this (strictly the taxable amount is 4% of the WOZ value and the tax on that is 30%).
If house is rented out value is based on “leegwaarde ratio” and also taxed in box 3.
Leegwaarde ratio: annual rent is divided by WOZ value. The resulting percentage determines the percentage of the WOZ value which is taxable in box 3. The per-centage is between 50% and 85%.
Other local taxes as above.
VAT and transfer taxes as above.
If house owned is part of a business it falls into box 1 all income and gains are tax-able.
For investment real estate depreciation is permitted to the WOZ value. For other buildings the base is 50% of the WOZ value.
Individual who rents or places property at the disposal of a company in which he or a related party (basically partner or children of taxpayer or partner) owns a sig-nificant interest (basically 5% or more) fall in box 1.
VAT may apply.
Tax rates run from 5.85% to 52%.
Special rules for business property also used as main residence (for instance 1.4% of WOZ value is added for a property with a value between EUR 75.000 and EUR 1.040.000 and above that the figure is EUR 14.560 plus 1.75%).
Wage tax may be withheld for a property provided to an employee.

142
For foreign property often market price will be used as there is no WOZ value.
CORPORATE LANDLORDS
Basically similar situation to individual landlords, except for placing at disposal of related party.
Tax rates 20% on profits up to EUR 200.000 and 25% for the excess.
HOUSING ASSOCIATIONS
No longer exempt for tax purposes.
There is a special increase in rents allowed for property rented to parties whose income is too high and the proceeds of this will be subject to a special lessor tax. The intention is to force the housing associations to increase their rent to individ-uals who are considered to live too cheaply but it applies to all lessors. This would only apply if a lessor has more than 10 properties: the amount is 0.0014% (0.231% as from 2014) on the total WOZ value of all the regulated properties less 10 x the average WOZ value (effectively 10 properties are therefore free of tax).
A housing association can be considered as an Algemeen Nut Beogende Instelling (AB-NI, charitable entity) which means that gifts can be made to it without gift tax. Cer-tain exemptions apply for transfer tax, e.g. for sale to the housing investment fund or in the context of local development companies or other ANBIs. They can form a fiscal group.
TENANTS
No deductible expenses.
Right to housing allowances if rent is less than approximately EUR 650 and house-hold income is less than approximately EUR 28.000. This is dependent on whether one lives alone or with a partner, age, level of rent, type of house and type of in-come. For pensioners the level of wealth is also relevant.
Special rules also apply for parents under 23 or a person under 23 with a handicap and a residence which has not been modified.
Rents can be increased by:
• Inflation plus 1.5% for household incomes up to EUR 33.614.
• Inflation plus 2% for incomes between EUR 33.614 and EUR 43.000.
• Inflation plus 4% for higher incomes (above EUR 43.000).
The inflation adjustment is 2.5% for 2013. There is some doubt as to whether this will be fully applied in 2013.

143
ENERGY SAVING MEASURES
House owners: solar panels, 15% of cost up to EUR 650, local subsidies e.g. for insu-lation (e.g. Amsterdam, 15% up to EUR 5.000), green roofs and walls (Amsterdam West and South). Loans can be available for certain green investments which make the house more energy efficient.
There is a reduced VAT rate for renovation costs with respect to the work element.
For businesses there is an energy deduction both in personal and in corporate in-come tax of 41.5% over a maximum of EUR 118 million, provided the investments are on the energy list. There is also a normal investment deduction.
Certain environmental investments give an entitlement to a deduction of 36%, 27% or 13.5%. Minimum investment is EUR 2.300.
FOCUS OF TAXES
There is a gradual reduction of benefits for house owners. Mortgage interest relief is subject to increasing conditions and the extent is being reduced, albeit slowly.
In the future this is likely to continue. However, major changes are not likely. Ef-forts to tax costs of travel from home to work have not been successful so that there is still no incentive for people to move closer to their work.
The arrangement with respect to regulated housing is complex but also is unlikely to get simpler in the near future.

144
ANNEX 2: ECONOMIC THEORY OF NON-PROFIT ORGANISATIONS
A non-profit organisation is defined by their non-distributional constraint, where no profits are given to its owners, members or associated partners.97 This section gives political and economic theory as to the origins and future of the non-profit provision of dwellings in the Netherlands by the Housing Associations. This final section ties together the history, residual/unitary arguments, critique, reform and EU competition law aspects which have been addressed. The line of reasoning set out by Elsinga et al. (2005) is followed here.98
The demand for the non-profit sector can be explained through several economic theories. The median voter thesis,99 takes market failure as the point of departure. Welfare theory suggests that government intervention is justified in order to cor-rect the market failure in order to ensure a more efficient operation of the market. However, the heterogeneity of opinions found in a democracy might cause the government to either not intervene or intervene insufficiently. The government is said to have intervened to the demand of the median voter, and the non-profit sec-tor has filled the gap left. Looking at the history of the Dutch Housing Associa-tions, the initial creation by the Workers groups was due to the lack of adequate state housing. Alternatively, one could suggest that the subsidised position of the Housing Associations is a median voter position, between the pro-tenant left wing and the pro-home-ownership right wing of Dutch politics. This theory would sup-port the fact that all groups in Dutch housing support the rent regulation and sub-sidies for the low income households and those in desperate need of housing.
This line of argument only applies to public goods, which must satisfy the three criteria of non-excludability, non-rejectability and non-rivalness in consumption. Clearly housing is not a public good given people can be excluded from it, anyone can reject the product and the marginal costs of consumption are not zero. There-fore, why are for-profit organisations not offering the social housing to meet the residual demand? The answer comes from the contract failure theory,100 which also takes market imperfection as a point of departure, recognising that consumers lack complete information about the goods or services offered on the market, known as asymmetric information101. Asymmetric information leads to a princi-
97 Richard Steinberg (2003) Chapter 16 “Economic Theories of Nonprofit Organizations. An evalutation” in: Helmut Anheier and Ben-Ner Avner (eds.) The Study of the Nonprofit Enter-prise. Theories and Approaches. New York: Kluwer Academic/Plenum Publishers, pp. 277-309. 98 Marja Elsinga, Marietta Haffner and Harry van der Heijden (2005) “A unitary rental market in the Netherlands: theoretical exploration and empirical evidence” in Jón Rúnar Sveinsson (ed.) Housing in Europe: new challenges & innovations in tomorrow’s cities. Reykjavik: University of Iceland, The Urban Studies Institute. 99 Helmut Anheier and Ben-Ner Avner (eds.)(2003) Ibid, at pp. ix-x. 100 Henry Hansmann (1987) chapter 2, “Economic Theories of Nonprofit Organization” in Powell Walter (ed.) The Nonprofit Sector: A Research Handbook. London: Yale University Press, pp. 27-42. 101 Femida Handy (1997) ‘Coexistence of nonprofit, for-profit and public sector institutions’ Annals of Public and Cooperative Economics 68(2), pp. 201-223.

145
pal-agent problem, where contract failure arises from the distrust when the pro-ducer or supplier has greater knowledge than the consumer and is thus in a posi-tion to defraud or mislead the consumer. However, a non-profit organisation with a non-distributional constraint provides the institutional framework whereby the consumer will not be exploited and thus will feel confident in the product or ser-vice. The BBSH provides this institutional setting for the Housing Associations, whereby the management must act in the interests of the social housing tenants. It is argued that customers feel more security in the regulated rental sector than the liberalised sector where the rent increase is set by the Minister for Housing ra-ther than profit maximising landlords. Furthermore, the tenants in the regulated rental sector are able to resort to the Rent Commission with tenancy complaints. Nonetheless, this advantage is minimised as the institutional investors provide increasing confidence to their tenants through more advanced customer service and complaints channels, while the confidence in the Housing Associations has been rocked by several scandals.
While there is a demand for non-profit provision of dwellings, what ensures their supply? Whereas the for-profit organisations are profit maximising firms with corporate management subject to market control,102 the non-profit sector will have greater productivity inefficiency. It is argued that this lack of shareholder control over the Housing Associations has resulted in the inefficiency of their large capital surplus. With the impending government reform to make the points system more market based and the reduction of the social housing subsidies, it is questionable whether the Housing Associations market inefficiencies are sustainable. The risk of being taken over is definitely present for the dwellings in the unregulated sector.
In particular, the acceptance of this low dividend inefficiency is part of the reason why the Housing Associations are able to charge below “market” value rents and rent increases only at inflation. Without government support, non-profit organisa-tions thus are generally limited in numbers and have higher financing costs on the capital markets. To counter-argue this line of reasoning, Hansmann suggests that the higher costs experienced by the non-profit organisations is the price paid to remove the principal-agent problems of contract failure. Therefore, the consumers are prepared to pay a premium for the trust in non-profit provision. Extending this argument further, it could be argued that the government has been willing to pay this premium (through subsidies) in order to satisfy the tenant voters for political reasons, relating back again to the Dutch electoral cycle.
Turning to the future of the Housing Associations as non-profit organisations com-peting with the for-profit private landlords and institutional investors, the question still remains whether there will be a residual or unitary rental market. Di Maggio & Powell offer a theory of institutional isomorphism, which claims that institutions which are exposed to the same conditions in the long term will converge in struc-ture, culture, output and behaviour as they will adjust their behaviour according-
102 Kenneth Clarkson and Roger LeRoy Miller (1983) Industrial Organization. Theory, Evidence, and Public Policy. Auckland: McGraw Hill.

146
ly.103 They state three mechanisms of isomorphism, which are subsequently as-sessed against the Housing Associations:
I. Coercive isomorphism: This is when there is force, persuasion or invitation to act in collusion. This is especially apparent with laws and regulations of financial reporting, taxation and the environment which have been increas-ing since the 1995 reforms. For example, domestically there has been a re-moval of the object subsidies and increasingly similar tax regimes. More importantly, under pressure from the EU state aid rules, the reform agenda of the government is ensuring that the Housing Associations and institu-tional investors are on the same level of playing field for dwellings in the open market. Nonetheless, the existing regulation in the social sector en-sures that coercive isomorphism is limited, as the financial reporting to the CFV is not given as much accountability as a financial statement to the shareholders in the open market.
II. Mimetic isomorphism: This results from the standardised reactions of or-ganisations to uncertainties concerning organisational technologies, objec-tives or the business environment. In other words, when there are market insecurities firms will usually mimic other (more skilled or larger) firms so that they are not individually caught out. The financial management of the Housing Associations is of much greater standard than when the govern-ment gave out many inefficient subsidies and they have been competing against the private sector.
III. Normative isomorphism: This is where members of one profession in dif-ferent institutions tend to think and act similarly, often through profession-al networks. More influential is the recruitment of managers for the Hous-ing Associations from the private sector. The Housing Associations have be-come more similar to foundations, with a professional chief executive who reports to a supervisory board.
103 Paul DiMaggio and Walter Powell (1983) ‘The Iron Cage Revisited: Institutional Isomor-phism and Collective Rationalisty in Organizational Fields’ American Sociological Review 48, pp. 147-160, at 149.

Boligøkonomisk VidencenterJarmers Plads 21551 København V
www.bvc.dk