the dynamic random dot correlogram evoked...
TRANSCRIPT

The dynamic random dot correlogram evoked potentials
PhD thesis
Written by Dr. Katalin Erdősné Markó
Doctoral School of Theoretical Medicine Head of the Doctoral School:
Dr. János Szolcsányi
A -137 Program leader: Prof. Dr. László Lénárd
Topic leader: Dr. Gábor Jandó
University of Pécs, Medical School,
Institute of Physiology
2012.

PREAMBLE
In my thesis, I report the effect of two important stimulus parameters (contrast and luminance) of dynamic random dot correlograms (DRDCs), invented by Béla Julesz, on evoked brain electrical potentials. DRDC is a cyclopean stimulus and composed of random dots. Cyclopean stimuli are visible and evoke responses only in subjects with functional binocularity. Absence of DRDC-VEP indicates the lack of binocularity. DRDC-VEP is a suitable method to examine non-cooperating subjects, e.g. infants.
Julesz’s original idea was to use DRDC-VEP as a screening method for amblyopia in early infancy. For implementation of the method in infants both their lower contrast sensitivity and the luminance reducing effect of the red-green filters have to be taken into consideration. Absence of DRDC-VEP may be due to the low contrast or luminance in infants with otherwise matured funtional binocularity.
Observing the contrast and luminance dependence of DRDC-VEP may contribute to the better understanding of binocular information processing mechanisms in the brain.

INTRODUCTION
According to single unit experiments, encoding of depth perception requires both V1 and upper visual cortical areas. Disparity and anticorrelation sensitive neurons can be found in V1 (Poggio and Fischer 1977; Poggio et al 1988; Prince et al 2002), V2 (Burkhalter and Van Essen 1986; Thomas et al 2002), V3 (Felleman and Van Essen 1987; Hubel and Livingstone 1987; Hubel and Wiesel 1970), V4 (Watanabe et al 2002), MT(V5) (Maunsell and Van Essen 1983), dorsal MST (Roy et al 1992), lateral MST (Eifuku and Wurtz 1999) and CIP(Taira et al 2000) as well. Human fMRI experiments support the idea that V1 is an important and probably first stage of evolving depth perception but almost all extrastriatal areas show activaion during cyclopean stimuli, morover, V3 seems to play important role (Tyler 2004) (Backus et al 2001)
Stereoscopic depth processing mechanisms are affected by contrast. Stereoacuity improves with increasing contrast, unless the increase is monocular (Cormack et al 1991; Halpern and Blake 1988; Legge and Gu 1989). Interocular differences in contrast rapidly deteriorates binocular fusion, whereas equalizing interocular contrast restores it. This phenomenon is often referred to as contrast paradox in stereopsis (Stevenson and Cormack 2000). Binocular cortical neurons are also modulated by contrast. Striate neurons linearly integrate contrast information yielding in binocular summation of contrast signals (Smith et al 1997).

MC neurons have higher firing rates to luminance contrast than do neurons in the PC pathway. MC neurons react non-linearly to contrast, whereas PC units show almost linear characteristics. The contrast gain of a typical MC neuron is about 10 times higher than that of PC neurons and their contrast response function usually saturates at lower contrasts (Kaplan and Shapley 1982; Shapley et al 1981). The amplitude of a luminance contrast evoked VEP is often linearly related to the log of contrast (Campbell and Maffei 1970), however, these contrast amplitude response curves (CR) evoked by different spatial frequency gratings show some nonlinearities. Several authors have reported either a straight-line relation at low contrast followed by saturation at high contrast or a double-slope straight-line relation in their studies (Bobak et al 1984; Rudvin et al 2000; Valberg and Rudvin 1997). These nonlinearities or multi-slope CRs can be associated with different parallel visual pathway sensitivities (Souza et al 2007).
The effect of luminance on the latency and amplitude of the VEPs was quite extensively studied in other types of stimulation. Reduction of the stimulus luminance had a negligible effect on the amplitude of pattern evoked VEPs (PVEPs), however, a linear relationship was found between the log luminance and the P100 wave latency (Kurita-Tashima et al 1992) (Froehlich and Kaufman 1991). Halliday reported that each tenfold decrease in retinal illumination increased the P100 latency by 15 ms and reduced the amplitude by 15%. (Halliday 1980; Halliday et al 1973). Froehlich and Kaufman found that most of the alteration in PVEP latency can be accounted for by a nearly equal increase in the P50 (b wave in old

term (Holder et al 2007)) peak time of the simultaneously recorded pattern electroretinogram (PERG). Conversely, amplitude variations of the PERG and PVEP responses were quite different when retinal illumination was reduced. (Froehlich and Kaufman 1991)
OBJECTIVES
To study contrast amplitude response curve of the DRDC-VEP because: 1. it provides insight into the behavior of the signal and the processing mechanisms of binocular correlation 2. it can suggest subcortical pathway (i.e. MC or PC) origins for cortical binocular information processing network.
To examine the effect of luminance on DRDC-VEP amplitude, in the achievable luminance range, with CRT monitors so that 1. to decide if luminance reduction caused by the filters has a significant effect on detectability. 2. to determine that the luminance reduction induced delays correspond to the delay in retinal processing or other luminance dependent time consuming cortical processing mechanisms have to be taken into consideration. Based on the data from Froelich and Kaufman, our hypothesis was that the regression slopes of DRDC-VEP latencies, as a function of luminance, would be similar to that of PERG and PVEP.
METHODS
In the contrast and luminance study, a total of 16 and 10 adult subjects (mean age: 25.7 and 23.1) were studied, respectively.

DRDCs were presented on the red and green channels of a 19” cathode ray tube computer monitor (Samsung Model 957MB) with 320 × 240 pixels spatial and 60 Hz temporal resolution. Subjects wore red-green goggles for dichoptic viewing.
Dynamic random dot correlogram stimulus
The DRDC stimulus has two alternating phases.
1. Fig. In order to demonstration, DRDC stimulus was drawn as a matrix of 4x4 pixels. „C” signs correlated states, while „A” marks anticorrelated frames. These figures consist tens tousands of pixels on the monitor in reality. As it can be seen at 60Hz, 16 correlated and 16 anticorrelated frames change each other resulting the pulsation perception when it is viewed by red-green glasses. Bottom wave is a representative average DRDC-VEP in synchrony with these changing phases.
In the correlated phase, random dot images consist of 50% dark (black) and 50% bright (yellow) dots, which are identical within the red and green channels. In the anti-correlated phase, images are composed of 50% red and 50% green dots, therefore dark dots in the green channel correspond to every bright dot in the red and vice versa. Random dot images were updated 60 times per

second. The image change was synchronized to the monitor refresh cycle.
The percept of a correlated phase is a noisy surface in the plane of the monitor, a sort of “snowstorm” while during anti-correlated frames “woolly” depth can be perceived (Julesz et al 1980). Alternation between the two phases can only be detected by a person who has functional binocularity. The “woolly” depth and the “snowstorm” can be clearly seen below 0.5 Hz, at the 1.875 Hz stimulus rate the actual percept is a pulsation at this frequency.
In the contrast study eight different contrast conditions were used, while the space-average mean luminance was kept constant. In the luminance study, the luminance of the stimulus was reduced with neutral density filters (NDFs) placed in front of the red-green filters and the contrast was kept constant at 70%.
PVEP and PERG Measurements
In the luminance study, in three subjects, PVEPs and PERGs were recorded simultaneously. Conditions and protocol were very similar to experiments carried out 20-30 years ago by several authors (Kurita-Tashima et al 1992) (Chiappa and Ropper 1982; Froehlich and Kaufman 1991). Retinal illumination was reduced by the same NDF used in the RDRC-VEP experiment. After topical anaesthesia and mydriasis, PERGs were recorded with corneal DTL ERG electrodes.

Recording Conditions and Data Analysis
Visual Evoked Potentials
Electrodes were placed conventionally at Fz and Oz with a ground electrode at Cz, corresponding to the ISCEV standard (Odom et al 2004). 2. Fig. Settings
Signals were sampled and processed with a CED 1401 Power data acquisition device. The electrical signals were amplified and band pass filtered between 0.5-250 Hz, continuously sampled at 960 Hz and stored with the trigger pulses for off line analysis.
3. Fig. Raw EEG record (Program Spike2)
Analysis of DRDC-VEP, T2circ statistic
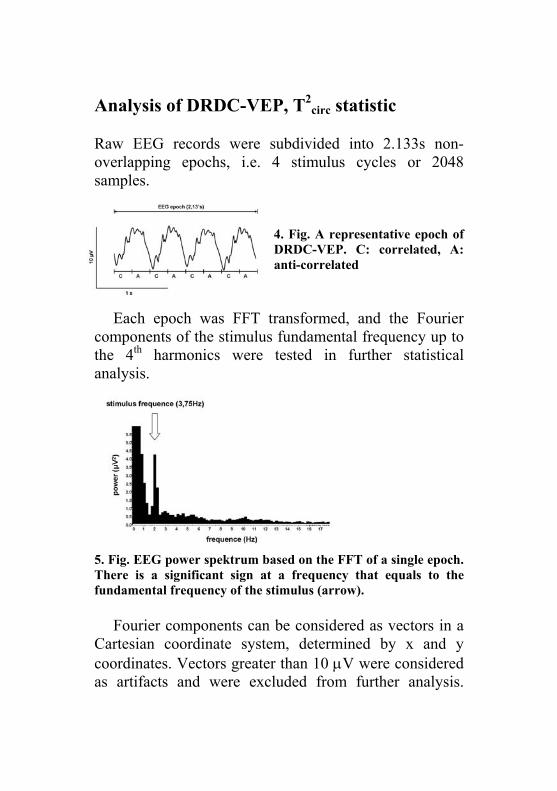
Raw EEG records were subdivided into 2.133s non-overlapping epochs, i.e. 4 stimulus cycles or 2048 samples.
4. Fig. A representative epoch of DRDC-VEP. C: correlated, A: anti-correlated
Each epoch was FFT transformed, and the Fourier components of the stimulus fundamental frequency up to the 4th harmonics were tested in further statistical analysis.
5. Fig. EEG power spektrum based on the FFT of a single epoch. There is a significant sign at a frequency that equals to the fundamental frequency of the stimulus (arrow).
Fourier components can be considered as vectors in a
Cartesian coordinate system, determined by x and y coordinates. Vectors greater than 10 μV were considered as artifacts and were excluded from further analysis.
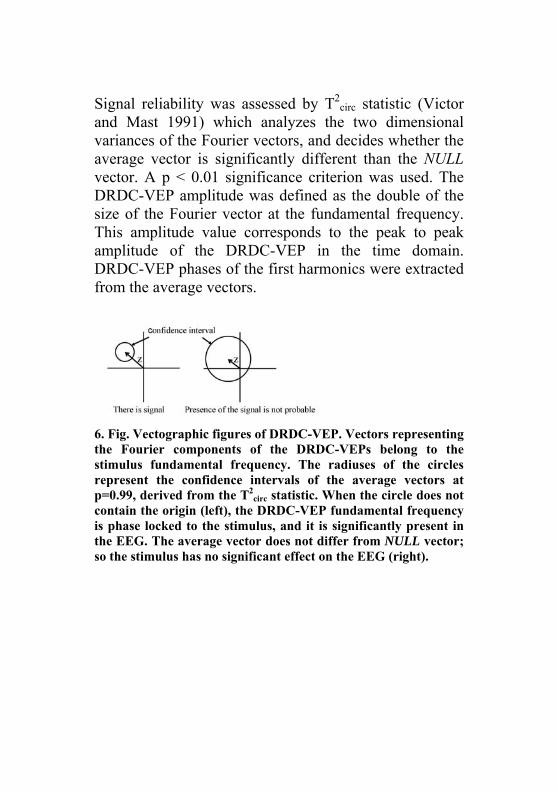
Signal reliability was assessed by T2circ statistic (Victor
and Mast 1991) which analyzes the two dimensional variances of the Fourier vectors, and decides whether the average vector is significantly different than the NULL vector. A p < 0.01 significance criterion was used. The DRDC-VEP amplitude was defined as the double of the size of the Fourier vector at the fundamental frequency. This amplitude value corresponds to the peak to peak amplitude of the DRDC-VEP in the time domain. DRDC-VEP phases of the first harmonics were extracted from the average vectors.
6. Fig. Vectographic figures of DRDC-VEP. Vectors representing the Fourier components of the DRDC-VEPs belong to the stimulus fundamental frequency. The radiuses of the circles represent the confidence intervals of the average vectors at p=0.99, derived from the T2
circ statistic. When the circle does not contain the origin (left), the DRDC-VEP fundamental frequency is phase locked to the stimulus, and it is significantly present in the EEG. The average vector does not differ from NULL vector; so the stimulus has no significant effect on the EEG (right).

RESULTS
Contrast study
7. Fig. Right panel: Representative averaged dynamic random dot correlogram evoked VEPs (n~25 epochs) of subjects B.R. DRDC-VEPs were recorded at the eight contrast levels from the highest (top trace) to the lowest (bottom trace) contrast, respectively. Letters “A” and “C” mark the anti-correlated and correlated states in DRDC stimulus. Pixel size: 7.5 min of arc, stimulus rate: 1.875 Hz, frame rate: 60 Hz Top left panel: vectographic figures of the same DRDC-VEPs.
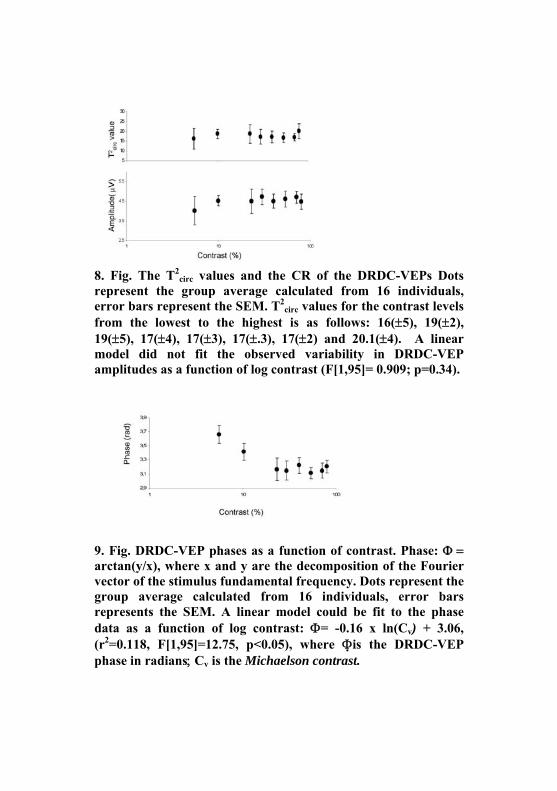
8. Fig. The T2
circ values and the CR of the DRDC-VEPs Dots represent the group average calculated from 16 individuals, error bars represent the SEM. T2
circ values for the contrast levels from the lowest to the highest is as follows: 16(±5), 19(±2), 19(±5), 17(±4), 17(±3), 17(±.3), 17(±2) and 20.1(±4). A linear model did not fit the observed variability in DRDC-VEP amplitudes as a function of log contrast (F[1,95]= 0.909; p=0.34).
9. Fig. DRDC-VEP phases as a function of contrast. Phase: Φ = arctan(y/x), where x and y are the decomposition of the Fourier vector of the stimulus fundamental frequency. Dots represent the group average calculated from 16 individuals, error bars represents the SEM. A linear model could be fit to the phase data as a function of log contrast: Φ= -0.16 x ln(Cv) + 3.06, (r2=0.118, F[1,95]=12.75, p<0.05), where Φis the DRDC-VEP phase in radians; Cv is the Michaelson contrast.

Luminance study
Fig. 10 Right: Representative DRDC-VEP responses of a subject (n~20 epochs) evoked at different mean luminance levels. Values are visible on the right side of the figure. “C” and “A” markers show the correlated and anti-correlated phases of DRDC stimulus, “n.s.” means statistically non-significant response. Left: Vectographic representation of the first harmonic of the DRDC-VEP responses assessed by the T2circ statistic.
Fig. 11. The mean DRDC-VEP amplitude as a function of mean screen luminance. The amplitude is defined as 2*√(x2+y2), where x and y are the decomposition of the Fourier vector of the first harmonic of the stimulation frequency. Dots represent the group average (n=5-10), error bars represents the SEM. Since only one

subject had significant responses at the two lowest luminance levels, that data was excluded. Linear regression could not be fit (F[1,72]= 0.7, p=0.4) to the DRDC-VEP amplitudes as a function of log luminance.
12. Fig.The mean DRDC-VEP latency as a function of mean screen luminance. A linear model could be fit to the phase data as a function of log luminance: Latency (ms)= -63.4 x log L + 292.16; (r2=0.55, F[1,72]=87.82, p<0.01) DRDC-VEP phases were calculated as follows: Φ(rad =arctan(y/x); where x and y are the decomposition of the Fourier vector of the first harmonic at the stimulation frequency, then corrected by stimulus cycle “Φ±2�“ similarly to MATLAB’s unwrap function. Phases were then converted to latencies as follows: (Φ’(ms=(Φ±2π)*(T/2π); where T=533 ms. Dots represent the group average calculated from all 10 subjects and error bars represent the SEM. Since only one subject had significant responses at the two lowest luminance levels, that data was excluded.

Fig. 13. Mean VEP latencies as a function of luminance. Filled circles: DRDC-VEP phase converted to latency; Empty circles: PVEP P100 latency; Crosses: PERG P50 latency. Error bars represent the SEM. Regression slopes for PERG P50 and VEP P100 latencies are statistically identical. P50 = -16.42x + 63.61; r2 = 0.79177; F[1,20]=76.05; p<0.005; P100 = -18.87x + 118.23; r2 = 0.8813; F[1,20]=148.59; p<0.005 Dashed lines show examples of the expected curves of DRDC-VEP latency. Experimental data showed about 3 times steeper regression slope than the expected: DRDC Latency (ms)= -63.4 x Log L + 292.16; (r2=0.55, F[1,72]=87.82, p<0.01
Our PERG and PVEP data were in accordance with the previous results by Kurita-Tashima, Froehlich, Kaufman, Chiappa and Ropper (Kurita-Tashima et al 1992) (Chiappa and Ropper 1982; Froehlich and Kaufman 1991) .

14. Fig. Mean VEP amplitudes as a function of luminance. Filled circles: DRDC-VEP; Empty circles: PVEP P100 amplitude; Crosses: PERG P50 amplitude. Error bars represent the SEM. Amplitude (P50)=2.54xLogL+1.52; r2=0.57; F[1,20]=26.8; p<0.005; Amplitude (P100)= 3.42xLog L+13.51; r2=0.41; F[1,20]=13.98 p<0.005
CONCLUSION
Our study shows that DRDC-VEP is reliably recordable in a wide contrast and luminance range and shows maximal amplitude even around the treshold of the binocular perception, indicating that this method is highly sensitive and correlating with the binocular percept. DRDC-VEP amplitude is independent of both contrast and luminance. The dimming effect of the filters themselves is not a significant disadvantage of the anaglyphic technique.
The flat CR in our contrast study suggests the contribution of a single contrast-sensitivity mechanism in the generation of DRDC-VEP. Since the high contrast gain and quick saturation of the firing rate at low contrast
are the properties of the MC neurons, the flat CR is likely to be due to the involvement of the MC pathway in the correlation-anticorrelation processing system. This hypothesis is in harmony with the data showing that anticorrelation sensitive cells can be found mostly in the dorsal pathway rather than in the ventral one (Takemura et al 2001) (Tanabe et al 2004). However, we must emphasize that the shared sensitivities of the observed DRDC-VEP and the MC neurons does not establish that the two sensitivities stem from a common pathway. This could be verified by selective lesions of the PC or MC pathways in experimental animals.
Based on our luminance data we hypothesize that a flat luminance-amplitude function curve of DRDC-VEP response found here, similarly to motion-onset VEPs (Kubova et al 2004), may be due to dominant MC input to the binocular correlation processing cortical neuronal network.
There is a significant change in DRDC-VEP phase with reducing contrast suggesting an elongation of neuronal processing time.
Our steeper regression data (i.e., 63 ms/log) on the DRDC-VEP latency as a function of luminance can be explained by the following two ideas: Either there may be a higher level (i.e., cortical) time consuming luminance reduction induced delay (LRID) processing that may reflect some extrastriate luminance processing mechanism or, more probably, the integration of the two-channel visual information (i.e., stochastic spike trains) during the binocular correlation process results in a steeper LRID response. This integration may take place in the primary visual cortex and could be followed in more anterior extrastriate cortical regions (Neill and Fenelon 1988). The steeper LRID could be attributed to the biophysical constraints (e.g. the time constant of the binocular integrating neuron, type of computational algorithm

implemented in the neuronal processing of correlation) determining the correlation process at the neuronal level.
LIST OF PUBLICATIONS
The thesis is based on the following publications: 1. Katalin Markó, Eszter Mikó-Baráth, Huba J Kiss, Béla Török, Gábor Jandó, Effects of luminance on dynamic random dot correlogram evoked VEPs, PERCEPTION (in press) accepted manuscript 7042_ChT, (2012) IF: 1.293 2. Marko K; Kiss HJM; Miko-Barath E; Bartfai O; Torok B; Kovacs I; Jando G, Contrast independence of dynamic random dot correlogram evoked VEP amplitude JOURNAL OF VISION (ISSN: 1534-7362) 9: (4) pp. 1-10. Paper 8. (2009) IF: 3.022 Congress abstracts and posters that can be cited: 1. Katalin Marko, Eszter Miko-Barath, Anna Budai, Timea Dani, Selim Sevinc, Marton Gyenge, Monika Schwoller, Zsuzsanna Pamer, Zsolt Biro, Gabor Jando, Comparison Of Dynamic Random Dot E Stereo Test And Lang II Test: Testability And Reliability In Preschool Children, (poszter), ARVO Annual Meeting, Fort Lauderdale, 2011. május 1-5 2. Mikó-Baráth E; Markó K; Budai A; Dani T; Sevinc S; Gyenge M; Schwoller M; Pamer Z; Bíró Z; Jandó G, Screening of binocular function with static- and dynamic random dot E stereograms in preschool population, (poszter), MITT XIII. konferenciája, Budapest, 2011. január 20-22.
3. Mikó-Baráth E;, Dani T; Sevinç S; Markó K; Kiss H M; Török B; Jandó G, Is binocular enhancement the measure of binocular fusion? (poszter), 7th Forum of Federation of European Neuroscience Societies (FENS) kongresszus, Amsterdam, 2010. július 3-7. 4. Kiss HJ, Miko BE, Markó K, Sevinc S, Kovacs I, Torok B and Jandó G (2009). The examination of visual acuity in preterm and full-term infants. Front. Syst. Neurosci. Conference Abstract: 12th Meeting of the Hungarian Neuroscience Society. doi: 10.3389/conf.neuro.01.2009.04.096 (poszter) MITT Kongresszus, 2009. január 5. Markó K, Kiss H J M, Mikó-Baráth E, Török B, Jandó G, Spatial characteristic of dynamic random dot correlogram evoked visual potentials (poszter) Front. Syst. Neurosci. Conference Abstract: 12th Meeting of the Hungarian Neuroscience Society. doi: 10.3389/conf.neuro.01.2009.04.211 (poszter) MITT Kongresszus, 2009. január 6. Katalin Markó, Orsolya Bártfai, Eszter Mikó-Baráth, Huba Kiss, Ilona Kovács, Béla Török and Gábor Jandó A binokularitás elektrofiziológiai mérése: Az interokuláris késés hatása a dinamikus random pont korrelogram (DRDC) válaszokra (poszter) MITT kongresszus 2007, Szeged 2007.febr. 7. Eszter Mikó-Baráth, Katalin Markó, Katalin Hollódy, Ilona Kovács, Béla Török and Gábor Jandó Utility of visual evoked potential (VEP) in pediatric neurology (poszter) MITT kongresszus 2007, Szeged 2007.febr. 8. Huba Kiss, Eszter Mikó-Baráth, Katalin Markó, Ilona Kovács, Béla Török, Orsolya Bártfai and Gábor

Jandó Effect of luminance on VEP response to dynamic random dot correlogram (DRDC-VEP) (poszter) MITT kongresszus 2007, Szeged 2007.febr. 9. Bártfai O., Markó K., Mikó-Baráth E., Kiss H., Kovács I., Török B. and Jandó G. Electrophysiological measurement of stereopsis is potential screening method for amblyopia: Effects of luminance and interocular delay on VEP response to dynamic random dot correlogram (DRDC) (előadás) In: LXXIst Annual Meeting of the Hungarian Physiological Society June 6–8, 2007, Pécs, Hungary, Acta Physiologica Hungarica 94:(4) pp. 328-329. (2007) 10. Jandó G., Markó K. és Kovács I. Measurement of Stereopsis with Visual Evoked Potential in Adults and Premature Infants (előadás) MITT kongresszus 2005, Pécs 2005. Jan. Ideggyőgyászati szemle/Clinical neuroscience 58:(Suppl. 1) pp. 44-45. (2005)