the dynamics of human behaviour in poker - lirias
TRANSCRIPT

The Dynamics of Human Behaviour in Poker
Marc Ponsen a Karl Tuyls b Steven de Jong a
Jan Ramon c Tom Croonenborghs d Kurt Driessens c
a Universiteit Maastricht, Netherlandsb Technische Universiteit Eindhoven, Netherlands
c Katholieke Universiteit Leuven, Belgiumd Biosciences and Technology Department, KH Kempen University College, Belgium
Abstract
In this paper we investigate the evolutionary dynamics of strategic behaviour in the game of poker bymeans of data gathered from a large number of real-world poker games. We perform this study froman evolutionary game theoretic perspective using the Replicator Dynamics model. We investigate thedynamic properties by studying how players switch between different strategies under different circum-stances, what the basins of attraction of the equilibria look like, and what the stability properties of theattractors are. We illustrate the dynamics using a simplex analysis. Our experimental results confirm ex-isting domain knowledge of the game, namely that certain strategies are clearly inferior while others canbe successful given certain game conditions.
1 IntroductionAlthough the rules of the game of poker are simple, it is a challenging game to master. There exist manybooks written by domain experts on how to play the game (see, e.g., [2, 4, 9]). A general consensus is that awinning poker strategy should be adaptive: a player should change the style of play to prevent becoming toopredictable, but moreover, the player should adapt the game strategy based on the opponents. In the lattercase, players may want to vary their actions during a specific game, but they can also consider changingtheir overall game strategy over a series of games (e.g., play a more aggressive or defensive style of poker).
Although some studies exist on modeling poker players and providing a best-response given the oppo-nent model (see, e.g., [1, 8, 10]), not much research focuses on overall strategy selection. In this paperwe address this issue by investigating the evolutionary dynamics of strategic player behaviour in the gameof poker. We perform this study from an evolutionary game-theoretic perspective using the Replicator Dy-namics (RD) [5, 6, 11, 12]. More precisely, we investigate the dynamic properties by studying how playersswitch between different strategies (based on the principle of selection of the fittest), under different cir-cumstances, what the basins of attraction of the equilibria look like, and what the stability properties of theattractors are.
A complicating factor is that the RD can only be applied straightforwardly to simple normal form gamesas for instance the Prisoner’s Dilemma game [3]. Applying the RD to poker by assembling the differentactions in the different phases of the game for each player will not work, because this leads to an overlycomplex table with too many dimensions. To address this problem, overall strategies (i.e., behaviour over aseries of games, henceforth referred to as meta strategies) of players may be considered. Using these metastrategies, a heuristic payoff table can then be created that enables us to apply different RD models andperform our analysis. This approach has been used before in the analysis of behaviour of buyers and sellersin automated auctions [7, 13, 14]. Conveniently, for the game of poker several meta strategies are alreadydefined in literature. This allows us to apply RD to the game of poker. An important difference with previouswork, is that we use real-world poker games from which the heuristic payoff table is derived, as opposed tothe artificial data used in the auction studies. We observed poker games played on a poker website, in whichhuman players competed for real money at various stakes.

Therefore, the contributions of this paper are twofold. First, we provide new insights in the dynamicsof strategic behaviour in the complex game of poker using RD models. These insights may prove usefulfor strategy selection by human players but can also aid in creating strong artificial poker players. Second,unlike other studies, we apply RD models to real-world human data.
The remainder of this paper is structured as follows. We start by explaining the poker variant we focuson in our research, namely No-Limit Texas Hold’em poker, and describe some well-known meta strate-gies for this game. Next we elaborate on the Replicator Dynamics and continue with a description of ourmethodology. We end with experiments and a conclusion.
2 BackgroundIn this section we will first briefly explain the rules of the game of poker. Then we will discuss metastrategies as defined by domain experts.
2.1 PokerPoker is a card game played between at least two players. In a nutshell, the object of the game is to wingames (and consequently win money) by either having the best card combination at the end of the game,or by being the only active player. The game includes several betting rounds wherein players are allowedto invest money. Players can remain active by at least matching the largest investment made by any of theplayers, or they can choose to fold (i.e., stop investing money and forfeit the game). In the case that onlyone active player remains, i.e., all other players chose to fold, the active player automatically wins the game.The winner receives the money invested by all the players.
In this paper we focus on the most popular poker variant, namely No-Limit Texas Hold’em. This gameincludes 4 betting rounds (or phases), respectively called the pre-flop, flop, turn and river phase. During thefirst betting round, all players are dealt two private cards (what we will now refer to as a player’s hand) thatare only known to that specific player. To encourage betting, two players are obliged to invest a small amountthe first round (the so-called small- and big-blind). One by one, the players can decide whether or not theywant to participate in this game. If they indeed want to participate, they have to invest at least the currentbet. This is known as calling. Players may also decide to raise the bet. If they do not wish to participate,players fold, resulting in possible loss of money they bet thus far. During the remaining three betting phases,the same procedure is followed. In every phase, community cards appear on the table (respectively 3 inthe flop phase, and 1 in the other phases). These cards apply to all the players and are used to determinethe card combinations (e.g., a pair or three-of-a-kind may be formed from the player’s private cards and thecommunity cards).
2.2 Meta strategiesThere exists a lot of literature on winning poker strategies, mostly written by domain experts (see, e.g.,[2, 4, 9]). These poker strategies may describe how to best react in detailed situations in a poker game, butalso how to behave over large numbers of games. Typically, experts describe these so-called meta strategiesbased on only a few features. For example, an important feature in describing a player’s meta strategy is thepercentage of times this player voluntarily sees the flop (henceforth abbreviated as VSF ), since this maygive insight in the player’s hand selection. If a particular player chooses to play more than, let’s say, 40% ofthe games, he or she may play with less quality hands (see [9] for hand categorization) compared to playersthat only see the flop rarely. The standard terminology used for respectively the first approach is a looseand for the latter a tight strategy. Another important feature is the so-called aggression-factor of a player(henceforth abbreviated as AGR). The aggression-factor illustrates whether a player plays offensively (i.e.,bets and raises often), or defensively (i.e., calls often). This aggression factor is calculated as:
%bet + %raise%calls
A player with a low aggression-factor is called passive, while a player with a high aggression-factor is simplycalled aggressive. The thresholds for these features can vary depending on the game context. Taking into
account these two features, we can construct four meta strategies, namely: 1) loose-passive (LP), 2) loose-aggressive (LA), 3) tight-passive (TP), and 4) tight-aggressive (TA). Again note that these meta-strategiesare derived from poker literature.
Experts argue that the TA strategy is the most profitable strategy, since it combines patience (waitingfor quality hands) with aggression after the flop. One could already claim that any aggressive strategydominates all passive strategies, simply by looking at the rules of the poker game. Note that games can bewon by having the best card combination, but also by betting all opponents out of the pot. However, mostpoker literature will argue that adapting a playing style is the most important feature of any winning pokerstrategy. This applies to detailed poker situations, i.e., varying actions based on current opponent(s), but alsovarying playing style on a broader scale (e.g., switching from meta strategy). We will next investigate howplayers (should) switch between meta strategies in the game of No-Limit Texas Hold’em poker.
3 MethodologyIn this section we concisely explain the methodology we will follow to perform our analysis. We start byexplaining Replicator Dynamics (RD) and the heuristic payoff table that is used to derive average payoffsfor the various meta strategies. Then we explain how we approximate the Nash equilibria of interactionsbetween the various meta strategies. Finally, we elucidate our algorithm for visualizing and analyzing thedynamics of the different meta strategies in a simplex plot.
3.1 Replicator DynamicsThe RD [11, 16] are a system of differential equations describing how a population of strategies evolvesthrough time. The RD presumes a number of agents (i.e., individuals) in a population, where each agent isprogrammed to play a pure strategy. Hence, we obtain a certain mixed population state x, where xi denotesthe population share of agents playing strategy i. Each time step, the population shares for all strategiesare changed based on the population state and the rewards in a payoff table. Note that single actions aretypically considered in this context, but in our study we look at meta strategies.
An abstraction of an evolutionary process usually combines two basic elements, i.e., selection and mu-tation. Selection favors some population strategies over others, while mutation provides variety in the pop-ulation. In this research, we will limit our analysis to the basic RD model based solely on selection of themost fit strategies in a population. Equation 1 represents this form of RD.
dxi
dt= [(Ax)i − x ·Ax] xi (1)
In Equation 1, the state x of the population can be described as a probability vector x = (x1, x2, ..., xn)which expresses the different densities of all the different types of replicators (i.e., strategies) in the popu-lation, with xi representing the density of replicator i. A is the payoff matrix that describes the differentpayoff values that each individual replicator receives when interacting with other replicators in the popu-lation. Hence (Ax)i is the payoff that replicator i receives in a population with state x, whereas x · Axdescribes the average payoff in the population. The growth rate dxi
dt /xi of the proportion of replicator i inthe population equals the difference between the replicator’s current payoff and the average payoff in thepopulation. For more information, we refer to [3, 5, 15].
3.2 The Heuristic Payoff TableThe heuristic payoff table represents the payoff table of the poker game for the different meta strategiesthe different agents can employ. In essence it replaces the Normal Form Game (NFG) payoff table for theatomic actions. For a complex game such as poker it is impossible to use the atomic NFG, simply becausethe table has too many dimensions to be able to represent it. Therefore, we look at heuristic strategies asoutlined in Section 2.2.
Let’s assume we have A agents and S strategies. This would require SA entries in our NFG table. Wenow make a few simplifications, i.e., we do not consider different types of agents, we assume all agents canchoose from the same strategy set and all agents receive the same payoff for being in the same situation. Thissetting corresponds to the setting of a symmetric game. This means we consider a game where the payoffsfor playing a particular strategy depend only on the strategies employed by the other agents, but not on who

is playing them. Under this assumption we can seriously reduce the number of entries in the heuristic payofftable. More precisely, we need to consider the different ways of dividing our A agents over all possible Sstrategies. This boils down to: (
A + S − 1A
)Suppose we consider 3 heuristic strategies and 6 agents, this leads to a payoff table of 28 entries, which isa serious reduction from 36 = 729 entries in the general case. As an example the next table illustrates whatthe heuristic payoff table looks like for three strategies S1, S2 and S3.
P =
S1 S2 S3 U1 U2 U3
s1 s2 s3 u1 u2 u3
... ...
Consider for instance the first row of this table: in this row there are s1 agents that play strategy S1, s2 agentsthat play strategy S2 and s3 agents play strategy S3. Furthermore, ui is the respective expected payoff forplaying strategy Si. We call a tuple (s1, s2, s3, u1, u2, u3) a profile of the game. To determine the payoffs ui
in the table, we compute expected payoffs for each profile from real-world poker data we assembled. Moreprecisely, we look in the data for the appearance of each profile and compute from these data points theexpected payoff for the used strategies. However, because payoff in the game of poker is non-deterministic,we need a significant number of independent games to be able to compute representative values for our tableentries. In Section 4 we provide more details on the data we used and on the process of computing the payofftable.
3.3 Approximating Nash EquilibriaIn this section we describe how we can determine which of our restpoints of the RD are effectively Nashequilibria (so note that a restpoint of the RD is not necessarily Nash). The approach we describe is based onwork of Walsh et al. and Vytelyngum et al. [13, 14]. An Nash equilibria occurs when no player can increaseits payoff by changing strategy unilaterally. For the sake of clarity we follow the notation of [14].
The expected payoff of an agent playing a strategy j ∈ S 1, given a mixed-strategy p (the populationstate), is denoted as u(ej , p). This corresponds to (Ax)i in Equation 1. The value of u(ej , p) can becomputed by considering the results from a large number of poker games with a player playing strategy jand the other agents selected from the population, with a mixed-strategy p. For each game and every strategy,the individual payoffs of agents using strategy j are averaged. The Nash equilibrium is then approximatedas the argument to the minimisation problem given in Equations 2 and 3.
v(p) =S∑
j=1
(max[u(ej , p)− u(p, p), 0])2 (2)
pnash = argminp[v(p)] (3)
Here, u(p, p) is the average payoff of the entire population and corresponds with term x · Ax of Equation1. Specifically, pnash is a Nash equilibrium if and only if it is a global minimum of v(p), and p is aglobal minimum if v(p) = 0. We solve this non-linear minimisation problem using the Amoeba non-linearoptimiser [14].
3.4 Simplex AnalysisThe simplex analysis allows us to graphically and analytically study the dynamics of strategy changes.Before explaining this analysis, we first introduce a definition of a simplex. Given n elements which arerandomly chosen with probabilities (x1, x2, . . . , xn), there holds x1, x2, . . . , xn ≥ 0 and
∑ni=1 xi = 1. We
denote the set of all such probability distributions over n elements as Σn or simply Σ if there is no confusionpossible. Σn is a (n − 1)-dimensional structure and is called a simplex. One degree of freedom is lostdue to the normality constraint. For example in Figure 1, Σ2 and Σ3 are shown. In the figures throughoutthe experiments we use Σ3, projected as an equilateral triangle as in Figure 1(b), but we drop the axes and
1The use of S differs from that in Section 3.2. Here S represents the set of strategies, unlike the number of strategies in Section 3.2.

x1
x2
0 1
1
(a) Σ2
x1 x2
x3
0
1 1
1
(b) Σ3
Figure 1: The unit simplices Σ2 (a; left) and Σ3 (b; right).
labels. Since we use four meta strategies and Σ3 concerns only three, this implies that we need to show foursimplexes Σ3, from each of which one strategy is missing.
Using the generated heuristic payoff table, we can now visualize the dynamics of the different agentsin a simplex as follows. To calculate the RD at any point s = (x1, x2, x3) in our simplex, we considerN (i.e., many) runs with mixed-strategy s; x1 is the percentage of the population playing strategy S1, x2
is the percentage playing strategy S2 and x3 is is the percentage playing strategy S3. For each run, eachpoker agent selects their (pure) strategy based on this mixed-strategy. Given the number of players using thedifferent strategies (S1, S2, S3), we have a particular profile for each run. This profile can be looked up inour table, yielding a specific payoff for each player. The average of the payoffs of each of these N profilesgives the payoffs at s = (x1, x2, x3). Provided with these payoffs we can easily compute the RD by fillingin the values of the different variables in Equation 1. This yields us a gradient at the point s = (x1, x2, x3).
Starting from a particular point within the simplex, we can now generate a smooth trajectory (consistingof a piecewise linear curve) by moving a small distance in the calculated direction, until the trajectory reachesan equilibrium. A trajectory does not necessarily settle at a fixed point. More precisely, an equilibrium towhich trajectories converge and settle is known as an attractor, while a saddle point is an unstable equilibriumat which trajectories do not settle. Attractors and saddle points are very useful measures of how likely it isthat a population converges to a specific equilibrium.
4 Experiments and resultsWe collected a total of 1599057 No-Limit Texas Hold’em games with 6 or more players starting. As a firststep we needed to determine the strategy for a player at any given point. If a player played less than 50games in total, we argue that we do not have sufficient data to establish a strategy, and therefore we ignorethis player (and game). If the player played at least 50 games, we used an interval of 50 games to collectstatistics for this specific player, and then determined the VSF and AGR values. We set the thresholdsrespectively to 0.35 and 2.0, i.e., if VSF > 0.35, then the player is considered loose (and tight otherwise),and if AGR > 2 then the player is considered aggressive (and passive otherwise). These are commonlyused thresholds for a No-Limit Texas Hold’em game (see e.g., [2, 4, 9]). The resulting strategy was thenassociated with the specific player for all games in the interval of 50 games. Having estimated all players’strategies, it is now possible to determine the table configuration (i.e., the number of players playing any ofthe four meta strategies) for all games. Finally, we can compute the average payoffs for all strategies givena particular table configuration and produce a profile (see Section 3.2).
We plotted four simplexes that resulted from our RD analysis in Figure 2. Recall from Section 3.4that these simplexes show the dynamic behavior of the participating players having a choice from threestrategies. This means that the evolution of the strategies, employed in the population, is visualized forevery possible initial condition of the game. The initial condition determines in which basin of attractionwe end up, leading to some specific attractor or repeller. These restpoints (i.e. attractors or repellers) arepotentially Nash equilibria.
What we can immediately see from the plots is that both passive strategies LP and TP (except in plot a)are repellers. In particular the LP strategy is a strong repeller. This suggests that no matter what the gamesituation is, when playing the LP strategy, it is always rational to switch strategy to for example TA or LA.

(a) (b)
(c) (d)
Figure 2: The direction field of the RD using the heuristic payoff table considering the four described meta-strategies. Dots represent the Nash equilbria.
This nicely confirms the claim made earlier (and in literature), namely that aggressive strategies dominatetheir passive counterparts.
The dots indicated on the plots represent the Nash equilibria of the respective games2. Figure 2a containsthree Nash equilibria of which two are mixed and one is pure. The mixed equilibrium at the axis TP-LP isevolutionarily unstable as a small deviation in a players’ strategy might lead the dynamics away from thisequilibrium to one of the others. The mixed equilibrium at the axis LP-TA is stable. As one can see thisequilibrium lies close to the pure strategy TA. This means that TA is played with a higher probability thanLP. Finally, there is also one stable pure equilibrium present, i.e., TP. Of the stable equilibria TP has thelargest basin of attraction.
Figure 2b contains 3 Nash equilibria of which one is mixed and two are pure. As one can see from thepicture, the mixed Nash equilibrium is evolutionarily unstable, i.e., any small perturbation of this equilibriumimmediately leads the dynamics away from it to one of the other pure Nash equilibria. This means that ifone of the players would decide to slightly change its strategy at the equilibrium point, the dynamics of theentire population would drastically change. The mixed Nash equilibrium almost corresponds to the situationin which the three strategies are played with equal probability, i.e., a uniform distribution. The pure Nashequilibria LA and TA are both evolutionarily stable. LA has a larger basin of attraction than TA (similar toplot a), which does not completely correspond with the expectations of domain experts (it is assumed by
2Due to space constraints we only discuss the Nash equilibria of Figures 2a-2b and Figures 3a-3b. For completeness the equilibriaof Figures 2c and 2d are also indicated.
(a) (b)
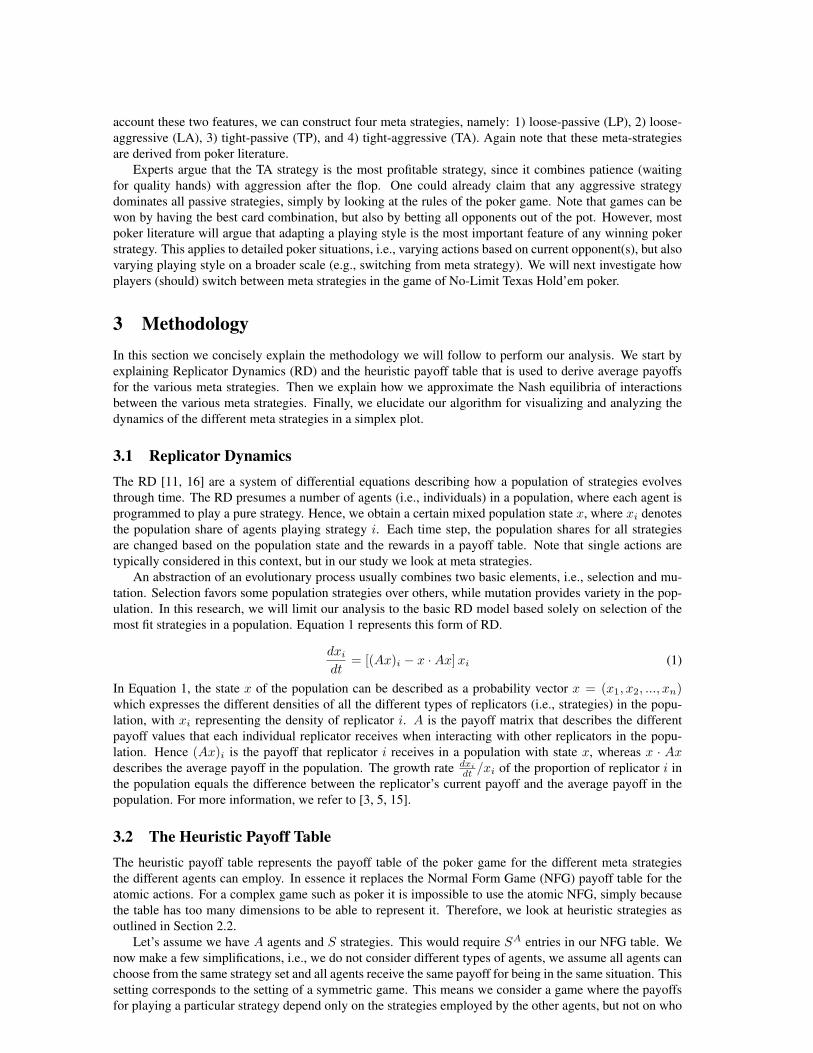
Figure 3: The direction field of the RD using the heuristic payoff table using data of games with activeplayers at the flop.
domain experts that in general TA is the most profitable strategy).One possible explanation is the following: we noticed that some strategies (depending on the used
thresholds for VSF and AGR) are less played by humans compared to other strategies. Therefore, a tableconfiguration with a large number of agents playing these scarcely played strategies, results in few instancesand possibly a distorted average payoff due to the high variance of profits in the game of No-Limit TexasHold’em. In particular, we observed that table configurations with many humans playing a tight strategy hadonly few instances (e.g., the payoffs used in plot a, with two tight strategies in the simplex, were calculatedusing 40% less instances compared to those in plot b). A severe constraint on the number of instances iscurrently our chosen representation for a profile. In the previous experiment, we used games with 6 ormore starting players, and counted the number of occurrences of the four strategies. An alternative wayof interpreting the data is only considering players active at the flop. Since most of the times only 4 orless players (and a maximum of 6 players in our data) are active at the flop, this results in fewer profiles.Basically, we generalize over the number of players starting at the beginning of the game and only focuson the interaction between strategies during the phases that most influence the average payoffs. The resultsfrom these experiments are illustrated in Figure 3.
In Figure 3a and 3b we have one pure Nash equilibrium being a dominant strategy, i.e., TA. Theseequilibria, and the evolution to them from any arbitrary initial condition, confirm the conclusions of domainexperts.
5 ConclusionIn this paper we investigated the evolutionary dynamics of strategic behaviour of players in the game of No-Limit Texas Hold’em poker. We performed this study from an evolutionary game theoretic perspective usingReplicator Dynamic models. We investigated the dynamic properties by studying how human players shouldswitch between different strategies under different circumstances, and what the Nash equilibria look like.We observed poker games played at an online poker site and used this data for our analysis. Based on domainknowledge, we identified four distinct meta strategies in the game of poker. We then computed the heuristicpayoff table to which we applied the Replicator Dynamic model. The resulting plots confirm that what isclaimed by domain experts, namely that often aggressive strategies dominate their passive counterparts, andthat the Loose-Passive strategy is an inferior one.
For future work, we will examine the interactions between the meta strategies among several other di-mensions, namely, more detailed meta strategies (i.e., based on more features), a varying number of players,different parameter settings and different Replicator Dynamic models (e.g., including mutation). We arealso interested in performing this study using simulated data (which we can generate much faster). Finally,since it is clear from our current experiments that the Loose-Passive strategy is an inferior one, we can focus
on the switching dynamics between the remaining strategies given the presence of a fixed number of playersplaying the Loose-Passive strategy. This way, we focus on the dynamics for the strategies that matter.
6 AcknowledgmentsMarc Ponsen is sponsored by the Interactive Collaborative Information Systems (ICIS) project, supportedby the Dutch Ministry of Economic Affairs, grant nr: BSIK03024. Jan Ramon and Kurt Driessens are post-doctoral fellow of the Research Foundation - Flanders (FWO). The authors wish to express their gratitudeto P. Vytelingum for his insightful comments on the construction of the heurisitic payoff table.
References[1] A. Davidson, D. Billings, J. Schaeffer, and D. Szafron. Improved opponent modeling in poker. In
Proceedings of The 2000 International Conference on Artificial Intelligence (ICAI’2000), pages 1467–1473, 2000.
[2] D. Doyle Brunson. Doyle Brunson’s Super System: A Course in Power Poker. Cardoza, 1979.
[3] H. Gintis. Game Theory Evolving: A Problem-Centered Introduction to Modeling Strategic Interaction.Princeton University Press, 2001.
[4] D. Harrington. Harrington on Hold’em Expert Strategy for No Limit Tournaments. Two Plus TwoPublisher, 2004.
[5] J. Hofbauer and K. Sigmund. Evolutionary Games and Population Dynamics. Cambridge UniversityPress, 1998.
[6] J. Maynard-Smith. Evolution and the Theory of Games. Cambridge University Press, 1982.
[7] S. Phelps, S. Parsons, and P. McBurney. Automated trading agents versus virtual humans: an evolu-tionary game-theoretic comparison of two double-auction market designs. In Proceedings of the 6thWorkshop on Agent-Mediated Electronic Commerce, New York, NY, 2004.
[8] M. Ponsen, J. Ramon, T. Croonenborghs, K. Driessens, and K. Tuyls. Bayes-relational learning ofopponent models from incomplete information in no-limit poker. In Twenty-third Conference of the As-sociation for the Advancement of Artificial Intelligence (AAAI-08), pages 1485–1487, Chicago, USA,2008.
[9] D. Slansky. The Theory of Poker. Two Plus Two Publisher, 1987.
[10] F. Southey, M. Bowling, B. Larson, C. Piccione, N. Burch, D. Billings, and D. C. Rayner. Bayes’bluff: Opponent modelling in poker. In Proceedings of the 21st Conference in Uncertainty in ArtificialIntelligence (UAI ’05), pages 550–558, 2005.
[11] P. Taylor and L. Jonker. Evolutionary stable strategies and game dynamics. Math. Biosci., 40:145–156,1978.
[12] K. Tuyls, P. ’t Hoen, and B. Vanschoenwinkel. An evolutionary dynamical analysis of multi-agentlearning in iterated games. The Journal of Autonomous Agents and Multi-Agent Systems, 12:115–153,2006.
[13] P. Vytelingum, D. Cliff, and N. R. Jennings. Analysing buyers and sellers strategic interactions inmarketplaces: an evolutionary game theoretic approach. In Proc. 9th Int. Workshop on Agent-MediatedElectronic Commerce, Hawaii, USA, 2007.
[14] W. E. Walsh, R. Das, G. Tesauro, and J. O. Kephart. Analyzing complex strategic interactions in multi-agent systems. In P. Gymtrasiwicz and S. Parsons, editors, Proceedings of the 4th Workshop on GameTheoretic and Decision Theoretic Agents, 2001.
[15] J. W. Weibull. Evolutionary Game Theory. MIT Press, 1996.
[16] E. Zeeman. Dynamics of the evolution of animal conflicts. Journal of Theoretical Biology, 89:249–270, 1981.